Sample Category Title
USDJPY Wave Analysis
- USDJPY reversed from key support level 147.55
- Likely to rise to resistance level 152.00,
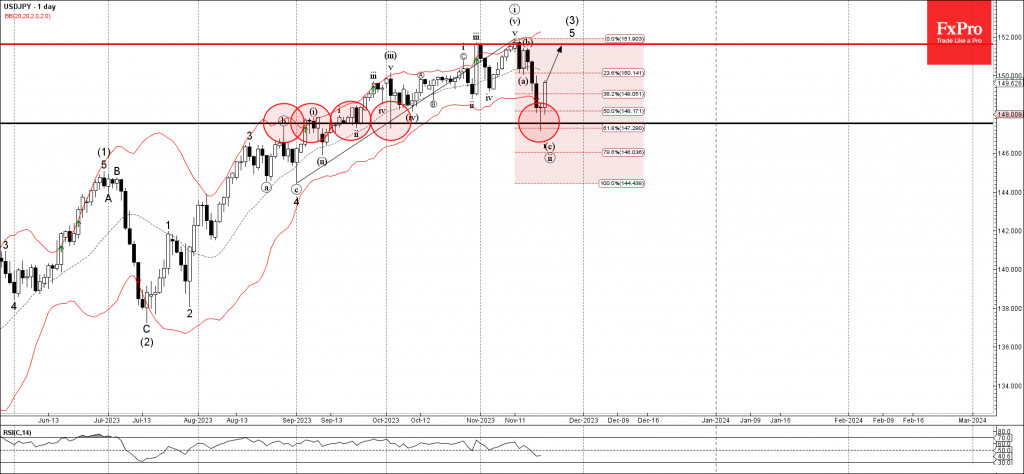
USDJPY currency pair recently reversed up from the key support level 147.55 (which has been supporting the price from September) intersecting with the 61.8% Fibonacci correction of the upward impulse from August.
The upward reversal from the support level 147.55 is currently forming the daily Morning Star candlesticks reversal pattern, which stopped the earlier minor correction ii.
Given the predominant daily uptrend, USDJPY currency pair can be expected to rise further to the next resistance level 152.00, which stopped the previous waves iii and i.
EURCHF Wave Analysis
- EURCHF reversed from resistance level 0.9670
- Likely to fall to support level 0.9600
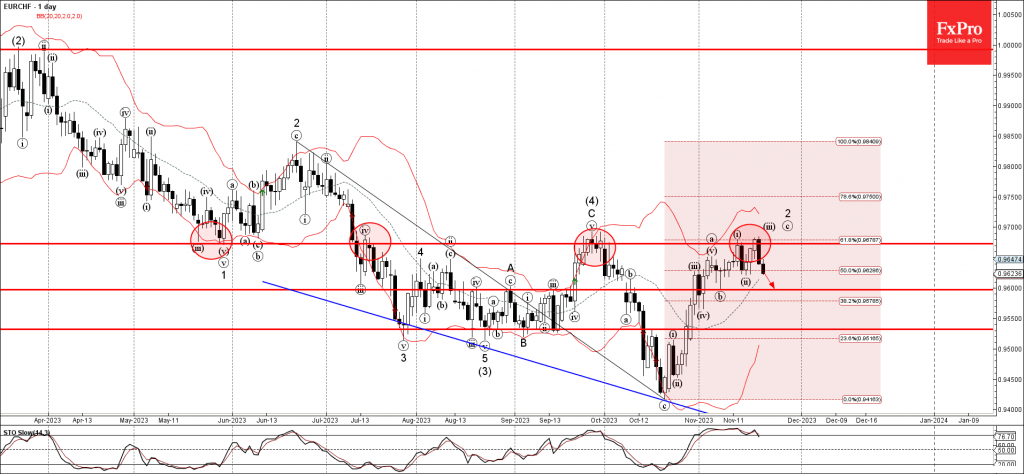
EURCHF currency pair recently reversed down from the strong resistance level 0.9670 (former strong support from May, which has been repeatedly reversing the pair from July) intersecting with the 61.8% Fibonacci correction of the downward impulse from June
The downward reversal from the resistance level 0.9670 created the daily Evening Star, which stopped the earlier correction 2.
Given the clear daily downtrend, EURCHF currency pair can be expected to fall further to the next support level 0.9600, low of the previous correction b.
Does Santa Claus Rally Really Exist?
- US equities exhibit a strongly positive year-end performance post-Thanksgiving
- FX pairs do not follow a specific pattern in the examined period
- Gold and USDJPY rally every time the Thanksgiving holiday falls on November 23
We are nearing the end of another trading year and the newswires are crammed with stories about the famous Santa Claus rally. In a nutshell, the market believes that risky assets tend to rally towards the end of the year. Most analysts calculate the assets’ performance during the last five trading days of the year and the first two of the new year when analysing this “phenomenon”. However, others are confident that this rally tends to start after the annual Thanksgiving holiday.
Consequently, we decided to have a look at the performance of the main tradable assets for the period between the Thanksgiving holiday and the last trading day of the year. We selected 1991 as our starting year, not for the lack of data but because we feel that this timeframe is a closer match to current market conditions.
S&P 500 index sends the strongest message
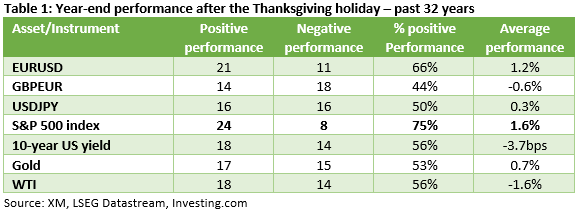
Table 1 below presents our findings for the 32 years of market data examined. After a quick glance, one can see that there is no widespread rally at the instruments in question. However, there are some interesting results. The S&P 500 index is sending the strongest message as it has managed to finish the year in the green in 75% of the periods examined, i.e. 24 years, with an respectable average gain of 1.6% achieved. Regarding the FX world, only EURUSD tends to exhibit a pattern with 66% of the years ending on a positive note and recording a decent return of 1.2% on average.
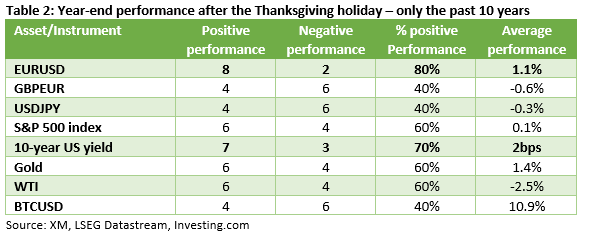
When focusing only on the past 10 years, the results somewhat change. More specifically, EURUSD tends to rally after the Thanksgiving holiday with an average gain of 1.1%. The 10-year US yield exhibits a similar score, but the average yield increase is just 2bps, which is rather miniscule for its standards. We have also included BTCUSD (Bitcoin) in Table 2 below, but the results do not really confirm the Santa Claus rally, despite the 10.9% average rally.
What happens in the pre-election years?
We could not complete our analysis without the main 2024 event: the US election held in November. Such a major event affects investment decisions long before the actual election date as market participants prepare for the next administration. Therefore, we examined the year-end performance of key assets, after the Thanksgiving holiday, in the eight pre-elections years appearing in our data. Interestingly, only the performance of the S&P500 index stands out. Except for 2015, this index tends to end the year positively with an average gain of 4.3% registered.
What happens when the Thanksgiving holiday falls on November 23?
Our final step was to examine the performance of these assets when the Thanksgiving holiday falls on November 23, like in 2023. We found four instances in the 1991-2022 period when this occurred: in 1995, 2000, 2006 and 2017. A smaller sample to play with but we have two assets, gold and USDJPY, rallying in these four periods. Gold is seen gaining 1.3% on average, while USDJPY tends to climb by 2.4%.
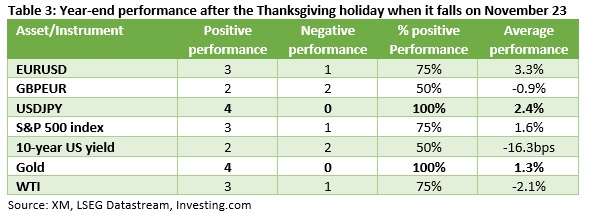
To sum up, the market appears to be gearing up for a Santa Claus rally and, according to our findings, the S&P500 index tends to confirm this expectation when examining the 32 years of data. Drilling down to just the past 10 years, EURUSD exhibits a strong tendency to rally into year-end. Finally, when the Thanksgiving holiday falls on November 23, USDJPY and gold appear to enjoy a strong upleg by the end of the trading year.
WTI Oil Price Tumbles on OPEC News
WTI oil price was sharply down on Wednesday (4.1% until early US session), deflated by the news that OPEC+ group delayed their meeting scheduled for Nov 26 to Nov 30.
The cartel is widely expected to extend its supply cut into next year, but there are also speculations that world biggest oil producers may deepen cuts, as the outlook for global demand remains gloomy.
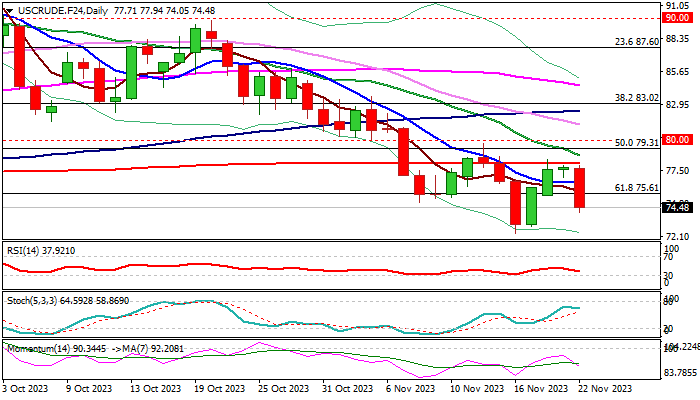
Fresh weakness further weakened the picture on daily chart, as bull-trap above 200DMA was initial negative signal, boosted by today’s strong bearish acceleration which retraced over 61.8% of $77.36/$78.44 upleg and signaling that recovery phase is likely over.
Daily MA’s returned to full bearish configuration and 14-d momentum fell deeper into negative territory, contributing to threats of retesting Nov 16 multi-month low ($72.36) loss of which would signal continuation of larger downtrend from $95.00 (2023 high).
Broken Fibo 61.8% ($75.61) reverted to initial resistance, followed by 10DMA ($76.54), with 200DMA ($78.06) being a game changer.
Res: 75.61; 76.51; 78.06; 78.78.
Sup: 74.05; 73.57; 72.89; 72.36.
Sunset Market Commentary
Markets
European markets this morning kept a soft approach. Lower yields at that time still were the path of least resistance. Eco data were few. The ECB in its financial stability report warned that stability in the euro area remains fragile as tighter financial conditions are testing the resilience of euro area firms, households and sovereigns. Financial markets and non-banks are vulnerable to adverse macro-economic surprises. For now higher rates underpinned bank profitability, but worsening asset quality and higher funding costs pose headwinds. In this respect, macroprudential policies should help to maintain resilience of the financial systems. The ECB also warned that it is key for the European Union to bring clarity on new fiscal rules as this is important to reduce uncertainty. The report didn’t bring any new guidance on monetary policy, but markets maybe saw growing risks as a potential reason for the ECB to take a more cautious approach going forward. Whatever the reason, German yields ceded up to 5 bps at the long end of the curve. Bond market momentum slowed after the publication of the US data. Weekly jobless claims again reversed an uptick over the previous weeks returning to 209k from 233k. October durable goods orders (-5.4%) dropped slightly more than expected after a strong September print, but core measures and shipments as expected stabilized. Still US yields reversed part of an earlier decline and currently show intraday changes between +1.5 bps (2-y) and -2.5 bp(30-y). The US 10-y yield is nearing the 4.34% support (38% retracement April-Oct rebound, currently 4.375). US data also temporary blocked the rally in Bunds, but German yields currently trade between 0.5 bps (2-y) and 5 bps (30-y) lower. The German 10-y yield came close to the 2.5% barrier, but a real test was avoided (currently 2.53%), at least for now. After a pause earlier this week, European equities resume their rebound (EuroStoxx 50 +0.6%). US indices also open in positive territory (S&P +0,6%). However volumes might decline as US investors look forward to the Thanksgiving Holiday/a Black Friday long weekend. Oil tumbled sharply lower from the $82.5/b area (Brent) to currently trade near $79/b as OPEC+ delayed meetings for this weekend (cf infra).
On FX markets, the dollar rebounded despite a constructive risk sentiment and some easing of geopolitical tensions (short truce in the Israel-Hamas conflict). DXY trades near 104 (from about 103.6). EUR/USD struggles to hold near the 1.09 big figure (1.089). USD/JPY extends yesterday’s turn north trading at 149.3 from 148.40. EUR/GBP is going nowhere, hovering near the 0.87 big figure. UK finance minister Hunt in his Autumn Statement, amongst others, announced an 2ppt cut in the rate of contributions of employees to the National Security system and made incentives for business investment permanent, which the government says can increase investment by £20bn/year. Even so, the 2024 growth outlook was reduced to 0.7% from 1.8% in the OBR march forecast.
News & Views
OPEC+ announced that it will postpone its Joint Ministerial Monitoring Committee (JMMC) from 25 and 26 November to Thursday 30 November. Rumours suggest growing disagreement over Saudi-led production cuts. That was already the case for several African nations at the previous ministerial meeting in June. Russian deputy PM Novak today said that current oil prices are at a fairly good level. Saudi Arabia on the other hand is looking for higher prices to compensate for weaker global demand. OPEC+ members need to be careful not to misread the Saudi reaction function. It’s in their own interest that the Kingdom doesn’t return to full capacity. Brent crude prices faced a big setback today over the growing unease between OPEC+ member with price/barrel dropping by $3 to $79.
Polish consumer confidence improved further from -17.9 to -15.1 and extending the run of consecutive increases to 11 months. The indicator stands at its best level since September 2021. Both the current assessment and 12 months forward looking component improved for financial conditions and for the general economic situation in Poland. October retail sales at constant prices rose by 2.8% Y/Y (from 0.7% in October and vs 1.7% forecast). In the period January-October 2023 sales decreased by 2.6% vs 6% growth in 2022. The Polish zloty holds strong below the previous YTD low at 4.40 broken last week. Current levels around 4.36 were last seen early 2020.
USD/CHF Mid-Day Outlook
Daily Pivots: (S1) 0.8821; (P) 0.8836; (R1) 0.8853; More....
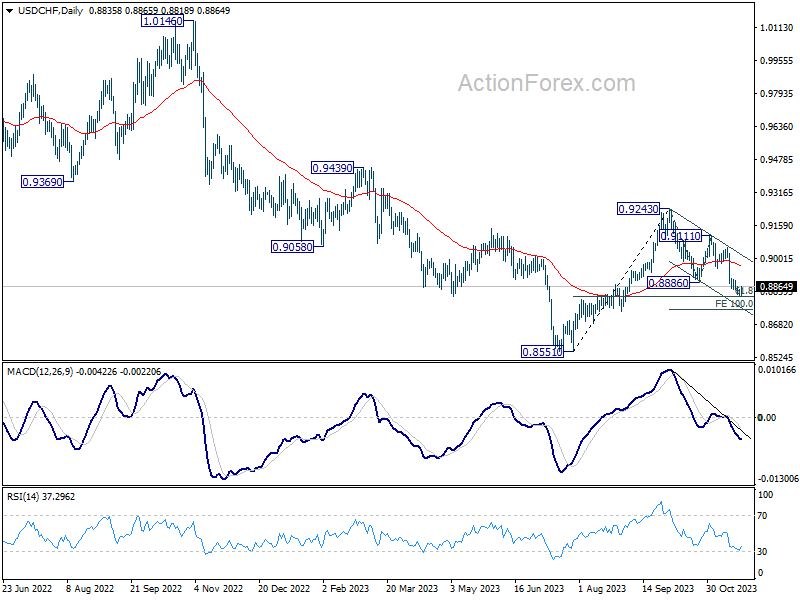
A temporary low is formed at 0.8818 with current recovery. Intraday bias in USD/CHF is turned neutral for consolidations. Near term outlook will stay bearish as long as 0.8952 support turned resistance holds. On the downside, below 0.8818 will resume whole decline from 0.9243 to 100% projection of 0.9243 to 0.8886 from 0.9111 at 0.8754 next.
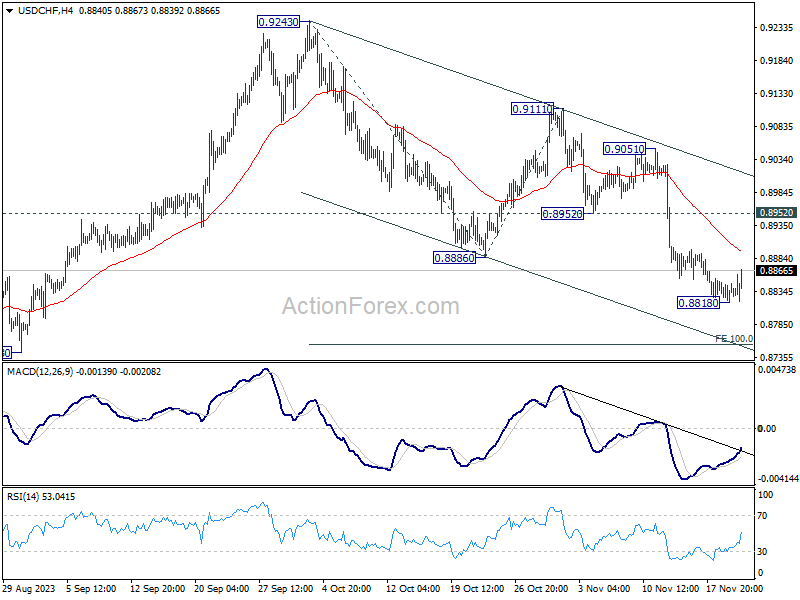
In the bigger picture, price actions from 0.8551 are currently seen as part of a corrective pattern to the decline from 1.0146 (2022 high). Fall from 0.9243 is seen as the second leg for now. Deeper fall would be seen to 61.8% retracement of 0.8551 to 0.9243 at 0.8815. Sustained break there will bring retest of 0.8551 low. For now, this will remain the favored case as long as 0.9111 resistance holds.
USD/JPY Mid-Day Outlook
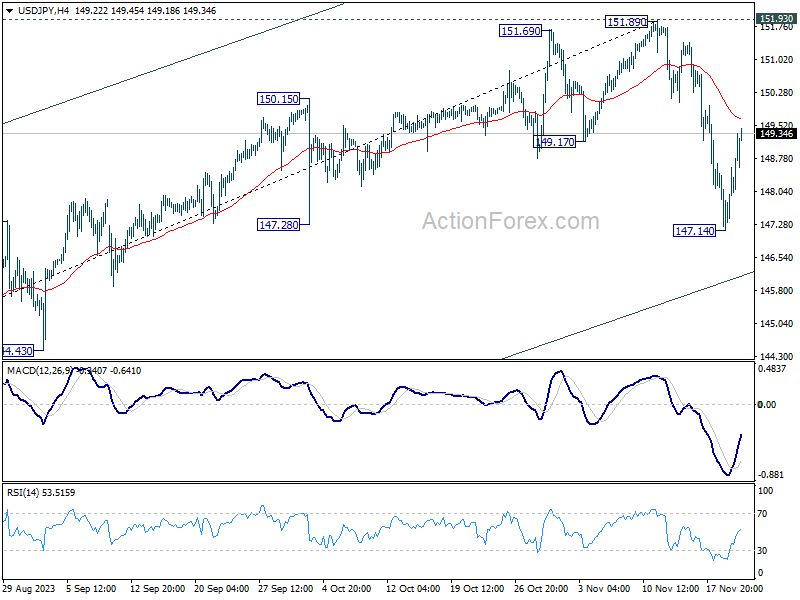
Daily Pivots: (S1) 147.51; (P) 148.05; (R1) 148.94; More...
USD/JPY's recovery from 147.14 extends higher, but risk will stay on the downside as long as 55 4H EMA (now at 149.68 holds. Below 147.14 will target medium term channel support at 146.00 next. Nevertheless, sustained break of 55 4H EMA will revive near term bullishness, and target a retest on 151.89/93 resistance zone.
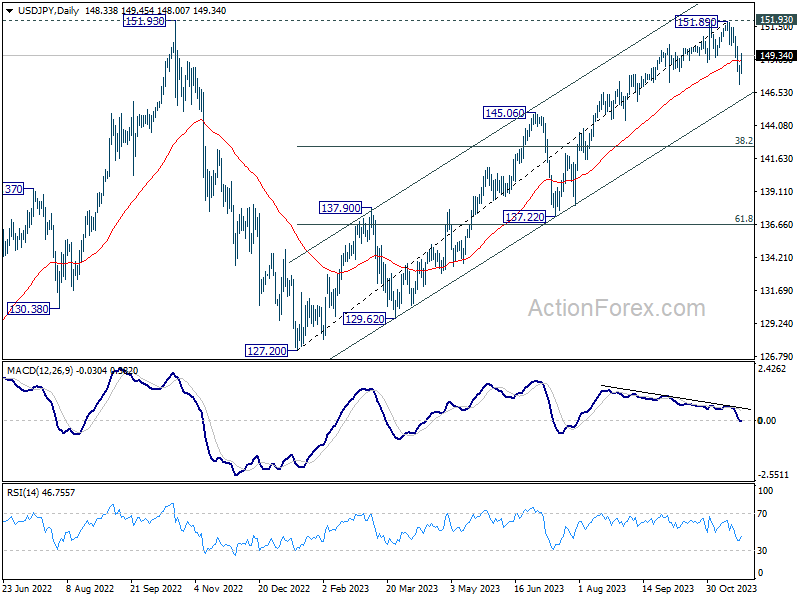
In the bigger picture, rise from 127.20 (2023 low) is seen as the second leg of the pattern from 151.93 resistance (2022 high). Decisive break of 145.06 resistance turned support will confirm that this second leg has completed, after rejection by 151.93. Deeper fall would be seen through 38.2% retracement of 127.20 to 151.89 at 142.45 to 61.8% retracement at 136.63. Nevertheless strong bounce from 145.06 will retain medium term bullishness for another test on 151.93 at a later stage.
GBP/USD Mid-Day Outlook
Daily Pivots: (S1) 1.2505; (P) 1.2532; (R1) 1.2565; More...
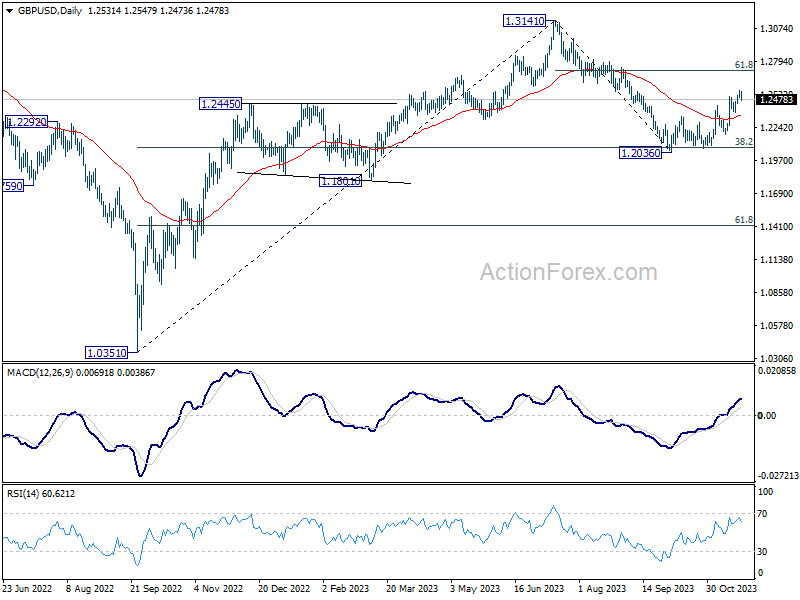
Intraday bias in GBP/USD remains neutral as consolidation continues below 1.2557. While deeper retreat might be seen, further rally is expected as long as 1.2372 support holds. Above 1.2557 will resume the rise from 1.2036, and target 61.8% retracement of 1.3141 to 1.2036 at 1.2716 next.
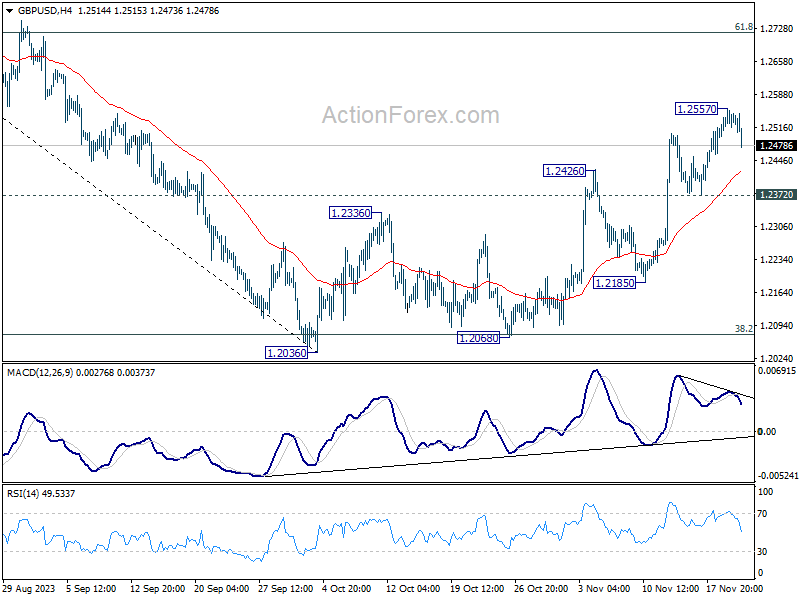
In the bigger picture, price actions from 1.3141 are seen as a corrective pattern to rise from 1.0351 (2022 low). Strong rebound from 38.2% retracement of 1.0351 (2022 low) to 1.3141 at 1.2075 argues that current rise from 1.2036 is the second leg. However, while further rally could be seen, upside should be limited by 1.3141 to bring the third leg of the pattern.
EUR/USD Mid-Day Outlook
Daily Pivots: (S1) 1.0885; (P) 1.0926; (R1) 1.0951; More...
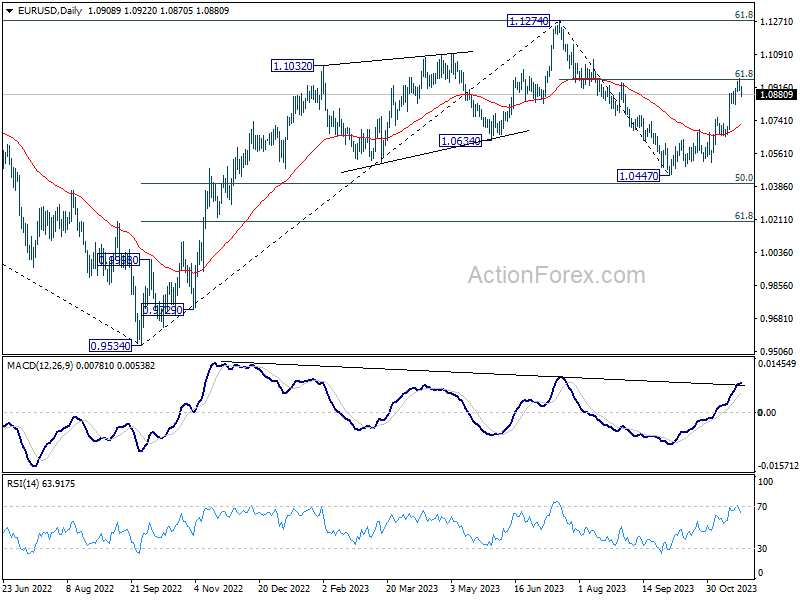
Intraday bias in EUR/USD remains neutral for consolidation below 1.0964 temporary top. While deeper retreat could be seen, downside should be contained by 1.0823 support to bring another rally. On the upside, sustained trading above 1.0958 will pave the way to retest 1.1274 high. However, firm break of 1.0823 will indicate short term topping, and turn bias back to the downside for deeper decline.
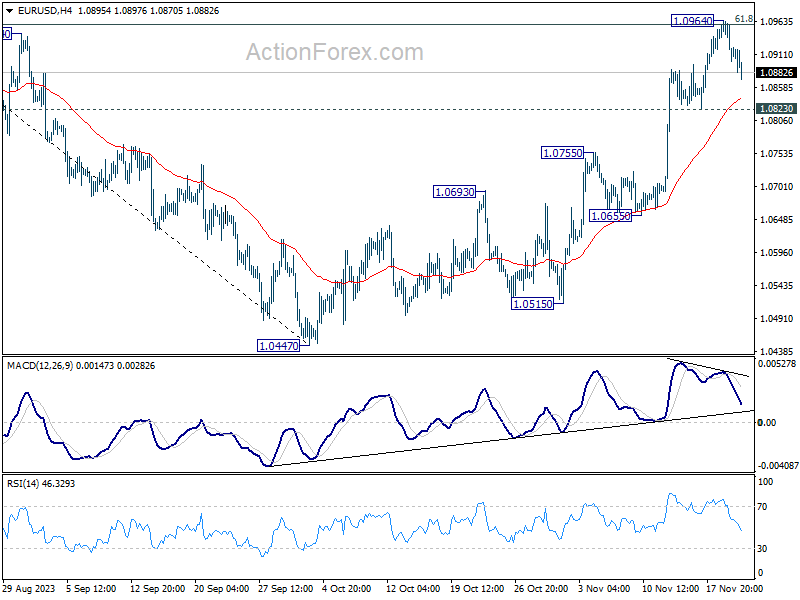
In the bigger picture, price actions from 1.1274 are viewed as a corrective pattern to rise from 0.9534 (2022 low). Rise from 1.0447 is tentatively seen as the second leg. Hence while further rally could be seen, upside should be limited by 1.1274 to bring the third leg of the pattern.