Sample Category Title
A Drawn Out Countdown to US October Inflation Numbers
Markets
Talk about a slow, uninspired start of the week. Core bonds traded mixed with USTs slightly outperforming German bunds in technical trading. US rates eased between -0.8 and 3 bps. German yields rose 1.5 bps at the front while shedding 1.8 bps at the longest tenor. The dollar and euro settled an intraday fight to the advantage of the former. EUR/USD eked out a small gain towards but below 1.07. This was partially thanks to a sudden yet limited drop in USD/JPY from a new YtD high at 151.91 to a low of 151.34 amid option expiries. The pair nevertheless finished with a fresh year’s high at 151.72. Sterling rallied against both the euro and the dollar. GBP/USD rose from 1.221 towards 1.228. EUR/GBP eased from the recent highs just south of 0.875 to 0.871. We’ll leave it in the middle whether that was on the return of former PM and architect of the 2016 Brexit referendum David Cameron. (For sure it wasn’t.) Risk sentiment probably helped though. European stocks rose about 0.8%. The EuroStoxx50 confirmed the break above 4200. US indices opened negative but pared losses as the session evolved. Net daily changes ranged between -0.22% (Nasdaq) to +0.16% (Dow Jones). Commodities including oil (see below) and most metals rose.
News flow hasn’t really picked up in Asian dealings this morning. We fear it’s going to be a drawn out countdown to the US October inflation numbers. And even their significance for daily trading may be a bit overstated because of the conflicting signals they’re likely to carry. The headline figure is expected to drop from 3.7% to 3.3% but mainly thanks to base effects. These disappear for the remainder of the year, however, creating possibilities of CPI reaccelerating. The image for core inflation is more nuanced. Disinflation likely stalled in October with the y/y coming in at 4.1%. In addition, the monthly readings recently creeped higher towards an annualized inflation pace of 3-4% instead of the Fed’s desired 2%. FOMC members in our view are therefore right to retain a hawkish bias for now. There’s an avalanche of speeches, from policymakers at the ECB and BoE too, scattered across the day. They make a clean interpretation of the market’s CPI reaction additionally tricky. Either way we expect the recent correction low in US yields (4.80% in the 2-y and 4.48% in the 10-y) to serve as a strong supports. The dollar finds first support at EUR/USD 1.0764 (38.2% EUR/USD recovery on the Jul-Oct decline). The UK labour market report – still incomplete with the original (un)employment data series being reworked – lifts sterling this morning. Preliminary October employment came in at +33k vs a 17k drop expected while wage growth eased less than anticipated. We still think tomorrow’s inflation numbers will be the real deal for the pound though. EUR/GBP is nearing the 0.87 big figure.
News & Views
OPEC in its November monthly report stressed that global oil market fundamentals remain strong, calling the recent negative sentiment ‘exaggerated’. The demand side includes strong US growth and heathy oil demand/imports from China and India. OPEC even revised up its forecast for global 2023 oil demand growth to 2.5 mb/d. On the supply side the report mentions strong non-OPEC supply mainly driven by US production. At the same time, overall OPEC-11 production in October remained well below the agreed levels. Recent increase in shipments from the Middle East mirrors normal seasonal patterns. OPEC also said that oil inventories remain well below average levels. The report attributes the recent trend lower in oil prices to financial market speculators ‘as they have sharply reduced their net long positions over the month of October’. The report concludes that commitments to reduce production will contribute significantly to achieve and sustain global oil market stability. Brent oil yesterday rebounded from the $80.5 p/b area to close near $82.5 p/b.
Inflation in Argentina last month accelerated to 8.3% M/M bringing annual inflation to 142.7% Y/Y, the fastest pace in more than three decades. Inflation will be one of the biggest challenges for the new president that will be elected in a run-off vote on November 19 between current Economy Minister Sergio Massa and outsider Javier Milei. In a survey of the central bank published on Monday, economists even further upwardly revised their inflation forecasts to 185% at the end of this year. Economic activity is forecast to contract 2.0% this year and 2.4% next year.
EUR/USD Daily Outlook
Daily Pivots: (S1) 1.0674; (P) 1.0690; (R1) 1.0715; More...
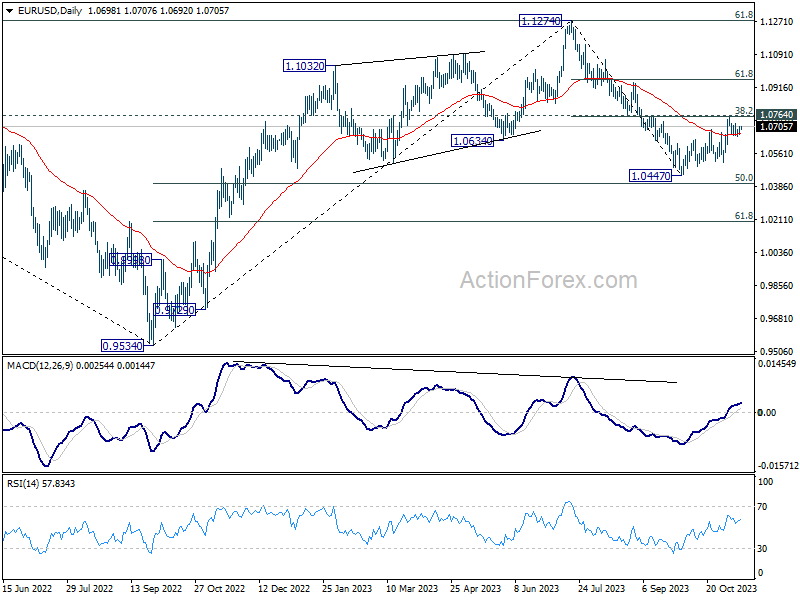
Intraday bias in EUR/USD stays neutral for the moment. On the downside, break of 1.0655 minor support, and sustained trading below 55 4H EMA (now at 1.0670), will argue that the rebound from 1.0447 has completed with three waves up to 1.0755. That came after rejection by 1.0764 cluster resistance (38.2% retracement of 1.1274 to 1.0447 at 1.0763). In this case, intraday bias will be turned back to the downside for 1.0447/0515 support zone. Nevertheless, strong bounce from current level, followed by decisive break of 1.0764, will bring stronger rally to 61.8% retracement at 1.0958 next.
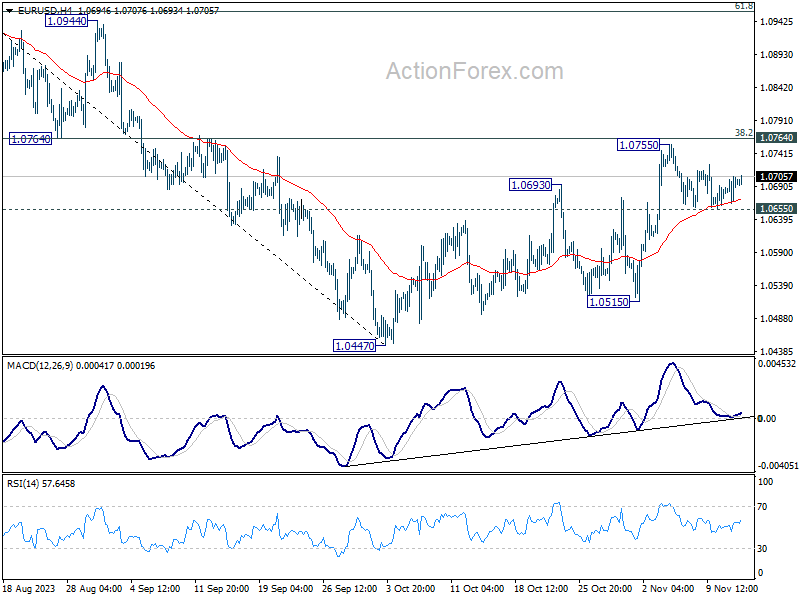
In the bigger picture, price actions from 1.1274 are viewed as a corrective pattern to rise from 0.9534 (2022 low). Rise from 1.0447 is tentatively seen as the second leg. Hence while further rally could be seen, upside should be limited by 1.1274 to bring the third leg of the pattern. However, break of 1.0447 will resume the fall to 61.8% retracement of 0.9543 to 1.1274 at 1.0199.
GBP/USD Daily Outlook
Daily Pivots: (S1) 1.2234; (P) 1.2258; (R1) 1.2302; More...
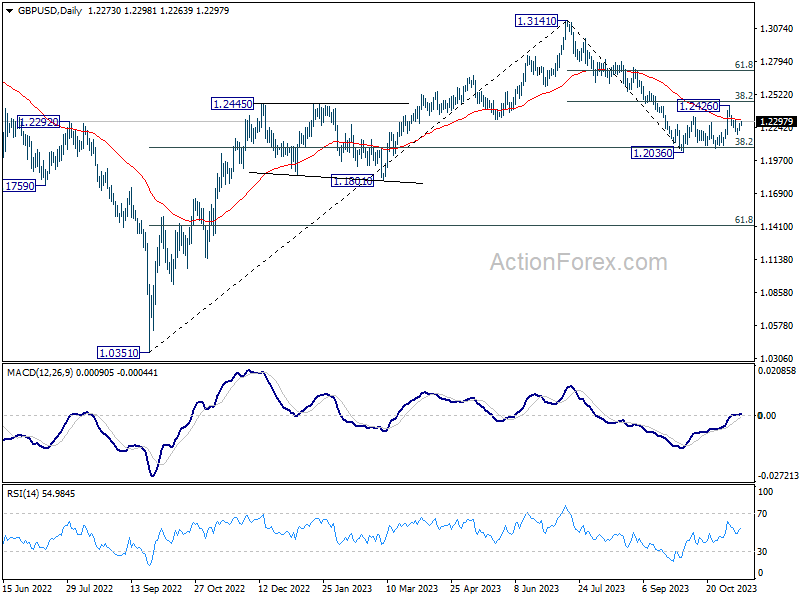
While GBP/USD's recovery from 1.2185 is extending, upside is limited below 1.2307 resistance. Intraday bias stays neutral first. Corrective rebound from 1.2036 should have completed with three waves up to 1.2426. Below 1.2185 will bring deeper fall to retest 1.2036/68 support zone next. Firm break there will resume larger down trend from 1.3141. However, firm break of 1.2307 will dampen this view and bring stronger rise back to 1.2426 resistance.
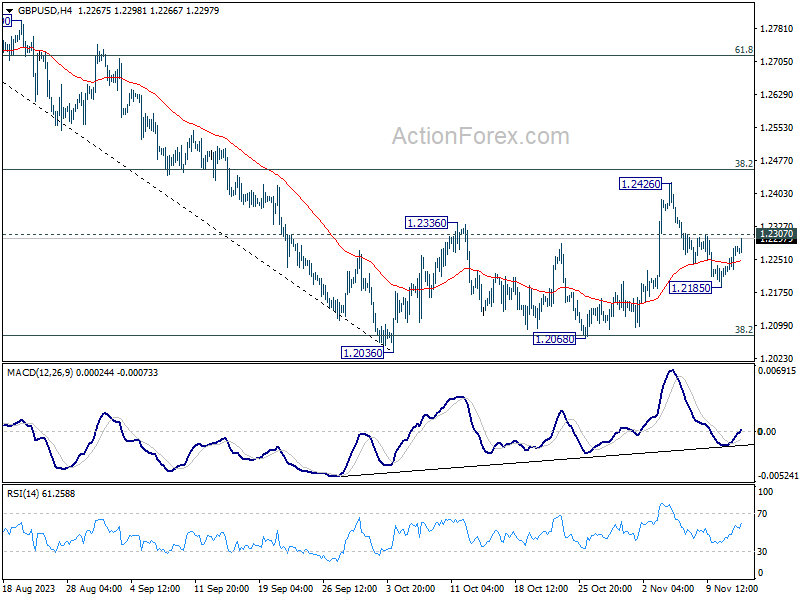
In the bigger picture, rejection by 38.2% retracement of 1.3141 to 1.2036 at 1.2458, suggests fall from 1.3141 is still in progress. Sustained break of 38.2% retracement of 1.0351 (2022 low) to 1.3141 at 1.2075 will bring deeper decline to 61.8% retracement at 1.1417, even just as a corrective move.
USD/CHF Daily Outlook
Daily Pivots: (S1) 0.8998; (P) 0.9025; (R1) 0.9044; More....
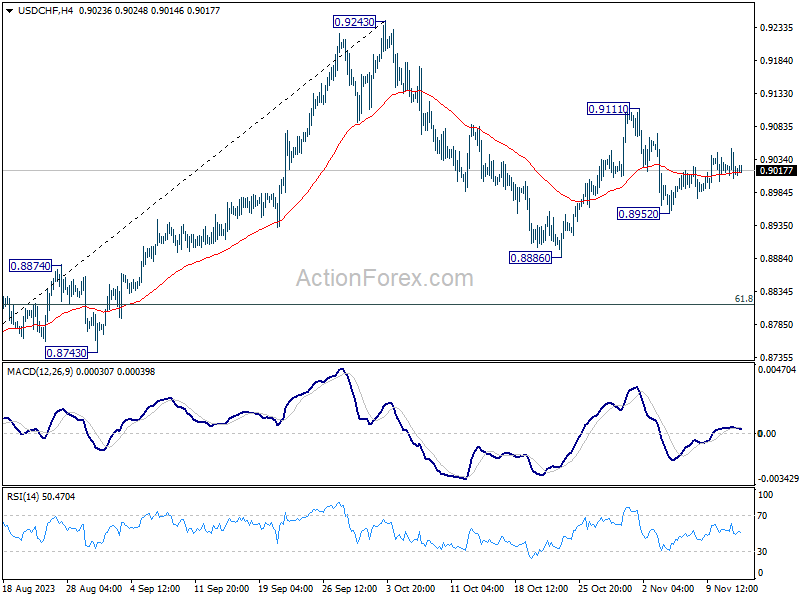
Intraday bias in USD/CHF remains neutral and outlook is unchanged. On the downside, below 0.8952 will target a test on 0.8886 support first. Break there will resume whole decline from 0.9243 to 0.8815 fibonacci level. However, break of 0.9111 will resume the rebound from 0.8886 instead, and target 0.9243 resistance.
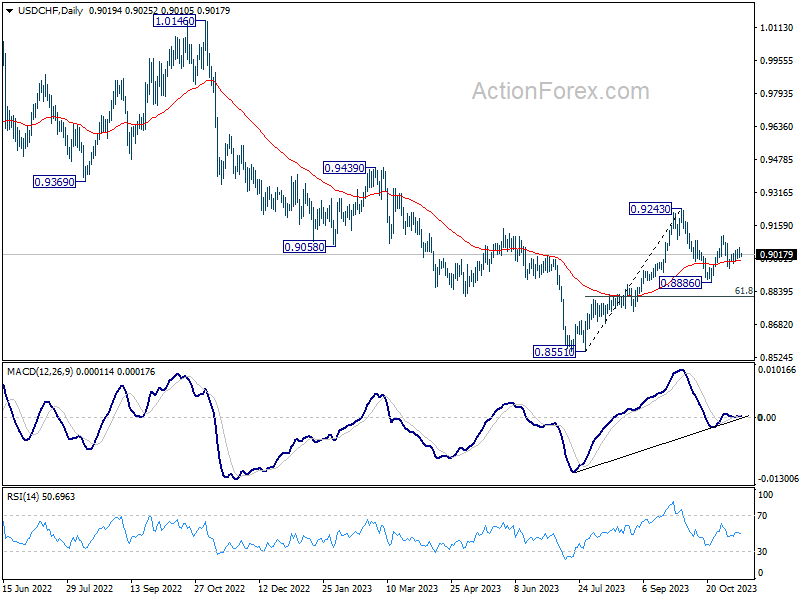
In the bigger picture, outlook is mixed up by the deeper than expected pull back from 0.9243. Yet there was no follow through selling after hitting 0.8886. On the upside, break of 0.9243 resistance will revive the case of medium term bottoming at 0.8851, and turn outlook bullish. However, sustained break of 61.8% retracement of 0.8551 to 0.9243 at 0.8815 will argue that larger decline from 1.0146 is ready to resume through 0.8551 low.
USD/JPY Daily Outlook
Daily Pivots: (S1) 151.31; (P) 151.61; (R1) 152.02; More...
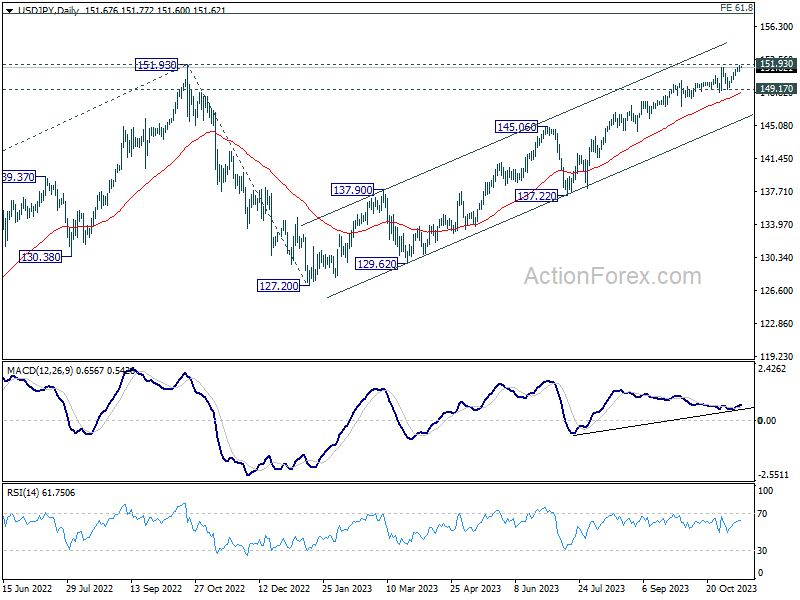
Intraday bias in USD/JPY is turned neutral again with 4H MACD crossed below signal line. On the upside, decisive break of 151.93 resistance will confirm resumption of long term up trend. Next target will be 157.69 projection level. Meanwhile, near term outlook will stay bullish as long as 149.17 support holds, even in case of deep retreat.
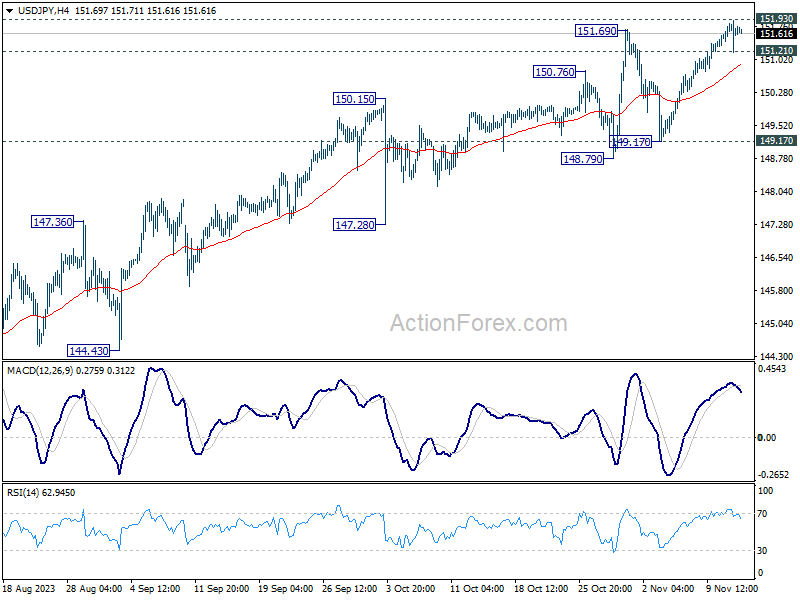
In the bigger picture, immediate focus is now on 151.93 resistance (2022 high). Rejection by 151.93, followed by sustained break of 145.06 resistance turned support will argue that rise from 127.20 has completed, and turn outlook bearish for 137.22 support and below. However, sustained break of 151.93 will confirm resumption of long term up trend. Next target will be 61.8% projection of 102.58 (2021 low) to 151.93 from 127.20 at 157.69.
USD/CAD Daily Outlook
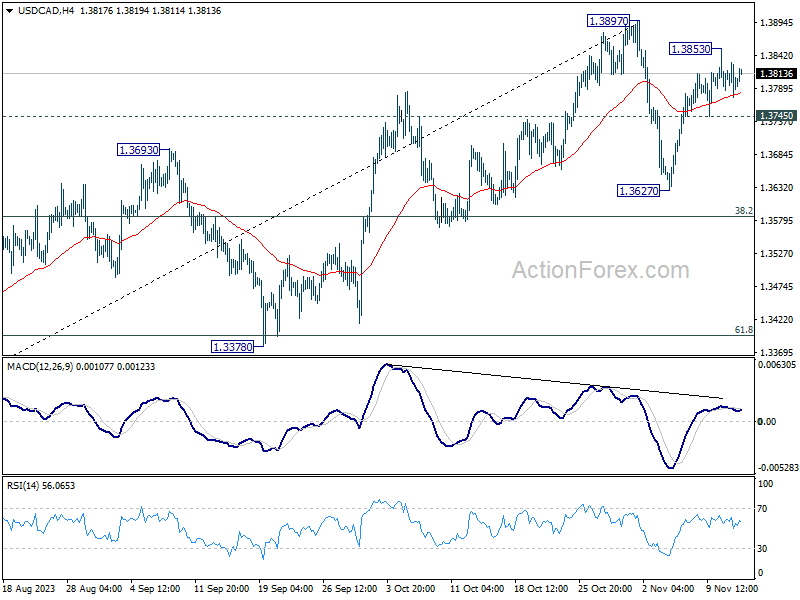
Daily Pivots: (S1) 1.3779; (P) 1.3805; (R1) 1.3834; More...
Intraday bias in USD/CAD is turned neutral with 4H MACD crossed below signal line. While another rise might be seen, strong resistance could emerge from 1.3897 to limit upside on first attempt. On the downside, break of 1.3745 will turn bias to the downside to extend the corrective pattern from 1.3897 with another falling leg. In this case, strong support should be seen from 38.2% retracement of 1.3091 to 1.3897 at 1.3589 to bring rebound.
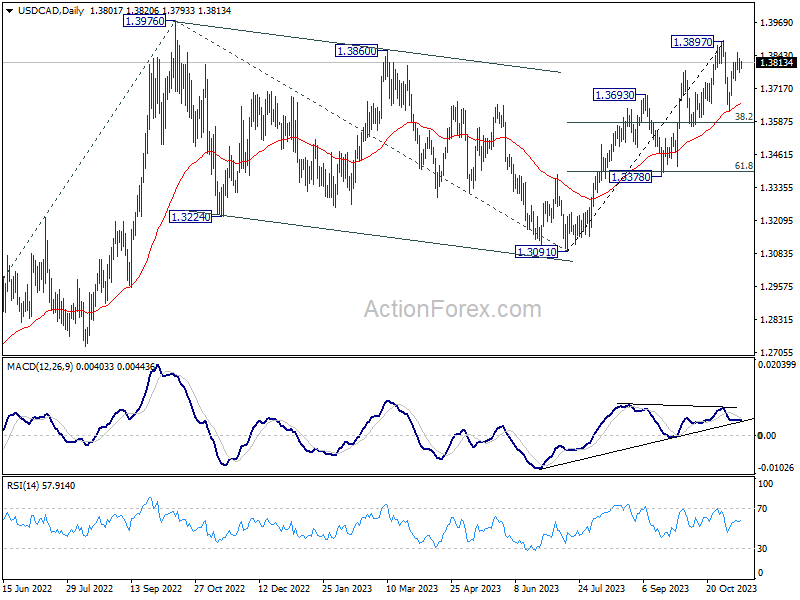
In the bigger picture, corrective pattern from 1.3976 (2022 high) should have completed with three waves down to 1.3091. Decisive break of 1.3976 high will confirm resumption of up trend from 1.2005 (2021 low). Next target is 61.8% projection of 1.2401 to 1.3976 from 1.3091 at 1.4064. This will remain the favored case as long as 1.3378 support holds.
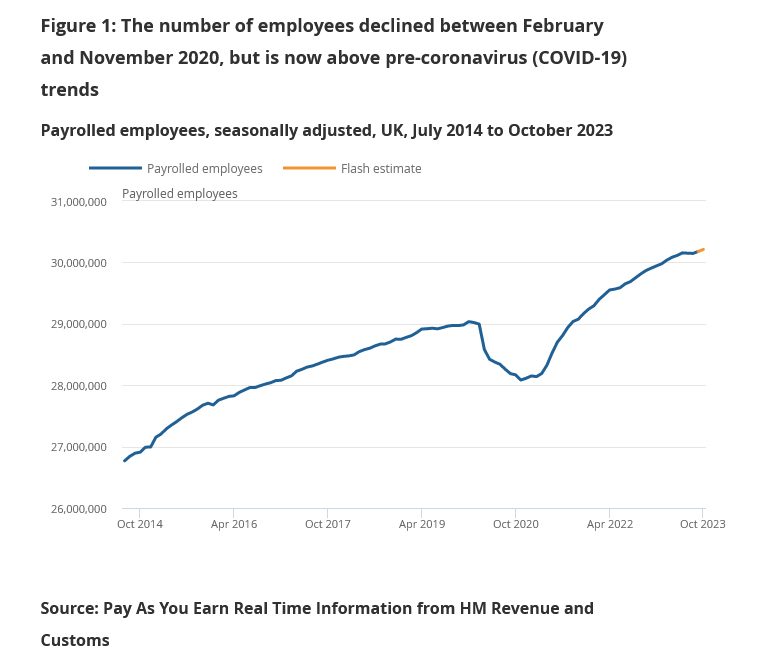
UK payrolled employment rose 33k in Oct, unemployment rate unchanged at 4.2% in Sep
UK payrolled employment rose 33k, or 0.1% mom in October. Over the year, payrolled employment rate 398k or 1.3% yoy. Median monthly pay rose 5.9% yoy, down from prior month's 6.0% yoy. Claimant count rose 17.8k, above expectation of 15.0k.
In the three months to September, unemployment rate was unchanged at 4.2%, matched expectations. Average earnings including bonus rose 7.9% yoy, above expectation of 7.4%, slowed from prior 8.2%. Average earnings excluding bonus rose 7.7% yoy, matched expectations, slowed from prior month's 7.8%.
Key Inflation Data Due in the US and Sweden
Market movers today
US CPI for October is the highlight of this week in terms of data releases. We expect headline at 0.1 m/m and core at 0.3% m/m in line with consensus but with uncertainty coming from the auto worker's strike which might have temporarily raised car prices, as well as from technical factors related to the calculation of health insurance premiums. If there is an upside surprise related to those issues, the market should see through it.
In Sweden the October inflation numbers will be released at 8:00 CET. We expect a slight uptick in CPIF inflation to 4.5% YoY (from 4% in September), and a decrease in CPIF excl. energy to 6.3% YoY (from 6.9% in September). Looking at the Riksbank's latest forecast, their trajectory shows a 0.4 percentage point lower CPIF YoY estimate and CPIF excl. Energy print that is some 0.3 p.p YoY below our own forecast. We judge today's outcome to potentially be decisive for next week's policy decision by the Riksbank. We judge our call for an unchanged policy rate by the Riksbank next week to remain in play, should today's inflation outcome be in line (or below) our own forecast.
German ZEW increased more than expected in October which, together with the IFO survey, gave a small ray of hope for the German economy, so it could be interesting to see today's November figure. Second release today of euro area GDP, but still without details.
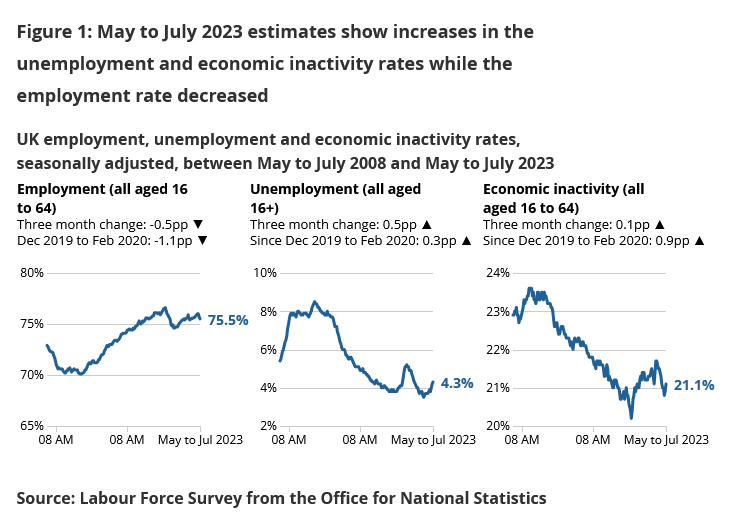
In the UK, we get the labour market report where focus will be on developments in wage growth, which has remained stubbornly elevated the past months, while the data on unemployment and employment continues to be published on an experimental basis given the poor data quality.
We get Chinese industrial production, retail sales and home sales early Wednesday morning. Especially home sales will be interesting but retail sales as well. Service PMI was soft in October so expectations are pretty low. We might also get a Chinese rate cut Wednesday.
Japanese Q3 GDP growth also early Wednesday will likely print close to zero as foreign demand has slowed.
The 60 second overview
Markets. It has been a quiet start to the week amid markets awaiting key data releases in not least today's US CPI print. European equities have generally outperformed peers, yields and the USD are little changed and commodity prices are generally a little higher to start the week.
US inflation expectations. Yesterday's release of New York Fed inflation expectations was a slight source of relief for markets following last week's surprise rise in the University of Michigan motheasure. B the 1Y and 5Y inflation expectations declined in the New York Fed measure to 3.57% and 2.72%, respectively.
Oil prices. After a series of weekly declines the oil price has rebounded somewhat since the bottom last Wednesday completing a four day consecutive rally - the longest rally in two months. Brent crude is now back close to the USD 83/bbl mark after having traded below USD 80/bbl last week. While it is difficult to pinpoint one single driver it does seem a slight improvement to the cyclical mood in markets alongside some hawkish OPEC comments have contributed to the rise.
UK politics. Yesterday, UK Prime Minister Rishi Sunak reshuffled his Cabinet ahead of the Autumn Statement, which is scheduled for 23 November. As expected, Chancellor Jeremy Hunt remains in place but in a more surprising move, former PM David Cameron was appointed foreign secretary. While the return of the former PM is not expected to be universally popular, his significant international standing is valuable with the Conservatives firmly behind in the polls. At present, Labour is set to win by a majority in the next general election, which is due to be held by January 2025 at the latest.
Equities: Equities were in wait-and-see mode yesterday ahead of the US inflation release today. Market movers were few, leaving US equities struggling for direction while Europe rose about 1% in a catch-up move from Friday. Little differences between sectors or styles in a classic wait-and-see manner but if any a slight preference for defensive momentum. Hesitancy continues this morning with US futures unchanged.
FI: It was a trading session with very limited volatility, while markets await today's US CPI release. 10y Bunds ended virtually unchanged at the 2.71%, where it started the day. The European curves twist-flattens as the short end ended higher 2bp while the long end ended by a similar amount lower.
FX: It has been a quiet start to the week in global markets including FX. Yesterday's session saw very limited moves with most notably NOK and SEK enjoying green equity markets and a move higher in oil prices as we head into this morning's Swedish CPI release.
Credit: Credit markets were in wait-and-see mode ahead of the important US inflation data release today. The tilt was, however, slightly risk seeking, with Itrax Main tightening 1.2bp to close at 74.4bp, while Itrax Xover tightened 5.2bp to close at 405.6bp. Primary markets were fairly active in both financials and corporates, with among others, S-Bank and Heidelberg materials, launching EUR bench-mark deals.
Inflation Jitters and Rate Cut Riddles
Investors are on the edge of their seats, waiting for the latest scoop on US inflation data to take a fresh direction in both stock and bond markets. The dollar index remains offered, the US political risks are casting shadows, and there's a rising chorus of opinions playing the guessing game on when and how much the Fed might trim the rates next year.
The S&P500 consolidated on Monday after a 7.5% rally since end of October, while Nasdaq 100 eased 0.30% following an almost 10% rally. The US 10-year yield steadied a touch above the 4.60% level.
According to the consensus of analysts on a Bloomberg survey, the US inflation may have slowed to 3.3% last month, from 3.7% printed a month earlier. Core inflation is seen unchanged at 4.1%. The waning supply chain disruptions, the loosening US jobs market, a further fall in gasoline prices and the expectation of a decline in rents are among the major factors that could help inflation ease – after a more than 1.5-year aggressive policy tightening from the Fed of course.
But not all indicators are in green. An uptick in health insurance costs could give a slight boost to October inflation figures, while the latest US consumer survey, released last Friday, showed that the US consumers expect inflation to climb at an annual rate of 3.2% over the next 5 to 10 years. In contrast, economists see inflation fall to 2.5% in the next five years and down to 2.2% in the next 5 to 10 years, and the bond prices imply a CPI of 2.36% in the period of 5 to 10 years from now.
For today, an inflation read in line with expectations, or ideally softer than expected, should give further support to the Federal Reserve (Fed) doves, cement the idea that the Fed is done hiking the interest rates and boost the rate cut expectations for next year. A read above expectations should bring Fed hawks back to the market and increase the bets of a rate hike in December. But activity on Fed funds futures gives around 85% chance for a no rate hike in the Fed’s December meeting, and the inflation numbers must look very bad to reverse that expectation.
And anyway, what investors are interested in right now is not whether the Fed will hike one more time or not – because they are convinced that it won’t. Instead, what everyone is trying to figure out right now is: when will the Fed start cutting rates, and by how much will it cut rates next year. Goldman Sachs doesn’t expect a rate cut from the Fed until this time next year. Morgan forecasts two deep rate cuts next year starting from June, and UBS’ Investment Bank anticipates the first rate cut as early as in March and a 275bp cut in 2024.
If inflation continues to ease and the US jobs market and the economy starts slowing – which is our base case scenario for the next 12 months – the Fed should start lowering rates. But given how reactive the Fed has been to mounting inflation, the rate cuts shouldn’t start before September, but when they start the loosening should be rapid.
Ceteris paribus, the US 2-year yield should hover around the 5% mark, the 10-year yield will remain appetizing approaching the 5% mark – and could hardly go above this level unless there is an economic shock, or a political turmoil, and a potential rating downgrade.
The US dollar index remains offered at the 50-DMA and could further extend losses with the sight of a sufficiently soft inflation report, while the USDJPY was sold near the 152 level. There are different rumours regarding the nature of the sudden jump in the yen on Monday. It could be a direct FX intervention, or it could be the result of options positioning. But in both cases, selling the yen at the current levels means taking the risk of a sudden reversal, either because of a broadly softer US dollar, or because of a direct intervention.
Technical Outlook and Review
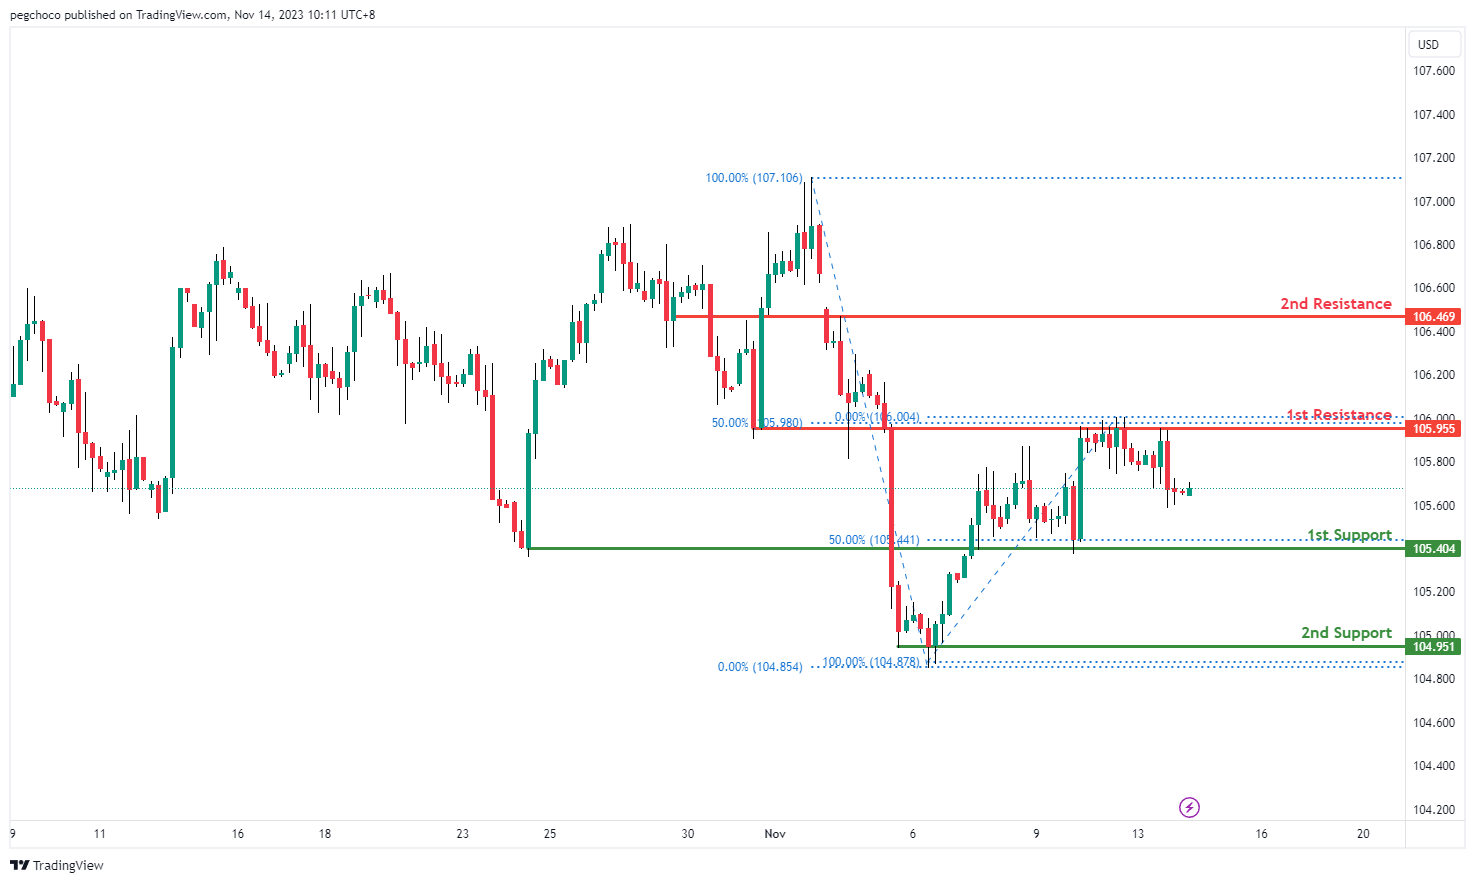
DXY:
The DXY chart currently has a bearish overall momentum, suggesting the potential for a bearish continuation towards the 1st support level.
1st support at 105.40 is identified as an overlap support, and it also coincides with the 50% Fibonacci Retracement level. This level indicates that there could be a significant level of support, and traders may expect the price to find buying interest or a pause in the bearish movement around this area.
The 2nd support at 104.95 is considered a multi-swing low support, further reinforcing its potential as a support level. Multi-swing lows often indicate areas where buyers have stepped in previously, making it a relevant support level.
On the resistance side, the 1st resistance at 105.95 is categorized as an overlap resistance and also coincides with the 50% Fibonacci Retracement level. This level suggests that there could be selling interest in this area, potentially acting as a barrier to further upward movement.
The 2nd resistance at 106.46 is noted as a pullback resistance, indicating another potential level where the price may encounter selling pressure during its bearish continuation.
EUR/USD:
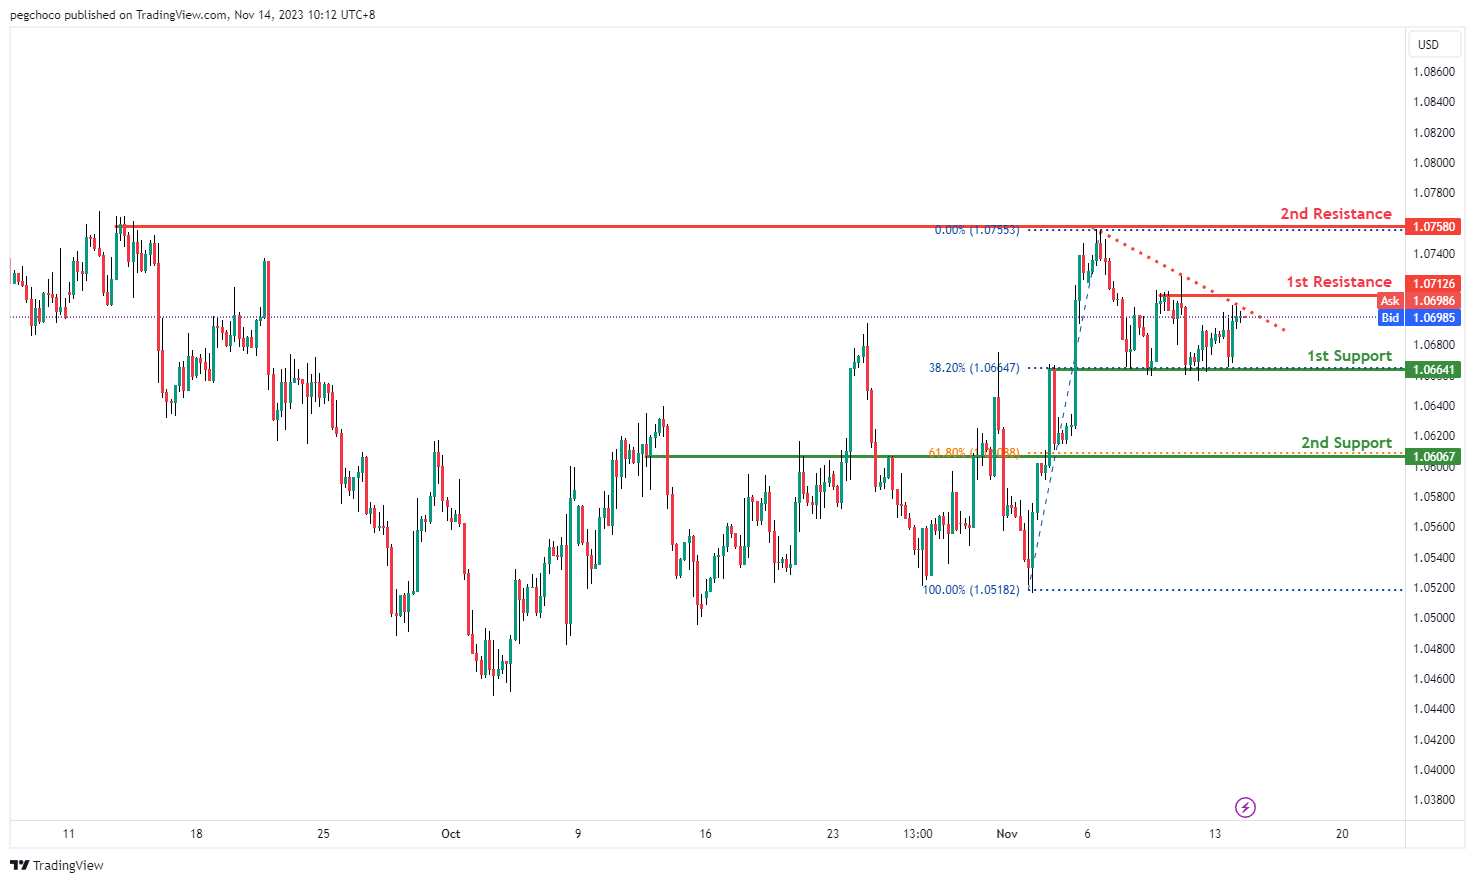
The EUR/USD chart currently has a bearish overall momentum, suggesting the potential for a bearish reaction off the 1st resistance level and a drop towards the 1st support.
1st support at 1.0664 is identified as an overlap support, and it also coincides with the 38.20% Fibonacci Retracement level. This level suggests that there could be a significant level of support, and traders may expect the price to find buying interest or a pause in the bearish movement around this area.
The 2nd support at 1.0606 is considered a pullback support and coincides with the 61.80% Fibonacci Retracement level. This level reinforces its potential as a support level. Fibonacci retracement levels are often watched by traders for potential reversal points.
On the resistance side, the 1st resistance at 1.0712 is categorized as a multi-swing high resistance. This level indicates that there could be selling interest in this area, potentially acting as a barrier to further upward movement.
The 2nd resistance at 1.0758 is also noted as a multi-swing high resistance, adding to the potential areas where the price might find resistance during its bearish reaction.
EUR/JPY:
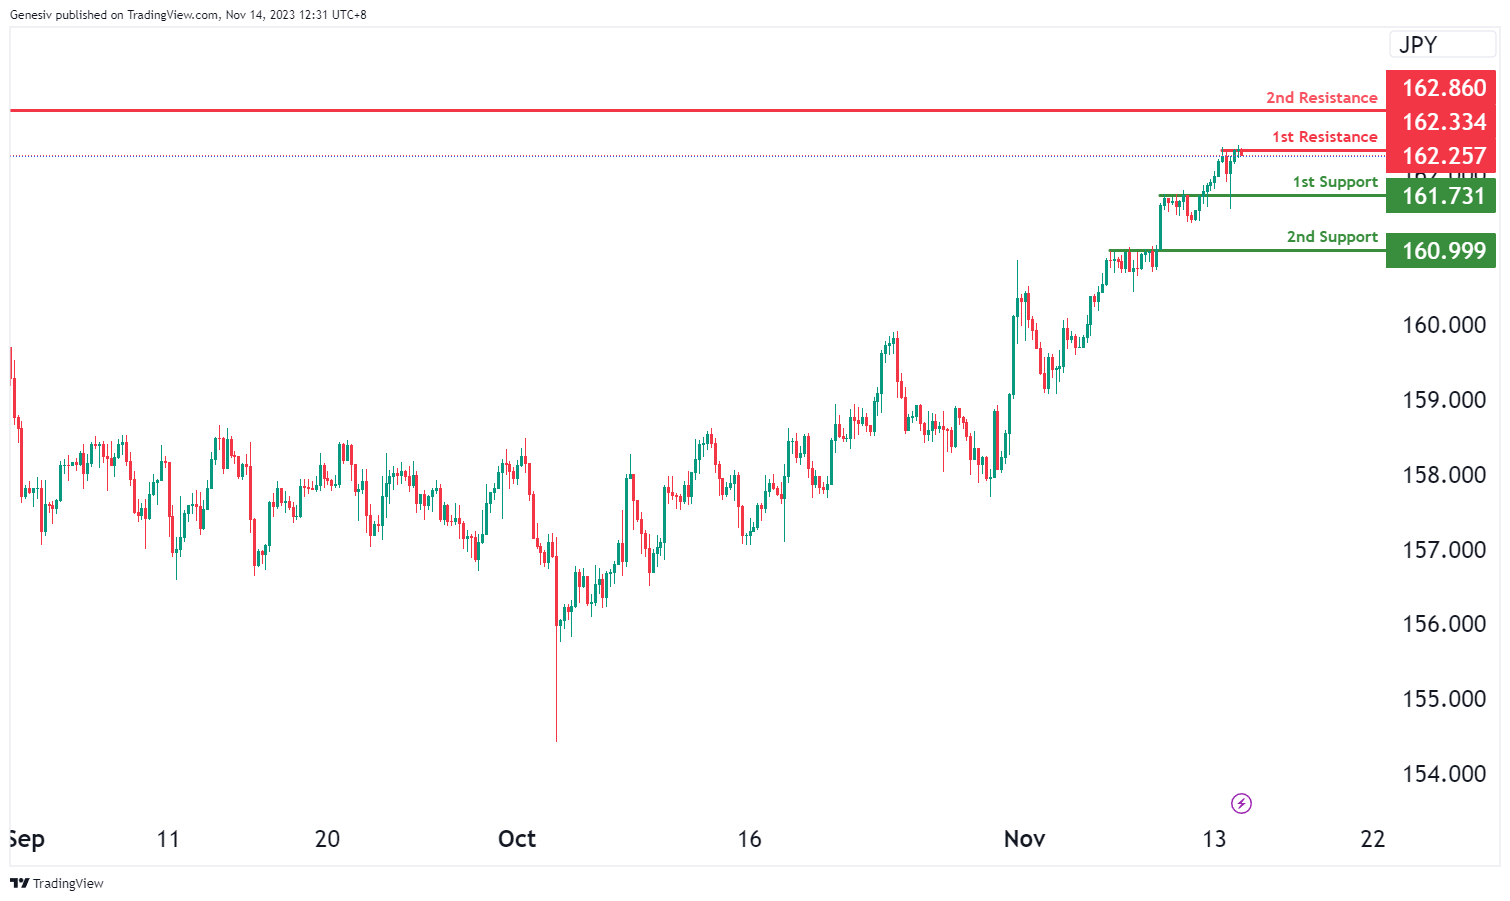
The EUR/JPY chart currently suggests a bearish momentum, indicating a potential bearish reaction off the first resistance at 162.33, with a subsequent drop towards the first support at 161.73.
The first support at 161.73 is identified as a pullback support, indicating a level where the price might find some buying interest. Additionally, the second support at 160.99 is recognized as another pullback support, reinforcing the potential strength of the support zone.
On the resistance side, the first resistance at 162.33 represents a point of multi-swing high resistance, marking a crucial level where the price might face selling pressure. Furthermore, the second resistance at 162.86 is characterized as a swing high resistance, suggesting another level where the price might encounter obstacles within its downward movement.
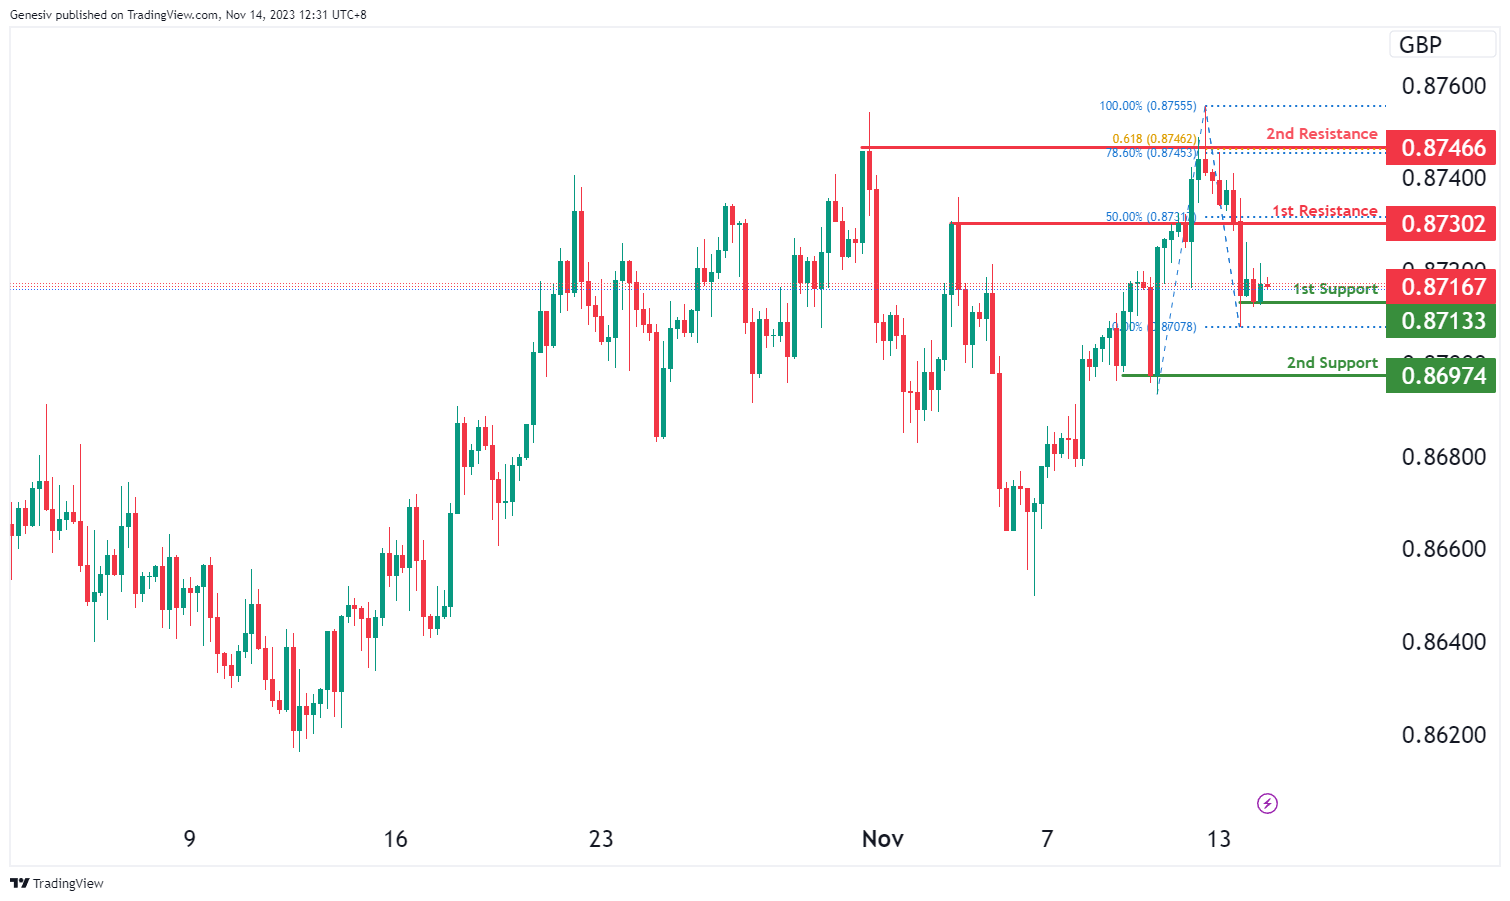
EUR/GBP:
The EUR/GBP chart currently demonstrates a bullish momentum, suggesting a potential bullish bounce off the first support at 0.8713, with the potential to head towards the first resistance at 0.8730.
The first support at 0.8713 is identified as a swing low support, providing a foundational level for potential price rebounds. Additionally, the second support at 0.8697 is recognized as a multi-swing low support, reinforcing the potential strength of the support zone.
On the resistance side, the first resistance at 0.8730 represents a point of pullback resistance, coinciding with the 50% Fibonacci Retracement level. Furthermore, the second resistance at 0.8746 is identified as a multi-swing high resistance, demonstrating Fibonacci confluence with the 78.60% Fibonacci Retracement and the 61.80% Fibonacci Projection. This indicates a significant potential hurdle for the price and reinforces the importance of this resistance level.
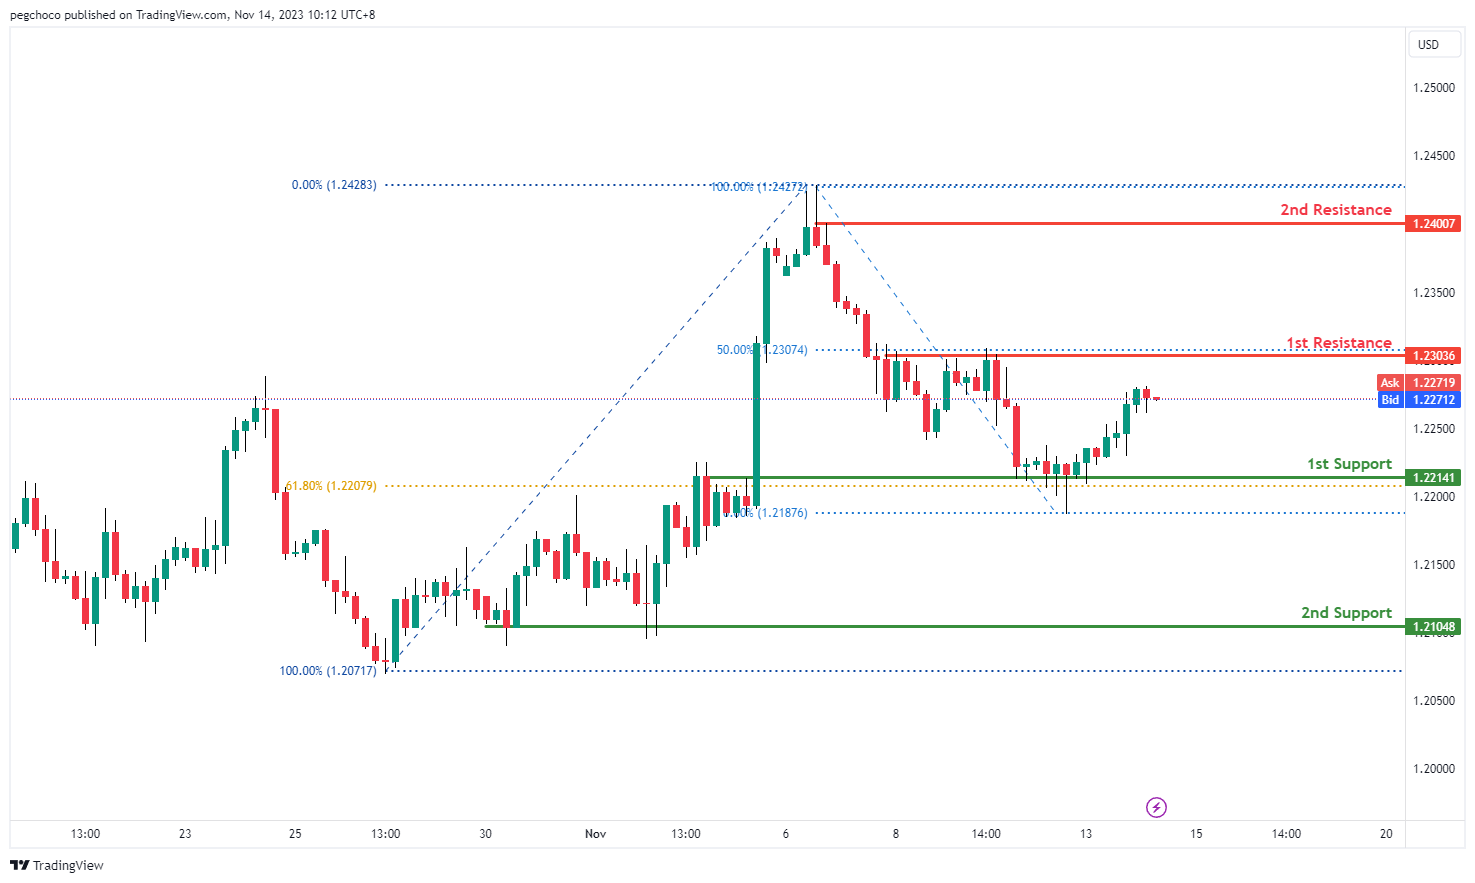
GBP/USD:
The GBP/USD chart currently has a bullish overall momentum, suggesting the potential for a bullish continuation towards the 1st resistance.
1st support at 1.2214 is identified as an overlap support, and it also coincides with the 61.80% Fibonacci Retracement level. This level suggests that there could be a significant level of support, and traders may expect the price to find buying interest or a pause in the bullish movement around this area.
The 2nd support at 1.2104 is considered a multi-swing low support, further reinforcing its potential as a support level. Multiple swing lows indicate an area where buyers have previously stepped in, making it a significant support zone.
On the resistance side, the 1st resistance at 1.2303 is categorized as a multi-swing high resistance. This level coincides with the 50% Fibonacci Retracement level, which adds to its significance. This area may act as a barrier to further upward movement, where sellers could be active.
The 2nd resistance at 1.2400 is noted as a swing high resistance, indicating another potential level where the price may encounter obstacles in its upward movement.
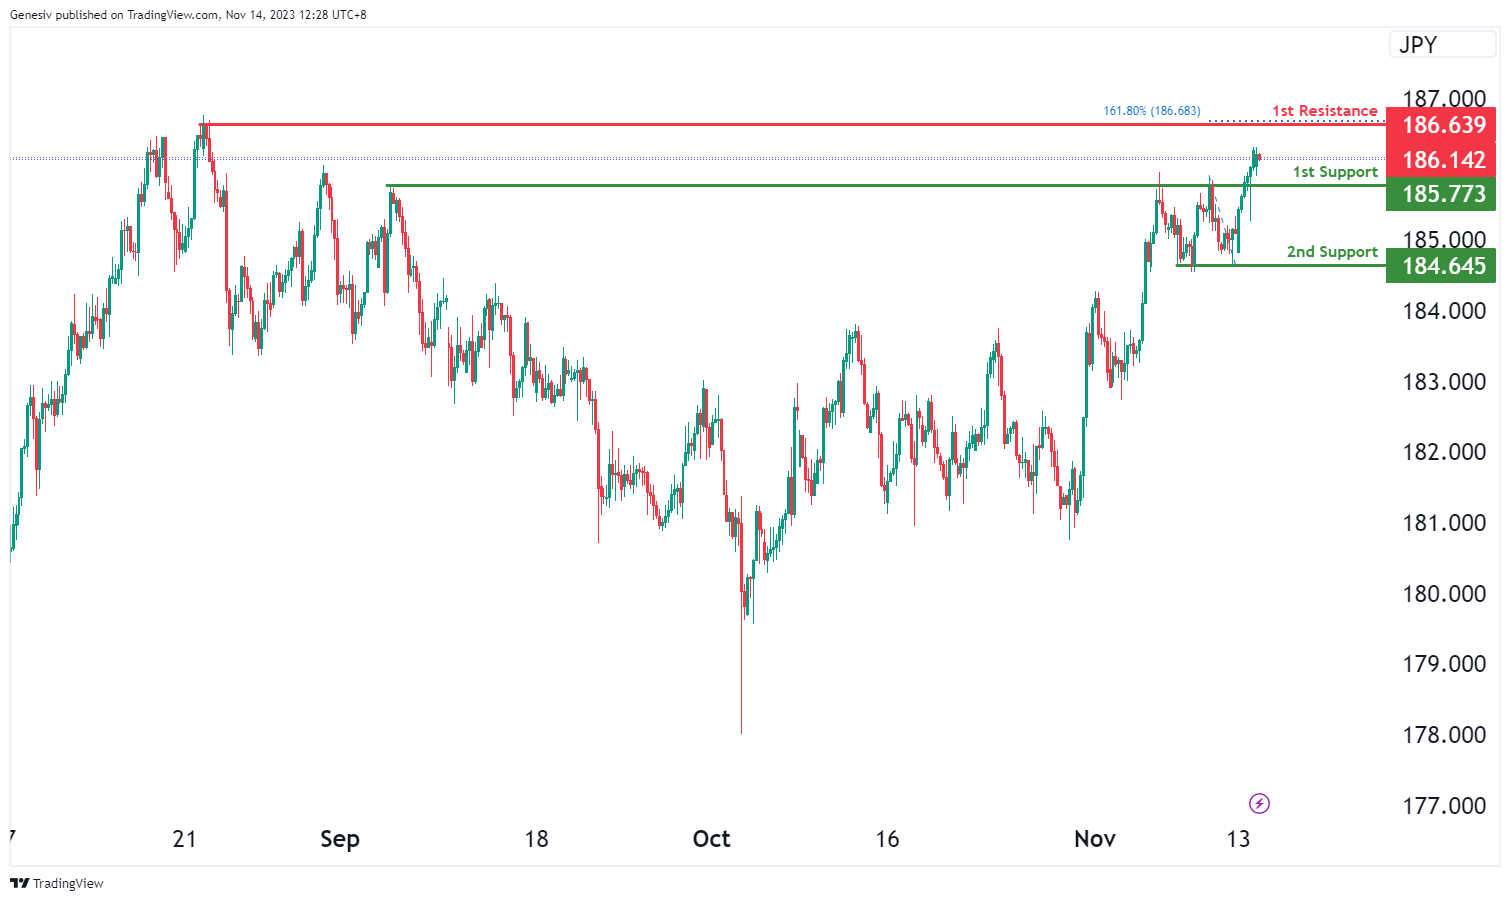
GBP/JPY:
The GBP/JPY chart currently exhibits a bullish momentum, suggesting a potential bullish continuation towards the first resistance at 186.63.
The first support at 185.77 is identified as a pullback support, providing a potential foundation for the price to bounce higher. Additionally, the second support at 184.64 is recognized as a multi-swing low support, further reinforcing the potential strength of the support zone.
On the upside, the first resistance at 186.63 represents a point of swing high resistance, indicating a significant level where the price might face resistance or potential reversals within its upward movement. This level is crucial for traders to monitor as it could influence the continuation of the bullish trend.
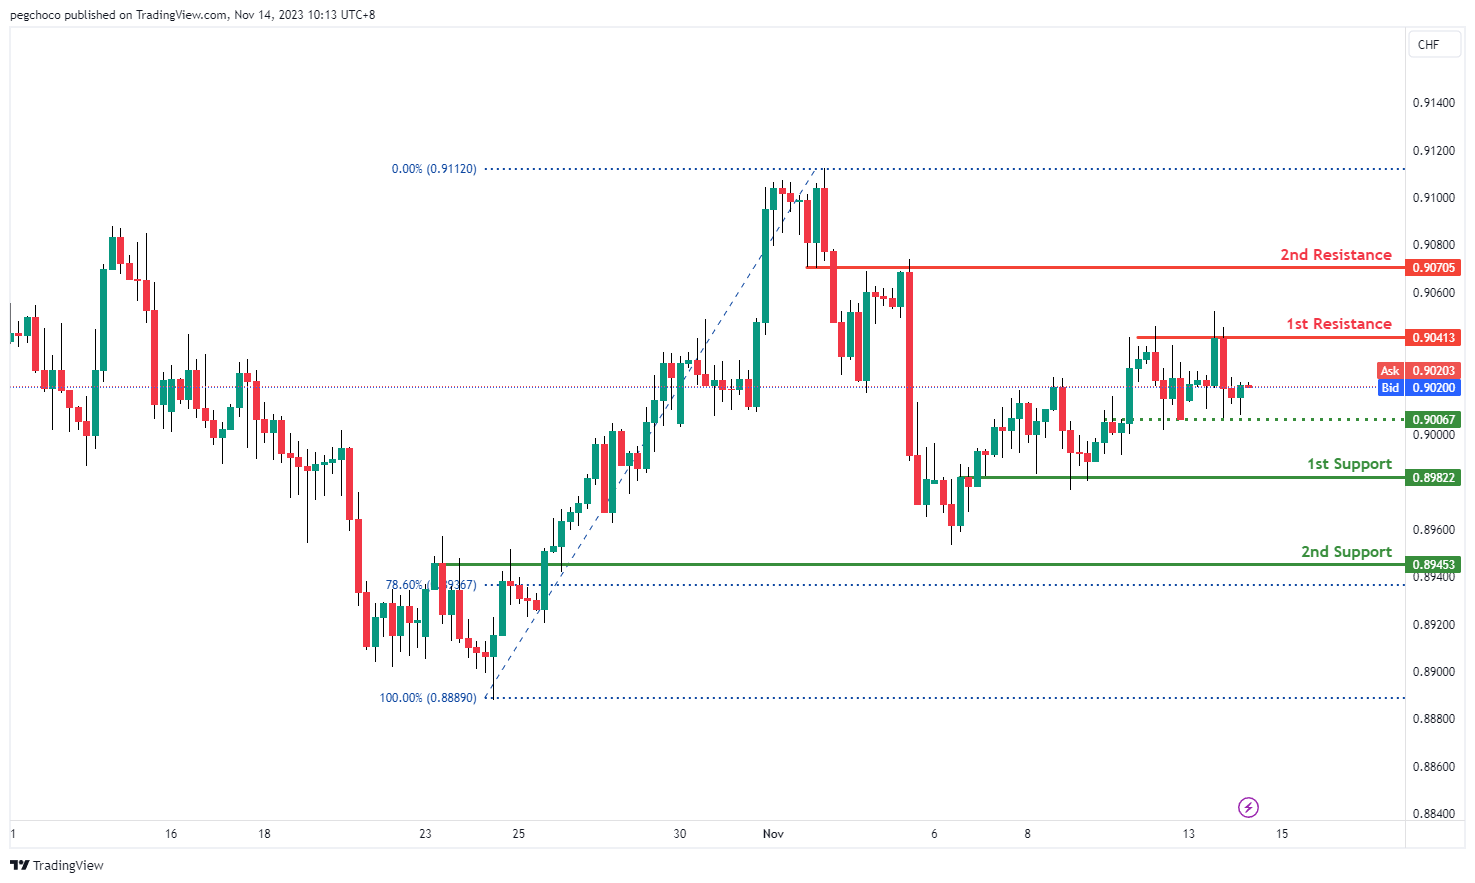
USD/CHF:
The USD/CHF chart exhibits a bearish overall momentum, indicating the potential for a continuation of the bearish trend. Here are the key levels to watch:
1st support at 0.8982: This level is considered an overlap support, which means it has previously acted as a support level and could attract buying interest or act as a barrier to further downside.
2nd support at 0.8945: This support level gains significance as it coincides with the 78.60% Fibonacci Retracement level. Fibonacci retracement levels often act as potential reversal or support levels in the market.
1st resistance at 0.9041: This level is categorized as a multi-swing high resistance, indicating that it has historically been a point where price faced selling pressure and reversed lower.
2nd resistance at 0.9070: This is an overlap resistance, suggesting it has previously served as a resistance level and could continue to do so.
Intermediate support at 0.9006: This level is identified as an overlap support, adding to its potential significance as a support zone.
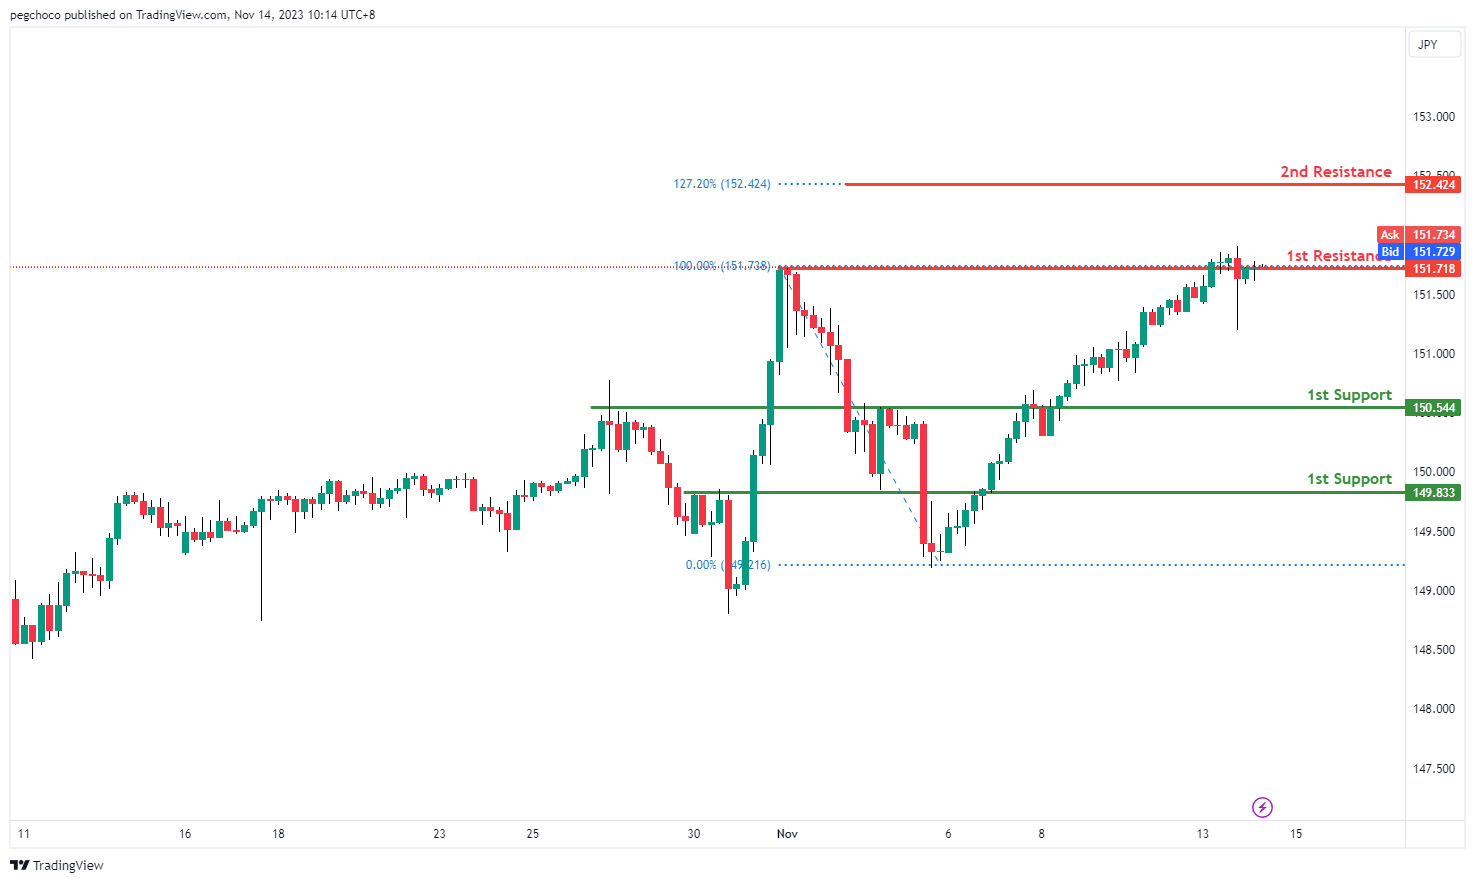
USD/JPY:
The USD/JPY chart currently shows a bullish overall momentum, indicating the potential for further upside movement. Here are the key levels to watch:
1st support at 150.54: This level is considered a pullback support, suggesting that it has previously acted as a level where buyers stepped in. It could provide a base for price to bounce higher.
2nd support at 149.83: This is another pullback support, indicating that it has historical significance as a level of buying interest.
1st resistance at 151.71: This level is categorized as a swing high resistance, which means it has previously acted as a barrier to further upside movement.
2nd resistance at 152.42: This resistance level is significant as it aligns with the 127.20% Fibonacci Extension, suggesting it could act as a strong barrier to price advancement.
USD/CAD:
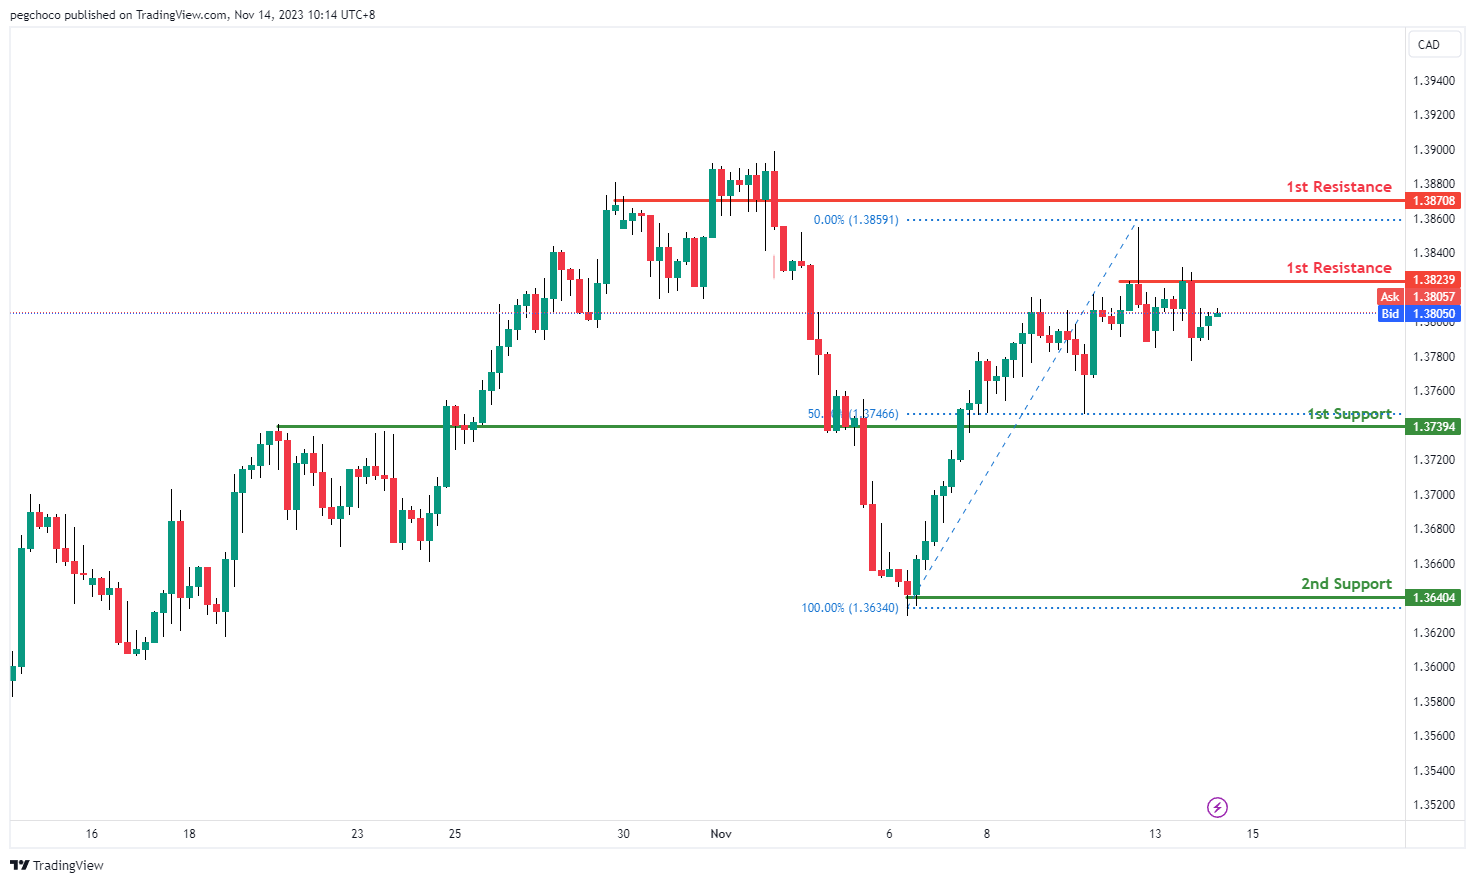
The USD/CAD chart currently shows a bearish overall momentum, indicating the potential for further downside movement. Here are the key levels to watch:
1st support at 1.3739: This level is considered an overlap support and aligns with the 50% Fibonacci Retracement, suggesting that it has previously acted as a level where buyers entered the market. It could provide a base for price to potentially bounce higher.
2nd support at 1.3640: This is a swing low support, indicating historical significance as a level of buying interest.
1st resistance at 1.3823: This level is categorized as a multi-swing high resistance, which means it has previously acted as a barrier to further upside movement.
2nd resistance at 1.3870: This resistance level is significant as it aligns with a pullback resistance, suggesting it could act as a strong barrier to price advancement.
AUD/USD:
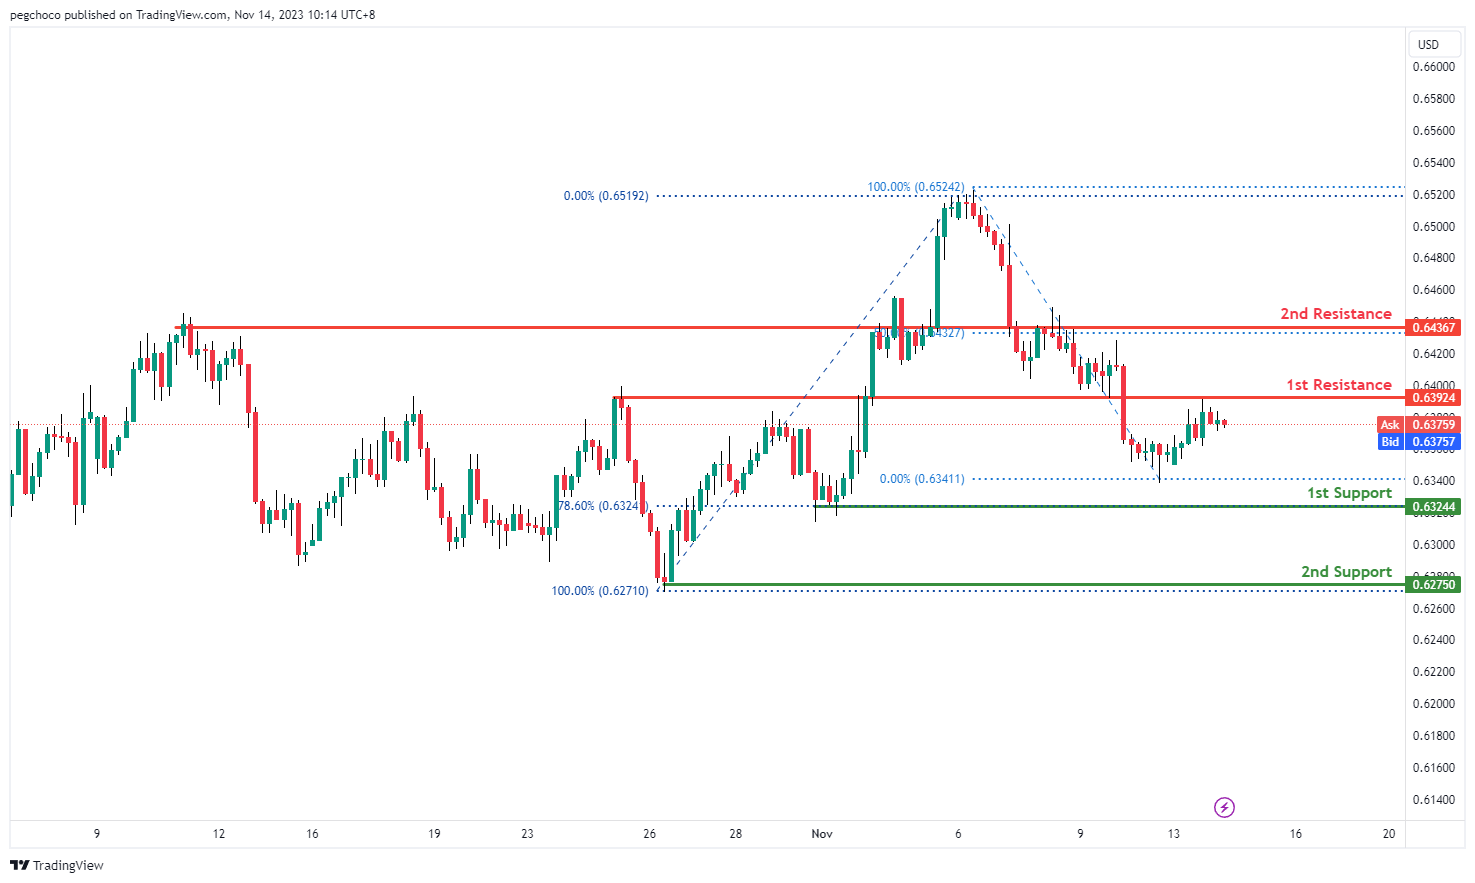
The AUD/USD chart currently exhibits a bearish overall momentum, suggesting the potential for further downward movement. Here are the key levels to watch:
1st support at 0.6324: This level is considered an overlap support and coincides with the 78.60% Fibonacci Retracement. It indicates a historical level where buyers have previously stepped in, potentially providing support and causing a bounce.
2nd support at 0.6275: This level is a swing low support, indicating its historical significance as a level of buying interest.
1st resistance at 0.6392: This level is categorized as an overlap resistance and may act as a barrier to further upside movement.
2nd resistance at 0.6436: This resistance level aligns with a 50% Fibonacci Retracement, suggesting that it could serve as a strong resistance level.
NZD/USD
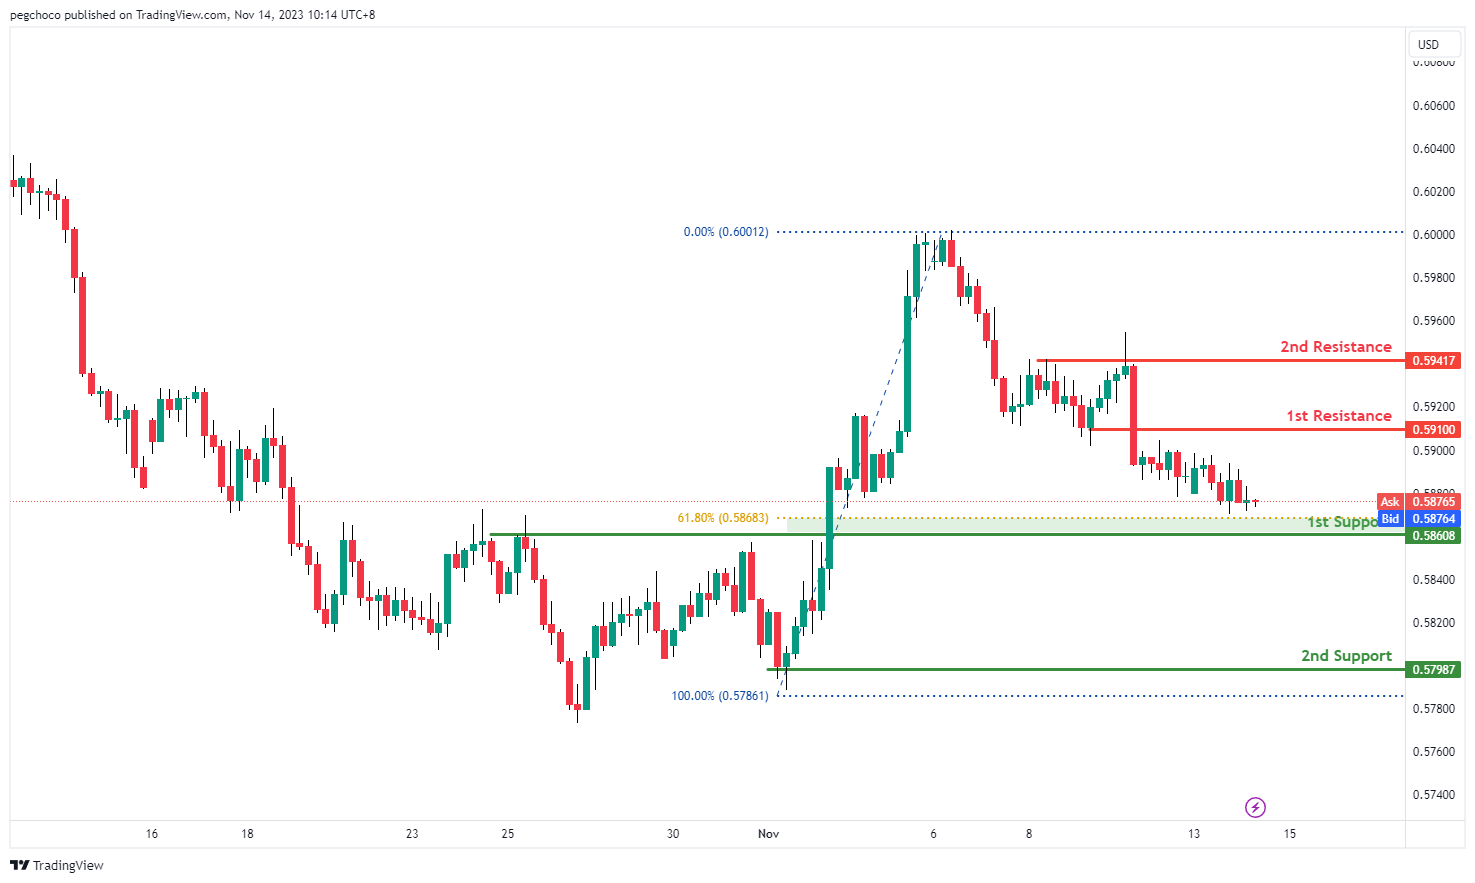
The NZD/USD chart currently exhibits a bullish overall momentum, suggesting the potential for further upward movement. Here are the key levels to watch:
1st support at 0.5860: This support level is considered a pullback support and coincides with the 61.80% Fibonacci Retracement, indicating a historical level where buyers have previously stepped in. It suggests potential support and a possible bounce from this level.
2nd support at 0.5798: This level is categorized as a swing low support, signifying its historical significance as a level of buying interest.
1st resistance at 0.5919: This resistance level is considered a pullback resistance and may act as a barrier to further upside movement.
2nd resistance at 0.5941: This resistance level aligns with a multi-swing high resistance, indicating its potential strength as a barrier to further bullish movement.
DJ30:
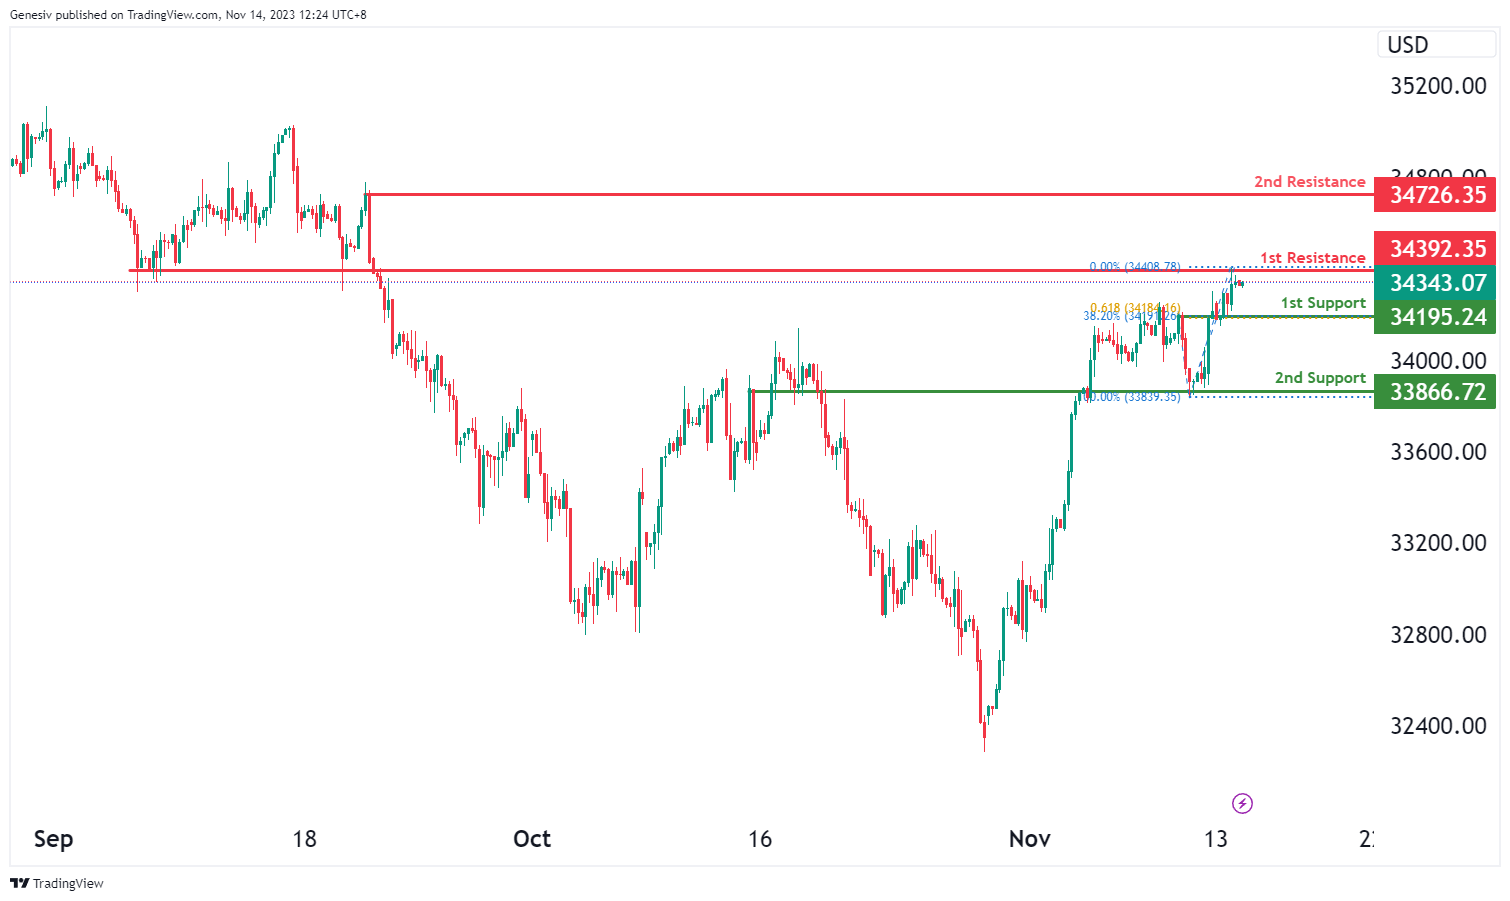
The DJ30 chart is currently showing a bearish momentum, indicating a potential bearish continuation towards the first support level at 34195.24. This support is particularly significant as it is an overlap support, demonstrating Fibonacci confluence with both the 61.80% Fibonacci Projection and the 38.20% Fibonacci Retracement.
Additionally, the second support at 33866.72 is identified as another overlap support, further reinforcing the potential strength of this support zone.
On the resistance side, the first resistance at 34392.35 is recognized as an overlap resistance, suggesting a potential area where the price might face hurdles or reversals within its downward movement. Furthermore, the second resistance at 34726.35 is marked as a swing high resistance, indicating another level of significance where the price might encounter resistance.
GER40:
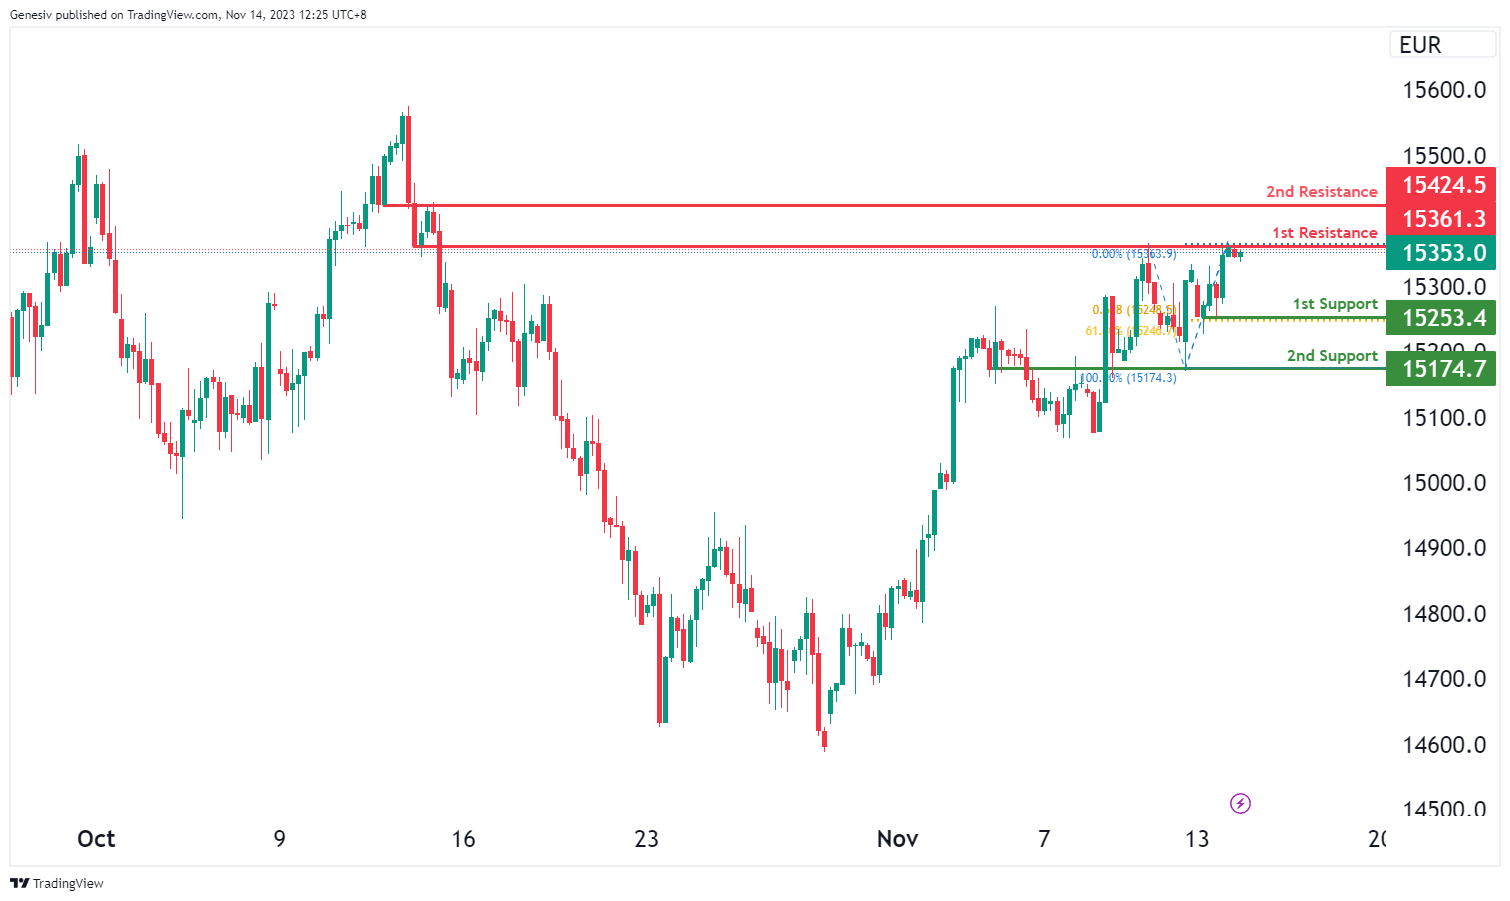
The GER40 chart is currently displaying a bearish momentum, suggesting a potential bearish reaction off the first resistance level at 15361.30, with a subsequent drop towards the first support at 15253.40. This support level is significant as it represents a multi-swing low support, and it aligns with the 61.80% Fibonacci Retracement and the 61.80% Fibonacci Projection, indicating a strong area of potential support.
Furthermore, the second support at 15174.70 is identified as an overlap support, adding to the potential strength of the support zone.
On the resistance side, the first resistance at 15361.30 is noted as an overlap resistance, suggesting a crucial point where the price might face resistance or a potential reversal. Additionally, the second resistance at 15424.50 is recognized as another overlap resistance, emphasizing its significance as a level where the price might encounter obstacles within its downward movement.
US500
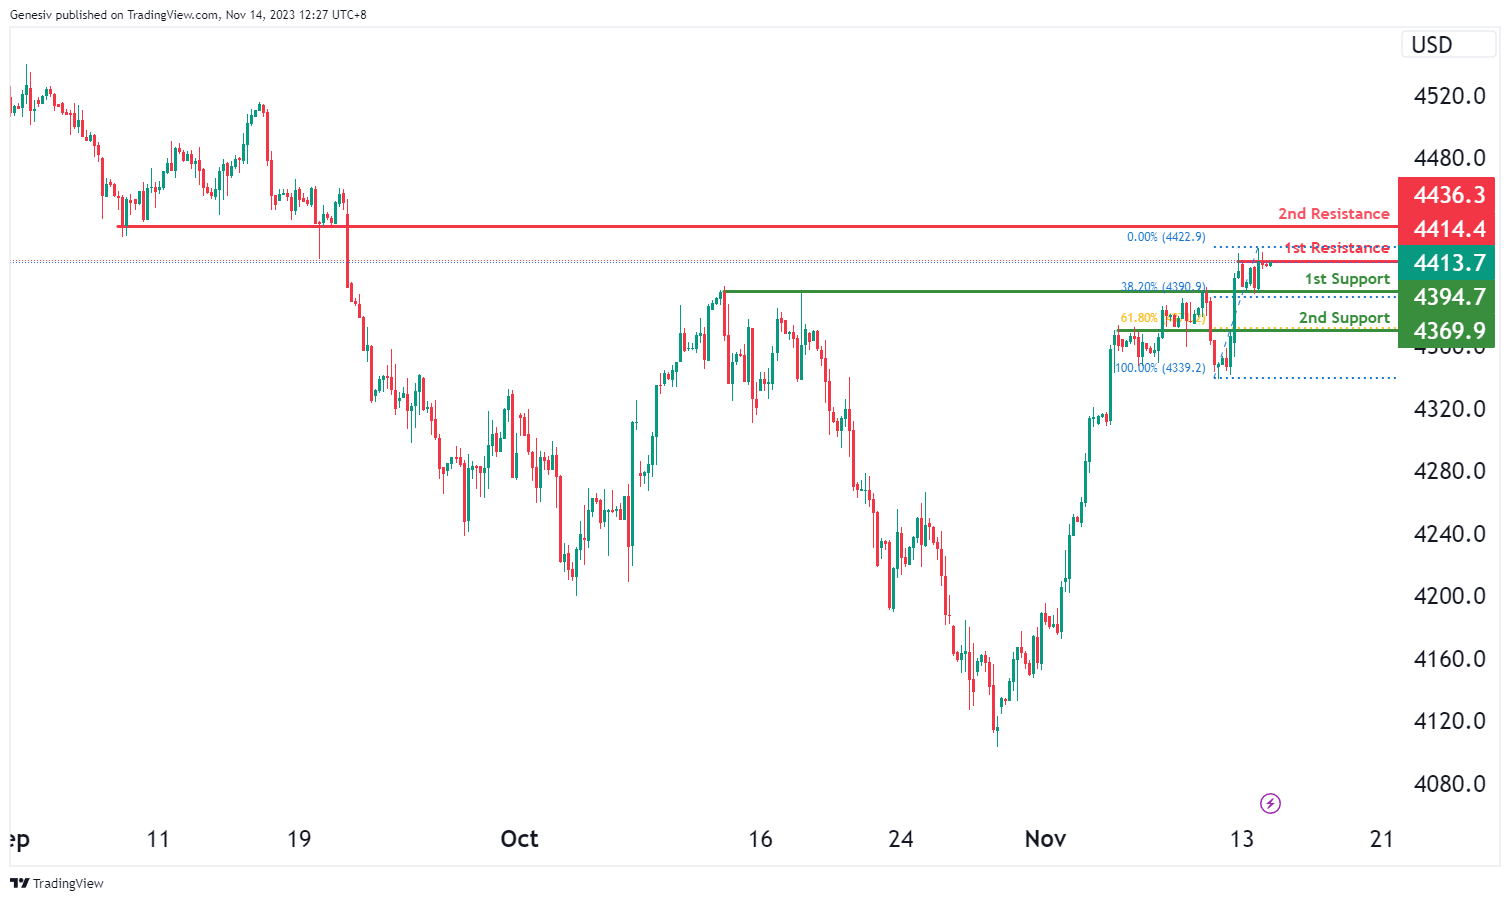
The US500 chart is currently indicating a bearish momentum, suggesting a potential bearish reaction off the first resistance level at 4414.4, leading to a drop towards the first support at 4394.7. This support is identified as an overlap support, coinciding with the 38.20% Fibonacci Retracement, indicating a significant area for potential price support.
Additionally, the second support at 4369.9 is noted as a pullback support, associated with the 61.80% Fibonacci Retracement level, further strengthening its potential as a crucial support zone.
On the resistance side, the first resistance at 4414.4 represents a point of multi-swing high resistance, indicating a significant hurdle for the price. Furthermore, the second resistance at 4436.3 is characterized as a pullback resistance, marking another level where the price might face resistance within its downward movement.
BTC/USD:
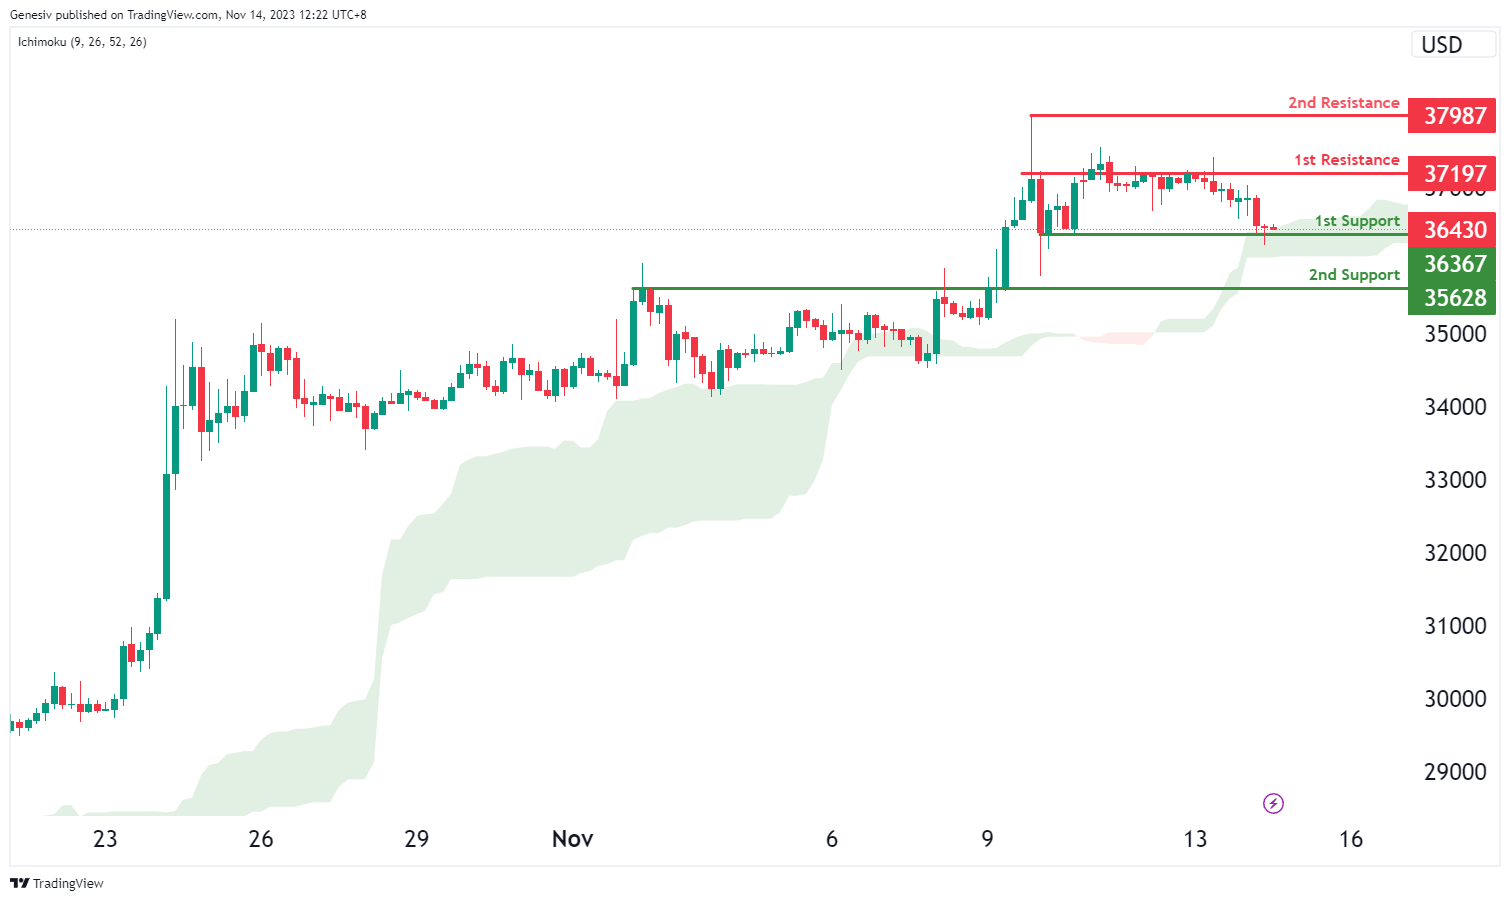
The BTC/USD chart is currently exhibiting a bullish momentum, with one of the contributing factors being that the price is above the bullish Ichimoku cloud. There’s a potential scenario where the price could make a bullish bounce off the first support level at 36367, which is identified as a multi-swing low support, and subsequently head towards the first resistance at 37197.
The second support at 35628 is recognized as a pullback support, adding to the potential strength of the support zone. On the resistance side, the first resistance at 37197 represents a point of multi-swing high resistance, indicating a significant level where the price might face hurdles. Additionally, the second resistance at 37987 is characterized by its significance as a swing high resistance, marking another potential level where the price might encounter resistance within its upward movement.
ETH/USD:
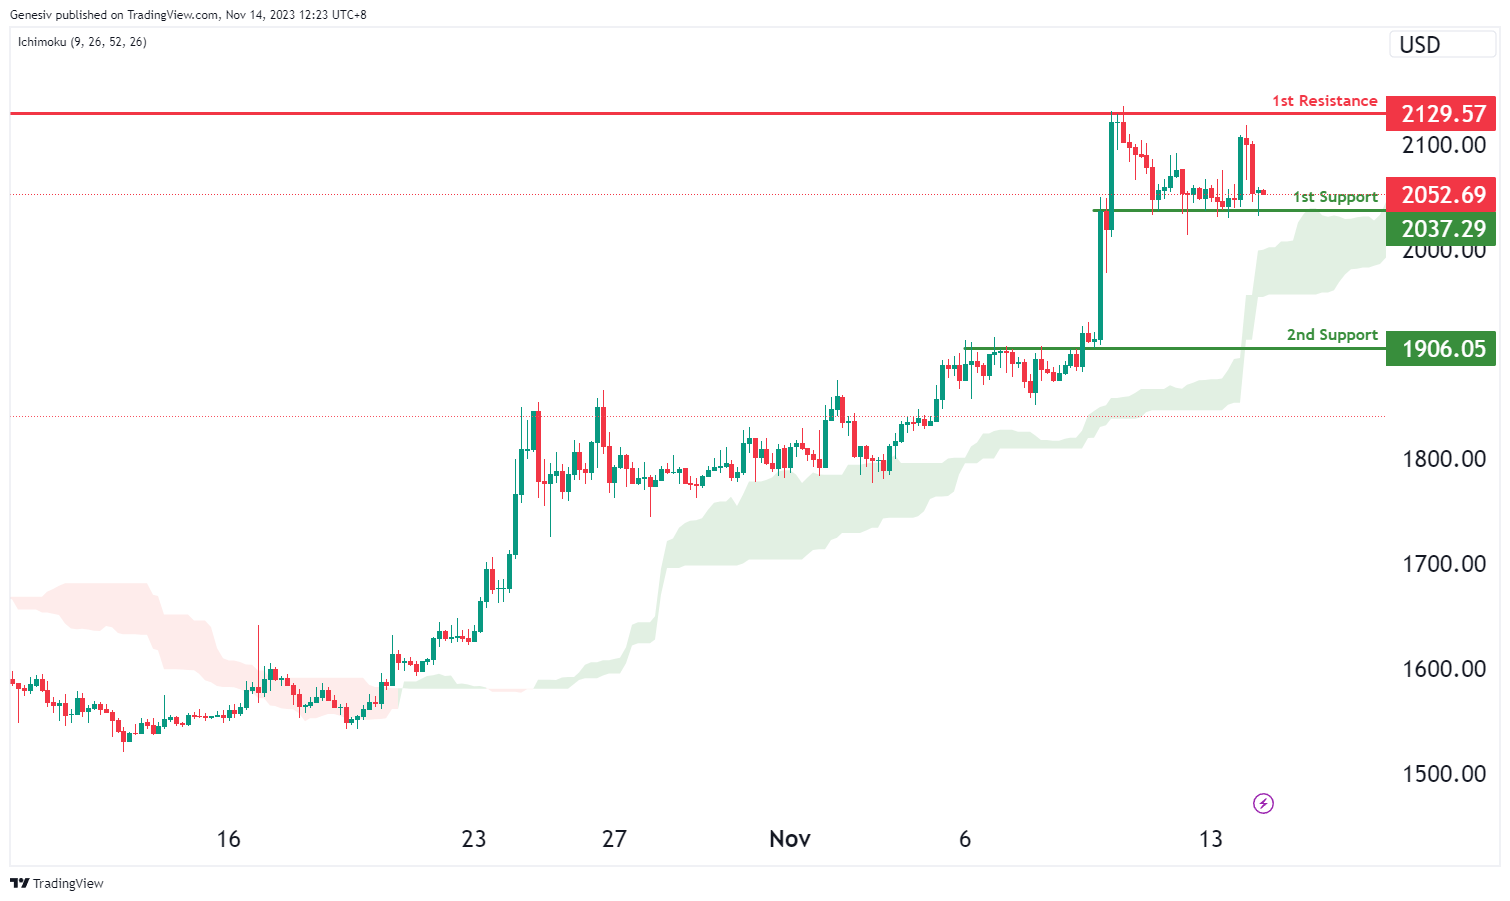
The ETH/USD chart currently displays a bullish momentum, with one of the contributing factors being that the price is above the bullish Ichimoku cloud. There’s a potential scenario where the price could make a bullish bounce off the first support level at 2037.29, identified as a pullback support, and subsequently head towards the first resistance at 2129.57.
The second support at 1906.05 is also noted as a pullback support, reinforcing the potential strength of the support zone. On the resistance side, the first resistance at 2129.57 represents a point of multi-swing high resistance, indicating a significant level where the price might encounter hurdles or reversals within its upward movement.
WTI/USD:
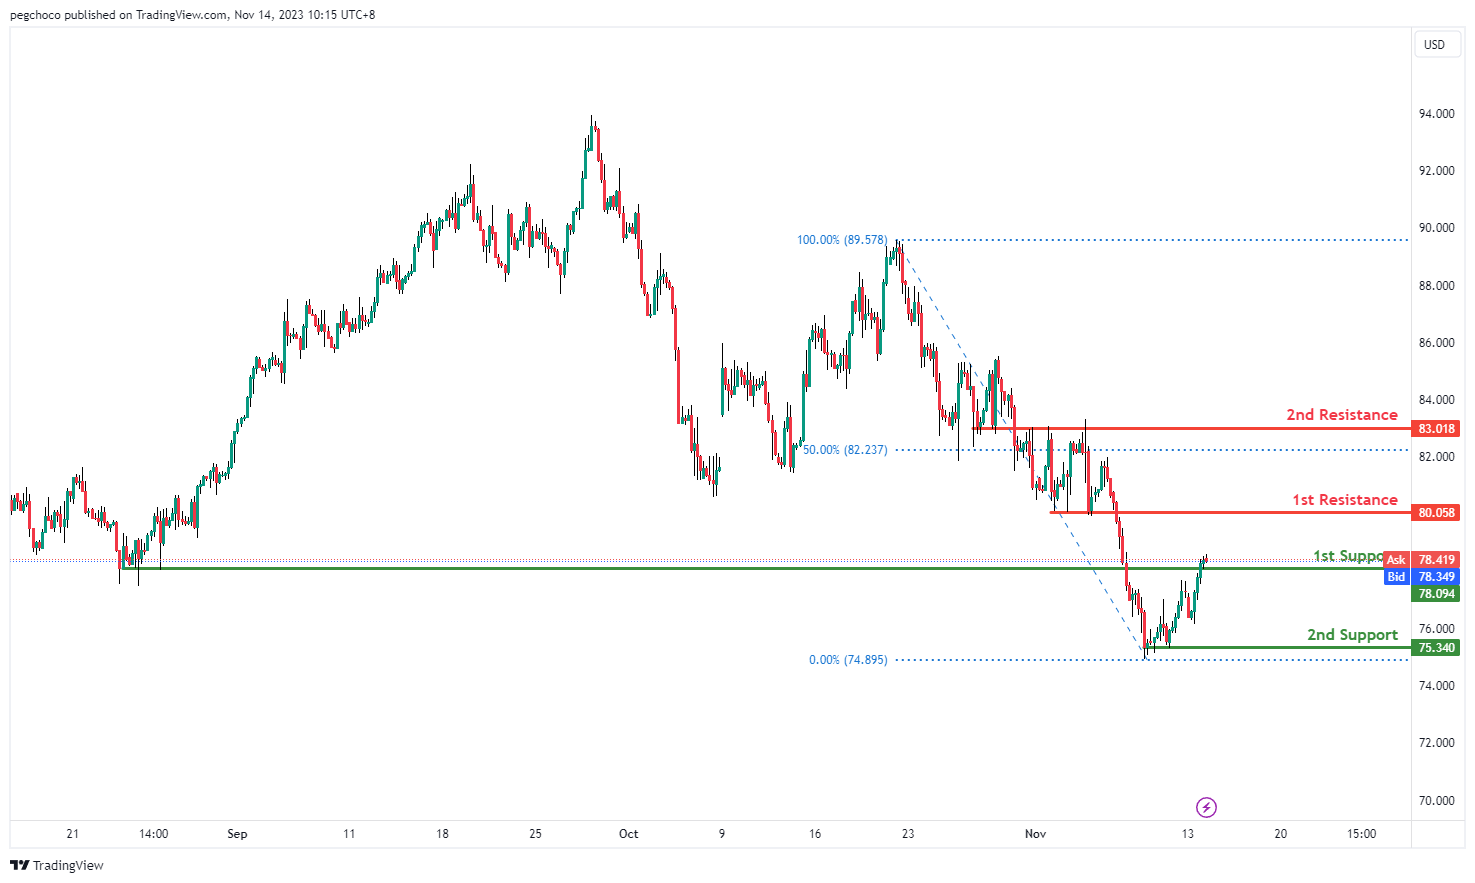
The WTI (West Texas Intermediate) chart currently shows a bullish overall momentum, suggesting the potential for further upward movement. Here are the key levels to watch:
1st support at 78.09: This support level is considered a pullback support, indicating a historical level where buyers have previously stepped in. It suggests potential support and a possible bounce from this level.
2nd support at 75.34: This level is categorized as a swing low support, signifying its historical significance as a level of buying interest.
1st resistance at 80.05: This resistance level is considered a pullback resistance and may act as a barrier to further upside movement.
2nd resistance at 83.01: This resistance level is categorized as an overlap resistance, suggesting potential strength as a barrier to further bullish movement.
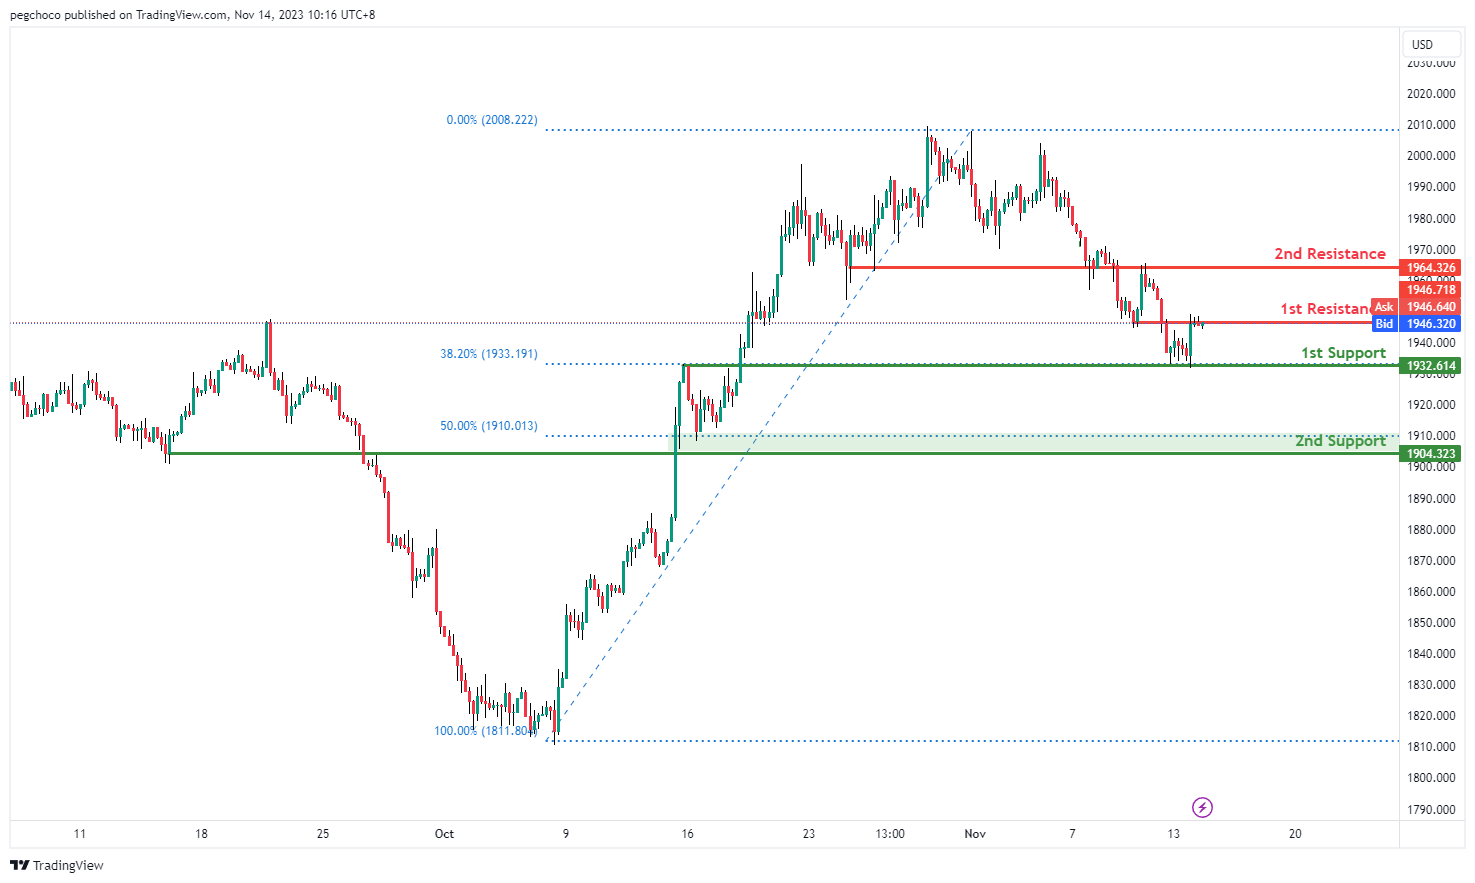
XAU/USD (GOLD):
The XAUUSD (Gold/USD), the overall momentum on the chart is currently bearish. Here are the key support and resistance levels to watch:
1st support at 1932.61: This support level is considered significant as it aligns with an overlap support and the 38.20% Fibonacci retracement level. It may act as a potential area for price to find support.
2nd support at 1904.32: This support level is also notable, as it corresponds to an overlap support and the 50% Fibonacci retracement level.
1st resistance at 1946.32: This resistance level is categorized as an overlap resistance, suggesting it could serve as a barrier to upward movement.
2nd resistance at 1964.32: Similar to the 1st resistance, this level is an overlap resistance and may also act as a significant barrier.