Sample Category Title
BTC/USD Analysis: JP Morgan Analysts Warn of a Possible Correction
Last week, the BTC/USD rate rose to the level of USD 38k per coin on the excitement associated with the expected launch of a spot Bitcoin ETF.
However, as the week begins, bitcoin price performance shows signs that the hype appears to be waning:
- the speed with which the price dropped from the upper boundary of the channel and the high of the year to the middle of the channel (about -USD 1,700 in a few hours) indicates the aggressiveness of sellers;
- the price tried to resume its upward trend, but failed. This can be seen from the downward reversals from the level of 37,500
- the fact that the slopes of trend lines (shown in black) become less sharp is also a sign of weakening bullish sentiment.
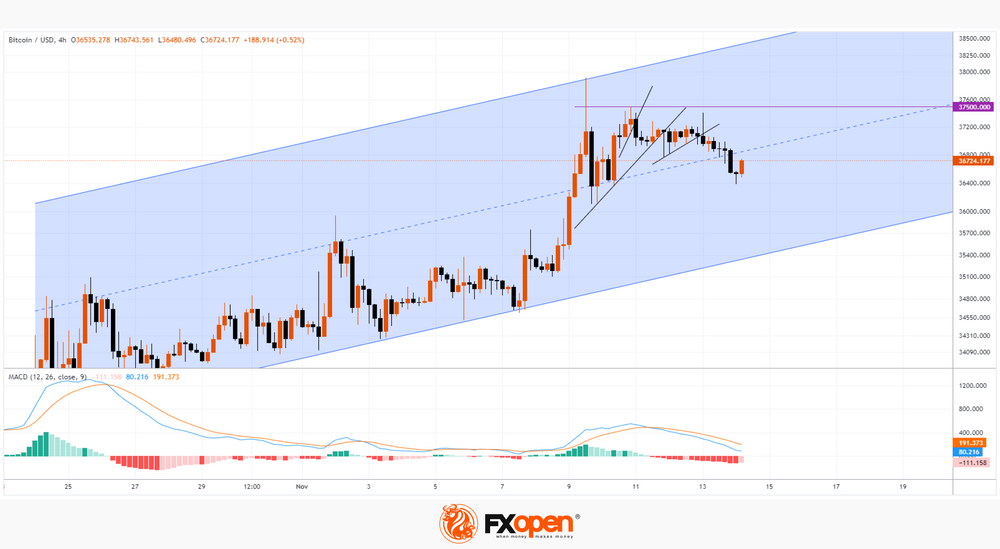
It turns out that after a pronounced surge last week, the price has already dropped below the median line of the channel, and the MACD remains in the red zone.
Moreover, JP Morgan analysts point to fundamental reasons why a correction may follow the hype. Among them:
- The fact that spot Bitcoin ETFs are already active in Switzerland and Canada. If they really wanted to, investors could invest in them rather than wait for approval from the US SEC. Therefore, if the regulator gives the go-ahead, this will not mean a sharp influx of capital from buyers.
- That the approval of spot Bitcoin ETFs in the US may already be priced in.
- The assumption that court decisions in favor of crypto companies in disputes with the SEC will do little to clarify the regulation of cryptocurrencies in the United States.
Nevertheless, there is still potential for the price of bitcoin to rise to the psychological level of 40,000, if only because the ascending blue channel has not yet been broken.
This article represents the opinion of the Companies operating under the FXOpen brand only. It is not to be construed as an offer, solicitation, or recommendation with respect to products and services provided by the Companies operating under the FXOpen brand, nor is it to be considered financial advice.
Market Cautious As Focus Falls On US CPI
Most Asian shares rose on Tuesday in cautious trading following the mixed performance from Wall Street overnight as investors braced for a key US inflation report. European markets were mixed ahead of the Germany ZEW survey expectations this morning. Looking at currencies, the yen remains stuck near a three-decade low against the dollar despite jumping in the previous session on speculation of government intervention. Sterling received a slight boost after average weekly earnings beat forecasts this morning. Although the dollar remains rangebound, the incoming US inflation data, string of significant economic data this week, speeches by numerous Fed officials, and the threat of a potential US government shutdown could rock the currency.
Dollar on standby ahead of CPI
The October US Consumer Price Index (CPI) report may heavily influence expectations around the Fed's policy outlook beyond 2023.
Headline inflation is expected to have cooled to 3.3% compared to 3.7% in the prior month due to falling global energy prices, with annual core inflation unchanged at 4.1%, its lowest level since September 2021. As of writing, traders are currently pricing in just above a 25% probability of a 25-basis point hike by January 2024 with markets expecting the Fed’s first rate cut in July.
Ultimately, further evidence of cooling inflationary pressures may reinforce the argument around the Fed being done with hikes, despite recent hawkish remarks from central bank officials. However, if inflation prints above forecasts, this could boost speculation around the Fed raising rates in the early part of 2024.
SNB’s Jordan: Price stability not ensured, won’t hesitate to tighten further
In today's remarks at a central bank conference in Zurich, SNB Chairman Thomas Jordan warned that "price stability may not yet be ensured." He pledged that the central bank "will not hesitate to tighten monetary policy further if necessary."
This statement comes as inflation have dipped and interest rates have risen compared to last year, presenting a challenging environment for policy to balance the risk of tightening too much and too little.
"Given the high uncertainty regarding the economic outlook, there is no clearly mapped-out path for monetary policy in the near future," he remarked.
With SNB's next policy meeting scheduled for December 15, market expectations currently lean towards maintaining policy rate at 1.75%.
GBP/JPY Daily Outlook
Daily Pivots: (S1) 185.42; (P) 185.87; (R1) 186.75; More...
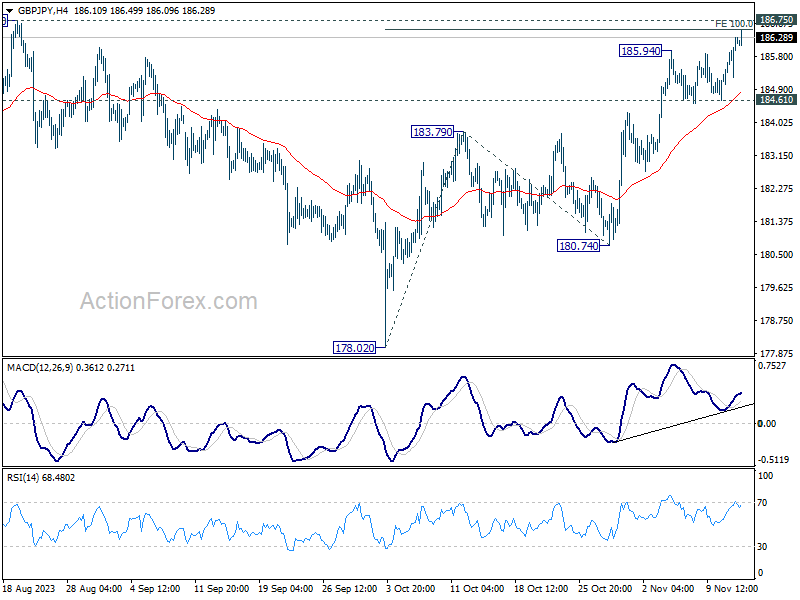
GBP/JPY's rally resumed by breaking through 185.94 and intraday bias is back on the upside. Decisive break of 186.75 resistance will confirm resumption of larger up trend. Next target will be 161.8% projection of 178.02 to 183.79 from 180.74 at 190.07. On the downside, break of 184.61 support is needed to indicate short term topping. Otherwise, further rise will remain in favor in case of retreat.
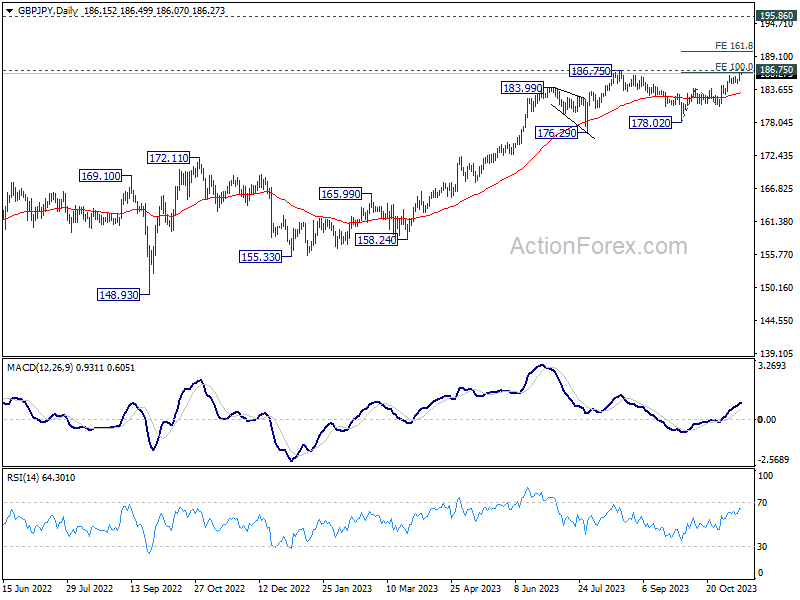
In the bigger picture, as long as 176.29 support holds, larger up trend from 123.94 (202 low) should still be in progress. Break of 186.75 will target 195.86 (2015 high). Nevertheless, firm break of 176.29 will confirm medium term topping, and bring lengthier and deeper consolidations.
EUR/JPY Daily Outlook
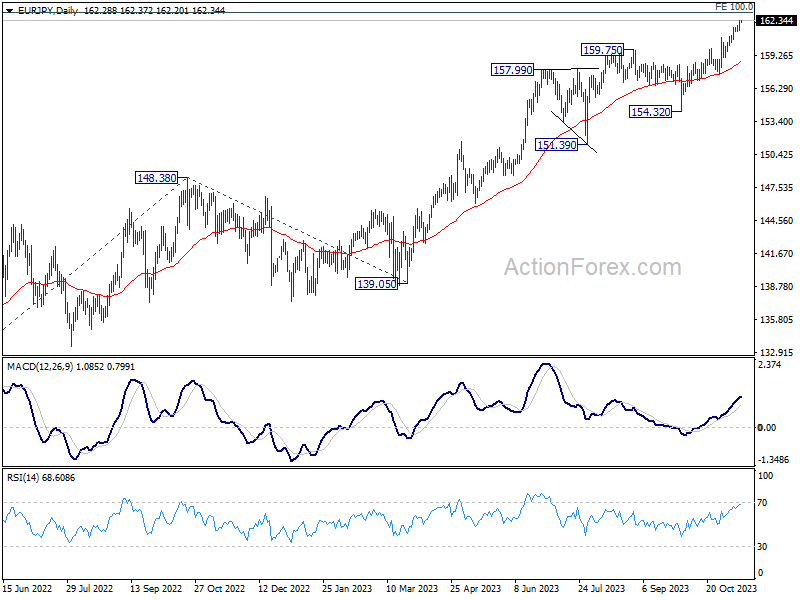
Daily Pivots: (S1) 161.78; (P) 162.08; (R1) 162.61; More....
Intraday bias in EUR/JPY remains on the upside at this point. Current rally should target 163.06 projection level next. Strong resistance could be seen there to limit upside on first attempt. On the downside, below 161.34 minor support will turn intraday bias neutral and bring consolidations first, before staging another rise.
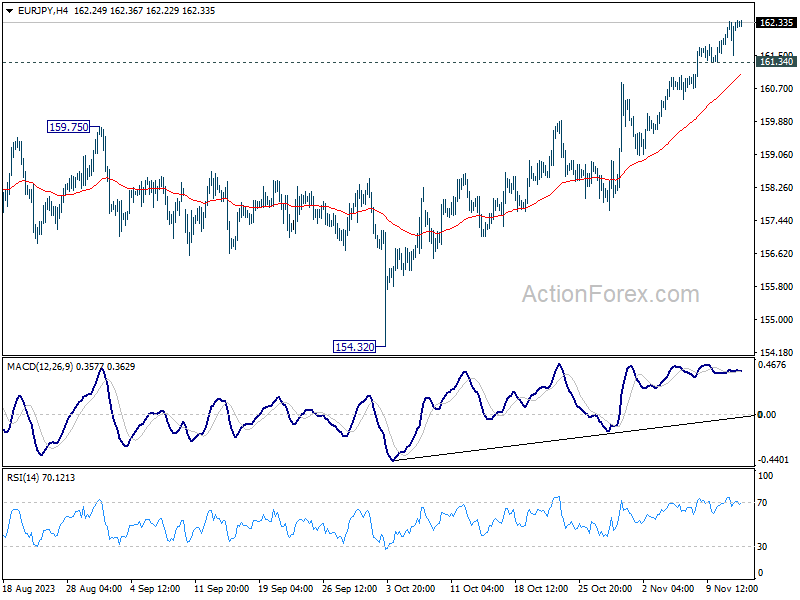
In the bigger picture, rise from 114.42 (2020 low) is in progress. Next target is 100% projection of 124.37 to 148.38 from 139.05 at 163.06. Sustained break there will target 169.96 (2008 high). On the downside, break of 154.32 support is needed to be the first sign of medium term topping. Otherwise, outlook will remain bullish even in case of deep pullback.
EUR/GBP Daily Outlook
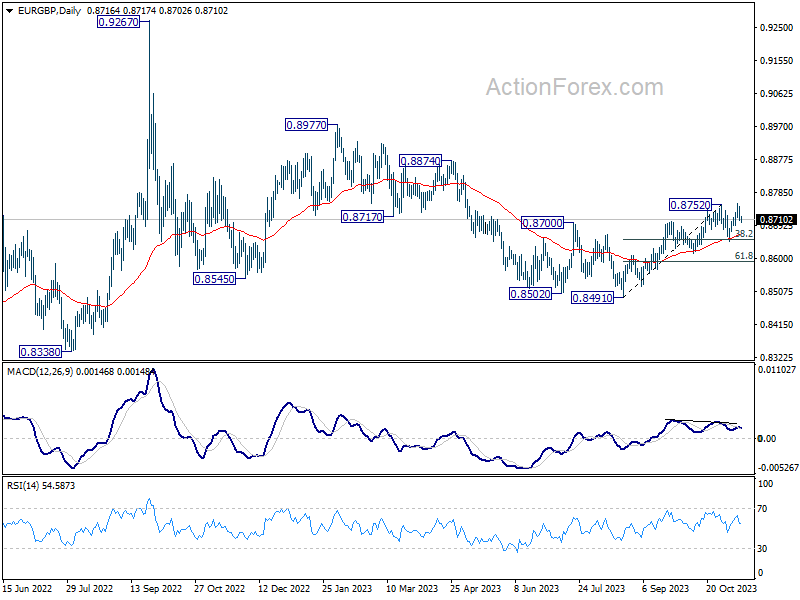
Daily Pivots: (S1) 0.8698; (P) 0.8723; (R1) 0.8738; More....
Intraday bias in EUR/GBP is mildly on the downside at this point. Fall from 0.8754 is seen as the third leg of the consolidation pattern from 0.8752, and should target 0.8648. But strong support should be seen around there to complete the consolidation. On the upside, decisive break of 0.8752/4 will resume whole rise from 0.8491 to 0.8874 resistance next.
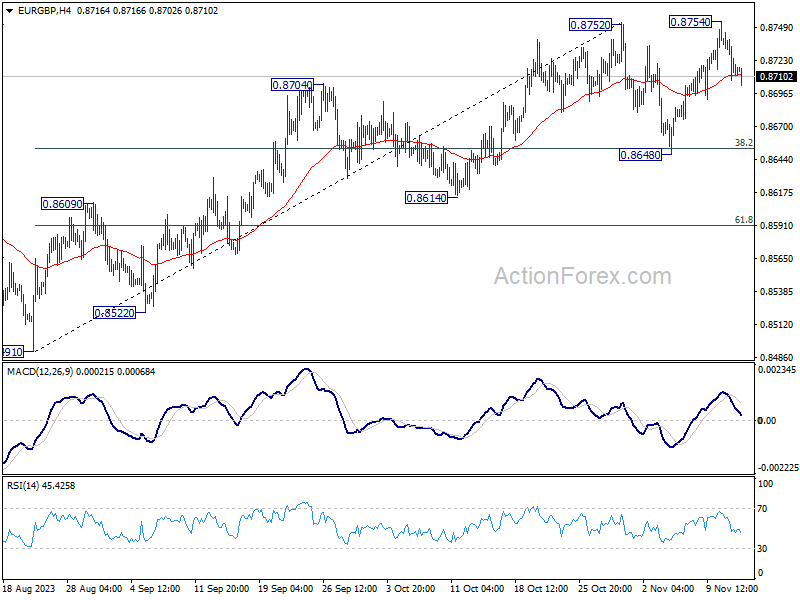
In the bigger picture, current development suggests that whole down trend from 0.9267 (2022 high) has completed with three down to to 0.8491. Rise from 0.8491 is seen as another leg inside that pattern from 0.9499 (2020 high). Further rally should be seen to 0.8977 resistance and above. This will remain the favored case as long as 0.8614 support holds.
EUR/AUD Daily Outlook
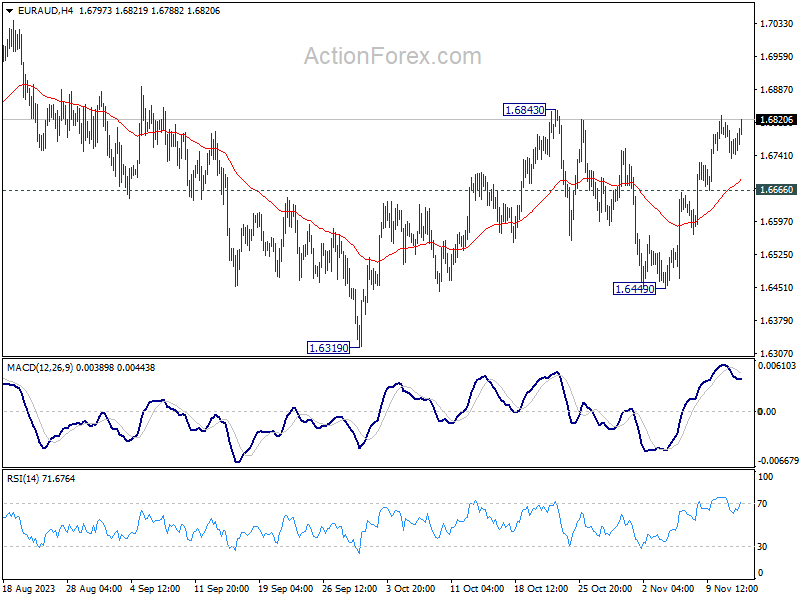
Daily Pivots: (S1) 1.6737; (P) 1.6780; (R1) 1.6821; More...
Focus stays on 1.6843 resistance in EUR/AUD. Decisive break there will resume the rebound from 1.6319 for retesting 1.7062 high next. On the downside, however, below 1.6666 minor support will turn bias back to the downside for 1.6449 support instead.
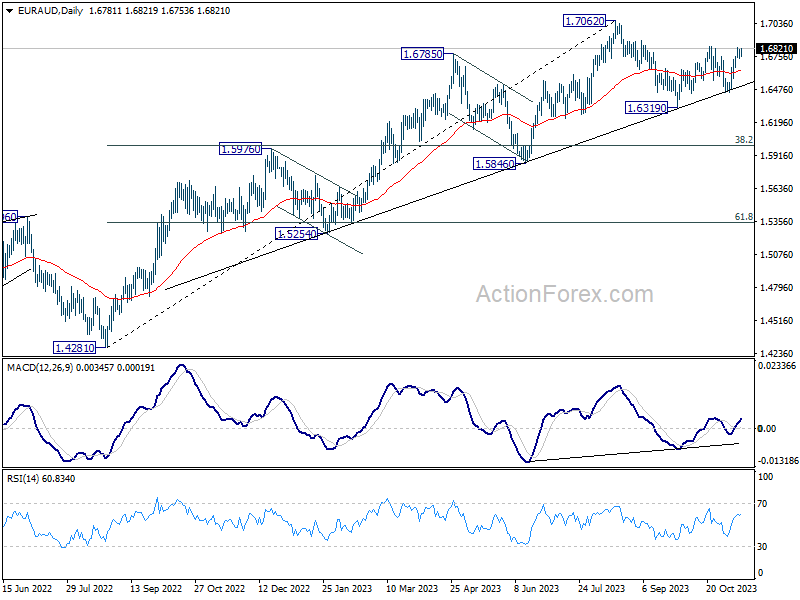
In the bigger picture, while 1.7062 is a medium term top, there is no clear sign of trend reversal as EUR/AUD continues to draw strong support from the medium term trend line. Break of 1.7062 will resume the larger up trend from 1.4281 (2022 low) to 1.7691 fibonacci level. Nevertheless, break of 1.6449 support will argue that deeper correction is underway to 38.2% retracement of 1.4281 to 1.7062 at 1.6000.
EUR/CHF Daily Outlook
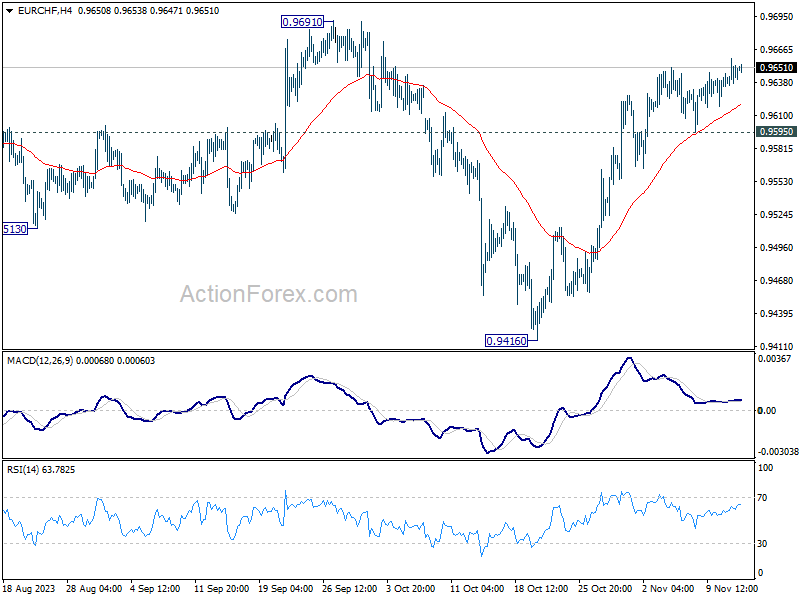
Daily Pivots: (S1) 0.9635; (P) 0.9648; (R1) 0.9659; More...
Intraday bias in EUR/CHF remains on the upside for the moment. Current rise from 0.9416 should target 0.9691 resistance. Firm break there will argue that whole decline from 1.0095 has completed, just ahead of 0.9407 support (2022 low). Nevertheless, break of 0.9595 support will indicate short term topping, and turn bias back to the downside for deeper pull back.
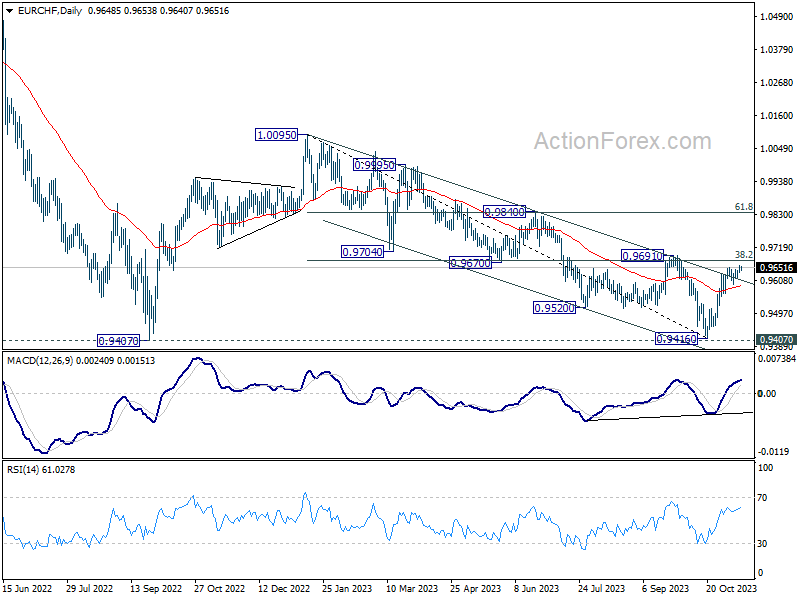
In the bigger picture, fall from 1.0095 (2023 high) might have completed at 0.9416, just ahead of 0.9407 support (2022 low). Sustained break of 0.9691 cluster resistance (38.2% retracement of 1.0095 to 0.9416 at 0.9675) will pave the way to 61.8% retracement at 0.9836 and above. However, rejection by 0.9691 will maintain medium term bearishness for another test on 0.9407 at least.
Next Move for USD Can Be Defined by US CPI Data
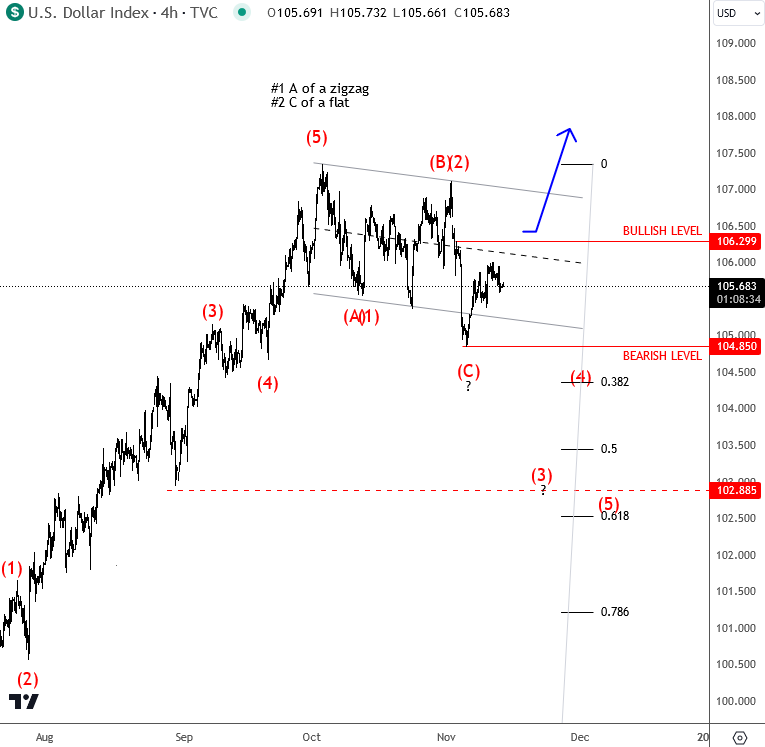
The US CPI is going to be an important event today, where investors will define next important move for the markets, as it may become clearer if FED really did not do enough to fight inflation, or if maybe Powell will stay on hold after all. Expectations are 3.3% (y/y) down from 3.7%, and one of the reasons for a drop in inflation figures can certainly be crude oil prices that came down in the second part of October. So if expectations are met, the USD can eihter come down or stay sideways, but if data disappoints then DXY will move sharply higher with US yeilds while stocks can make a pullback which is technically expected as talked about in our video below.
Looking at the DXY, index has only three legs down from the highs, and if price can move beyond 106.30 and finish the day above that level, then bulls can be back for 108. On the other-hand, drop and break below 104.85 will be bearish for DXY.
https://www.youtube.com/watch?v=nt0DObj71EU&t=165s
Platinum (PL) Ended Correction and Turning Higher
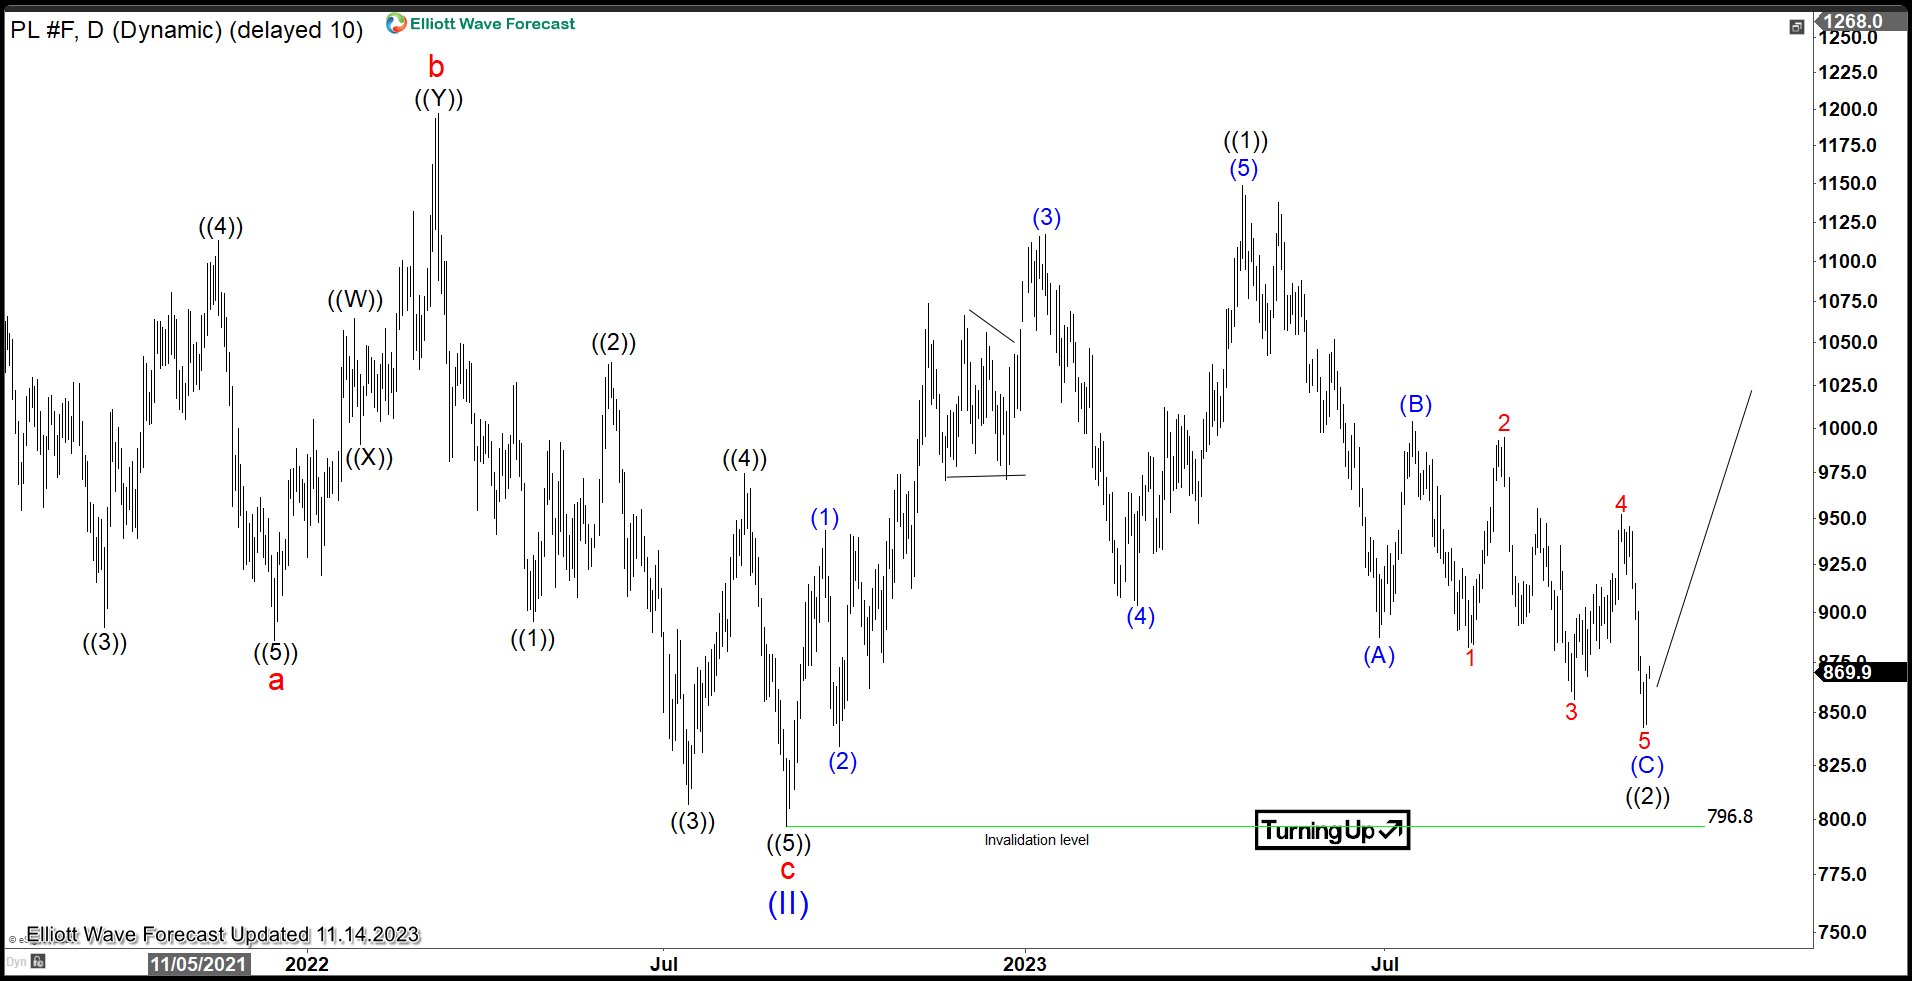
Platinum (PL) may have ended the correction to the cycle from 9.1.2022 low and in the early stage of turning higher. If the pivot on September 2022 low at 796.8) breaks, it suggests a bigger correction against March 2020 low within wave (II) which is not our primary view at the moment. In the higher time frame, the metal is in a bullish grand super cycle move higher against March 2020 low.
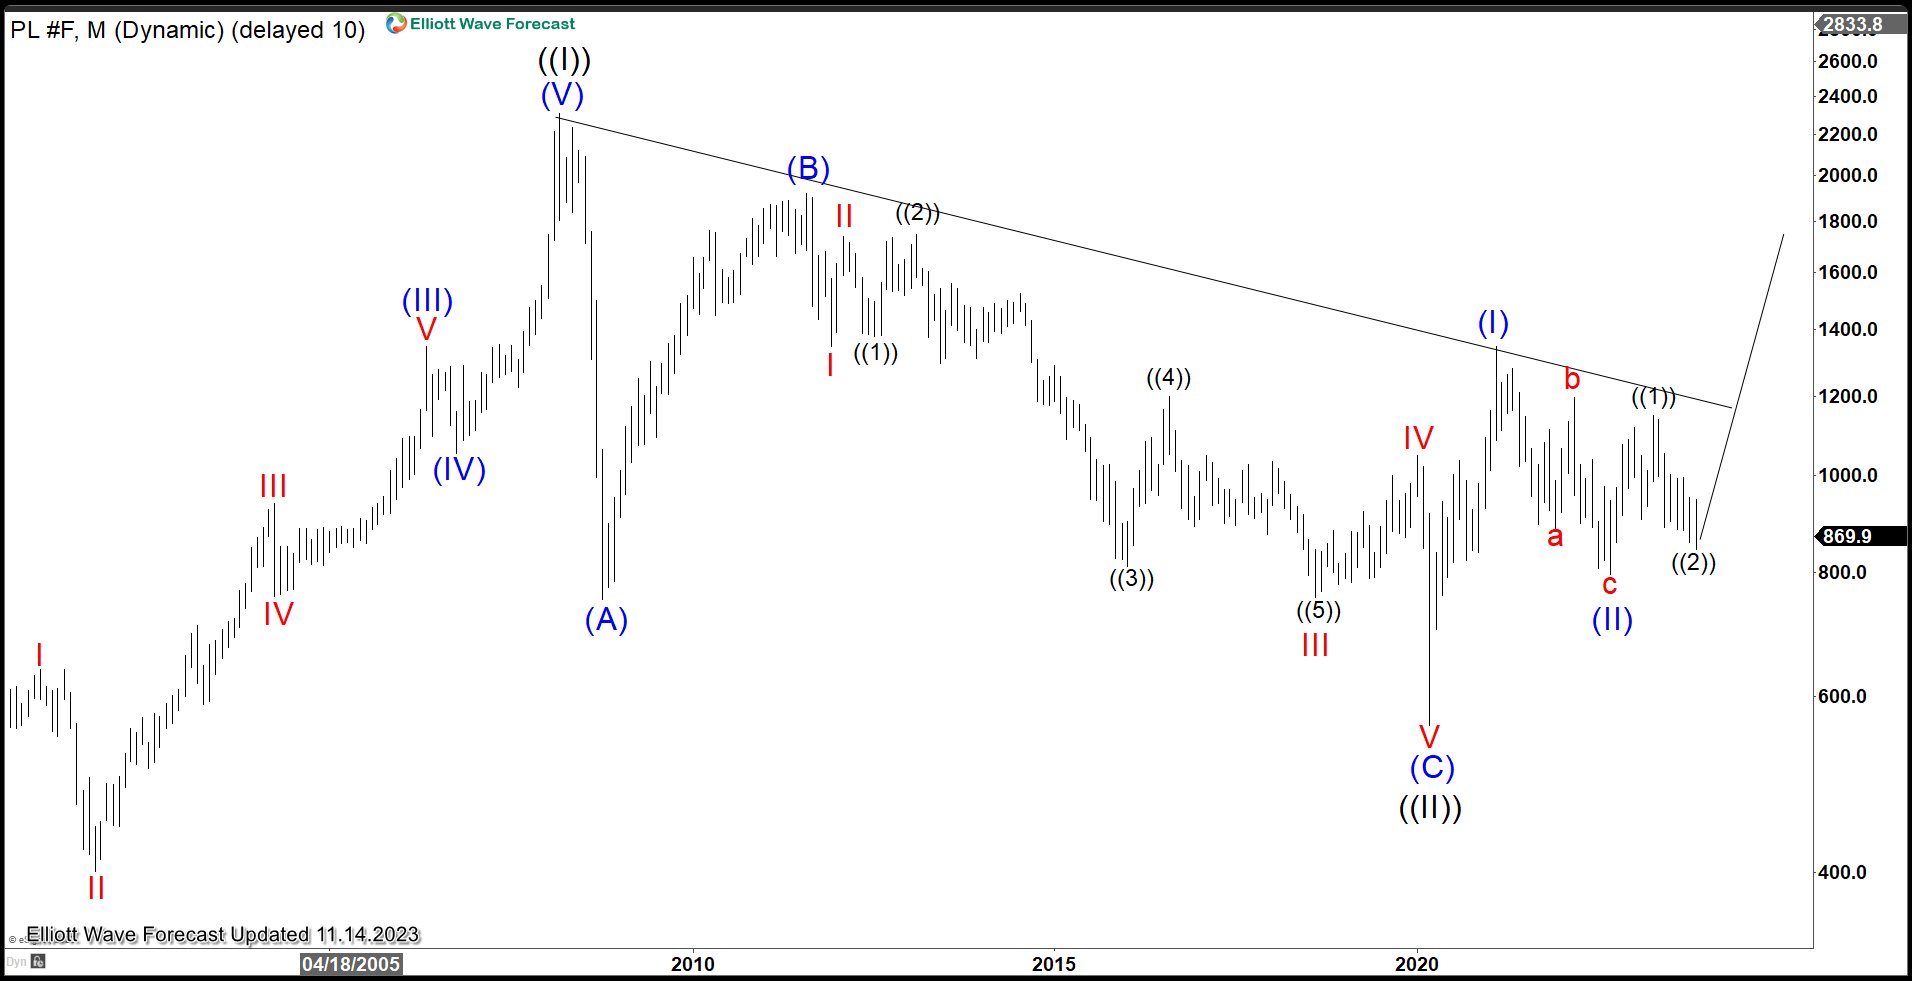
Platinum (PL) Monthly Elliott Wave Chart
Monthly chart of Platinum above shows that the metal ended wave ((II)) at 562 during the Covid-19 crash. It has since turned higher in wave ((III)). Up from wave ((II)), the rally is in progress as an impulse. Wave (I) of ((III)) ended at 1348.2 while dips in wave (II) of ((III)) ended at 796.8. The metal has since turned higher in wave (III). Up from wave (II), wave ((1)) ended at 1148.9 and dips in wave ((2)) might have ended at 843.1. The metal can be in the early stage of the next leg higher.
Platinum (PL) Daily Elliott Wave Chart
Daily chart of Platinum above shows that the metal ended wave (II) at 796.8 and turned higher in wave (III). Up from wave (II), wave ((1)) ended at 1148.9 and dips in wave ((2)) ended at 843.1. Expect the metal to extend higher while it stays above 796.8 in the first degree. If the metal breaks below 796.8, then it will do a double correction against March 2020 low at 562.