

Sample Category Title
USD/CAD Daily Outlook
Daily Pivots: (S1) 1.3763; (P) 1.3790; (R1) 1.3833; More...
Intraday bias in USD/CAD stays mildly on the upside, as rebound from 1.3627 is in progress. Further rally should be seen to retest 1.397 resistance. On the downside, below 1.3734 minor support will turn bias back to the downside, to extend the corrective pattern from 1.3897 with another leg. But in this case, strong support should be seen from 38.2% retracement of 1.3091 to 1.3897 at 1.3589 to bring rebound.
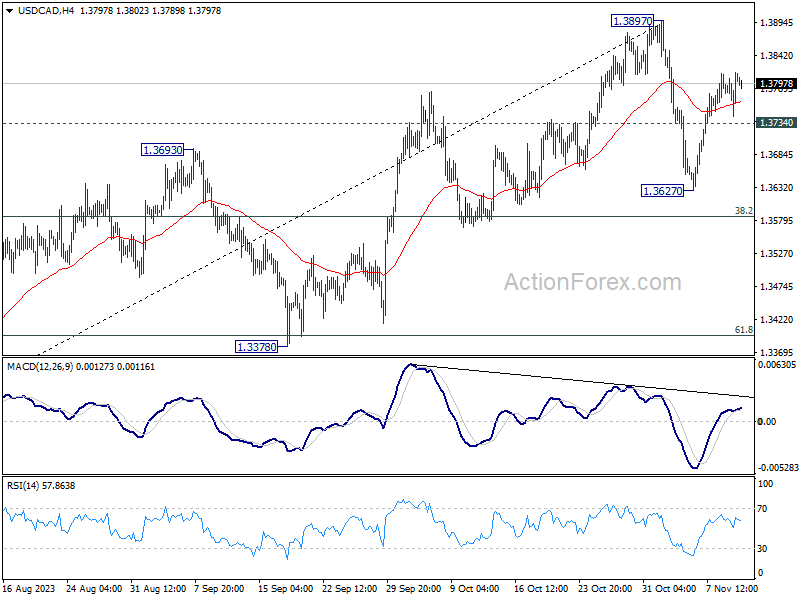
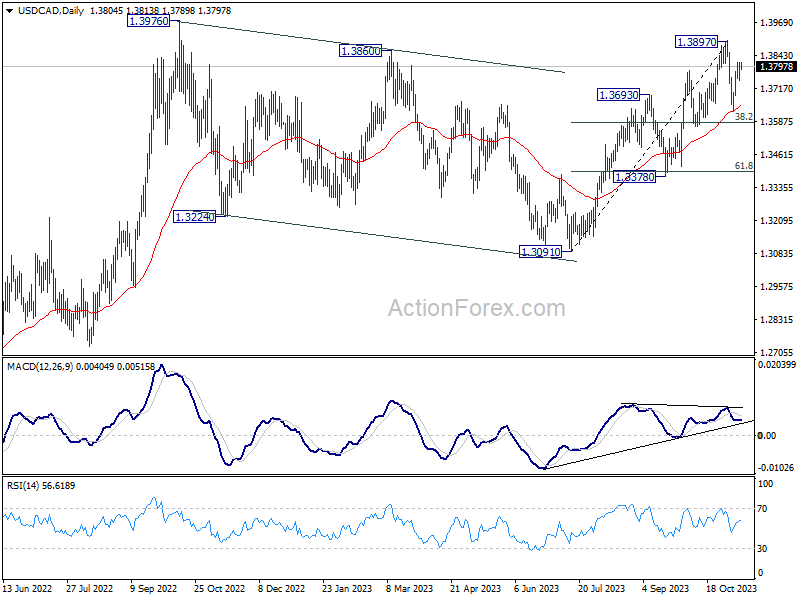
In the bigger picture, corrective pattern from 1.3976 (2022 high) should have completed with three waves down to 1.3091. Decisive break of 1.3976 high will confirm resumption of up trend from 1.2005 (2021 low). This will now remain the favored case as long as 1.3378 support holds. However, firm break of 1.3378 will argue that the pattern from 1.3976 is indeed still extending.
Gold Price Corrects Gains and Crude Oil Price Tumbles
Gold price is correcting gains below the $1,980 support. Crude oil prices declined heavily below the $80.00 support and moved into a bearish zone.
Important Takeaways for Gold and Oil Prices Analysis Today
- Gold price failed to settle above the $2,000 region and moved lower against the US Dollar.
- It broke a major bearish trend line with resistance near $1,958 on the hourly chart of gold at FXOpen.
- Crude oil prices dived toward the $75 zone before the bulls appeared.
- A key bearish trend line is forming with resistance near $76.90 on the hourly chart of XTI/USD at FXOpen.
Gold Price Technical Analysis
On the hourly chart of Gold at FXOpen, the price struggled to settle above the $2,000 resistance. The price started a fresh decline below the $1,980 pivot level.
The price traded below the $1,965 support and the 50-hour simple moving average. It tested the $1,945 zone. A low is formed near $1,944.71 and the price is now attempting a fresh increase. It broke a major bearish trend line with resistance near $1,958.
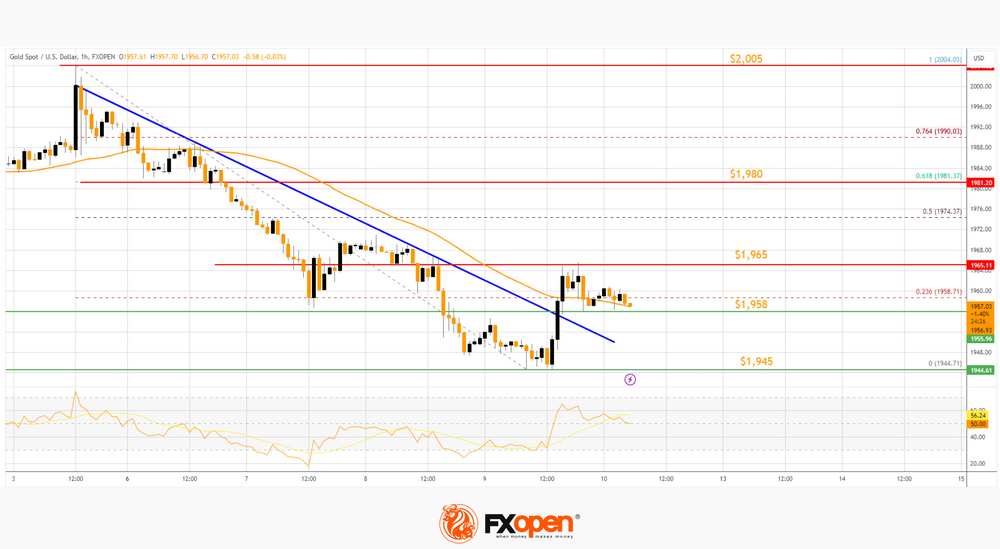
There was also a spike above the 23.6% Fib retracement level of the downward move from the $2,005 swing high to the $1,945 low. It is now facing resistance near the $1,965 level.
The next major resistance is near the 61.8% Fib retracement level of the downward move from the $2,005 swing high to the $1,945 low at $1,980, above which the price could test the $2,005 resistance.
The next major resistance is $2,020. An upside break above the $2,020 resistance could send Gold price toward $2,032. Any more gains may perhaps set the pace for an increase toward the $2,050 level.
Initial support on the downside is near the $1,958 level. The first major support is near the $1,945 level. If there is a downside break below the $1,945 support, the price might decline further. In the stated case, the price might drop toward the $1,920 support.
Oil Price Technical Analysis
On the hourly chart of WTI Crude Oil at FXOpen, the price struggled to continue higher above $83.30 against the US Dollar. The price formed a short-term top and started a fresh decline below $80.00.
There was a steady decline below the $78.00 pivot level. The bears even pushed the price below $77.00 and the 50-hour simple moving average. Finally, the price tested the $75.00 zone. A low is formed near $74.90 and the price is now consolidating losses.
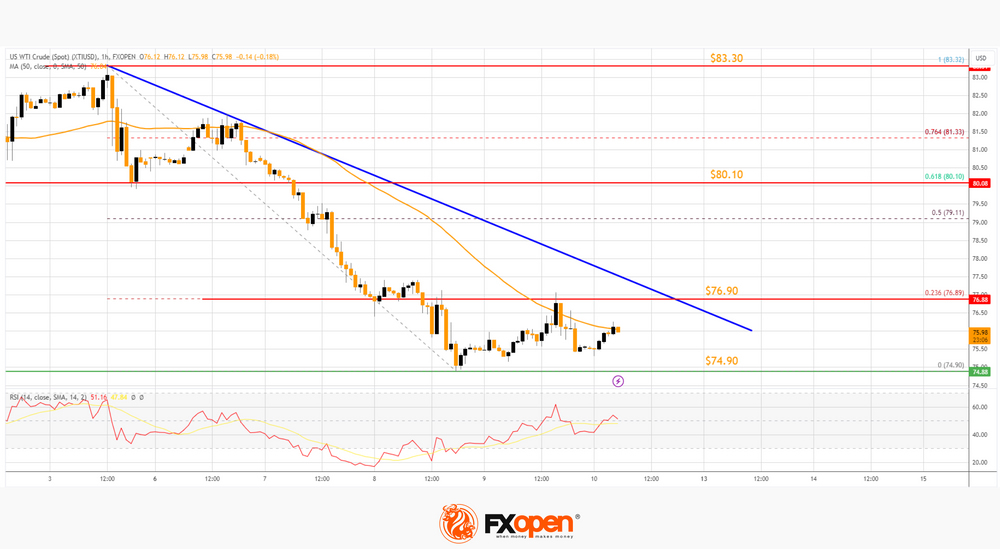
It is stuck near the 50-hour simple moving average. Immediate support is near the $74.90 level. The next major support on the WTI crude oil chart is near $74.20. If there is a downside break, the price might decline toward $72.50. Any more losses may perhaps open the doors for a move toward the $70.00 support zone.
On the upside, immediate resistance is near a key bearish trend line at $76.90. The trend line is near the 23.6% Fib retracement level of the downward move from the $83.32 swing high to the $74.90 low.
A clear move above the trend line resistance could send the price toward $80.10. It coincides with the 61.8% Fib retracement level of the downward move from the $83.32 swing high to the $74.90 low.
The next key resistance is near $83.30. If the price climbs further higher, it could face resistance near $85.00. Any more gains might send the price toward the $88.00 level.
This article represents the opinion of the Companies operating under the FXOpen brand only. It is not to be construed as an offer, solicitation, or recommendation with respect to products and services provided by the Companies operating under the FXOpen brand, nor is it to be considered financial advice.
Fed Chair Stressed Progress Toward 2.0% Inflation Goal Not Assured
Markets
After further bond gains post the softer than expected US data last week, sentiment changed course yesterday. Several ECB speakers including Vice President de Guindos warned that it’s premature to open the debate on rate cuts as inflation risks linger. Core yields at several maturities testing key support levels also made a further decline (in yields) less evident. However, moves mostly remained gradual during European trading hours. The German 2-y yield even declined 0.9 bps. The 10-y gained 3.0 bps. The 30-y underperformed (+7.0 bps). Later in US dealings, the $24 bln 30-y US Treasury auction went much more difficult compared to the 3 & 10-y sales earlier this week. A substantial yield concession put additional pressure especially at the longer end of the curve. Fed Chair Powell later at the IMF’s annual research conference also held some kind of ‘leaning against the wind’ attitude. He reiterated that the Fed can move carefully to both ‘address the risk of being misled by a few good months and the risk of overtightening’. Despite this two-sided risk, the Fed Chair stressed that progress toward to 2.0% goal is not assured and that the Fed won’t hesitate to tighten policy further if this would turn out to be appropriate. On broader financial conditions, Powell indicated that the Fed takes higher long-term yields into account, but it depends on how long the market move lasts. After Powell’s comments short-term yields also jumped higher but in the end the curve still bear steepened with the 2-y adding 8.9 bps while the 30-y jumped 15 bps. The 2-y yield again closed just north of 5%. The rise in US yields both due to the poor 30-y auction and Powell’s comments also pushed equities back in red (Dow -0.65%, Nasdaq -0.94%). The EuroStoxx 50 earlier closed with a nice +1.21%, regaining the 4200 mark. The dollar extended its comeback (DXY 105.91, EUR/USD 1.067), but the technical picture after all remains neutral. USD/JPY (close 151.35) again nears the multi-year peak levels (YTD top 151.72/2022 top 151.95).
Asian equity markets this morning join the setback on WS yesterday evening. Treasury yields are easing marginally. The dollar trades little changed (EUR/USD 1.067, DXY 105.9). Later today, November Consumer confidence of the University of Michigan will be published. Markets will keep a close look at the inflation expectations measures of the report. Also look out for an interview of ECB’s Lagarde with Martin Wolf for the FT. We expect the ECB Chair to reiterate that it is much too early to call victory on inflation. EMU yields probably still have some catching up to do after yesterday’s rise in the US. The first estimate of the UK Q3 GDP this morning was reported unchanged (0.0% Q/Q), slightly better than expected (-0.1%). However, the details were unconvincing with private consumption, government spending and gross fixed capital formation all declining on a quarterly basis. On the other hand, September activity data (especially services) where not that bad. In a first reaction, sterling gains marginally (EUR/GBP 0.8725).
News & Views
The Reserve Bank of Australia published its quarterly Statement on Monetary Policy following this week’s meeting when it lifted the policy rate by 25 bps to 4.35%. Detailed forecasts show a somewhat stronger growth path (1.25% for year-ended Dec23 from 1% and 2% for year-ended Dec24 from 1.75%) in combination with a more stubborn return of inflation towards the 2-3% inflation target (3% for year-ended Dec25 from 2.75%). Unemployment is expected to peak at 4.25% in Dec24 and stay there over the policy horizon. Back in July, the RBA estimated a 4.5% peak with unemployment ticking up faster. AUD/USD just like on Tuesday fails to profit from the slightly more hawkish RBA with AUD/USD holding around 0.6370.
Portuguese president Marcelo Rebelo de Sousa set March 10 as next (snap) general election date following this week’s resignation by Socialist PM Costa in the aftermath of a corruption investigation. Costa’s chief of staff Vitor Escaria and infrastructure minister Joao Galamba are central in the probe with PM Costa suspected of interventions to unblock procedures. Ruling Socialists won a resounding victory early last year and were significantly ahead in the polls ahead of the developing scandal.
US Yields Spike, Equities Fall, Oil Rebounds
Bad. Yesterday’s 30-year treasury auction in the US was bad. And this time, the bad auction got the anticipated reaction. The US Treasuries saw a sharp selloff - especially in the 20 and 30-year papers. The US 30-year yield jumped 22bp, the 20-year yield jumped more than 20bp, while the 10-year yield jumped 18bp to above 4.60%.
Then, the Federal Reserve (Fed) Chair Jerome Powell’s speech at an IMF event was hawkish. Powell repeated that the FOMC will move ‘carefully’ and that the Fed won’t hesitate to raise the interest rates again, if needed. The US 2-year yield is back above the 5% level.
Of course, the sudden jump in US yields hit appetite in US stocks yesterday. The S&P500 fell 0.80%, and Nasdaq fell 0.82%. The US bond auction brought along a lot of volatility, questions, and uncertainty.
At 5%, the US 2-year yield is still 50bp below the upper limit of the Fed funds target range. Therefore, if the Fed could convince investors that the rates will stay high for long, this part of the curve has potential to shift higher. On the longer end, we could reasonably expect the US 10-year yield to remain below the 5% mark – and even ease gently if economic growth slows and the job market loosens. A wider inversion between the US 2-10-year yield should boost the odds a higher of US recession. But hey, we are used to the inverted yield curve, and we believe that it won’t necessarily bring along recession. Goldman sees only a 15% chance of US recession next year.
In the FX
The US dollar jumped to its 50-DMA as a response to a rapid surge in the US Treasury yields. The EURUSD sank below the 1.07 level. From a technical perspective, the early week rally remained capped below a major Fibonacci level, the 38.2% retracement on summer to October selloff near the 1.0760. The EURUSD remains in a bearish trend after the failure to clear an important technical resistance. Unideal political news from Spain and Portugal, and a morose economic outlook for the Eurozone will likely keep the euro in retreat against the US dollar. Even though the European Central Bank (ECB) officials cry out loud that the rates will stay high for long in the Eurozone as well, it sounds much less credible when economic data doesn’t give sufficient support.
In the UK, the Bank of England (BoE) wants to look tough and convince investors that it’s too early to talk about rate cuts. But Cable’s latest surge remained capped below the 200-DMA, and the pair is back to 1.22. The medium-term outlook for Cable remains neutral to bearish. Another surge in the dollar appetite will easily send the pair to 1.20 psychological level.
The dollar-yen is back to misery, above 151. Traders want to buy the USDJPY, but they also know that the Japanese authorities are tempted to intervene to prevent the Japanese yen from getting shattered just because the Bank of Japan (BoJ) can’t keep up with the rest of the major global central bank policies. Japanese are happy to see inflation emerge after decades of deflation. Perhaps, the view of China – and Chinese deflation – doesn’t make them want to move any faster.
In energy, the oil bulls come in timidly near the $75pb psychological support. The oil selloff probably went too far and it’s time for – at least – a minor positive correction. A move toward the $78/80 range would be reasonable. This area includes the 200-DMA and the minor 23.6% Fibonacci retracement on September to November selloff.
Today is Friday. Fears of escalating geopolitical tensions could help strengthen the $75 support in US crude. But regarding that topic, the biggest fear of oil traders in Gaza was the implication of Iran in the war, which would then lead to another embargo on the Iranian oil, decrease the global supply and send prices higher. Now, the new market narrative is that, even if the Iranian oil gets banned, it doesn’t matter because first, the Iranian shipments have been falling due to weaker Asian demand and two, 90% of the Iranian shipments go to China anyway, and China doesn’t care about the Iranian oil ban, they will continue buying it. And oh, there is also the fact that the US shale production hit a record high of 13.2mbpd. Together with the rising worries of slower global demand, the above-stated factors should ensure that a potential rebound in oil prices doesn’t extend easily above the $78/80 range.
Powell Keeps Tightening Bias
Market movers today
This morning, focus turns to the release of UK monthly GDP figures for September and likewise the preliminary Q3 figure. Consensus expects the monthly figure at 0.0% m/m (down from 0.2% in August) and Q3 GDP at -0.1% q/q. Compared to the BoE's latest forecast from the November monetary policy report of 0.0 q/q for Q3, we would need to see a significant uptick in growth in September for this to be the case.
In the afternoon, we receive the University of Michigan survey from the US. Focus will be on the survey results on inflation expectations following the October uptick.
The 60 second overview
US: Fed chair Jerome Powell yesterday said that he was not confident the Fed had reached a monetary policy stance to achieve the 2% inflation target and he thought there was still a long way to go. He also underlined that more tightening would come if needed.
Oil: Oil prices have stabilised with Brent trading around the USD80/bbl level after the sharp drop since last week. There has not been any particular oil related news the past couple of days to explain the drop.
Equities: Global equities were lower yesterday driven by US stocks as both European and Asian markets ended higher. I t was no surprise to see central banks and not least Powell being the factors that ended the streak of eight straight gains for S&P 500 and nine straight for Nasdaq. Powell touched on the fact of recent yield moves as these have a big impact on financial conditions; and that became the reason for selling stocks yesterday. Cyclicals still managed to outperform as healthcare was the big loser yesterday. In the US: Dow -0.7%, S&P 500 -0.8%, Nasdaq -0.9% and Russell 2000 -1.6%. Sour sentiment in Asia this morning with China leading the declines. European futures are lower while US futures are flat this morning.
FI: US Treasury yields rose significantly yesterday on the back of hawkish comments from Federal Reserve Chairman Powell as well as a very poor 30Y treasury auction. The 30Y US Treasury auction was very weak given a very large tail of more than 5bp. Hence, it was considered to be one of the worst auctions in a decade Powell stated that "if it becomes appropriate to tighten policy further, we will not hesitate to do so". The US curve steepened from the long end of the US Treasury curve, as 2Y US Treasury yields rose some 10bp, while 10Y Treasuries rose some 15bp and 30Y Treasuries rose 16bp.
FX: Not much to report from G10 FX markets. The drop in oil prices has been the big story the past week, but oil prices steadied yesterday. Fed Chair Powell gave some slightly hawkish comments, which supported USD and sent EUR/USD below 1.07. EUR/SEK and EUR/NOK were about flat on the day.
Credit: The solid activity in the primary corporate bond market continued Thursday with issuers such as Fiskars OYJ, INEOS Quattro Finance, and Intesa Sanpaolo SpA coming to the market. As the Q3 reporting season is drawing to an end the overall impression is that Nordic Corporates are in good shape with solid cash flow generation and low leverage. This is comforting as the outlook for 2024 is more uncertain. iTraxx Main was unchanged at 75bp while iTraxx X-over was 2bp tighter at 408bp.
Nordic macro
In Sweden, the September PVI (production value indicator) and consumption indicator will add some colour to the already released Q3 GDP indicator (unchanged q/q SA). September data already released suggests real goods net exports demand made a significant positive contribution (+0.7pp) to GDP growth while retail sales basically remained unchanged. Consumption data released today is likely to be affected by the moderation in retail sales growth. Looking at composite PMI, which appears to have stabilised in Q3, there should be a modest decline in PVI.
We expect Norwegian core inflation will edge down further to 5.6% y/y in October, which would be well below Norges Bank's forecast of 6.0% in the September monetary policy report. There is a slight risk of an upward adjustment of prices ahead of Black Week offers this month, but that would then reverse in the November data.
UK economy shows resilience: GDP up 0.2% mom in Sep, flat in Q3
UK's economy displayed unexpected resilience in today's data releases, GDP figures surpassed market expectations both on a monthly and quarterly basis.
In September, GDP grew by 0.2% mom, defying the stagnation prediction of 0.0% mom. This growth was primarily driven by a 0.2% increase in the services sector, a crucial component of the UK economy. Additionally, the construction sector contributed positively with a 0.4% mom= growth, while production remained steady with no significant change.
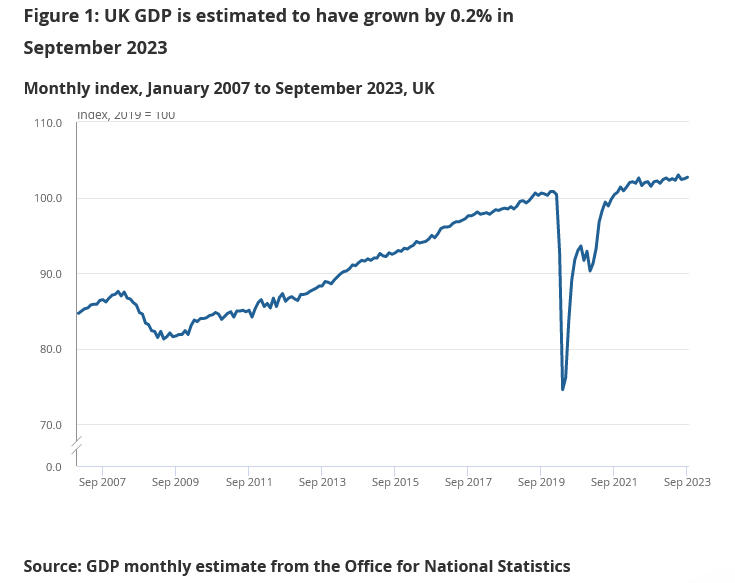
On a quarterly scale, GDP figures remained flat at 0.0%, which is a more favorable outcome compared to the anticipated contraction of -0.1% qoq. On a year-on-year basis, GDP registered a growth of 0.6% yoy, indicating a modest but steady recovery from the same quarter in the previous year.
The services sector experienced a slight contraction of -0.1% qoq, whereas construction saw a marginal growth of 0.1% qoq. The production sector's performance was broadly unchanged.
AUD/USD Torpedoed Towards Key Short-term Support for a Potential Bullish Reversal
- The recent slide of -170 pips seen in the AUD/USD from Monday, 6 November high of 0.6520 has reached a key inflection zone.
- The latest higher level of inflation forecasts in Australia by the RBA may put a pause on the current minor corrective decline seen in the AUD/USD.
- Short-term technical elements have turned positive for a potential bullish reversal scenario for the AUD/USD.
- Watch the 0.6330 key short-term support and 0.6400 potential upside trigger level for the AUD/USD.
The price actions of AUD/USD have shaped the expected corrective decline and hit the 0.6395/6370 short-term support zone. It printed an intraday low of 0.6452 in today, 10 Nov Asian session at this time of the writing reinforced by a mild hawkish Fed speak from Fed Chair Powell that indicated the US Federal Reserve may enact another interest rate if needed.
In a similar hawkish vibe, the Australian central bank, RBA has raised an “elevated inflationary environment” alarm via its latest messaging and inflation forecasts portrayed on its latest monetary policy statement released today.
RBA highlighted that inflation was more persistent than expected, the Australian economy grew slightly above expectations, and inflation pressures may see further upside surprises due to both domestic and external factors.
RBA’s current CPI forecasts (November 2023) were revised upwards to 4.5% end 2023, 3.5% end 2024, and 2.9% end 2025 from prior projections made in August 2023 at 4.1% end 2023, 3.3% end 2024, and 2.8% end 2025.
Hence, it seems that the RBA is more skewed toward inflation-fighting mode rather than looking at an imminent interest rate cut in the first half of 2024 to address growth concerns in Australia.
Therefore, the current slide of the AUD/USD in place since Monday, 6 November may be negated soon as market participants adjust their future expectations toward a more potentially less dovish RBA in the short to medium term.
Medium-term uptrend remains intact
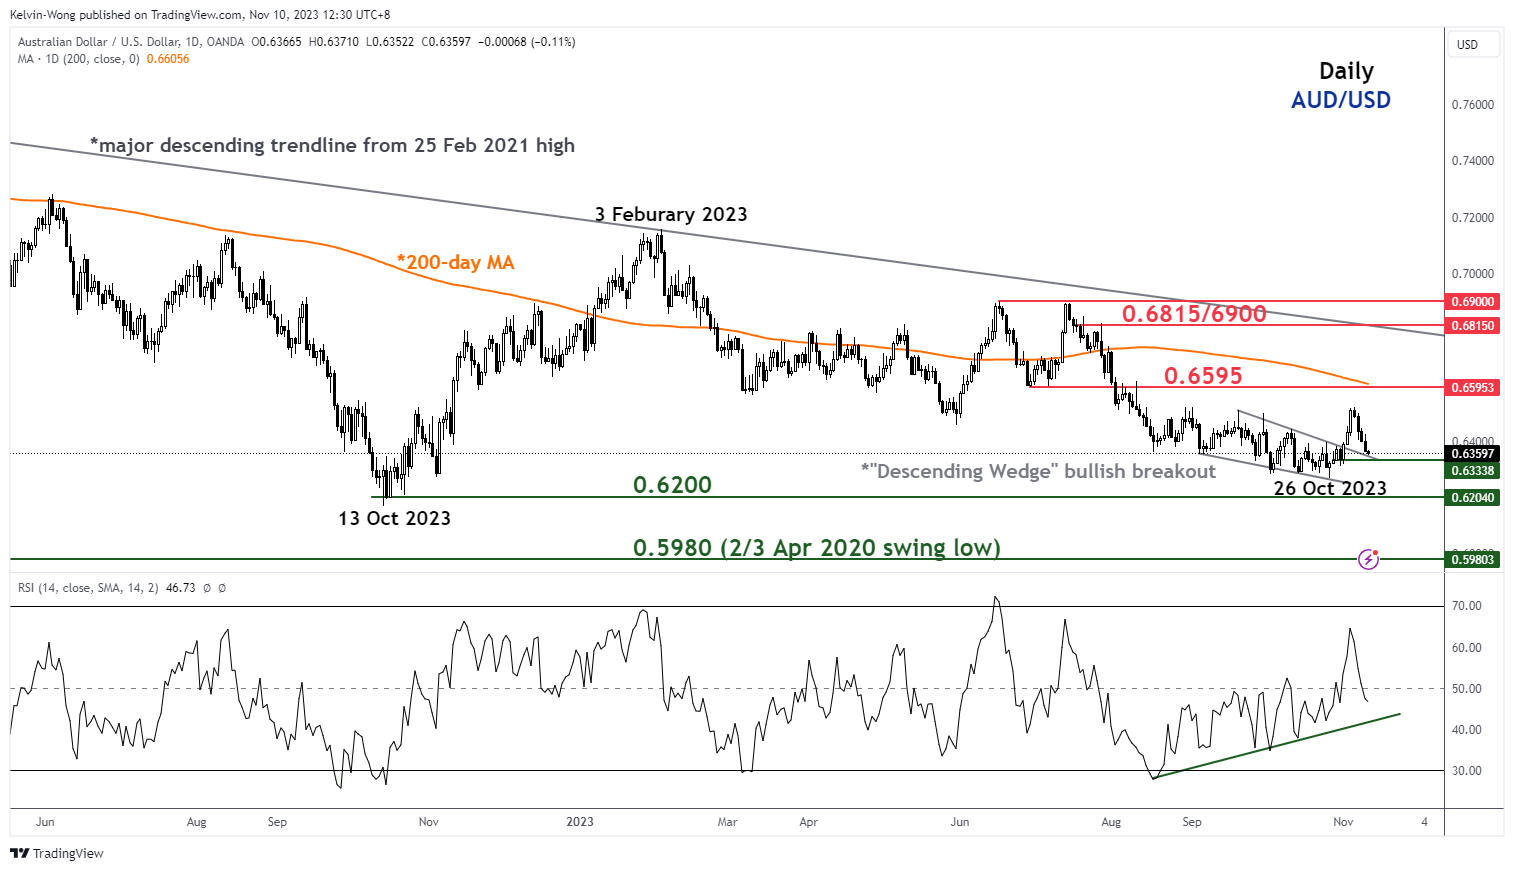
Fig 1: AUD/USD medium-term trend as of 10 Nov 2023 (Source: TradingView, click to enlarge chart)
The ongoing short-term uptrend of the AUD/USD since the bullish breakout of its ‘Descending Wedge” bullish reversal configuration on 2 November 2023 remains intact.
In addition, the daily RSI momentum indicator has pull-backed but remained above its parallel ascending support at the 42 level after it flashed out a bullish divergence condition earlier on 3 October 2023.
Watch 0.6330 key short-term support
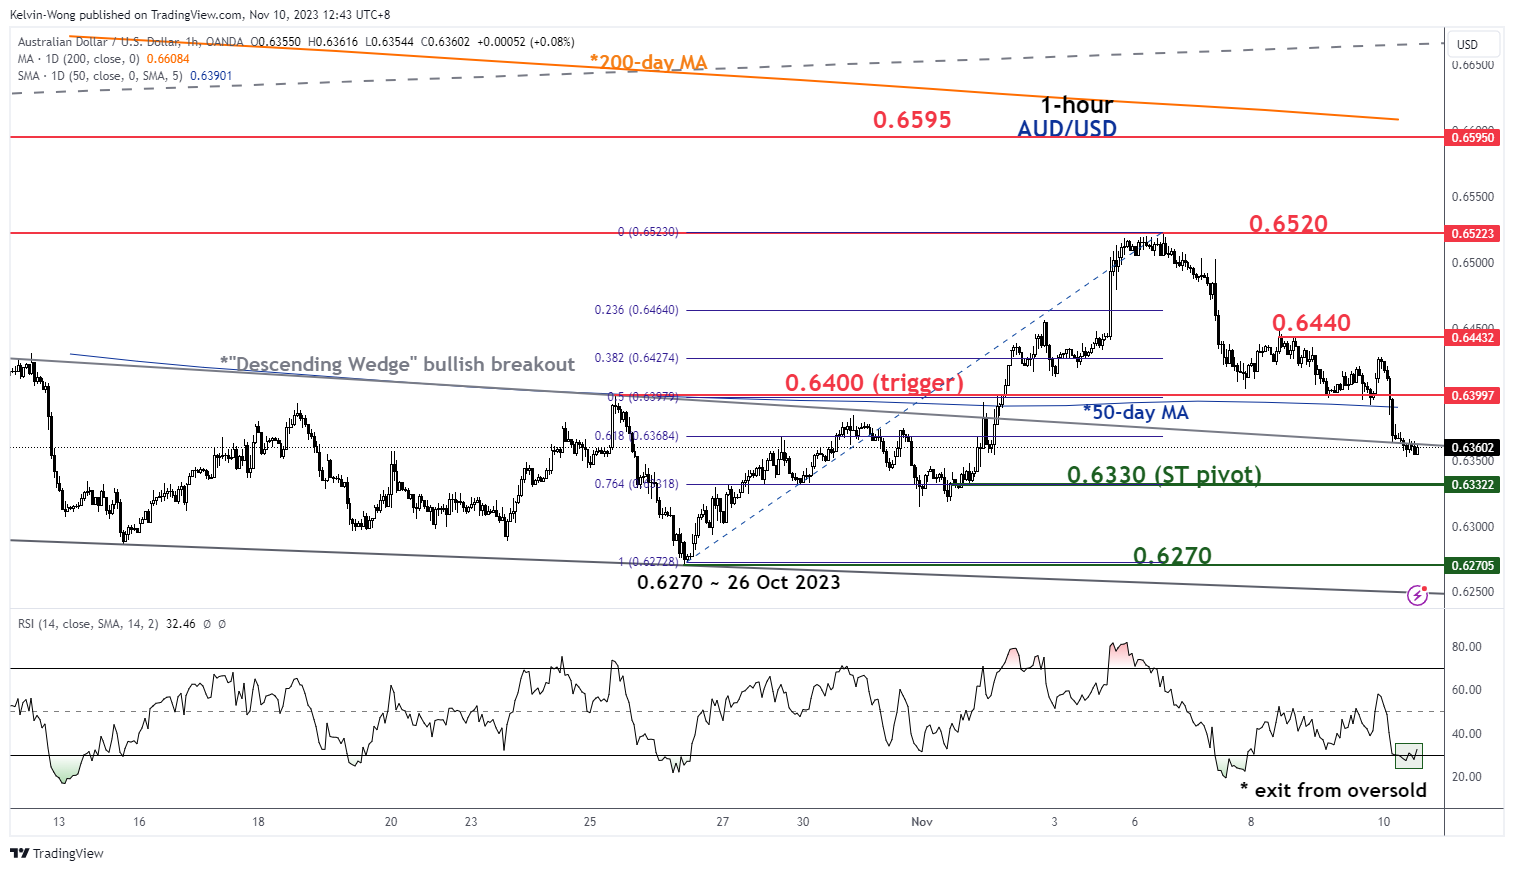
Fig 2: AUD/USD minor short-term trend as of 10 Nov 2023 (Source: TradingView, click to enlarge chart)
The current price actions of the AUD/USD have started to trade sideways right at the pull-back support of the former ‘Descending Wedge” resistance which is also close to the 0.6330 short-term pivotal support defined by the minor congestion area of 1 November 2023, 61.8% Fibonacci retracement of the prior upmove from 26 October low to 6 November 2023 high, and 1.00 Fibonacci extension of the current slide from 6 November high to 7 November low projected from 8 November 2023 high.
In addition, the hourly RSI momentum indicator has started to exit from its oversold region which suggests the current short-term downside momentum is likely to have abated.
A clearance above 0.6400 near-term resistance (also the 50-day moving average) may see a potential bullish reversal towards the intermediate resistances of 0.6440 and 0.6520 in the first step.
On the other hand, a break below 0.6330 invalidates the bullish scenario for a further slide to expose the medium-term support zone of 0.6270/0.6200.
RBA Statement on Monetary Policy: Early Thoughts
The RBA’s November Statement on Monetary Policy upgrades the inflation and growth forecasts even with a higher assumed path for interest rates. How this can coexist with an unusually large fall in household sector real incomes remains to be seen. Risks to the inflation forecast are also skewed to the upside. If things turn out in line with the RBA’s revised forecasts, they might not need to raise rates again. But the bar to further hikes is clearly lower now; the RBA has almost no margin for further upside surprises.
The RBA’s Statement on Monetary Policy elaborates on the reasoning behind this week’s decision to raise the cash rate. Underlying inflation has not declined as fast as the RBA expected a year ago or three months ago. The inflation forecasts have been revised up and most of the risks are to the upside, including domestic services inflation, rising medium-term inflation expectations and weak productivity boosting growth in effective labour costs. The RBA highlighted their concerns about the higher inflation outlook by adding a graph showing both current and August forecasts for trimmed mean inflation in addition to the usual forecast-with-uncertainty-bands graph.
The RBA has been surprised by the resilience of domestic demand, especially outside the household sector; this is another factor that will tend to lift inflation. Near-term GDP growth is now expected to be stronger, with some of the resilience of business investment seen in the first half of 2023 carrying over into the second half. Our own forecasts embed a view that much of this first-half strength in equipment spending was a pull-forward to take advantage of tax breaks, which will not be repeated in the second half. Likewise, some of the strength was a catch-up as supply chain disruptions dissipated, a process that will come to an end at some point. On the other hand, more investment is needed to restore the ratio of capital to labour to earlier trends, and so support the needed improvement in productivity.
As flagged in the Governor’s decision statement, the unemployment rate profile has also been revised down. It might be that the RBA is expecting more of the softening in labour market conditions to come through underemployment than previously thought. The labour market has clearly turned, though it remains tight; the SMP points to a range of indicators in support of this assessment, including youth and medium-term unemployment, as well as underemployment.
These upside revisions to the forecast have occurred despite a roughly ¼ percentage point higher assumed profile for the cash rate, based on market pricing and private sector forecasts. The peak is around 4½%, which does not imply that further increases after November’s are baked in.
Central to these changes is the upward revision to assumed population growth. Both GDP growth and employment growth are about ½ percentage point higher in the forecast for 2024 than in the RBA’s August forecasts. Because the extra population adds to both supply and demand, the effect on unemployment and (non-housing) inflation is marginal at best. There is, however, a significant effect on the housing market. The SMP text calls out the strong growth in rents, rising housing prices and increases in average household size in the major cities as being connected to this dynamic.
Despite the forecast upgrades, GDP growth is expected to remain slow. The household sector is being squeezed by the higher cost of living, rising tax take and, increasingly, the effect of higher interest rates. The consumption forecasts for 2024 were revised down noticeably (–0.3%points), with no growth payback in 2025. Given the higher population assumption, this is a material downgrade on a per person basis. It also aligns with what we are seeing in our Card Tracker data (see Westpac Senior Economist Matt Hassan’s report earlier today).
The RBA notes that falling real household incomes are driving the weakness in consumer spending. The Bank’s real household disposable income forecast for year to June quarter 2024 has been revised down 1½ percentage points to –1.1%. Such is the weakness in the income forecasts that even the current weak consumption forecasts can only be sustained with a near-zero household saving ratio in the first half of 2024.
It is hard to conceive how such an extended period of declining real incomes – even worse in per household terms – can coexist with a still-tight labour market. It is also a little hard to square the still-tight labour market and cost of living squeeze with the downward revision to the forecast path for wages growth and (in 2024) average earnings. While the forecast bounce-back in household incomes is also a bit sharper, the experience of the Australian household sector will stand in contrast to its counterparts overseas.
Most of the other changes speak to increasing concerns that inflation will not come down as quickly as the Board intends. The language around weak productivity growth continues to highlight inflation risks. The SMP overview states, “the forecasts assume that productivity growth will pick up, which will be needed for labour cost growth to be consistent with the inflation target”. In August, the assumption was that productivity growth would return to pre-pandemic trends. The SMP text calls this out as being a particular issue for services inflation, which embeds a larger share of labour costs than do goods prices. Another important change in language in the SMP overview is the recognition that some measures of medium-term inflation expectations have risen a little lately.
Because services inflation has been so sticky, the RBA is also sceptical that disinflation abroad is assured. It believes that ‘[t]he risk that inflation takes even longer to return to target has increased.’ On the other hand, the risks to global growth were held to be tilted to the downside. We agree, but there is a tension in how these risks sit together.
The Board considered both the case to hold and the case to increase rates at the November meeting. As we expected, the case to raise rates was stronger. The chance that the Board will need to do more, presumably in February, is also rising. The refreshed forecasts embed very little margin for upside surprises on inflation.
AUD/USD Daily Report
Daily Pivots: (S1) 0.6344; (P) 0.6387; (R1) 0.6409; More...
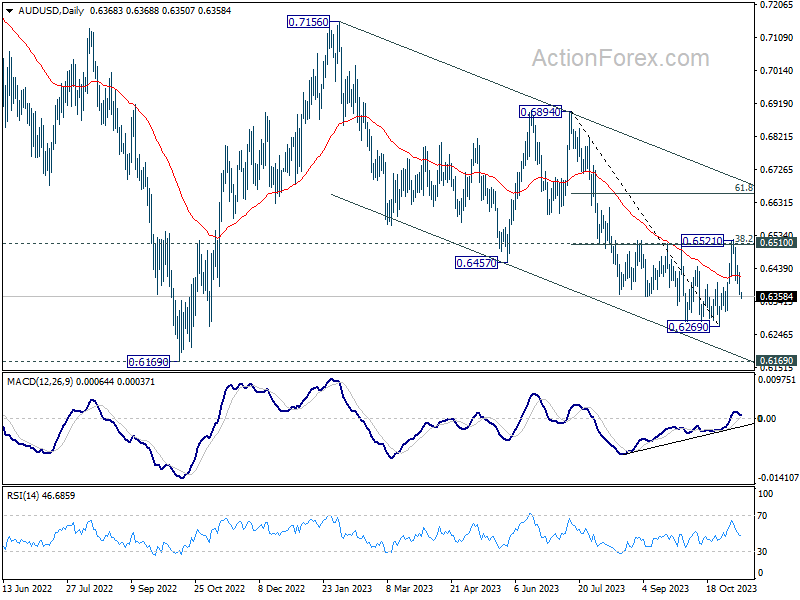
AUD/USD's steep decline now suggests that rebound from 0.6269 has completed at 0.6521. The development also indicates rejection by 0.6510 cluster resistance (38.2% retracement of 0.6894 to 0.6269 at 0.6508), and retain near term bearishness. Intraday bias is back on the downside for retesting 0.6269 low. Firm break there will resume larger fall from 0.7156, to retest 0.6169 low. On the upside, above 0.6427 minor resistance will turn intraday bias neutral first.
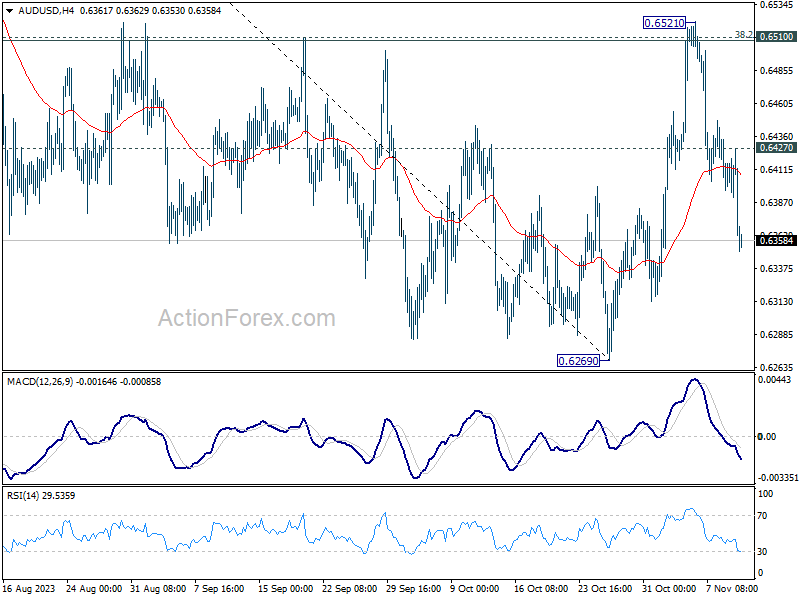
In the bigger picture, there is no confirmation that down trend from 0.8006 (2021 high) has completed. While current rebound from 0.6269 might extend higher, it could be the third leg of a corrective pattern from 0.6169 (2022 low) only. For now, medium term bearishness will remain as long as 0.6894 resistance holds.
Aussie’s Decline Overshadows Hawkish RBA Signal; Sterling Waits for UK GDP Amid Dollar Strength
In today's currency markets, Australian Dollar is notably weaker across the board, a development that comes as a surprise considering the hawkish tone of the latest RBA Statement on Monetary Policy. The statement, which leaned towards the possibility of another rate hike, seemed insufficient to bolster the Aussie. Factors such as global risk aversion and specific worries about China's economic recovery path significantly overshadowed RBA's more aggressive policy outlook.
Meanwhile, Dollar is showing renewed vigor. The greenback's strength is partly attributed to a rebound in 10-year Treasury yield, a response to Fed Chair Jerome Powell's recent hawkish comments. Sterling, on the other hand, is experiencing some softness as market participants eagerly await release of GDP data. This upcoming economic indicator is crucial for reviving the chance of another BoE rate hike in the near term.
In a broader weekly perspective, Dollar stands out as the strongest currency, maintaining its lead despite not yet breaking through the highs of the previous week. Swiss Franc and Euro are trailing behind, drawing strength from their resilience against Sterling and various commodity currencies. Contrarily, Australian Dollar finds itself at the bottom of the performance chart, trailed by New Zealand Dollar and Japanese Yen, with Canadian Dollar exhibiting a mixed performance.
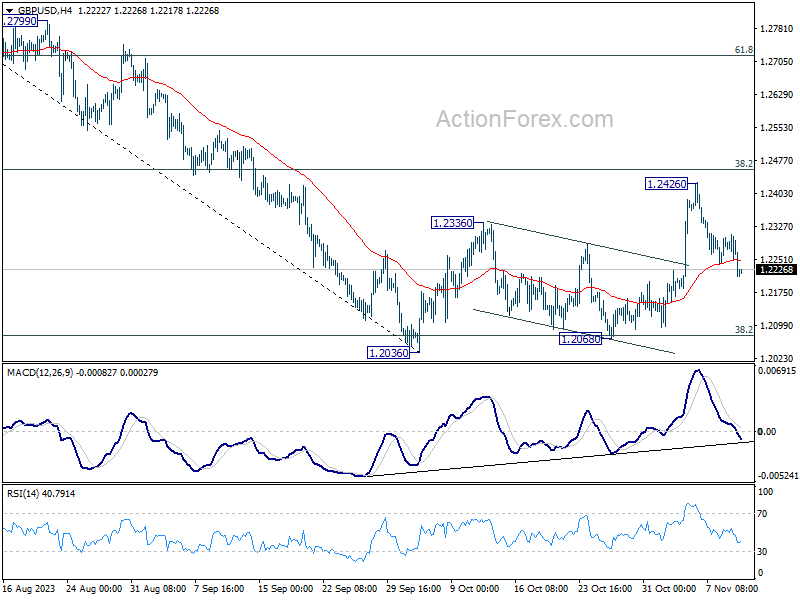
Technically, GBP/USD's break of 55 4H EMA now argues that recovery from 1.2068 has completed at 1.2426. That came just ahead of 38.2% retracement of 1.3141 to 1.2036 at 1.2458. Rejection by 1.2458 keeps outlook in GBP/USD for declining through 1.2068 to resume the whole fall from 1.3141. Firm break of 55 4H EMA in EUR/USD will affirm the underlying bullish momentum in Dollar, and help drags GBP/USD lower towards 1.2068 next.
In Asia, at the time of writing, Nikkei is down -0.38%. Hong Kong HSI is down -1.59%. China Shanghai SSE is down -0.45%. Singapore Strait Times is down -0.85%. Overnight, DOW dropped -0.65%. S&P 500 dropped -0.81%. NASDAQ dropped -0.94%. 10-year yield rose 0.107 to 4.630.
RBA's hawkish SoMP points to another rate hike
RBA's latest Statement on Monetary Policy presents a more hawkish picture than market observers anticipated, with upward revisions in both headline and underlying inflation projections, alongside stronger growth outlook.
More importantly, these projections rest on the assumption that cash rate will peak around 4.50%, comparing to the current 4.35%, suggesting another rate hike could be imminent.
RBA's heightened vigilance against inflation is clear: "The weight of recent information suggests that the risk of inflation remaining higher for longer has increased," the bank stated, highlighting domestic inflation persistence and possible global factors, such as energy market disruptions and food price hikes tied to El Niño effects.
Economic projections now show a year-average GDP growth expected to hit 2.00% in 2023, rising to 1.75% in 2024, and reaching 2.25% in 2025. These figures mark an upgrade from June's forecast of 1.50%, 1.25%, and 2.00% respectively, suggesting a resilient economy that could withstand tighter monetary policy.
Inflation forecasts have also been adjusted upward, with headline CPI inflation now seen at 4.50% at the year's end in 2023, followed by 3.50% in 2024, and softening to 3.00% in 2025. They are upgraded from 4.25%, 3.25% and 2.75% respectively.
The trimmed mean inflation follows a similar upward trajectory, projected to be at 4.50% in year-ended 2023, 3.25% in 2024, and 3.00% in 2025, up from prior forecast of 4.00%, 3.00%, and 2.75% respectively.
Underpinning these projections are technical assumptions of a cash rate peaking at around 4.50%, with a gradual decline to a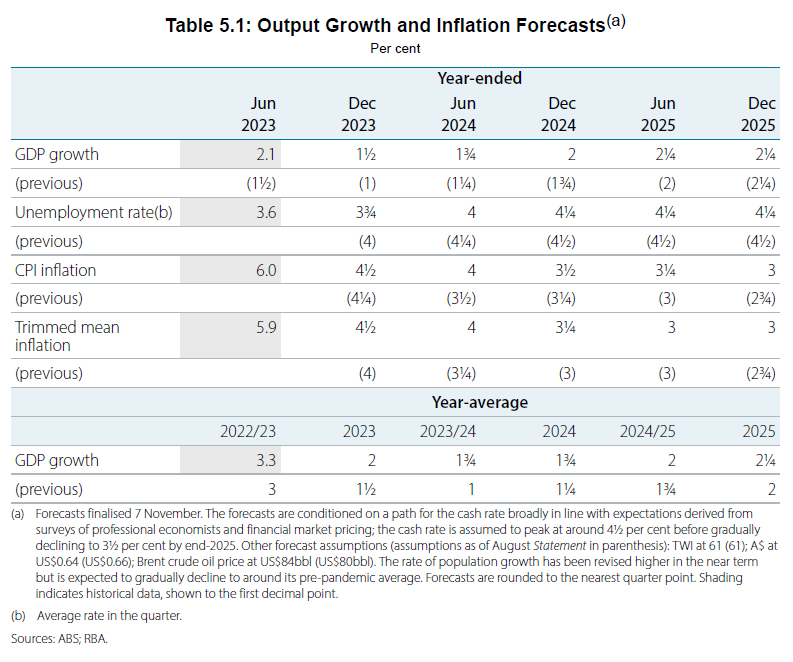 pproximately 3.50% by the end of 2025, indicating a higher rate path than previously used.
NZ BNZ PMI fell to 42.5, manufacturing downturn reaches lowest point since 2009
October has marked a significant downturn for New Zealand's manufacturing sector, with BusinessNZ Performance of Manufacturing Index plummeting from 45.1 to 42.5. This figure not only represents the fifth consecutive month of declining activity but also stands as the lowest activity level for a month unaffected by COVID-19 restrictions since May 2009, deeply underscoring the sector's distress.
Delving into the components, the bleak picture becomes clearer: Production has taken a hit, sliding down from 44.3 to 41.5, and employment in the sector is also suffering, with a drop from 45.1 to 43.3. New orders barely held ground, marginally decreasing from 44.8 to 44.1. A significant retreat was seen in finished stocks, which contracted from 51.2 to 45.7, and deliveries were also on the downturn from 44.3 to 42.9.
Amidst these figures, the voice of the industry has tilted towards concern, with 65.1% of comments categorized as negative, albeit slightly less pessimistic than previous months, at 68.8% in September and 66.7% in August.
BNZ Senior Economist, Doug Steel, highlighted the potential ramifications for the broader economy: "Today's PMI is not a good look for GDP and employment growth," he noted. With the current forecasts including a downturn in manufacturing for the latter half of 2023, Steel warned, "There's a chance that decline is bigger than we think, if the PMI does not bounce in the final months of the year."
Fed Chair Powell vows to tighten further if needed amid inflation head fakes
Fed Chair Jerome Powell, speaking at an IMF event, conveyed a vigilant stance on monetary policy, expressing uncertainty over whether current interest rates are adequate to curb inflation. With a steadfast commitment to FOMC's inflation target, Powell emphasized the readiness to adjust policy in response to economic indicators.
"The FOMC is committed to achieving a stance of monetary policy that is sufficiently restrictive to bring inflation down to 2 percent over time; we are not confident that we have achieved such a stance," Powell stated
At the same time, "we are not confident that we have achieved such a stance," he added.
Highlighting the deceptive nature of recent inflation trends, he added, "Inflation has given us a few head fakes". Hence, "ongoing progress toward our 2 percent goal is not assured"
Powell was unequivocal about the Fed's resolve: "If it becomes appropriate to tighten policy further, we will not hesitate to do so."
Fed's Bostic and Barkin discuss restrictive policy and inflation outlook
In a dual appearance at an event in New Orleans overnight, Richmond Fed President Thomas Barkin and Atlanta Fed President Raphael Bostic provided insights into the Federal Reserve's ongoing efforts to tame inflation.
Bostic expressed confidence in the current policy stance, which it "likely sufficiently restrictive", predicting that it should be enough to curb inflationary pressures, albeit with potential challenges ahead. "Inflation is going to get to 2%," he assured, committing to maintaining a restrictive policy until that target is firmly within sight.
Barkin focused on the anticipated impacts of Fed's policies, noting that "we are still not seeing the full effects of policy". He forecasted an economic downturn as necessary for achieving the Fed's targets: "I believe there's a slowdown coming. I believe we're going to need that slowdown, because I think that's what it's going to take to convince price-setters the days of pricing power are over."
Fed's Barkin suggests inflation might ease back to target with no further rate hikes
Richmond Fed President Thomas Barkin deliberated on Fed's monetary policy stance in light of the ongoing economic slowdown and its implications for inflation during an MNI Webcast.
Barkin addressed the possibility that the current economic environment might not necessitate further intervention: "Whether a slowdown that settles inflation requires more from us remains to be seen, which is why I supported our decision to hold rates at our last meeting," he remarked.
He emphasized the opportunity for Fed to assess the economic outlook before taking further action: "With rates restrictive and financial conditions tightened, we have time to reconcile competing narratives on demand and to test different views on the trajectory of inflation," Barkin explained.
He also allowed for the possibility that the current policy stance might suffice, suggesting, "perhaps inflation could return to target without more help from us and without too much damage to demand."
Fed's Paese emphasizes prudence, awaits data before additional tightening
St. Louis Fed President Kathleen O'Neill Paese emphasized the current effectiveness of monetary policy in exerting "modest downward pressure on inflation."
"We can afford to await further data before concluding that additional policy tightening is appropriate," Paese stated.
Despite this cautious approach, she warned against complacency, asserting that prompt action must be taken if the downward trend in inflation shows signs of stalling.
"However, if progress toward achieving 2% inflation stalls, I believe that the committee should act promptly to ensure that high inflation does not become entrenched," she noted.
Paese also reminded that the high-interest-rate environment is expected to persist as part of the long-term strategy to rein in inflation.
Looking ahead
UK GDP, production, and goods trade balance are the main focuses in European session. Later in the day, US Michigan University consumer sentiment will be the highlight.
AUD/USD Daily Report
Daily Pivots: (S1) 0.6344; (P) 0.6387; (R1) 0.6409; More...
AUD/USD's steep decline now suggests that rebound from 0.6269 has completed at 0.6521. The development also indicates rejection by 0.6510 cluster resistance (38.2% retracement of 0.6894 to 0.6269 at 0.6508), and retain near term bearishness. Intraday bias is back on the downside for retesting 0.6269 low. Firm break there will resume larger fall from 0.7156, to retest 0.6169 low. On the upside, above 0.6427 minor resistance will turn intraday bias neutral first.
In the bigger picture, there is no confirmation that down trend from 0.8006 (2021 high) has completed. While current rebound from 0.6269 might extend higher, it could be the third leg of a corrective pattern from 0.6169 (2022 low) only. For now, medium term bearishness will remain as long as 0.6894 resistance holds.
Economic Indicators Update
| GMT | Ccy | Events | Actual | Forecast | Previous | Revised |
|---|---|---|---|---|---|---|
| 21:30 | NZD | Business NZ PMI Oct | 42.5 | 45.3 | 45.1 | |
| 23:50 | JPY | Money Supply M2+CD Y/Y Oct | 2.40% | 2.40% | ||
| 00:30 | AUD | RBA Monetary Policy Statement | ||||
| 07:00 | GBP | GDP M/M Sep | 0.00% | 0.20% | ||
| 07:00 | GBP | GDP Q/Q Q3 P | -0.10% | 0.20% | ||
| 07:00 | GBP | Manufacturing Production M/M Sep | 0.30% | -0.80% | ||
| 07:00 | GBP | Manufacturing Production Y/Y Sep | 2.80% | |||
| 07:00 | GBP | Industrial Production M/M Sep | -0.10% | -0.70% | ||
| 07:00 | GBP | Industrial Production Y/Y Sep | 1.10% | 1.30% | ||
| 07:00 | GBP | Goods Trade Balance (GBP) Sep | -15.3B | -16.0B | ||
| 09:00 | EUR | Italy Industrial Output M/M Sep | -0.10% | 0.20% | ||
| 12:00 | GBP | NIESR GDP Estimate (3M) Oct | -0.10% | |||
| 15:00 | USD | Michigan Consumer Sentiment Index Nov P | 63.6 | 63.8 |