

Sample Category Title
EUR/USD Mid-Day Outlook
Daily Pivots: (S1) 1.0644; (P) 1.0685; (R1) 1.0709; More...
EUR/USD is trying to draw support from 55 4H EMA (now at 1.0657) and intraday bias remains neutral first. Further rise is in favor as long as this EMA holds. Decisive break of 1.0764 cluster resistance (38.2% retracement of 1.1274 to 1.0447 at 1.0763) will extend the rise from 1.0447 to 61.8% retracement at 1.0958 next. However, sustained break of 55 4H EMA will argue that the rebound has completed, and target 1.0515 support, and then 1.0447 low.
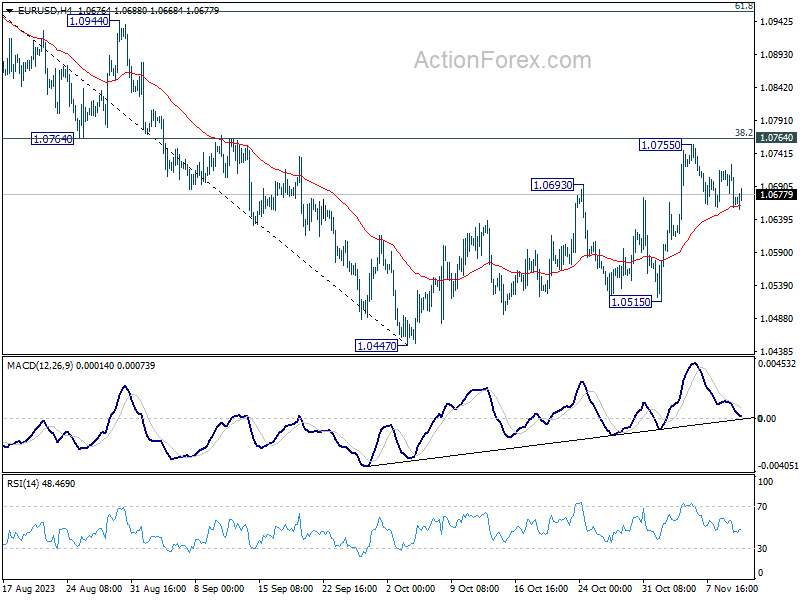
In the bigger picture, price actions from 1.1274 are viewed as a corrective pattern to rise from 0.9534 (2022 low). Rise from 1.0447 is tentatively seen as the second leg. Hence while further rally could be seen, upside should be limited by 1.1274 to bring the third leg of the pattern.
Euro Gains Ground as Dollar Hesitates, Cryptos Surge
Today's currency market sees Euro gaining some traction, especially against Japanese Yen, which is underperforming alongside Australian Dollar. Despite RBA's hinting at a potential rate hike, Aussie is struggling, not only against major currencies but also against its commodity-linked counterparts. British Pound, too, is lagging behind despite UK reporting GDP figures marginally above expectations. Dollar is showing signs of firmness but is unable to muster a strong momentum to significantly build upon this week's recovery efforts.
In commodity markets, Gold is slipping below 1950 handle again. WTI crude oil is experiencing stagnation, hovering around 76 mark, following a notable decline earlier in the week. While US 10-year Treasury yield showcased an impressive bounce yesterday, it has not managed to maintain the upward trajectory, suggesting caution among bond investors.
A more optimistic note is seen in cryptocurrency market, where Bitcoin and Ethereum are showing significant bullish momentum. Bitcoin has successfully broken 37k mark, while Ethereum has powered through 2000 level, signaling intensifying investor interest in digital assets.
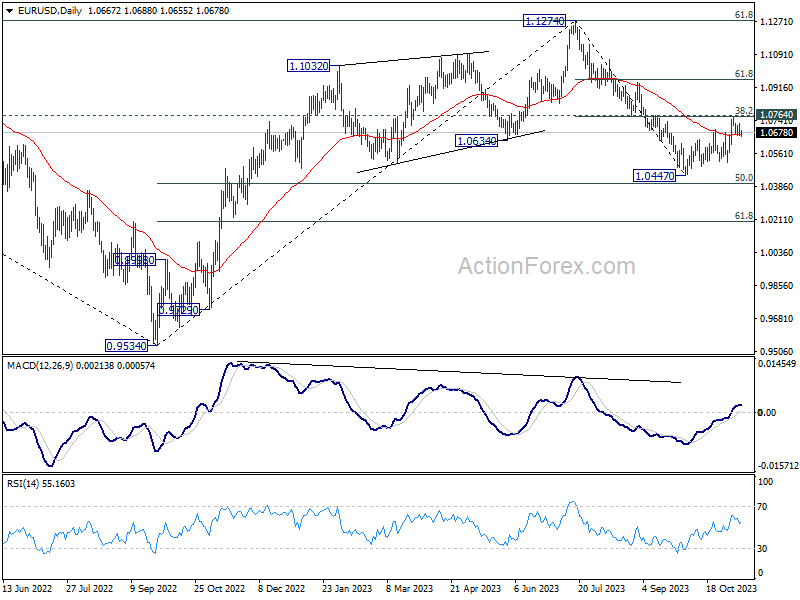
Technically, Ether now looks set to break through 2141.75 resistance to resume the whole rebound from 878.50. Key resistance level lies in 38.2% retracement of 4863.75 to 878.50 at 2400.85. (Bitcoin has already broken equivalent fibonacci resistance. Decisive break there could pave the way to 61.8% retracement at 3341.38 in the medium term. In any case, outlook will stay bullish as long as 1849.05 support holds.
In Europe, at the time of writing, FTSE is down -1.31%. DAX is down -0.68%. CAC is down -1.00%. Germany 10-year yield is up 0.0570 at 2.708. Earlier in Asia, Nikkei dropped -0.24%. Hong Kong HSI dropped -1.76%. China Shanghai SSE dropped -0.47%. Singapore Strait Times dropped -0.91%. Japan 10-year JGB yield rose 0.0153 to 0.857.
NIESR forecasts slight growth for UK economy, averting recession in 2023
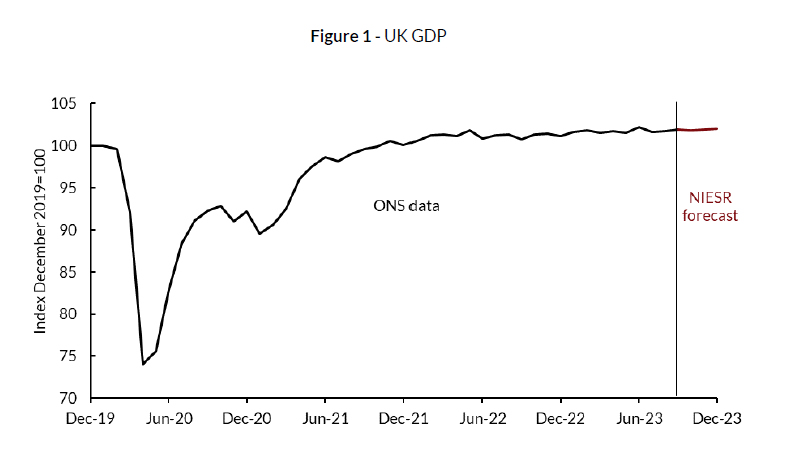
According to NIESR's projections, UK economy is set to witness a marginal increase in GDP of 0.1% in the fourth quarter of this year. The institute's report highlighted, "Our central forecast does not expect a recession in 2023."
Delving into the specifics of the economic forecast, NIESR stated, "These forecasts remain broadly consistent with the longer-term trend of low, but stable economic growth in the United Kingdom."
Looking ahead to the next two years, NIESR expects the pace of growth to remain relatively subdued. The institute's report forecasts GDP growth of 0.6% for 2023, followed by further restrained growth of 0.5% in 2024. The primary cause for this muted growth, as per NIESR, is the ongoing productivity slump.
UK economy shows resilience: GDP up 0.2% mom in Sep, flat in Q3
UK's economy displayed unexpected resilience in today's data releases, GDP figures surpassed market expectations both on a monthly and quarterly basis.
In September, GDP grew by 0.2% mom, defying the stagnation prediction of 0.0% mom. This growth was primarily driven by a 0.2% increase in the services sector, a crucial component of the UK economy. Additionally, the construction sector contributed positively with a 0.4% mom= growth, while production remained steady with no significant change.
On a quarterly scale, GDP figures remained flat at 0.0%, which is a more favorable outcome compared to the anticipated contraction of -0.1% qoq. On a year-on-year basis, GDP registered a growth of 0.6% yoy, indicating a modest but steady recovery from the same quarter in the previous year.
The services sector experienced a slight contraction of -0.1% qoq, whereas construction saw a marginal growth of 0.1% qoq. The production sector's performance was broadly unchanged.
RBA's hawkish SoMP points to another rate hike
RBA's latest Statement on Monetary Policy presents a more hawkish picture than market observers anticipated, with upward revisions in both headline and underlying inflation projections, alongside stronger growth outlook.
More importantly, these projections rest on the assumption that cash rate will peak around 4.50%, comparing to the current 4.35%, suggesting another rate hike could be imminent.
RBA's heightened vigilance against inflation is clear: "The weight of recent information suggests that the risk of inflation remaining higher for longer has increased," the bank stated, highlighting domestic inflation persistence and possible global factors, such as energy market disruptions and food price hikes tied to El Niño effects.
Economic projections now show a year-average GDP growth expected to hit 2.00% in 2023, rising to 1.75% in 2024, and reaching 2.25% in 2025. These figures mark an upgrade from June's forecast of 1.50%, 1.25%, and 2.00% respectively, suggesting a resilient economy that could withstand tighter monetary policy.
Inflation forecasts have also been adjusted upward, with headline CPI inflation now seen at 4.50% at the year's end in 2023, followed by 3.50% in 2024, and softening to 3.00% in 2025. They are upgraded from 4.25%, 3.25% and 2.75% respectively.
The trimmed mean inflation follows a similar upward trajectory, projected to be at 4.50% in year-ended 2023, 3.25% in 2024, and 3.00% in 2025, up from prior forecast of 4.00%, 3.00%, and 2.75% respectively.
Underpinning these projections are technical assumptions of a cash rate peaking at around 4.50%, with a gradual decline to approximately 3.50% by the end of 2025, indicating a higher rate path than previously used.
NZ BNZ PMI fell to 42.5, manufacturing downturn reaches lowest point since 2009
October has marked a significant downturn for New Zealand's manufacturing sector, with BusinessNZ Performance of Manufacturing Index plummeting from 45.1 to 42.5. This figure not only represents the fifth consecutive month of declining activity but also stands as the lowest activity level for a month unaffected by COVID-19 restrictions since May 2009, deeply underscoring the sector's distress.
Delving into the components, the bleak picture becomes clearer: Production has taken a hit, sliding down from 44.3 to 41.5, and employment in the sector is also suffering, with a drop from 45.1 to 43.3. New orders barely held ground, marginally decreasing from 44.8 to 44.1. A significant retreat was seen in finished stocks, which contracted from 51.2 to 45.7, and deliveries were also on the downturn from 44.3 to 42.9.
Amidst these figures, the voice of the industry has tilted towards concern, with 65.1% of comments categorized as negative, albeit slightly less pessimistic than previous months, at 68.8% in September and 66.7% in August.
BNZ Senior Economist, Doug Steel, highlighted the potential ramifications for the broader economy: "Today's PMI is not a good look for GDP and employment growth," he noted. With the current forecasts including a downturn in manufacturing for the latter half of 2023, Steel warned, "There's a chance that decline is bigger than we think, if the PMI does not bounce in the final months of the year."
EUR/USD Mid-Day Outlook
Daily Pivots: (S1) 1.0644; (P) 1.0685; (R1) 1.0709; More...
EUR/USD is trying to draw support from 55 4H EMA (now at 1.0657) and intraday bias remains neutral first. Further rise is in favor as long as this EMA holds. Decisive break of 1.0764 cluster resistance (38.2% retracement of 1.1274 to 1.0447 at 1.0763) will extend the rise from 1.0447 to 61.8% retracement at 1.0958 next. However, sustained break of 55 4H EMA will argue that the rebound has completed, and target 1.0515 support, and then 1.0447 low.
In the bigger picture, price actions from 1.1274 are viewed as a corrective pattern to rise from 0.9534 (2022 low). Rise from 1.0447 is tentatively seen as the second leg. Hence while further rally could be seen, upside should be limited by 1.1274 to bring the third leg of the pattern.
Economic Indicators Update
| GMT | Ccy | Events | Actual | Forecast | Previous | Revised |
|---|---|---|---|---|---|---|
| 21:30 | NZD | Business NZ PMI Oct | 42.5 | 45.3 | 45.1 | |
| 23:50 | JPY | Money Supply M2+CD Y/Y Oct | 2.40% | 2.40% | ||
| 00:30 | AUD | RBA Monetary Policy Statement | ||||
| 07:00 | GBP | GDP M/M Sep | 0.20% | 0.00% | 0.20% | 0.10% |
| 07:00 | GBP | GDP Q/Q Q3 P | 0.00% | -0.10% | 0.20% | |
| 07:00 | GBP | Manufacturing Production M/M Sep | 0.10% | 0.30% | -0.80% | -0.70% |
| 07:00 | GBP | Manufacturing Production Y/Y Sep | 3.00% | 3.10% | 2.80% | 3.00% |
| 07:00 | GBP | Industrial Production M/M Sep | 0.00% | -0.10% | -0.70% | -0.50% |
| 07:00 | GBP | Industrial Production Y/Y Sep | 1.50% | 1.10% | 1.30% | 1.50% |
| 07:00 | GBP | Goods Trade Balance (GBP) Sep | -14.3B | -15.3B | -16.0B | -15.5B |
| 09:00 | EUR | Italy Industrial Output M/M Sep | 0.00% | -0.10% | 0.20% | 0.30% |
| 12:00 | GBP | NIESR GDP Estimate (3M) Oct | 0.10% | -0.10% | 0.00% | |
| 15:00 | USD | Michigan Consumer Sentiment Index Nov P | 63.6 | 63.8 |
NIESR forecasts slight growth for UK economy, averting recession in 2023
According to NIESR's projections, UK economy is set to witness a marginal increase in GDP of 0.1% in the fourth quarter of this year. The institute's report highlighted, "Our central forecast does not expect a recession in 2023."
Delving into the specifics of the economic forecast, NIESR stated, "These forecasts remain broadly consistent with the longer-term trend of low, but stable economic growth in the United Kingdom."
Looking ahead to the next two years, NIESR expects the pace of growth to remain relatively subdued. The institute's report forecasts GDP growth of 0.6% for 2023, followed by further restrained growth of 0.5% in 2024. The primary cause for this muted growth, as per NIESR, is the ongoing productivity slump.
Japanese Yen Under Pressure After Dismal Week
- Fed’s Powell says interest rate hikes still on table
The Japanese yen is drifting on Friday. In the European session, USD/JPY is trading at 151.44, up 0.06%.
It has been a rough week for the Japanese yen, which is down 1.42%, its worst weekly showing since August.
Powell talks hawkish
The markets believe that interest rates have peaked and are looking ahead to rate cuts in 2024, but Fed Chair Powell continues to sound hawkish. Powell said on Thursday that he would not hesitate to raise rates if needed in order to contain inflation and stated that he was “not confident” that inflation would return to 2% under the current policy. The markets still expect a rate cut in mid-2024, but Powell’s remarks led to the markets repricing a cut in July rather than June. It seems that the US economy will have to show much sharper growth before the markets buy into the Fed’s stance that rate hikes remain on the table.
The Japanese yen fell to a one-year low of 151.72 against the dollar on 31 October. Not far off is 151.96, which was last year’s peak and the highest level in some 33 years. With the yen not far from these levels, there is concern that Japan’s Ministry of Finance (MOF) could intervene in the currency markets in order to prop up the ailing yen. The MOF has been jawboning, warning that it is alarmed by the yen’s sharp depreciation. Will this be enough to scare off speculators or will the MOF decide that action is needed to back up tough talk? If the yen continues to lose ground, the possibility of intervention will become more likely..
USD/JPY Technical
- USD/JPY is putting strong pressure on resistance at 151.56. Above, there is resistance at 152.87
- There is support at 151.12 and 150.51
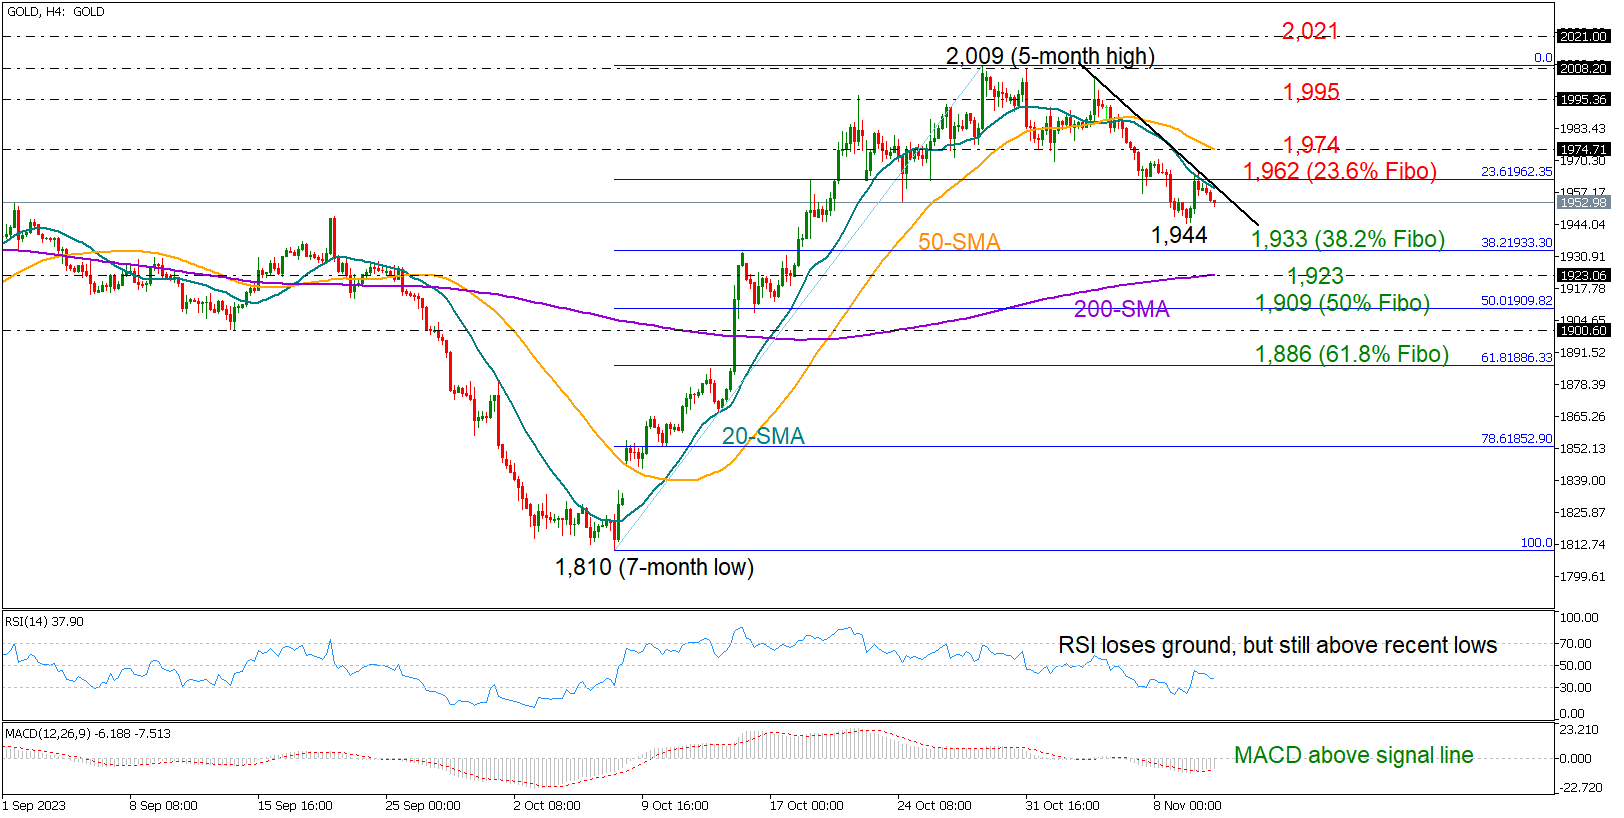
AUD/USD: On Track for Weekly Loss of Over 2%
AUDUSD remains firmly in red for the fifth straight day and on track for a weekly loss of over 2% which erased the most of previous week’s gains.
Aussie came under increased pressure from the Fed’s latest hawkish shift, which so far offsets renewed hawkishness from the RBA on growing fears that inflation will remain resilient, indicating possible further rate hikes.
Technical picture on daily chart weakened significantly as the price broke below thick daily cloud and MA’s turned to bearish setup, while 14-d momentum is trending lower but still holding in positive territory.
On the other hand, deeply oversold stochastic may slow bears for consolidation which should offer better selling opportunities if limited and keeping bears intact.
Initial resistance lays at 0.6366 (broken Fibo 61.8% / 20DMA), with extended upticks to stay below 0.6396 (daily cloud base / daily Kijun-sen)) and maintain bearish bias.
Res: 0.6366; 0.6396; 0.6408; 0.6426.
Sup: 0.6329; 0.6314; 0.6285; 0.6270.
GBP/USD Stems Slide as GDP Beats Estimate
- UK GDP flat in third quarter
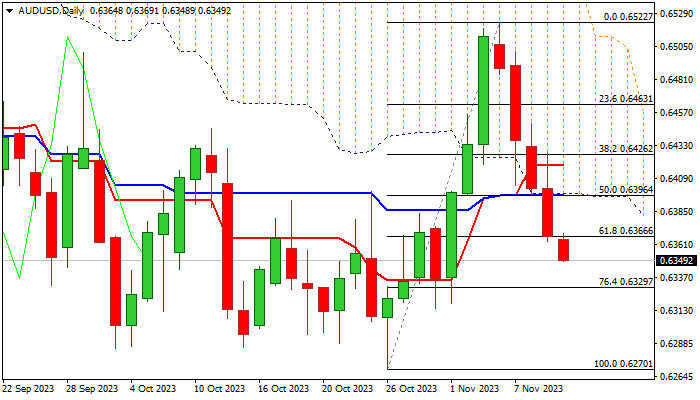
The British pound is steady on Friday. In the European session, GBP/USD is trading at 1.2219, down 0.02%. The pound is coming off a nasty four-day slide, in which it declined 1.19%.
GDP flatlines in Q3
Today’s UK’s GDP numbers weren’t pretty, but they managed to beat the forecasts, which has helped the British pound stabilize after a disappointing week. The economy flatlined in the third quarter, below the Q2 reading of 0.2% q/q but higher than the market consensus of -0.1%. Monthly, GDP eked out a gain of 0.2%, versus a revised 0.1% in July and above the market consensus of 0.0%.
The lack of growth in the third quarter is nothing to cheer about, but at least the UK will avoid a recession this year, which is defined as two consecutive quarters of negative growth. High interest rates and stubborn inflation continue to squeeze consumers and businesses, and a sharp drop in house sales has dragged down the services sector. Consumers are in a sour mood due to the cost of living crisis and are expected to cut down on Christmas shopping.
The Bank of England lowered its growth forecast for the fourth quarter at its meeting earlier this month when it kept interest rates unchanged. GDP is expected to rise just 0.1% q/q. Inflation is projected to fall back to the 2% target at the end of 2025, six months later than the previous forecast. Governor Bailey has been stressing that inflation remains too high, but the BoE nevertheless voted to hold rates after 14 straight increases. Another pause at the December meeting would be the central bank’s preferred plan of action, data permitting.
GBP/USD Technical
- There is resistance at 1.2287 and 1.2344
- 1.2183 and 1.2091 and are providing support
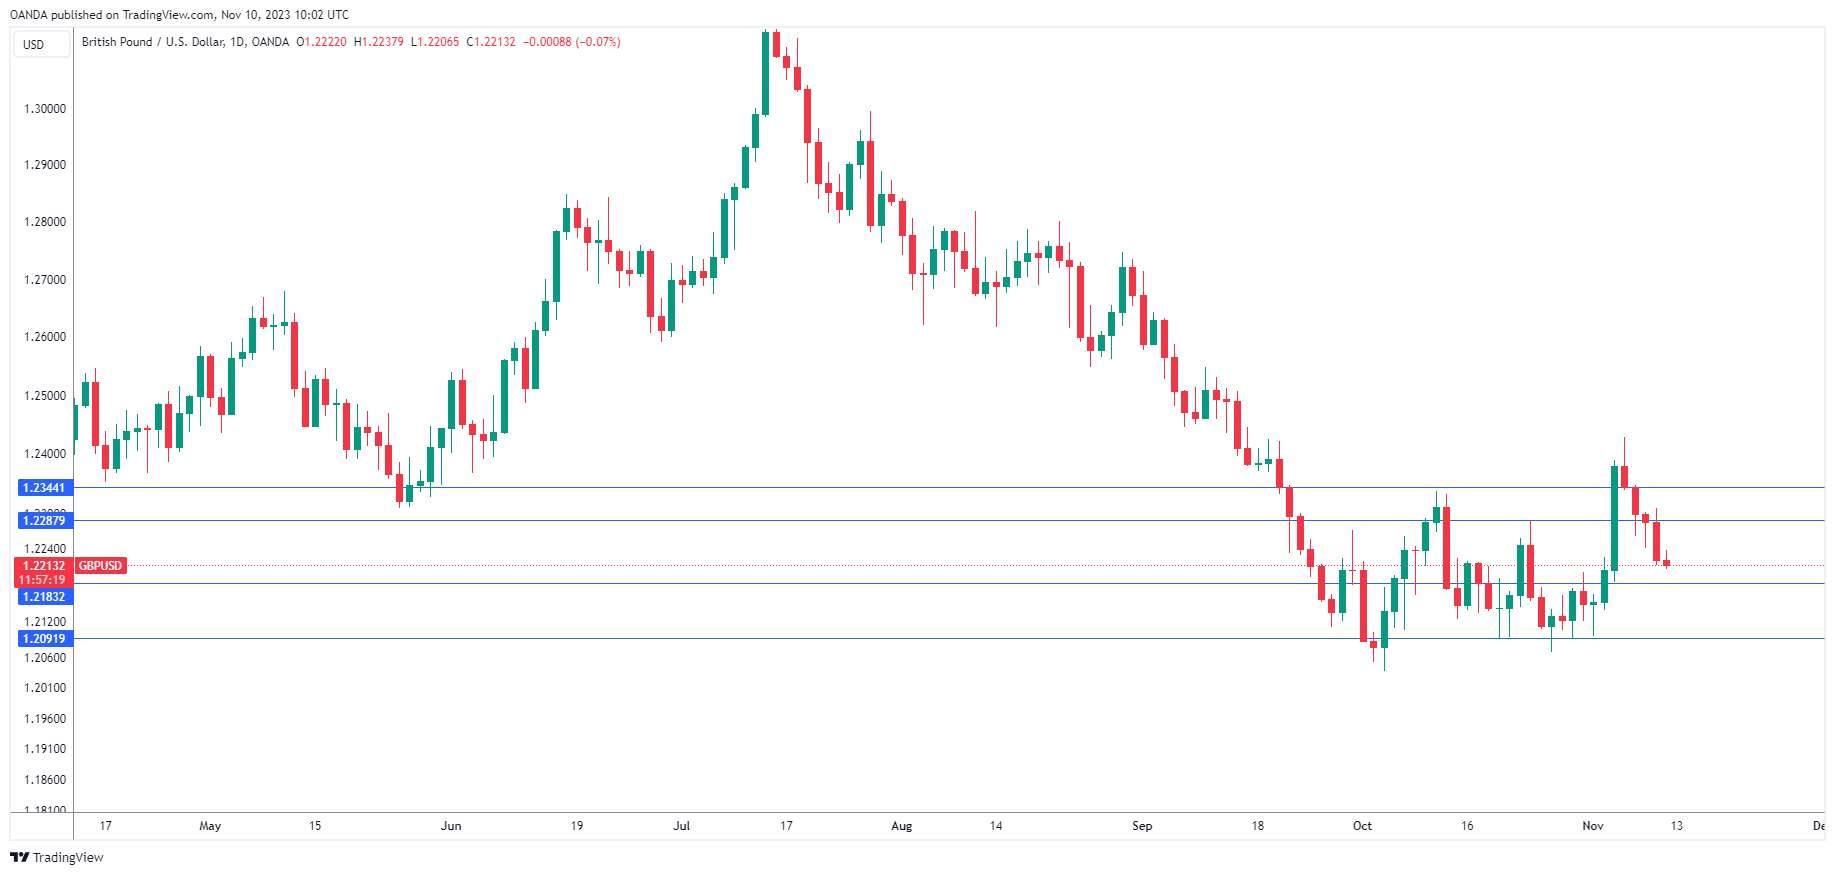
Gold Turns Lower Again
- Gold stalls recovery; cannot surpass 20-SMA
- Sentiment weakens, but the bulls might have another chance
Gold rebounded from a three-week low of 1,944 on Thursday, but the recovery was immediately stopped by the 20-period SMA on the four-hour chart at 1,962. The 23.6% Fibonacci retracement of the previous uptrend cemented that ceiling, forcing the price to move lower.
The latest negative reversal in the RSI is discouraging, but the indicator is still in an upward move since bottoming out in the oversold region. Also, the MACD keeps recovering some distance above its red signal, suggesting that the bulls might have some fuel in the tank.
If resistance at 1,962 stands firm though, the precious metal could plummet again towards the 38.2% Fibonacci level of 1,933. The 200-period SMA might tackle selling pressures slightly lower at 1,923 and ahead of the 50% Fibonacci of 1,909. Then, if the bears breach the 1,900 psychological mark, the bearish wave might pick up pace towards the 61.8% Fibonacci of 1,886.
In the positive scenario, where gold jumps above its 20-period SMA, traders might pay attention to the 50-period SMA at 1,976. A bounce higher could take a breather around the 1,995 barrier. If the bulls successfully claim the latter, they might fight for an uptrend resumption above the wall of 2,009-2,020.
All in all, despite the negative mood in the market, the technical signals leave the door open to another upturn. A rebound above 1,962 could renew buying appetite. Otherwise, November's bearish wave could hit new lows.
GBPJPY Consolidates Near 2-Month Highs
- GBPJPY advanced to its highest since late August
- Trades sideways after failing to extend its breakout
- RSI and MACD are hovering in their positive regions
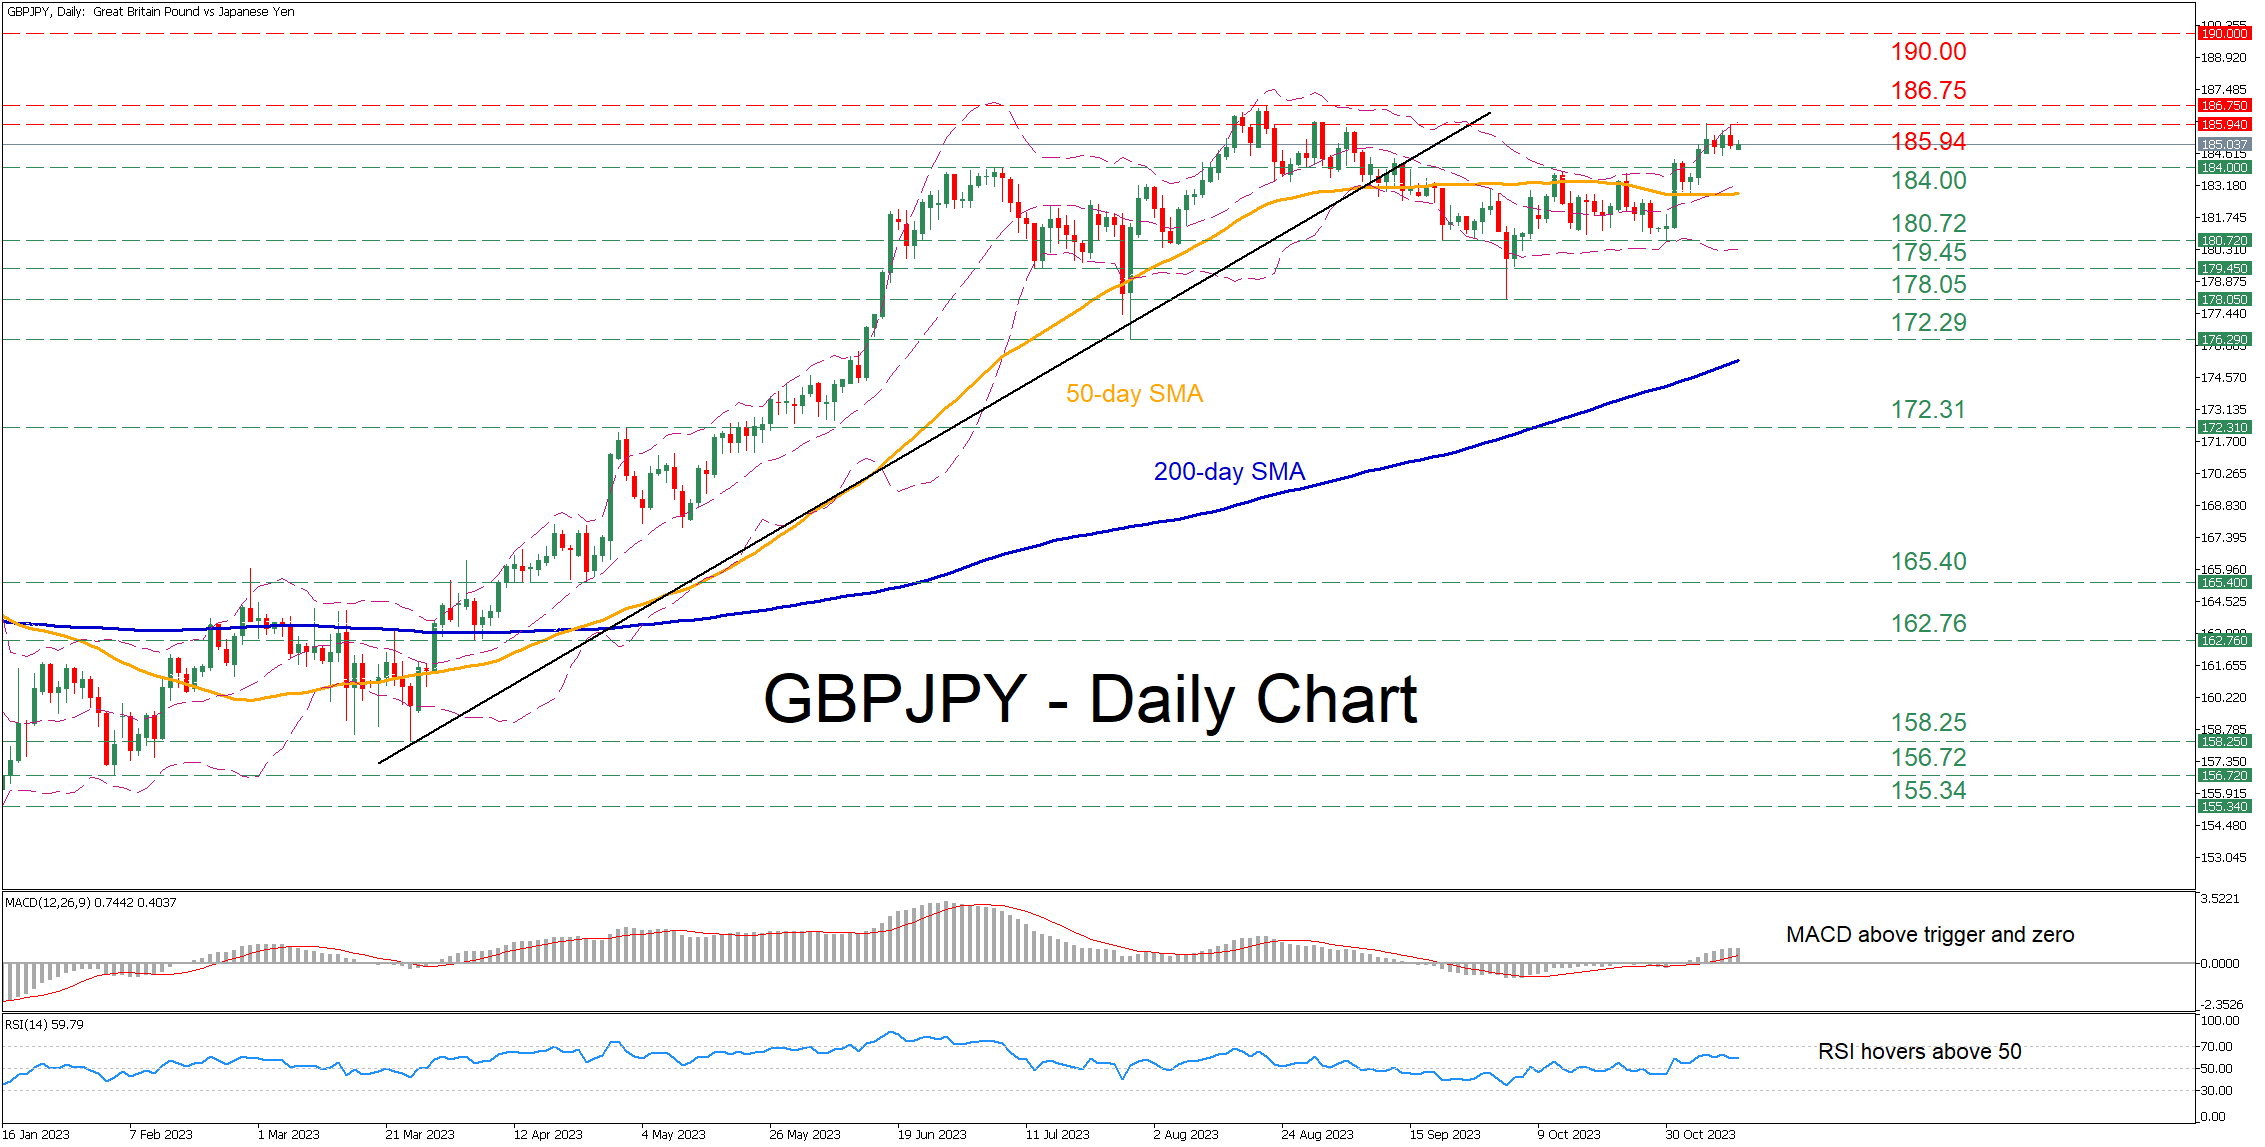
GBPJPY had been in a prolonged uptrend since January, posting an eight-year high of 186.75 on August 22 before experiencing a pullback. After a period of rangebound trading, the pair stormed back above the 50-day simple moving average (SMA) to a two-month peak of 185.94, but its rally seems to have temporarily paused.
Considering that the short-term oscillators remain tilted to the upside, the price could edge higher and revisit its recent two-month high of 185.94. Piercing through that wall, the pair may challenge the eight-year peak of 186.75. If that hurdle also fails, the bulls could propel the price to multi-year highs, where the 190.00 psychological mark might curb further advances.
On the flipside, should the pair reverse lower, immediate support could be found at 184.00, which acted as strong resistance both in July and October. A break below that region could trigger a retreat towards the September-October support zone of 180.72. In case of a downside violation, the bears may then attack the 179.45 hurdle, which held strong both in July and October.
In brief, GBPJPY retains a muted tone in the past few sessions despite its solid spike to the upside. Can the pair extend its advance or are we heading for a reversal?
USDCAD Tests 1.3800 Tricky Area
- USDCAD marks positive week, but slows pace near 1.3800
- Short-term bias skewed to the upside, but caution needed
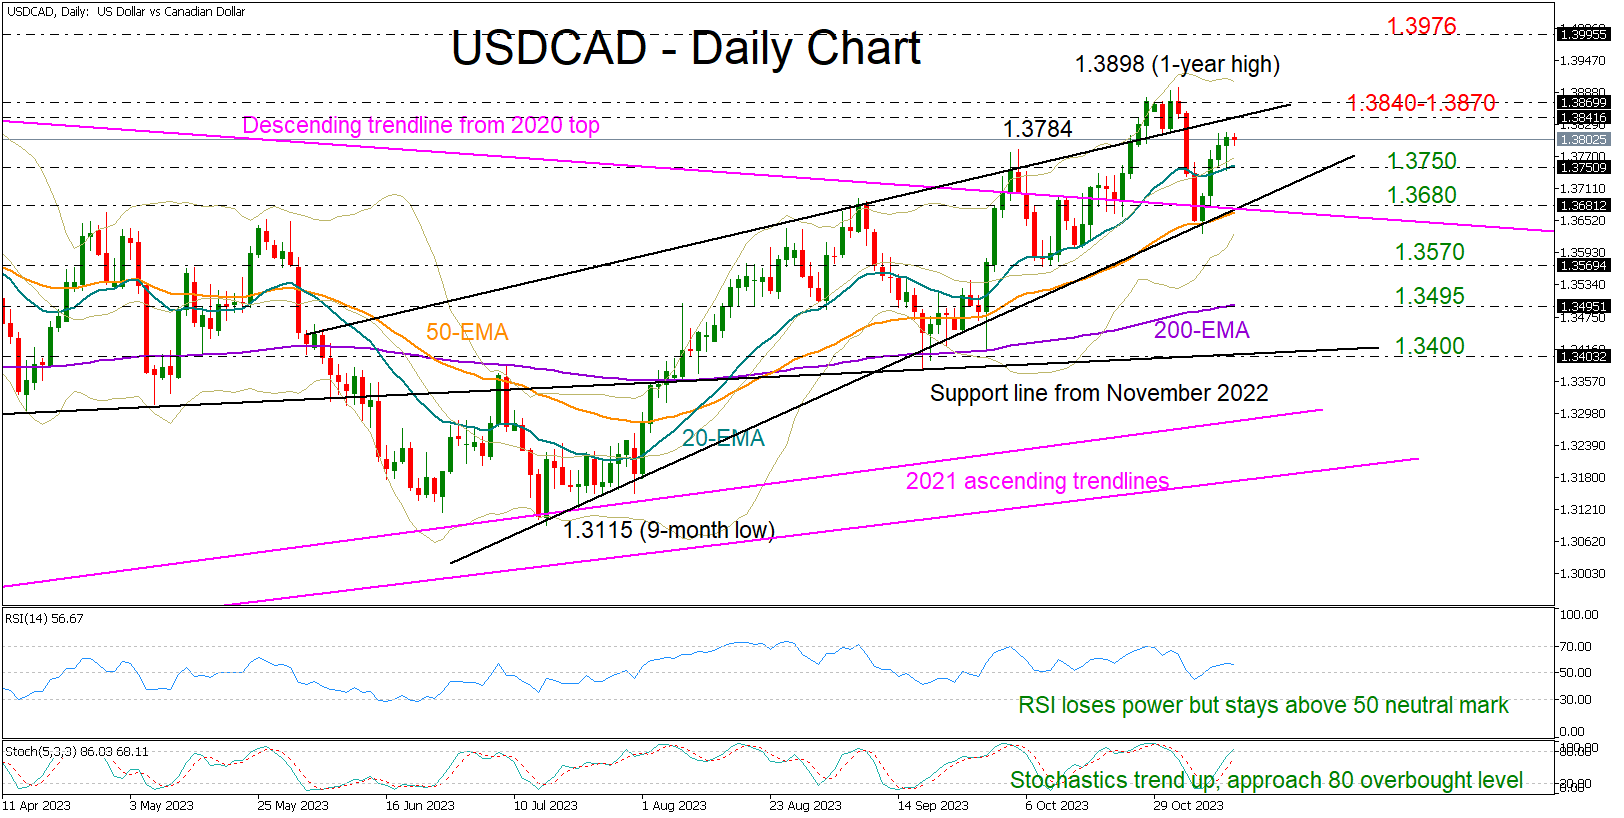
USDCAD has been in a bullish corrective mode during the week, retracing some of its losses from November’s one-year high of 1.3898.
Entering the 1.3800 area has been a struggle over the past two days, and there might be another tough obstacle within the 1.3840-1.3870 region, but the bulls may not give the battle yet, according to the technical indicators. Specifically, the RSI is still standing above its 50 neutral mark, despite losing some pace, and the stochastic oscillator has yet to confirm overbought conditions, both keeping the bias on the positive side for now.
In the event the pair re-activates its uptrend above November’s top of 1.3898, the next target will be the 2022 high of 1.3976 and the 1.4000 psychological mark. Even higher, the bulls might head for the 1.4100 number, which was a key resistance area during the first half of 2020.
On the downside, the 20-day exponential moving average (EMA) has been containing selling forces over the past two days. Hence, a step beneath that line at 1.3750 might produce fresh negative volatility, likely squeezing the price towards the 1.3680 trendline area. Another defeat there could add more fuel to the bearish wave, bringing the 1.3570 barrier immediately under the spotlight.
Overall, USDCAD is sustaining an upward trend above 1.3650-1.3670 in the four-month picture. To attract new buyers, the pair will need to pierce through the 1.3840-1.3860 bar.
ETH/USD Growing Rapidly on News from BlackRock
As it became known, BlackRock has filed an application with the SEC for an ETF based on spot Ethereum. Information about the iShares Ethereum Trust appeared on the Nasdaq website.
If such an expression is acceptable, the price of the second cryptocurrency has gone in pursuit of bitcoin, which is rewriting the highs of the year amid expectations associated with the approval of applications for ETFs for spot bitcoin — approval from the SEC already seems inevitable.
In just 10 hours after the news was published, the price of ETH/USD increased by more than 10%. The excitement is fueled by speculation that other Wall Street giants may file bids after BlackRock.
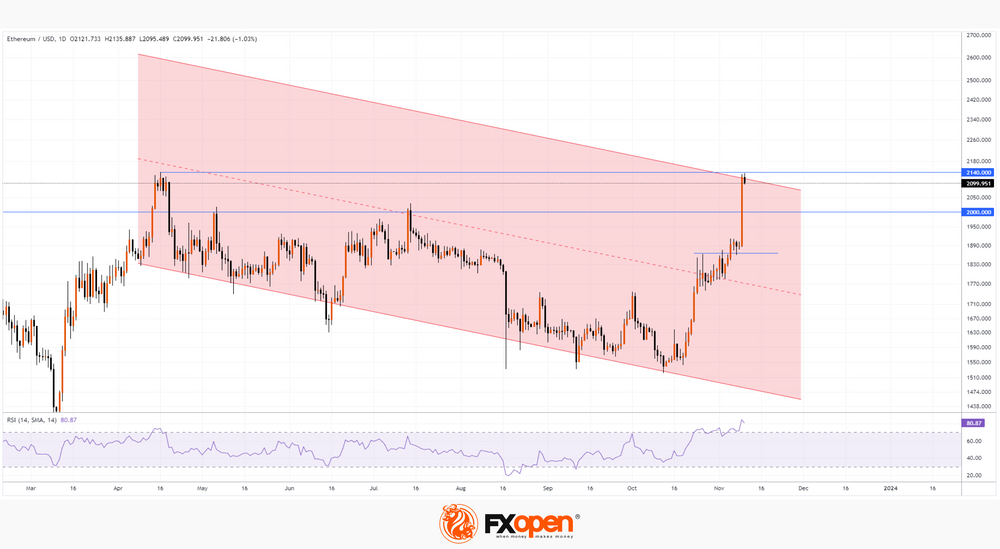
The ETH/USD chart shows that:
→ the price of Ethereum came close to the year’s high at 2140, set in April;
→ RSI indicates that the market is extremely overbought, which means it is vulnerable to a pullback.
The likelihood of a rollback is increased by the fact that the price of ETH/USD has slowed down its growth near the resistance block, which is formed by:
→ the upper limit of the parallel downward channel;
→ resistance from the high of the year.
It is possible that a pullback could occur after the formation of a double or triple top pattern on the hourly charts with a false breakout of the year's high, which would lure more buyers into the market, thereby making the correction more reasonable. Fundamentally though, the backdrop will remain strong as potential application approvals will make it possible for a wide range of investors to easily invest in Ethereum, increasing demand for this crypto asset.
This article represents the opinion of the Companies operating under the FXOpen brand only. It is not to be construed as an offer, solicitation, or recommendation with respect to products and services provided by the Companies operating under the FXOpen brand, nor is it to be considered financial advice.