Sample Category Title
USD/JPY Pierces Through 150-level
Markets
US Treasuries went into full sell-off mode again, especially during yesterday’s US session. In absence of genuine market drivers, it proves that underlying bond sentiment is still bearish with any correction (eg on Fed comments, Israel-Hamas, Ackman tweet,…) short-lived. A tailing $52bn 5-yr Note auction added to the move in the end. US yield closed up to 14.8 bps higher at the 30-yr tenor with both real yields and inflation expectations on the rise. From a technical point of view, the US 10-yr yield has its eyes on the psychologic 5% mark again. The bond sell-off added to early weakness on US stock markets where Nasdaq immediately underperformed following Alphabet earnings. Key US indices closed 0.3% (Dow) to 2.4% (Nasdaq) lower. The S&P 500 and Nasdaq posted new sell-off (closing) lows. The dollar had its moment of shine on Wednesday, but was not really able to build out gains. The move accelerates again this morning as USD/JPY pierces through the 150-level, adding pressure on the Bank of Japan. The trade-weighted dollar currently changes hands around 106.75 compared to 106.25 yesterday morning. EUR/USD trades below 1.0550 from 1.06. German yields rose 3.1 bps (2-yr) to 7.3 bps (30-yr). Sterling underperformed other majors in yesterday’s climate, with EUR/GBP moving further away from the technical 0.87 pivot (currently 0.8730).
“Based on its current assessment, the Governing Council considers that the key ECB interest rates have reached levels that, maintained for a sufficiently long duration, will make a substantial contribution to the timely return of inflation to the target.”, was introduced in the ECB’s policy statement after a solid majority voted to raise the deposit rate to 4% in September. We don’t expect this guidance to be altered today when the ECB skips a rate hike for the first time since the tightening cycle started in July of last year. Weak growth momentum (see PMI’s), tightening financial conditions (ECB credit survey), disinflationary forces (as expected) and the increase in long term bond yields defend the status quo. While the central bank will officially stick to its tightening bias, we think that ECB Lagarde will face a difficult task convincing investors/the front end of the curve. A rally in longer term bonds seems less likely while the euro faces an uphill battle. Any talk on accelerating liquidity reduction (eg halting PEPP reinvestments) is a wildcard.
News & Views
The Bank of Canada stood pat for a second meeting straight. With policy rates at 5% currently, Governing Council noted growing evidence of dampening economic activity easing price pressures. Consumption has been subdued and investment weighed down. The labour market remains on the tight side and wage pressures persist. However, recent job gains didn’t match labour force growth and job vacancies have continued to ease. Overall, a range of indicators suggest that supply and demand in the economy are now approaching balance. Near-term weakness leads to a smaller expansion than expected in July for this year (1.2% vs 1.8%) and the next (0.9% vs 1.2%) followed by a pickup in late 2024 and through 2025. The BoC said headline inflation was particularly volatile in recent months. Near-term inflation expectations and corporate pricing behaviour are normalizing only gradually and wages are still growing around 4% to 5%. Measures of core inflation show little downward momentum. CPI was revised higher for 2023 and 2024 because of higher energy prices and persistence in core inflation. While it still should ease towards 2% in 2025, Governing Council expresses concern about the slow progress towards price stability against the background of increased inflationary risks. That’s why it holds on to a tightening bias. Money markets don’t buy it though, attaching only a 40% probability for a final hike in January. The Canadian loonie slipped against an overall strong USD yesterday. USD/CAD closed just shy of the 1.38 big figure and is trying to push through this morning.
South Korean GDP growth beat expectations by growing 0.6% q/q in Q3 this year, matching the previous quarter’s pace. Its economy is now 1.4% bigger than in the same period last year. Net exports were the dominant driver but household consumption and business investment grew as well. Government consumption rose too, even as the administration flagged the need for keeping a lid on its expenses. Today’s outcome offers arguments for the Bank of Korea to keep policy restrictive for long enough, especially given that inflation, both headline (3.7% in September) and core (3.3%), are still well above the 2% target. The South Korean won this morning loses territory but that’s mainly because of the strong US dollar. USD/KRW rallies to 1359.4, up from 1349.45 at the close yesterday.
Focus Turns to ECB
Market movers today
Today's main event is ECB meeting where the Governing Council is widely expected keep rates on hold. This would be the first time of no change in policy rate since June last year. Since September, inflation and growth data have been broadly in line with expectations and taking into account the clear guidance from ECB, this clearly supports the case for pausing. We expect Lagarde to acknowledge a discussion on advancing the PEPP reinvestments during the Q&A part of the press conference, thereby signalling a tightening bias, albeit with some optionality still in its communication. Markets are pricing ECB policy rates largely unchanged for the coming six months, before a very slow and gradual rate cutting cycle commences from Q2 next year. Read more in ECB Preview: Keeping a tightening bias with optionality, 17 October.
We also get Q3 GDP data from the US. We expect GDP to have grown by 3.3% q/q AR, driven by still upbeat private consumption and structures investment.
Before we tune in for the ECB, trade balance statistics from Sweden provides the final data to assess how real net exports has evolved.
The 60 second overview
US Politics: Mike Johnson was elected as the new Speaker of the House last night, more than three weeks after Kevin McCarthy was ousted from the position. Johnson, who is a relatively junior member of the republican house leadership, was endorsed broadly by both conservative and moderate party members ahead of the vote, and eventually gained unanimous support from all 220 republicans in attendance. Johnson is a conservative, and has so far signaled support for aid to Israel, border security and advancing funding legislation to avoid a government shutdown. The latter will be the on the top of the agenda for the House, with the previous Continuing Resolution funding bill running out on 17 November. Another key uncertainty relates to Johnson's position on Ukraine, and whether he will bring Biden's USD106bn supplemental funding package (covering aid for both Israel and Ukraine) to the House floor for a vote.
UAW strike. Overnight, a tentative agreement was reached between the United Auto Workers (UAW) and Ford Motor in an effort to put a halt to the strikes that have been ongoing for the past six weeks. The tentative agreement includes an hourly wage hike of 25% over the span of the contract period, which exceeds four years.
Fed preview: Yesterday we published our Fed preview: Near-term bloom, long-term gloom?, 25 October. In brief, we expect the Fed to remain on hold at the next week's meeting, in line with consensus and market expectations, and look for no further hikes at a later stage. While the recent US macro data releases have inarguably been stronger than we anticipated, tightening financial conditions ease the pressure to continue hiking the policy rate. The rise in long-end yields is driven by the term premium, and as such seems uncorrelated with the latest Fed guidance. The fact that the Fed is no longer fully in control of financial conditions could tilt Powell to take a more cautious stance in his remarks.
Riksbank. The Riksbank hawk Per Jansson yesterday said that "we are approaching key interest rate peak" and added that in hindsight, he could have supported a higher interest rate increase at their last decision. However, he also said that next month's inflation figure will have a big impact on their decision for the November meeting.
Equities: Equities were lower and yields were higher yesterday. However, there is more to the story since both an earnings effect and a more recession-like rotation took place yesterday. Q3 results (Alphabet earnings) sent the communication service sector lower and the media industry will be in focus again today (Meta reported after US close yesterday). More interestingly in our opinion is that utilities and consumer staples outperformed yesterday despite the heavy lift to yields. Hence, nervousness is increasing in equity space and investors are seeking shelter in the defensives despite the solid underlying macro trends. In US yesterday, Dow -0.3%, S&P 500 -1.4%, Nasdaq -2.4% and Russell 2000 -1.7%. Risk-off is spreading to Asia this morning with both South Korea and Japan being down around 2%. Futures in both Europe and US are substantially lower this morning as well.
FI: With little new market information, yesterday was mostly a waiting game ahead of today's ECB meeting. However, curves bear steepened from the long end yet again driven by the long end in the US with 30y UST up 12bp on the day. European 30y yields ended around 7bp higher on the day. This led the 10y US-German yield spread to widen further to now stand at 205bp which is more than 100bp higher than just 5 months ago. In aggregate, yesterday's yields developments were a partial reversal of the strong flattening on Monday.
FX: In a quiet session yesterday, the USD broadly strengthened in the G10 space, and EUR/USD declined below 1.06. USD/JPY climbed above 150. USD/CAD trades around 1.38 after the Bank of Canada kept the policy rate unchanged for the third meeting in a row, as widely expected. EUR/GBP is relatively flat, just above 0.87. The sell-off in scandies somewhat stabilised, with EUR/NOK slightly above 11.80 and EUR/SEK just below 11.80.
Credit: With long term rates resuming their upward trajectory, the credit markets recorded another risk-off session yesterday. Itraxx main widened by 2bp to 87.4bp and Xover widened 7.3bp to 462.3bp. The primary markets remain largely closed amid the Q3 reporting season, but already next week we could see a re-flurry of deals from corporates seeking to get first in line in the Q4 funding window.
Nordic macro
Sweden. Trade Balance and household lending growth is released today at 08:00 CET. Seasonally adjusted real goods trade balance has improved over the past two months, and we expect this continued in September. Overall, net real exports should add to Q3 GDP growth. The October Economic Tendency Survey is presented at 09:00 CET and will be scrutinized on three specific points: 1) Any signs of bottoming in manufacturing and services confidence, 2) The balance between hiring expectations and labour hoarding and 3) Selling price plans in retail trade and services. The first two will give hints about the probability of a recession and the latter how disinflation at the consumer level is proceeding, it needs to come down further as for example the Riksbank's Per Jansson, yesterday said that it is "absolutely central that the companies' pricing behaviour returns to its former pattern as quickly as possible [...] the less interest rate increases will be required". The price plans will also be interesting since September's inflation print indicated a reverse trend as goods prices increased again while service prices are starting to drop while earlier this year we saw an opposite development. The Debt Office releases its new forecast at 10:00 CET. The underlying budget outcome has been some SEK30bn better than expected. We anticipate the SNDO to adjust the forecast for 2023 in a similar magnitude and revise the budget balance for 2024 higher. The volume of nominal and inflation-linked bonds is expected to be unchanged for 2023 and 2024 and the bulk of the funding cut taken by less T-bills.
AUD/USD Daily Report
Daily Pivots: (S1) 0.6276; (P) 0.6338; (R1) 0.6371; More...
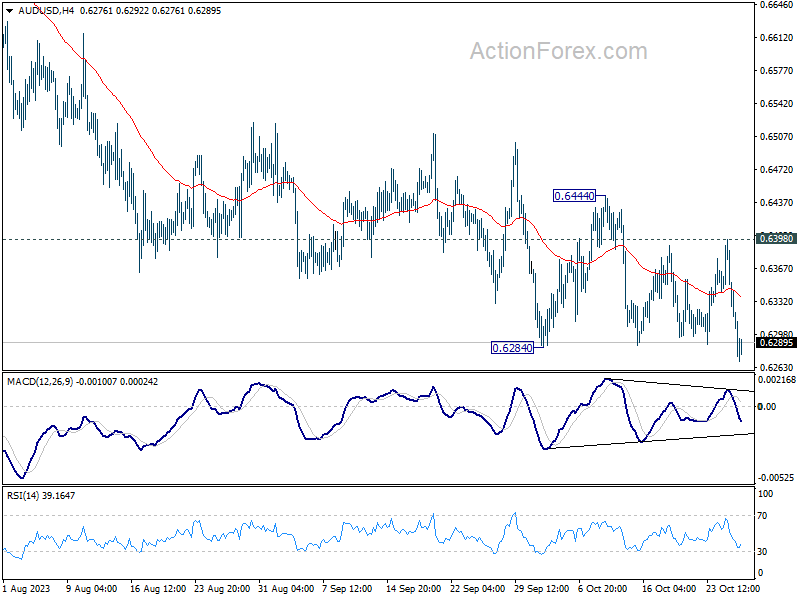
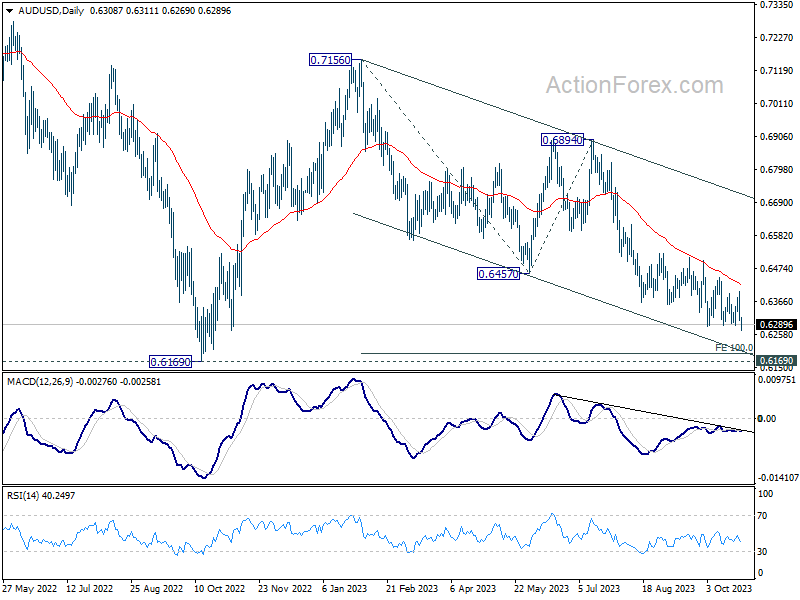
AUD/USD's break of 0.6284 support indicates resumption of whole decline from 0.7156. Intraday bias is back on the downside. Next target is 100% projection of 0.7156 to 0.6457 from 0.6894 at 0.6195, which is close to 0.6169 medium term support. For now, outlook will stay bearish as long as 0.6398 resistance holds, in case of recovery.
In the bigger picture, down trend from 0.8006 (2021 high) is possibly still in progress. Decisive break of 0.6169 will target 61.8% projection of 0.8006 to 0.6169 to 0.7156 at 0.6021. This will now remain the favored case as long as 0.6894, in case of strong rebound.
USD/CAD Daily Outlook
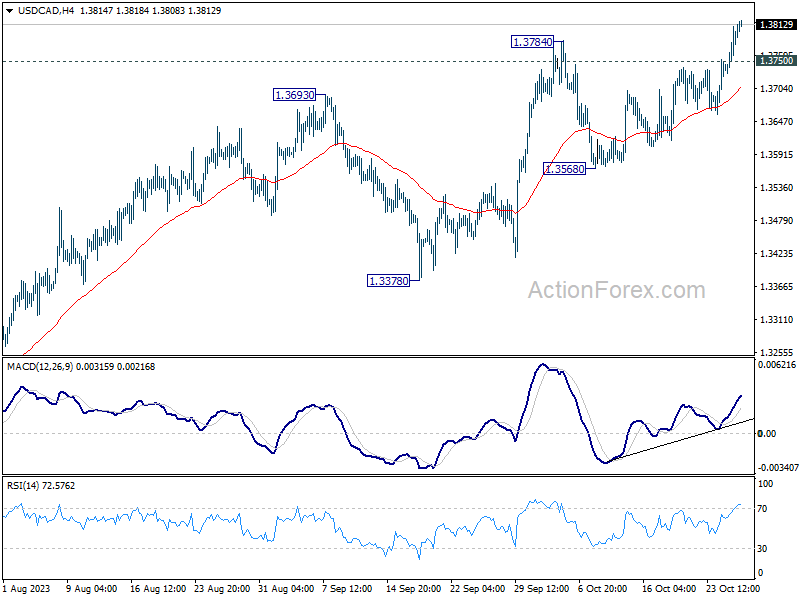
Daily Pivots: (S1) 1.3750; (P) 1.3780; (R1) 1.3829; More...
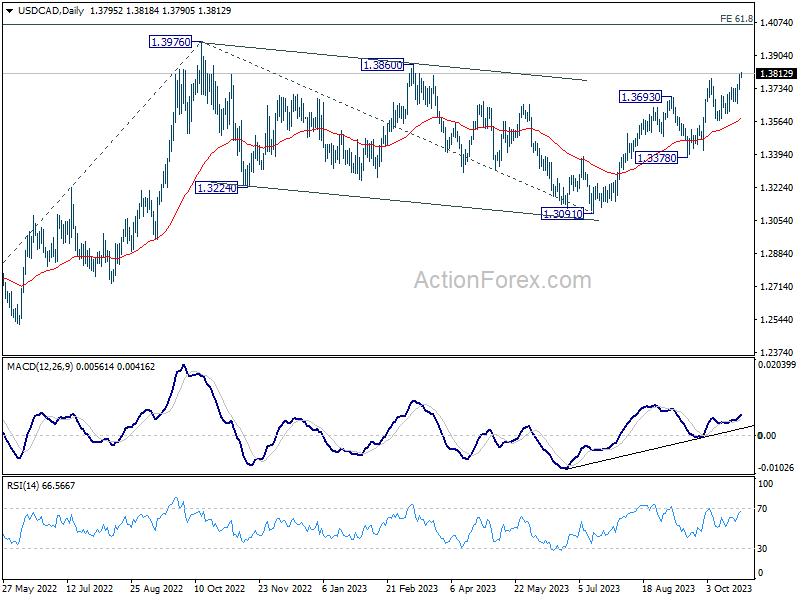
Intraday bias in USD/CAD remains on the upside for the moment. Current rise from 1.3091 should target a retest on 1.3976 high. Decisive break there will resume larger up trend. On the downside, below 1.3750 minor support will turn intraday bias neutral and bring consolidations. But near term outlook will remain bullish as long as 1.3568 support holds.
In the bigger picture, current development revives the case that corrective pattern from 1.3976 (2022 high) has completed with three waves down to 1.3091. Decisive break of 1.3976 high will confirm resumption of up trend from 1.2005 (2021 low). Next target will be 61.8% projection of 1.2401 to 1.3976 from 1.3091 at 1.4064. This will now remain the favored case as long as 1.3378 support holds.
EUR/USD Daily Outlook
Daily Pivots: (S1) 1.0552; (P) 1.0580; (R1) 1.0593; More...
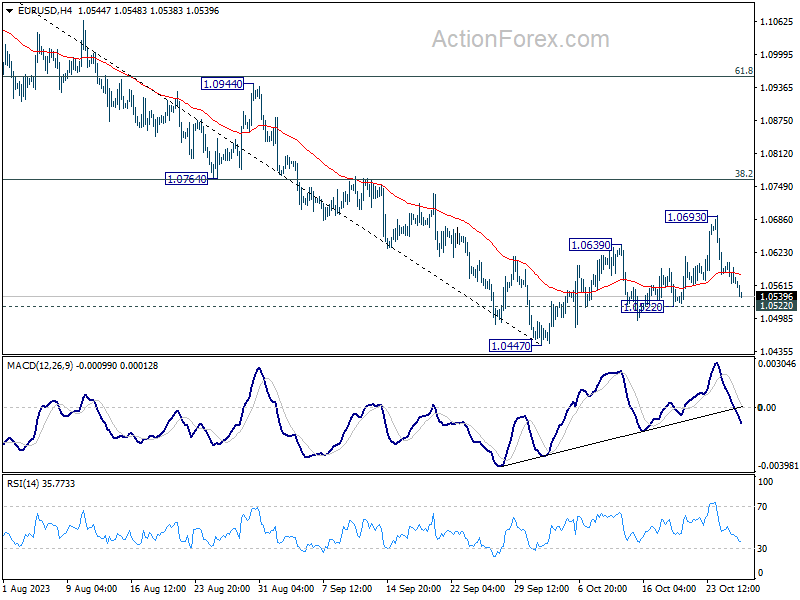
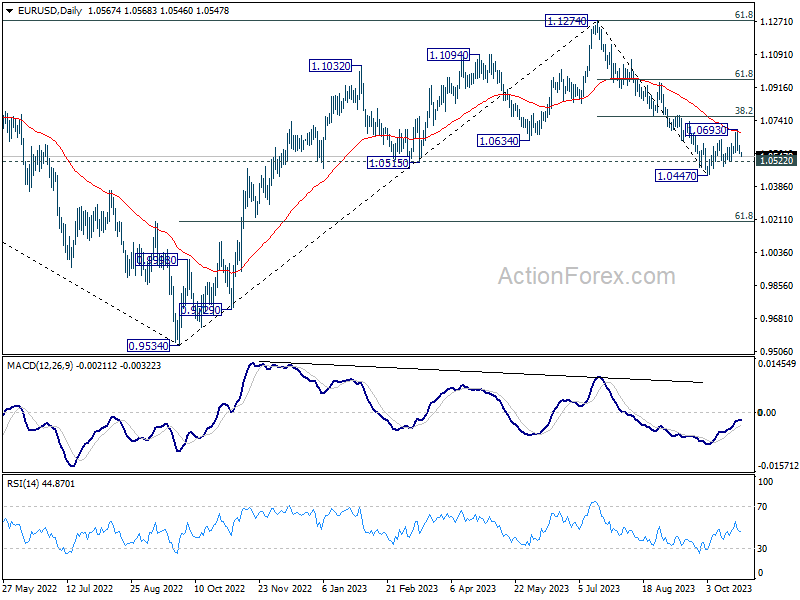
Intraday bias in EUR/USD stays neutral first. On the downside, break of 1.0522 support will confirm rejection by 55 D EMA, and retain near term bearishness. Intraday bias will be back on the downside for 1.0447. Break there will resume larger fall from 1.1274. On the upside, above 1.0693 will resume the rebound from 1.0447 to 1.0764 cluster resistance (38.2% retracement of 1.1274 to 1.0447 at 1.0763).
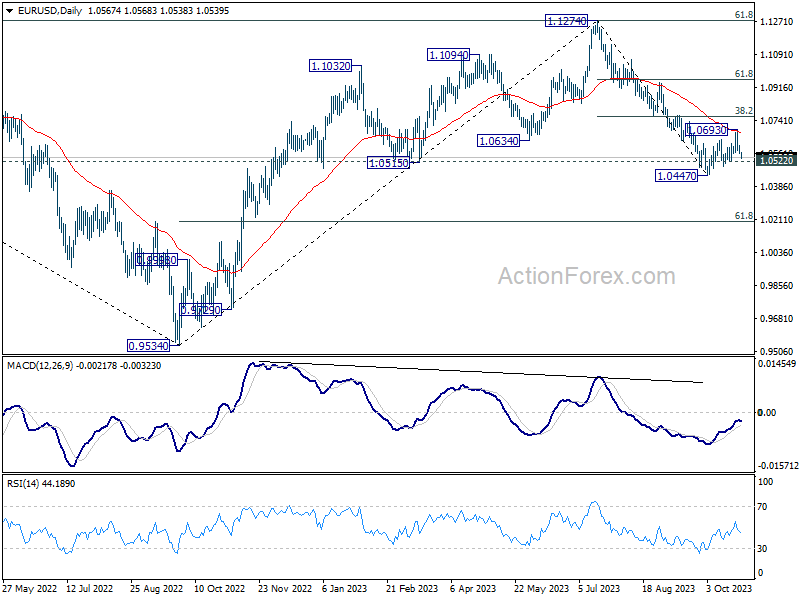
In the bigger picture, fall from 1.1274 medium term top could still be a correction to rise from 0.9534 (2022 low). But chance of a complete trend reversal is rising. In either case, current fall should target 61.8% retracement of 0.9534 to 1.1274 at 1.0199 next. For now, risk will stay on the downside as long as 55 D EMA (now at 1.0684) holds, in case of rebound.
GBP/USD Daily Outlook
Daily Pivots: (S1) 1.2085; (P) 1.2131; (R1) 1.2156; More
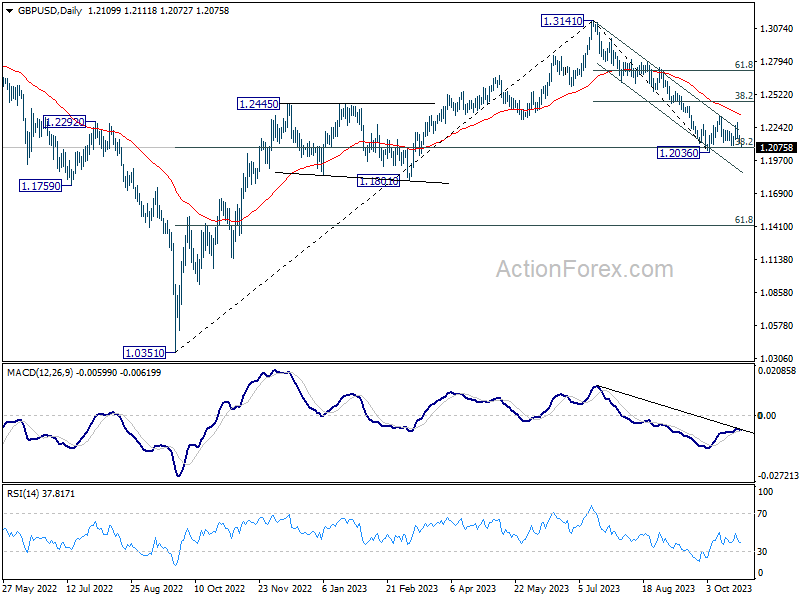
GBP/USD is still bounded in range above 1.2036 and intraday bias stays neutral. Downside breakout is still in favor with 1.2336 resistance intact. On the downside, decisive break of 1.2036 will resume whole decline from 1.3141 for 1.1801 support next. However, break of 1.2336 will turn bias back to the upside for 38.2% retracement of 1.3141 to 1.2036 at 1.2458.
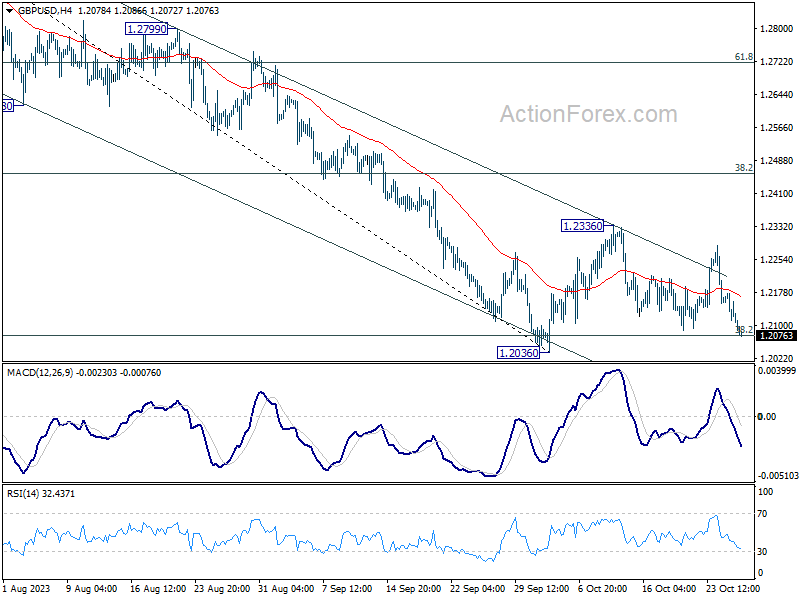
In the bigger picture, fall from 1.3141 medium term top could still be a correction to up trend from 1.0351 (2022 low) only. But risk of complete trend reversal is rising. Sustained break of 38.2% retracement of 1.0351 to 1.3141 at 1.2075 will pave the way to 61.8% retracement at 1.1417. For now, risk will stay on the downside as long as 55 D EMA (now at 1.2384) holds, in case of rebound.
USD/CHF Daily Outlook
Daily Pivots: (S1) 0.8936; (P) 0.8954; (R1) 0.8986; More....
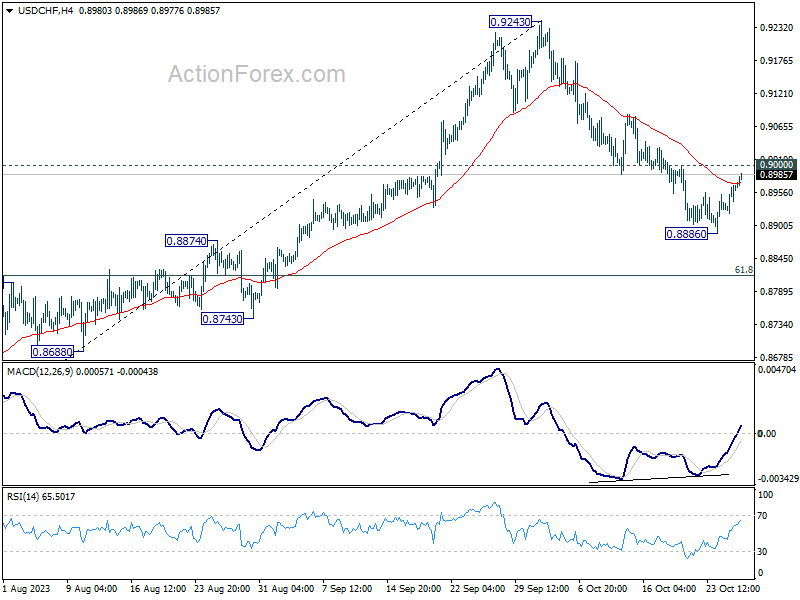
Intraday bias in USD/CHF stays neutral at this point. On the downside, break of 0.8886 will resume the fall from 0.9243 to 61.8% retracement of 0.8551 to 0.9243 at 0.8815 next. However, firm break of 0.9000 resistance will indicate short term bottoming, and turn bias back to the upside for stronger rebound.
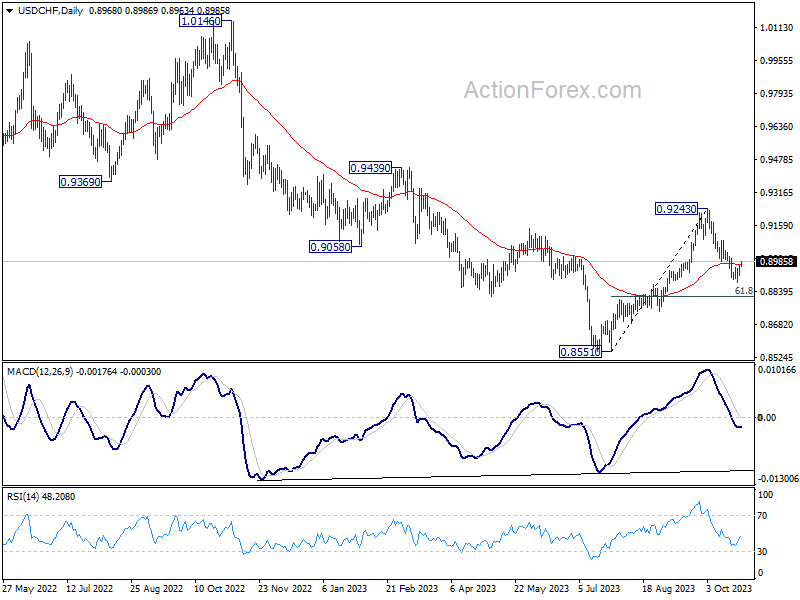
In the bigger picture, rebound from 0.8551 might be completed as a correction at 0.9243. In other words, larger fall from 1.0146 (2022 high) is possibly not over yet. Risk will now stay on the downside as long as 0.9243 resistance holds. Firm break of 0.8551 will confirm down trend resumption.
USD/JPY Daily Outlook
Daily Pivots: (S1) 149.91; (P) 150.12; (R1) 150.43; More...
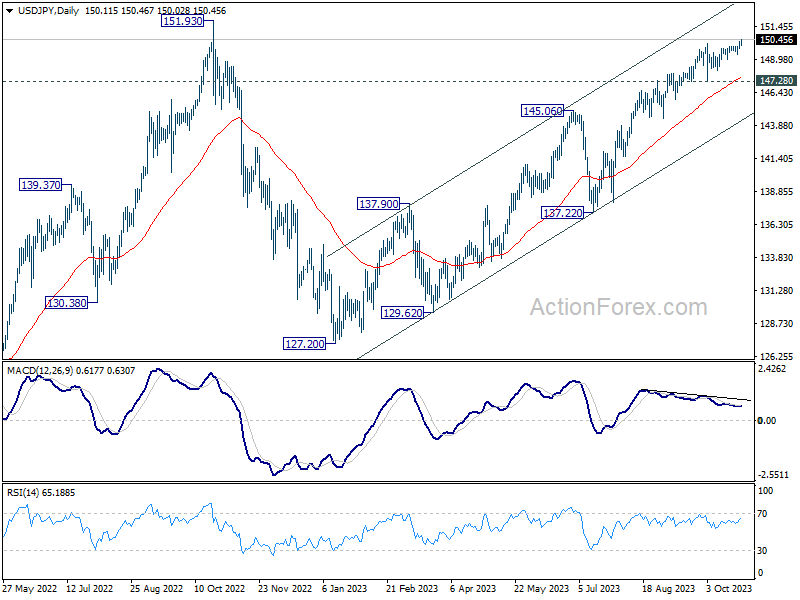
USD/JPY's rally from 127.20 resumed by breaking through 150.15 resistance. Intraday bias is back on the upside for 151.93 high medium term resistance next. On the downside, below 149.84 minor support will turn intraday bias neutral first, and bring consolidations. But near term outlook will now stay bullish as long as 147.28 support holds, even in case of deep retreat.
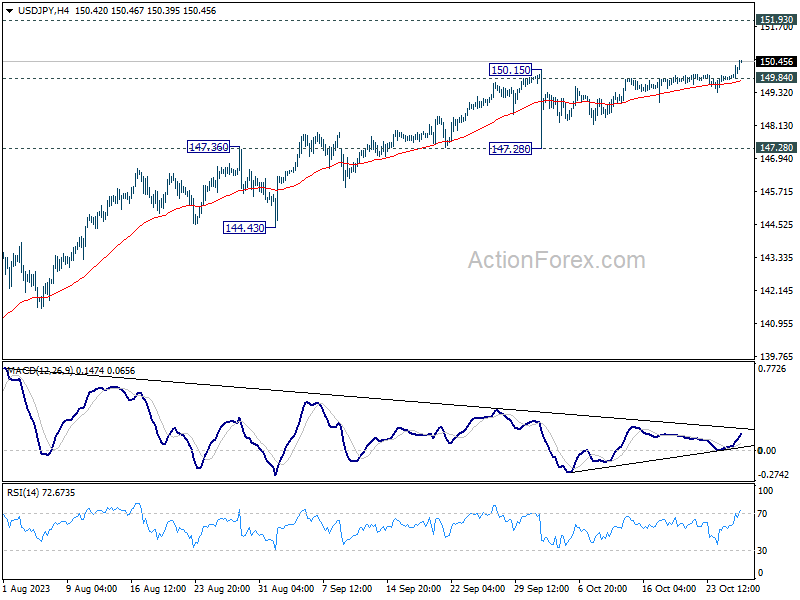
In the bigger picture, while rise from 127.20 is strong, it could still be seen as the second leg of the corrective pattern from 151.93 (2022 high). Rejection by 151.93, followed by sustained break of 145.06 resistance turned support will be the first sign that the third leg of the pattern has started. However, sustained break of 151.93 will confirm resumption of long term up trend.
Dominant Dollar Awaits Crucial ECB Verdict and US GDP Insight
Dollar experienced a broad upsurge overnight, propelled by a robust rebound in benchmark treasury yields and a general mood of risk aversion. This strength continued into the Asian trading session, particularly notable in the greenback's gains against Japanese Yen, which have now extended past the significant 150 mark. Despite verbal interventions from Japan, Yen has received no notable support, leaving Dollar to dominate.
Attention now turns to the US Q3 GDP data release, which could be pivotal in determining Dollar's short-term momentum. Additionally, the global forex markets are keenly awaiting today's ECB rate decision. While a hold on rates is widely anticipated, investors and analysts are eager to gauge ECB's perspective on the resurgence of inflation risks, economic slowdown, and escalating geopolitical tensions.
Australian Dollar is the weakest currency for the day so far, feeling pressure from RBA Governor Michele Bullock's cautious remarks about the recent stronger-than-projected CPI data and the chance of a rate hike in November. Sterling and Kiwi Dollar trail behind as subsequent underperformers. In contrast, Canadian Dollar, presently positioned as the second strongest after US Dollar, is attempting to recuperate from the post-BoC dip witnessed yesterday. Swiss Franc holds its ground as the third strongest, engaging in consolidations against both Euro and Sterling.
From a technical standpoint, NASDAQ resumed the decline from 14446.55 overnight to close at 12821.22. Immediate focus is on 38.2% retracement of 10088.82 to 14446.55 at 12781.89 could prompt downside acceleration through near term channel support. In that case, next target will be 12269.55 resistance turned support.It will be interesting to monitor how the NASDAQ responds to the upcoming GDP data and the subsequent impacts on currencies.
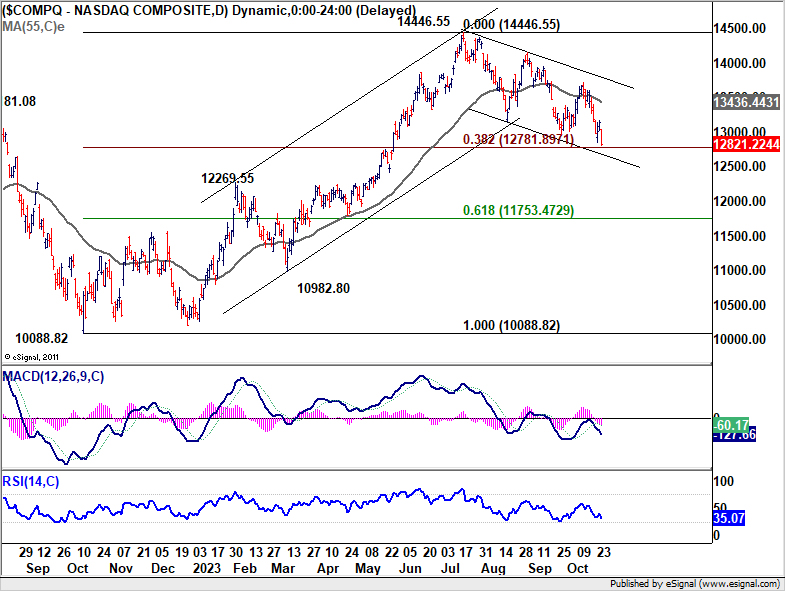
In Asia, at the time of writing, Nikkei is down -2.16%. Hong Kong HSI is down -0.82%. China Shanghai SSE is down -0.20%. Singapore Strait Times is down -0.41%. Japan 10-year JGB yield is up 0.0251 at 0.886. Overnight, DOW dropped -0.32%. S&P 500 dropped -1.43%. NASDAQ dropped sharply by -2.43%. 10-year yield rose 0.113 to 4.953.
RBA's Bullock undecided on rate hike following CPI surprise
In the Senate Economics Committee session today, RBA Governor Michele Bullock indicated that the bank was not entirely caught off guard by the stronger than expected CPI data released yesterday. She refrained from offering a definitive direction for the bank's next steps
The Q3 and September CPI data, which Bullock admitted "came out a little higher" than the projections in the August Statement on Monetary Policy, still aligned with the bank's expectations. She clarified, "The numbers were pretty much where we thought it would come out".
When queried on the prospect of another rate hike in the forthcoming meeting, Bullock responded, "We're still analyzing the numbers at the moment. I wouldn't like to say more or less likely, we're still looking at it."
Bullock reiterated the bank's position, stating, "We've always said we have a low tolerance" on inflation surprises. She added, "We are wary and we don't know if the job has been done yet."
Looking forward, Bullock hinted at imminent changes to their economic projections, announcing, "We will be releasing a new set of forecasts after the board meeting." Moreover, she alluded to the significance of these revisions by stating, "There is going to be a change to our forecasts. We have to look at whether or not it's material enough to change our views on monetary policy."
As USD/JPY breaks 150, Japan faces intervention and YCC decision
In a significant move, USD/JPY surpasses the key psychological level of 150 today, marking its highest point in a year. This uptick has reignited concerns among investors regarding market interventions by Japan, given that the 150 mark is widely regarded as a trigger point for such actions.
Japanese finance minister Shunichi Suzuki addressed the market developments, reiterating, "I'm watching market moves with a sense of urgency, as before." Notably, despite the heightened speculation, he refrained from commenting on any immediate intervention measures. This silence has led to further ambiguity, especially considering the suspected actions by Japan on October 3 to buy Yen, actions that have yet to be officially confirmed.
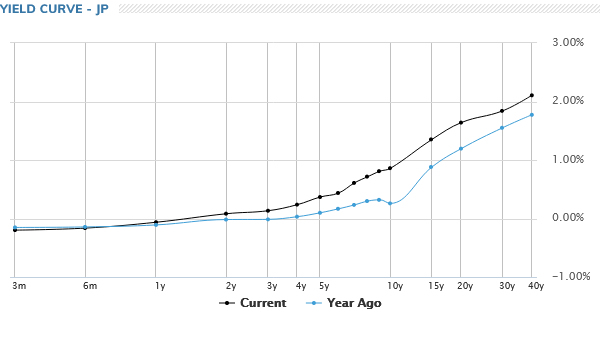
A primary reason for the sustained pressure on Yen can be attributed to increasing yield gap between Japan and other major economies. This disparity intensifies the debate on the necessity for BoJ to revise its yield curve control, especially in light of rising global interest rates. There are rumblings about a possible adjustment to the 10-year yield cap, even though it was adjusted only three months prior, especially with a policy meeting on the horizon.
Nevertheless, BoJ has consistently asserted that previous adjustments to the yield curve control were primarily to rectify any irregularities in the bond market's operations. The current yield curve appears more natural, especially when contrasted against the noticeable dip in 10-year yield in the curve from a year ago. It remains uncertain whether BoJ feels the immediacy to modify its YCC in the near term.
ECB to finally pause, EUR/USD looking soft
Today, ECB is broadly anticipated to maintain its main refinancing rate at 4.50% and the deposit rate at 4.00%. Having increased rates consistently during its previous ten meetings to tackle surging inflation, ECB hinted at a pause last month, reflective of the policy's apparent efficacy, as evidenced by deceleration in the Eurozone economy.
President Christine Lagarde, along with other top officials, has been keen to redirect discussions toward the duration for which the interest rates might need to remain at these current restrictive thresholds.
Amid this backdrop, there's also been speculation regarding ECB's potential move for an early reduction in bond holdings within its colossal EUR 1.7T euro Pandemic Emergency Purchase Programme. However, given the prevailing climate of heightened macroeconomic, geopolitical, and financial ambiguities, it's probable that the ECB will resist any hasty decisions to expedite quantitative tightening.
Some previews on ECB:
Technically, it's possible that EUR/USD's recovery from 1.0447 has completed at 1.0693, after rejection by 55 D EMA. Immediate focus for today is 1.0522 minor support. Firm break there should strengthen this bearish case. Further break of 1.0447 will resume whole fall from 1.1274, and target 61.8% retracement of 0.9534 to 1.1274 at 1.0199 next.
Elsehwere
US GDP is another major focus today. Durable goods orders, goods trade balance and jobless claims will also be featured.
USD/JPY Daily Outlook
Daily Pivots: (S1) 149.91; (P) 150.12; (R1) 150.43; More...
USD/JPY's rally from 127.20 resumed by breaking through 150.15 resistance. Intraday bias is back on the upside for 151.93 high medium term resistance next. On the downside, below 149.84 minor support will turn intraday bias neutral first, and bring consolidations. But near term outlook will now stay bullish as long as 147.28 support holds, even in case of deep retreat.
In the bigger picture, while rise from 127.20 is strong, it could still be seen as the second leg of the corrective pattern from 151.93 (2022 high). Rejection by 151.93, followed by sustained break of 145.06 resistance turned support will be the first sign that the third leg of the pattern has started. However, sustained break of 151.93 will confirm resumption of long term up trend.
Economic Indicators Update
| GMT | Ccy | Events | Actual | Forecast | Previous | Revised |
|---|---|---|---|---|---|---|
| 23:50 | JPY | Corporate Service Price Index Y/Y Sep | 2.10% | 2.00% | 2.10% | |
| 00:30 | AUD | Import Price Index Q/Q Q3 | 0.80% | 0.20% | -0.80% | |
| 12:15 | EUR | ECB Main Refinancing Rate | 4.50% | 4.50% | ||
| 12:30 | USD | Initial Jobless Claims (Oct 20) | 202K | 198K | ||
| 12:30 | USD | GDP Annualized Q3 P | 4.30% | 2.10% | ||
| 12:30 | USD | GDP Price Index Q3 P | 2.50% | 1.70% | ||
| 12:30 | USD | Goods Trade Balance (USD) Sep P | -85.5B | -84.6B | ||
| 12:30 | USD | Wholesale Inventories Sep P | 0.10% | -0.10% | ||
| 12:30 | USD | Durable Goods Orders Sep | 1.00% | 0.10% | ||
| 12:30 | USD | Durable Goods Orders ex TransportSep | 0.20% | 0.40% | ||
| 14:00 | USD | Pending Home Sales M/M Sep | 1.10% | -7.10% | ||
| 14:30 | USD | Natural Gas Storage | 82B | 97B |
Technical Outlook and Review
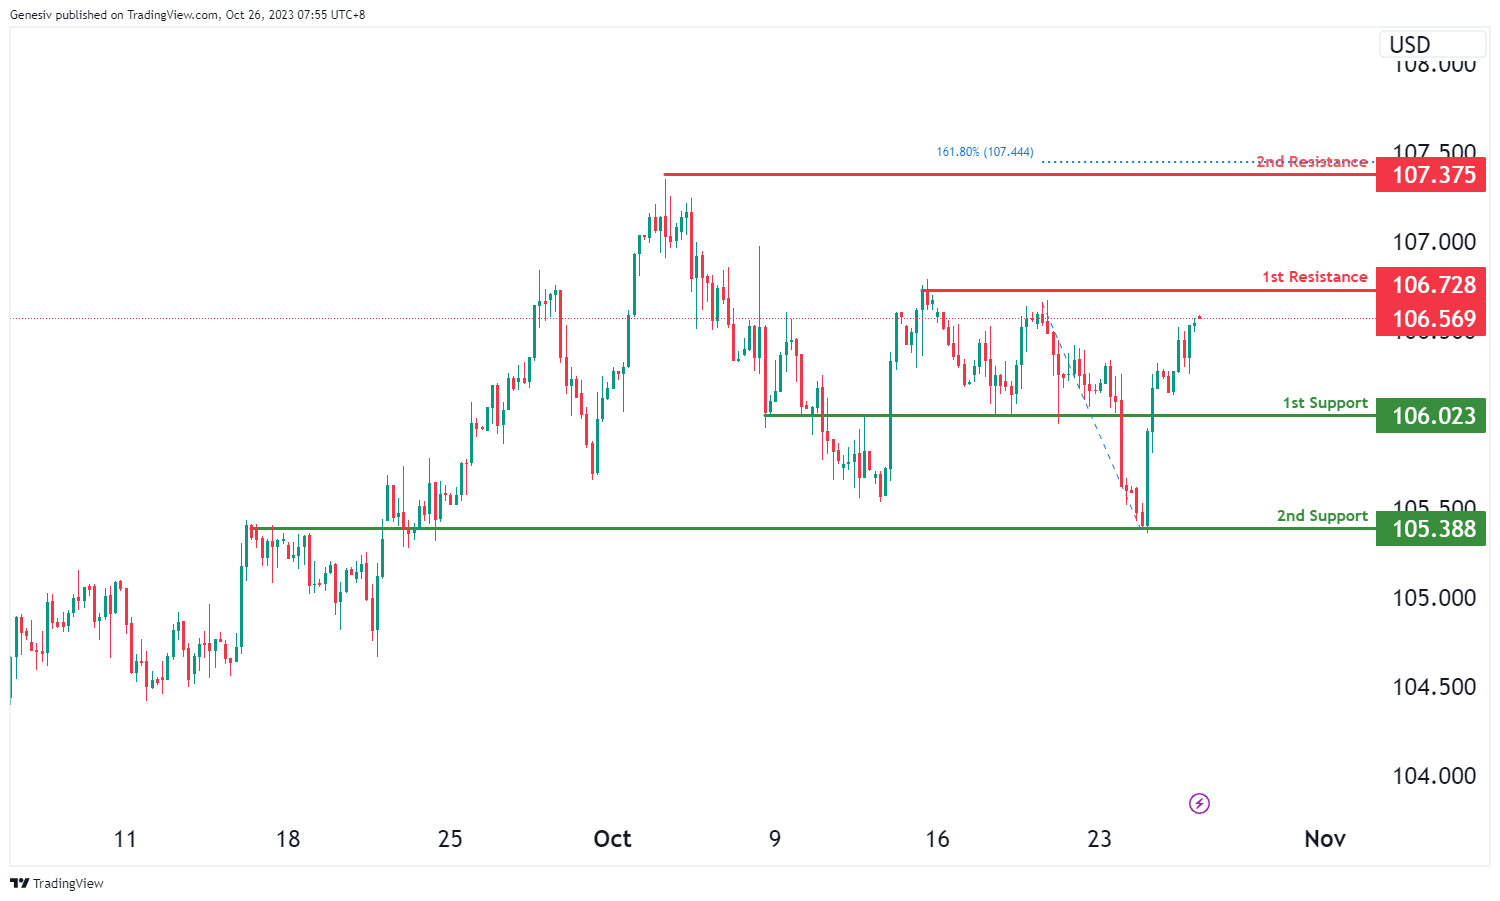
DXY:
The DXY (US Dollar Index) chart currently exhibits a bullish overall momentum, indicating the potential for a bullish continuation towards the 1st resistance level.
The 1st support at 106.02 is considered a significant level as it aligns with a pullback support, suggesting it may provide a foundation of potential price support. Furthermore, the 2nd support at 105.38 is identified as an overlap support, reinforcing the potential for it to act as a support level.
On the resistance side, the 1st resistance at 106.72 is characterized as a swing high resistance level, indicating that it may serve as a notable barrier to upward price movement. Additionally, the 2nd resistance at 107.37 is identified as a swing high resistance and is associated with the 161.80% Fibonacci Extension level, further emphasizing its potential resistance significance.
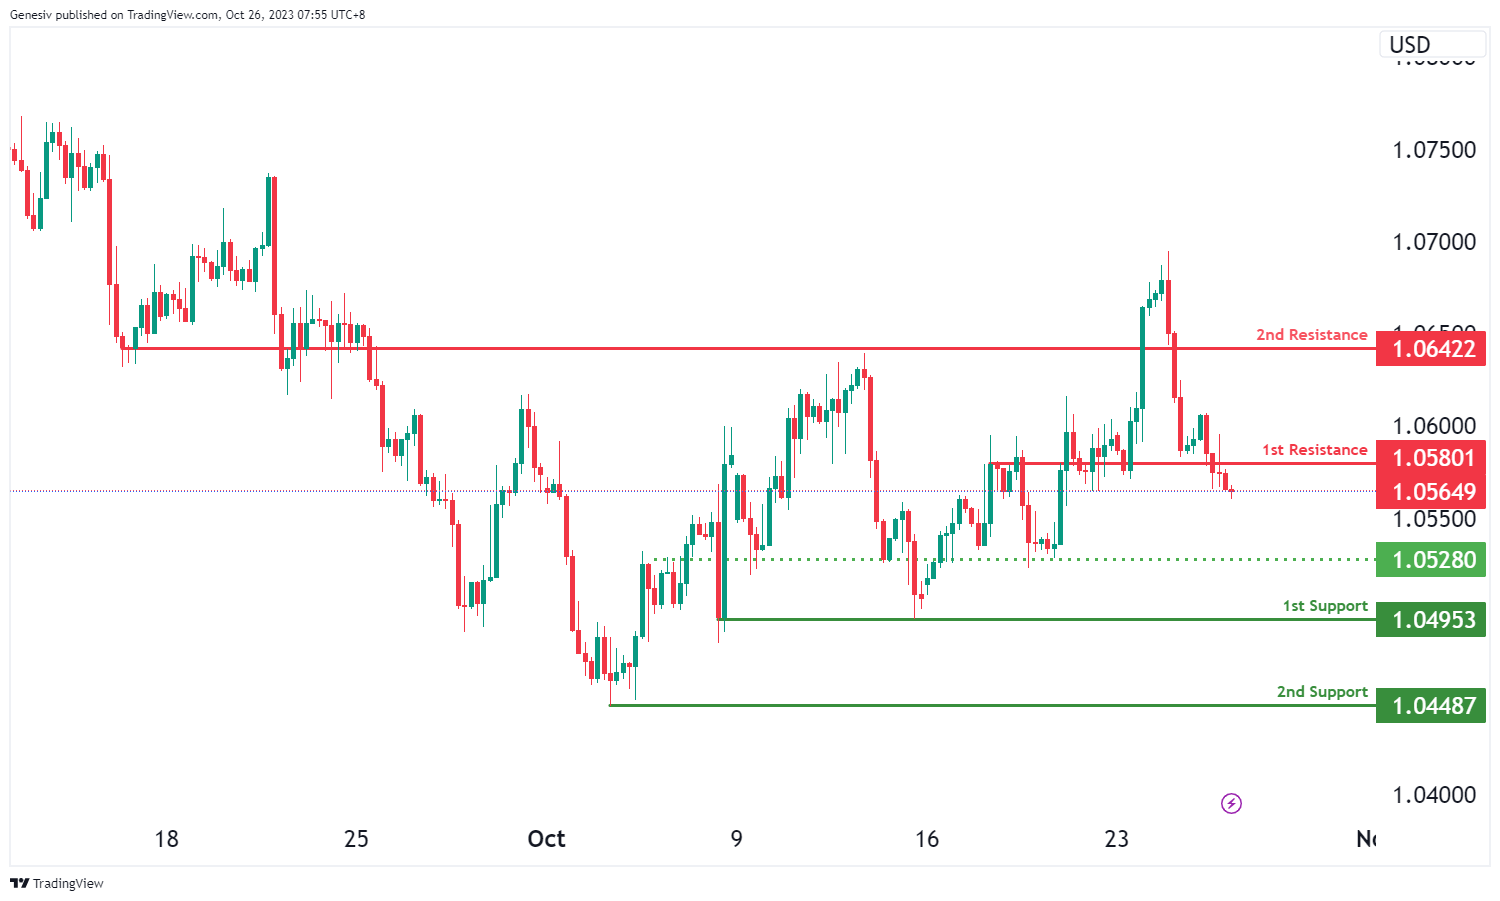
EUR/USD:
The EUR/USD chart currently shows a bearish overall momentum, and there is a potential scenario for a bearish continuation towards the 1st support level.
The 1st support at 1.0495 is considered significant as it aligns with a multi-swing low support level, indicating a strong potential area of price support. Additionally, the 2nd support at 1.0448 is identified as a swing low support, further reinforcing the potential for it to act as a support level.
On the resistance side, the 1st resistance at 1.0580 is characterized as an overlap resistance level, suggesting that it may serve as a notable barrier to upward price movement. Furthermore, the 2nd resistance at 1.0642 is identified as a pullback resistance level, indicating potential resistance significance.
An intermediate support level at 1.0528 is also mentioned as an overlap support, providing additional insights into potential price support zones.
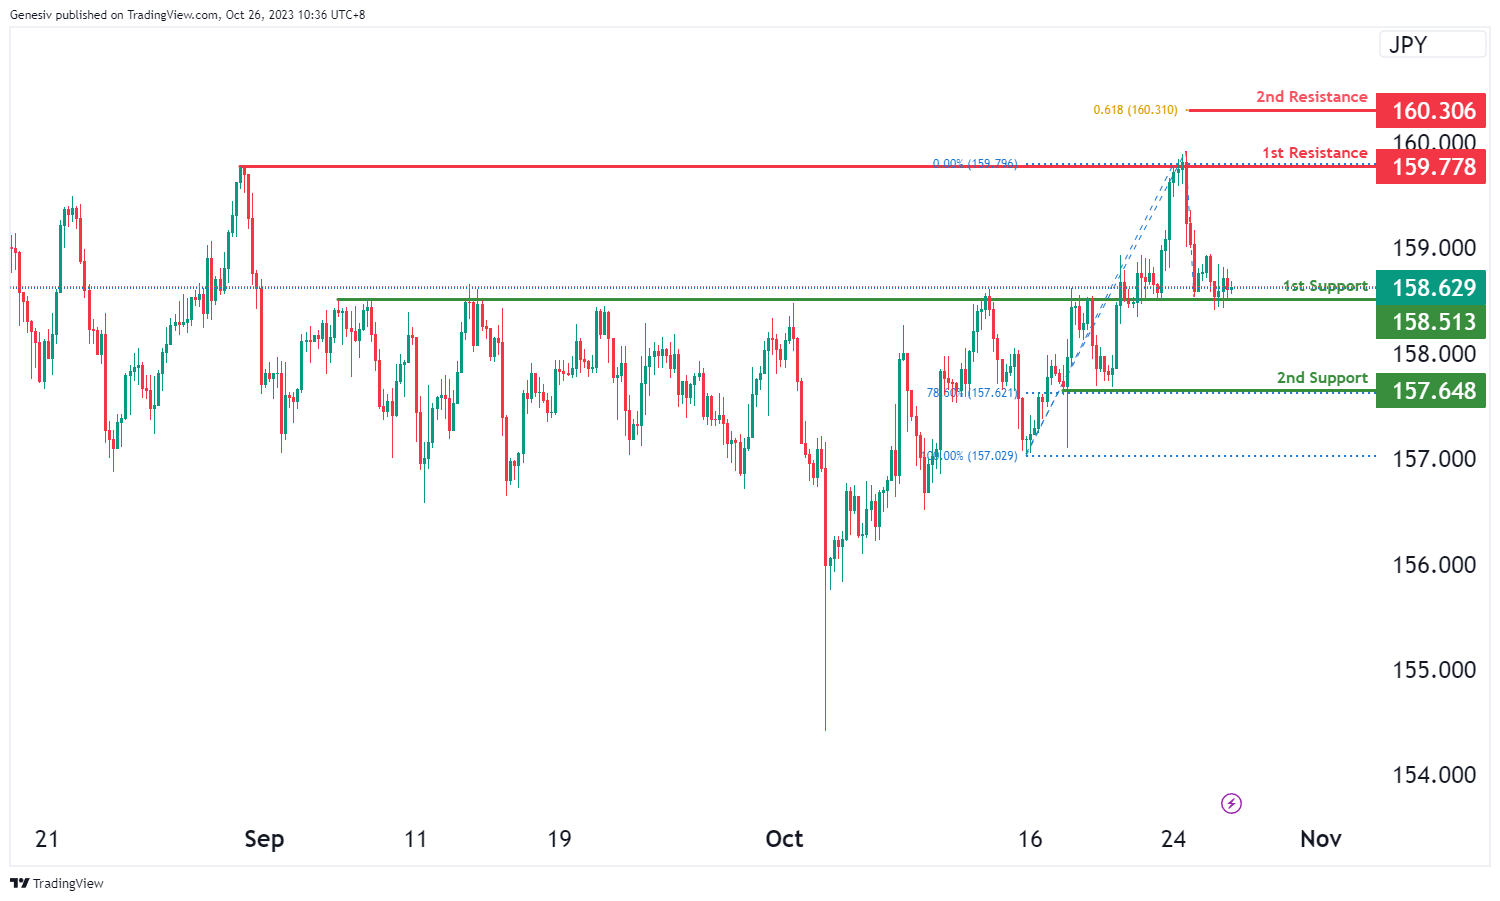
EUR/JPY:
The EUR/JPY instrument is currently demonstrating a bullish overall momentum on the chart. There is potential for a bullish breakout through the first resistance at 159.77, with the expectation of the price rising to the second resistance at 160.30.
The first support at 158.51 is deemed strong due to its overlap support characteristics. The second support at 157.64 is significant as it features multi-swing low support and is also associated with the 78.60% Fibonacci Retracement.
Conversely, the first resistance at 159.77 is noteworthy for its multi-swing high resistance properties. The second resistance at 160.30 is significant due to the presence of the 61.80% Fibonacci Projection.
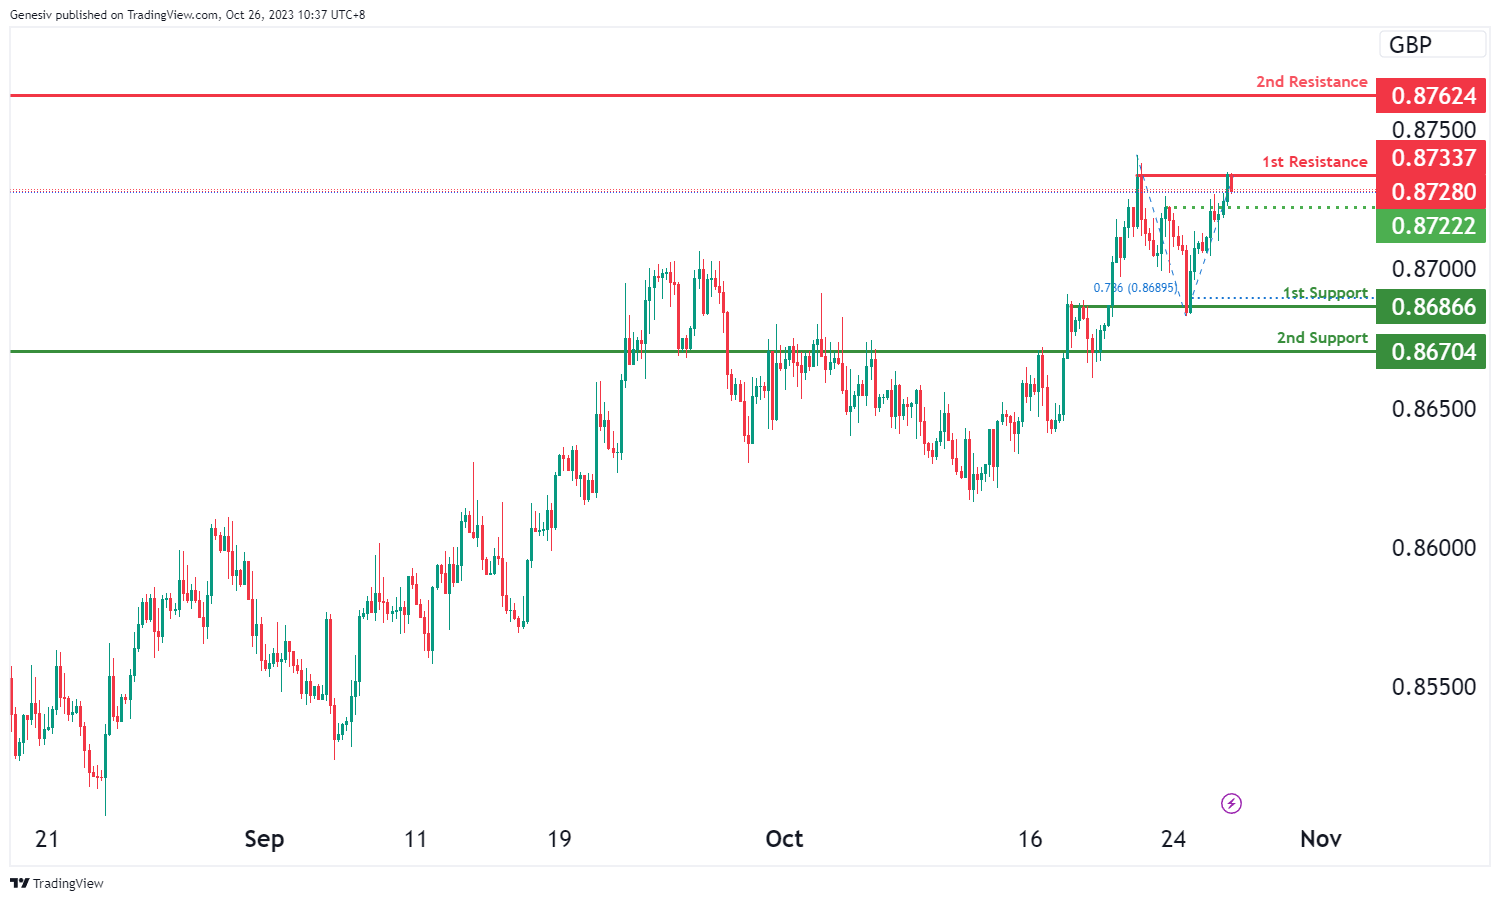
EUR/GBP:
For the EUR/GBP instrument, the chart currently exhibits a bearish overall momentum, suggesting a potential bearish continuation in price movement towards the first support at 0.8686. This support level is notable for its overlap support characteristics and the presence of the 78.60% Fibonacci Projection, making it a strong potential level of support.
The second support at 0.8670 is also significant as it features overlap support.
On the resistance side, the first resistance at 0.8733 is marked by multi-swing high resistance characteristics. The second resistance at 0.8762 is noteworthy for its overlap resistance.
Additionally, there is an intermediate support level at 0.8722, which is supported by its pullback support attributes.
GBP/USD:
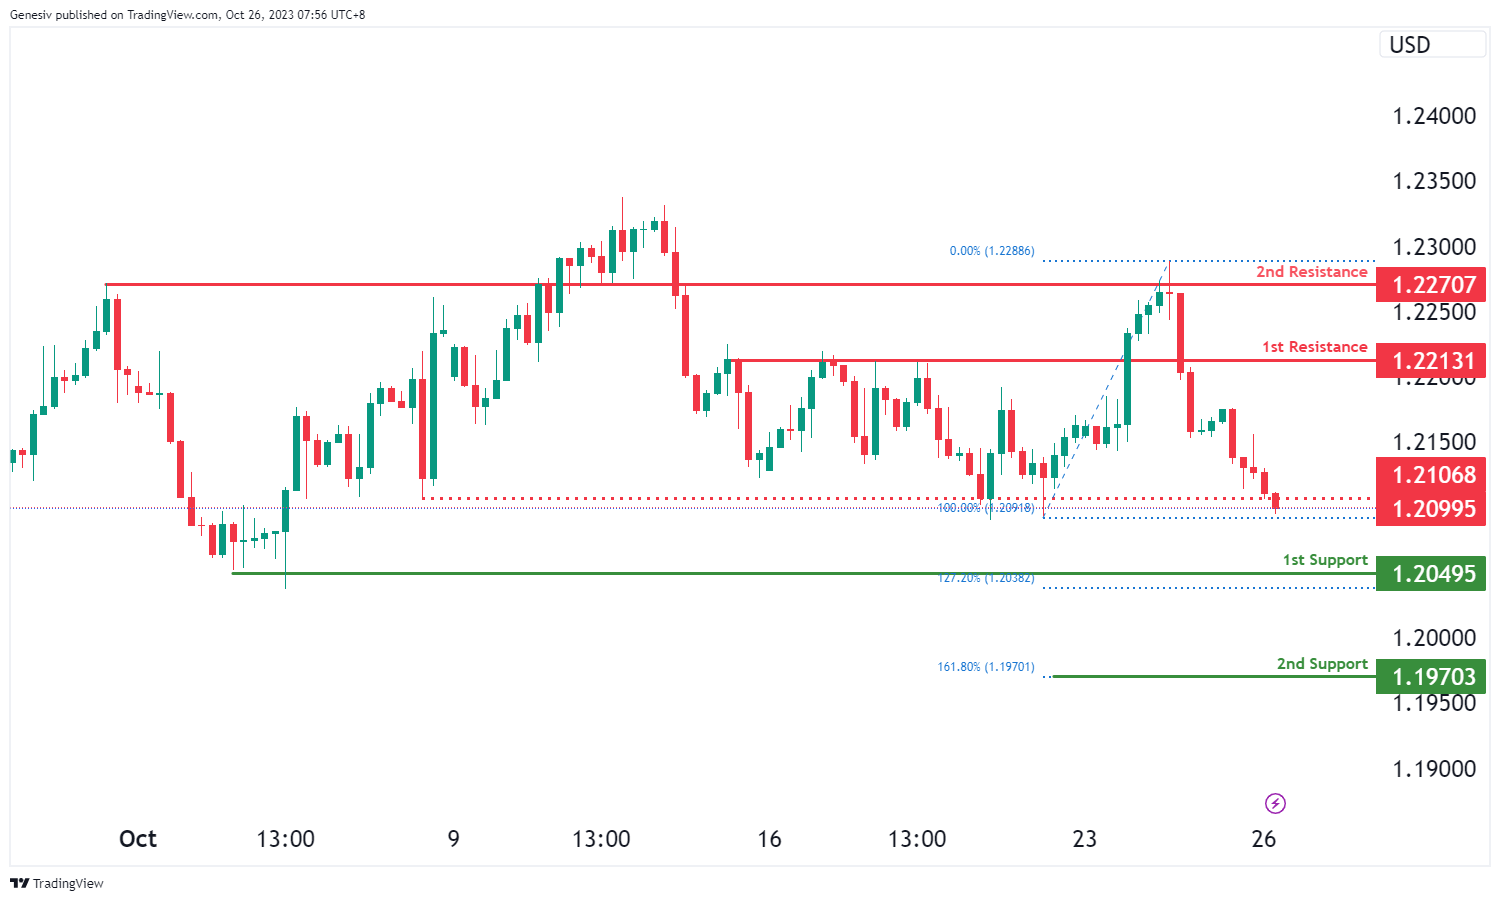
The GBP/USD chart currently exhibits a bearish overall momentum, and there is a potential scenario for a bearish continuation towards the 1st support level.
The 1st support at 1.2049 is considered significant as it aligns with a multi-swing low support level and coincides with the 127.20% Fibonacci Extension level, indicating a strong potential area of price support. Additionally, the 2nd support at 1.1970 is identified as a support level and coincides with the 161.80% Fibonacci Extension, further reinforcing its potential as a support zone.
On the resistance side, the 1st resistance at 1.2213 is characterized as a pullback resistance level, suggesting that it may act as a notable barrier to upward price movement. Furthermore, the 2nd resistance at 1.2270 and the intermediate resistance at 1.2106 are also identified as pullback resistance levels, indicating potential resistance significance at these levels.
GBP/JPY:
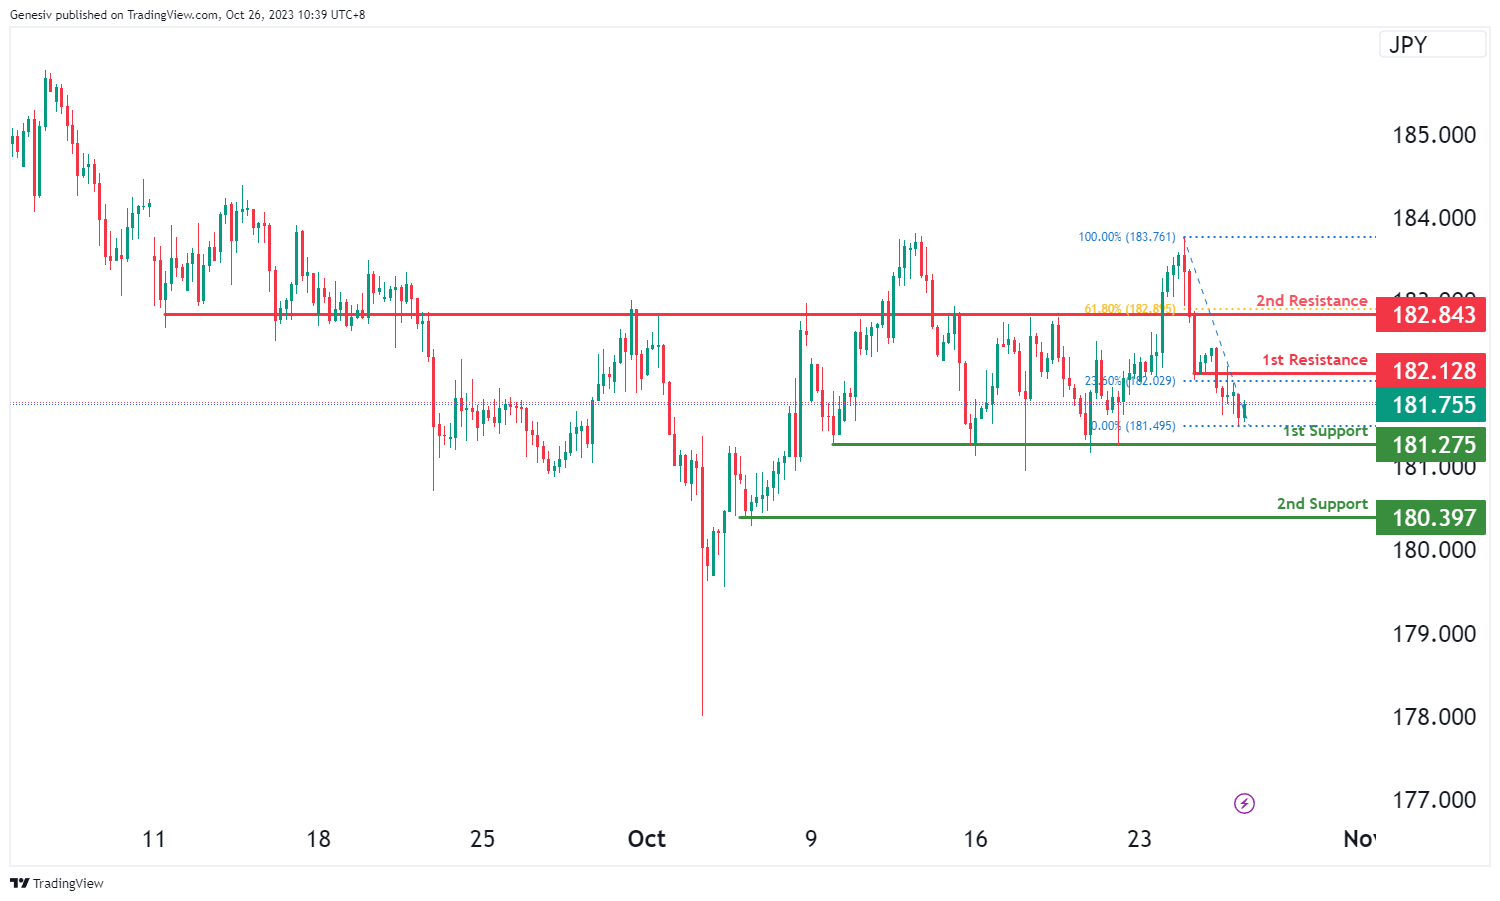
The GBP/JPY instrument is currently exhibiting a bullish overall momentum on the chart, indicating the potential for a bullish continuation in price movement towards the first resistance at 182.12.
The first support at 181.27 is considered strong due to its multi-swing low support characteristics. The second support at 180.39 is also significant as it features swing low support.
On the resistance side, the first resistance at 182.12 is noteworthy for its overlap resistance characteristics and the presence of the 23.60% Fibonacci Retracement, making it a substantial level of resistance. The second resistance at 182.84 is marked by pullback resistance and the presence of the 61.80% Fibonacci Retracement, making it another important level of resistance.
USD/CHF:
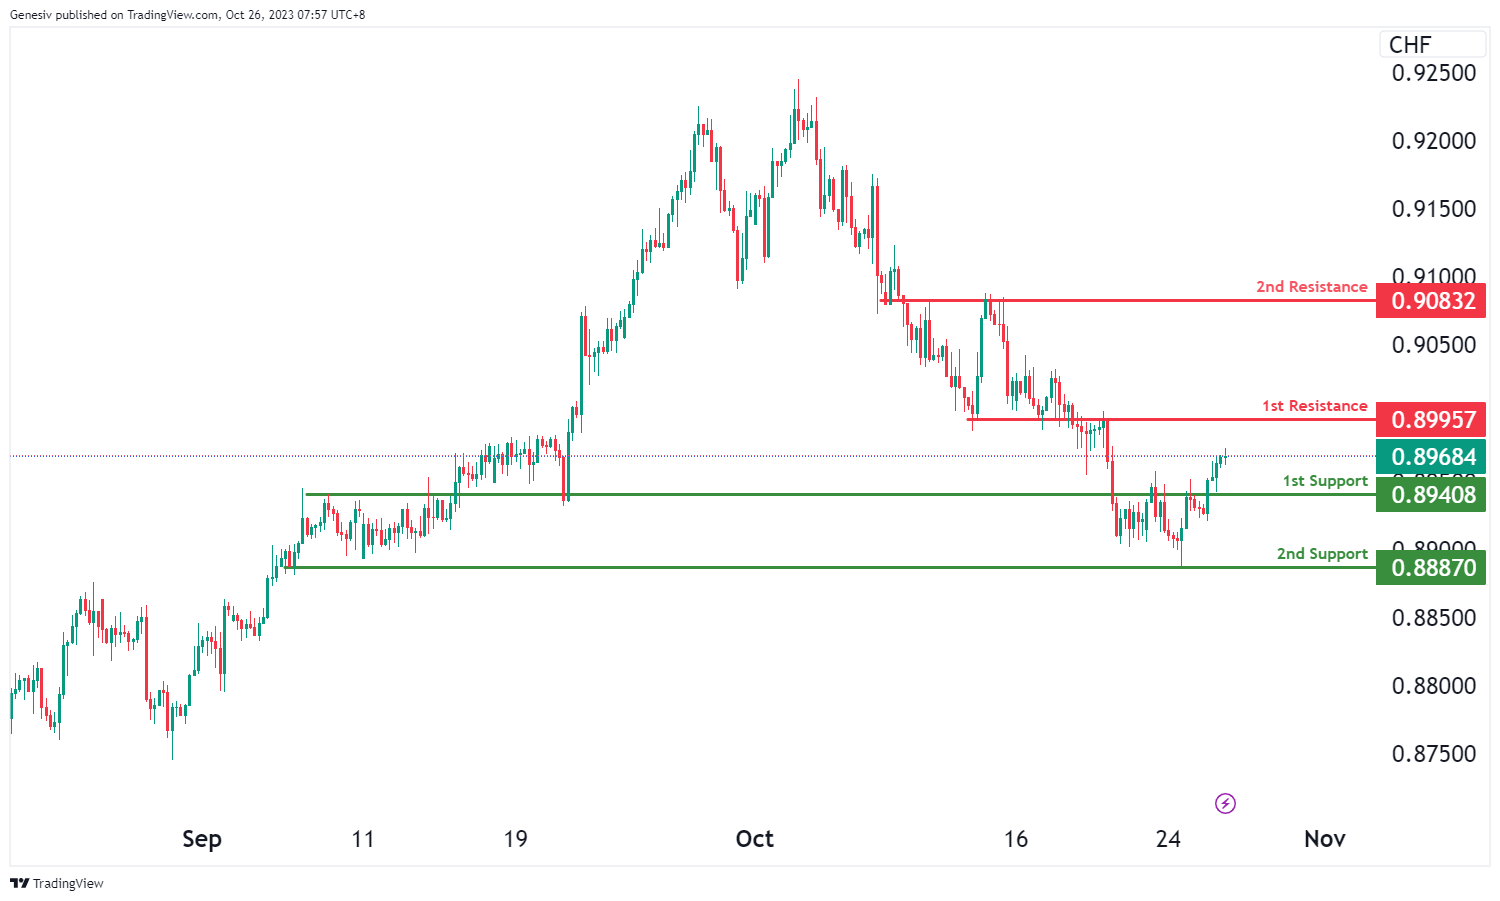
The USD/CHF chart currently displays bullish overall momentum, with the potential scenario of a bullish continuation towards the 1st resistance level.
The 1st support at 0.8940 is considered significant as it aligns with an overlap support level, indicating a potential area of price support. Additionally, the 2nd support at 0.8887 is identified as a swing low support, further reinforcing the potential for support at this level.
On the resistance side, the 1st resistance at 0.8995 is characterized as an overlap resistance level, suggesting potential resistance significance that price may encounter. Beyond this, the 2nd resistance at 0.9083 is also identified as an overlap resistance, indicating another potential barrier to further upward price movement.
USD/JPY:
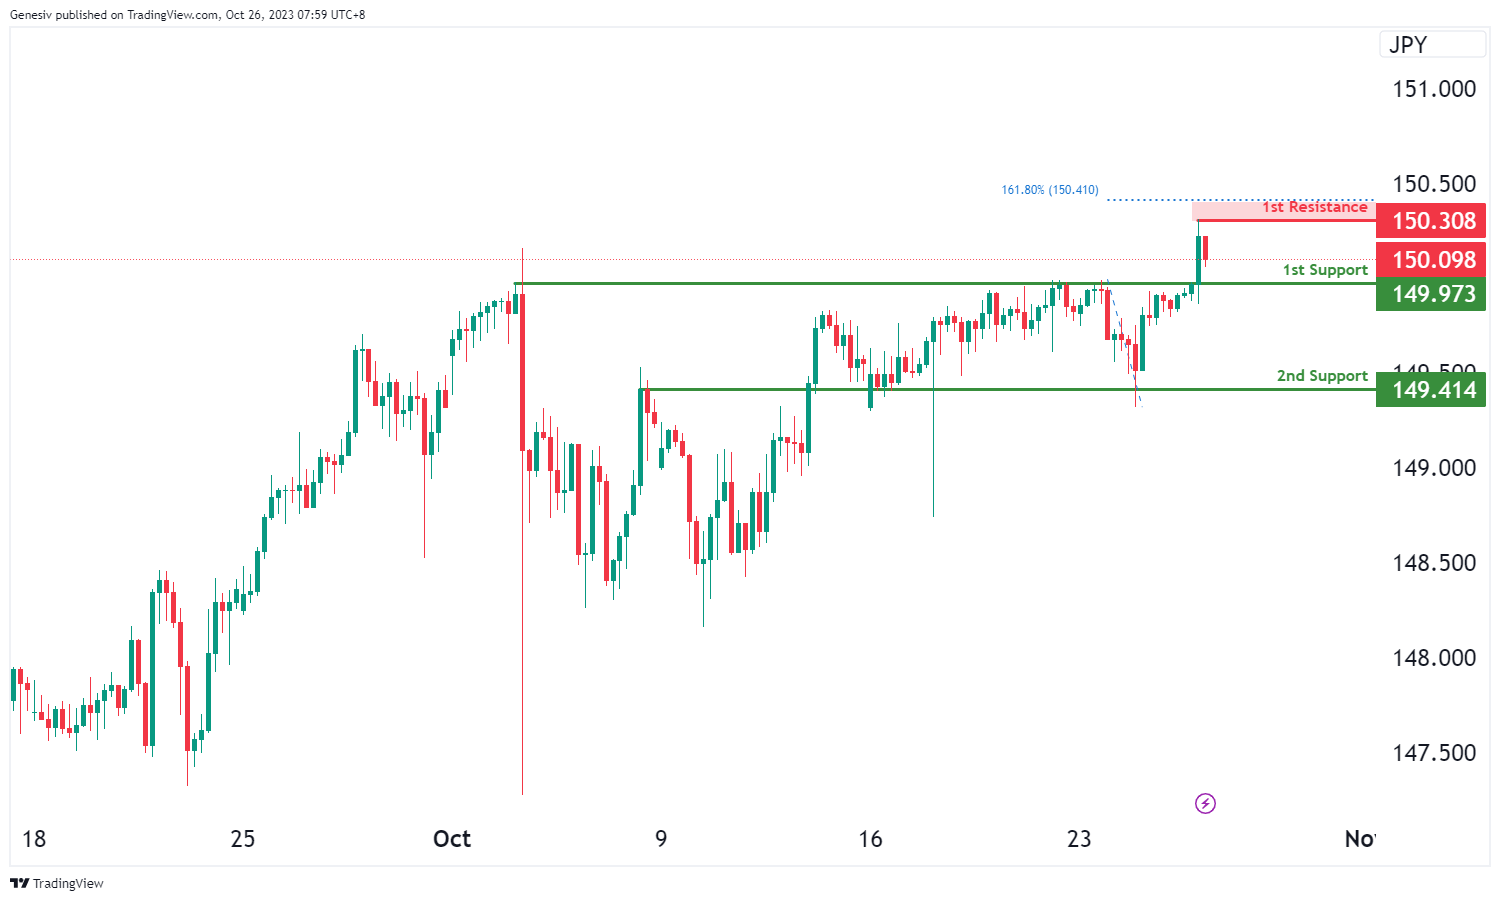
The USD/JPY chart currently exhibits bullish overall momentum, with the potential scenario of a bullish bounce off the 1st support level towards the 1st resistance.
The 1st support at 149.97 is considered significant as it aligns with a pullback support level, indicating a potential area of price support. Additionally, the 2nd support at 149.41 is identified as an overlap support, further reinforcing the potential for support at this level.
On the resistance side, the 1st resistance at 150.30 is characterized as a multi-swing high resistance level, suggesting potential resistance significance that price may encounter as it attempts to move higher.
USD/CAD:
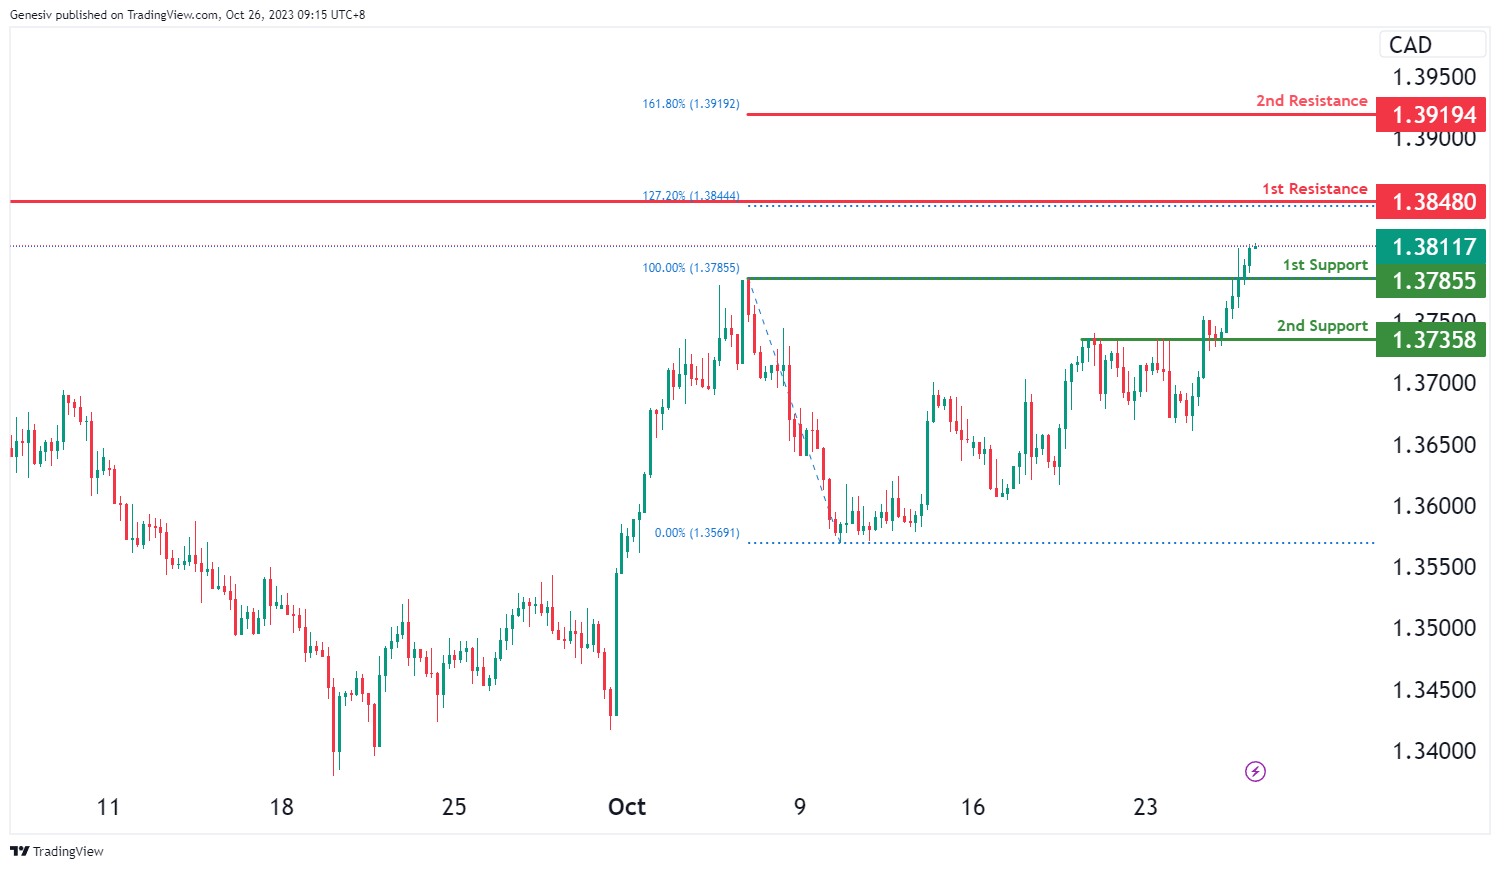
The USD/CAD chart currently exhibits an overall bullish momentum indicating the likelihood of a bullish continuation towards the 1st resistance level, especially after breaking above the significant swing-high resistance at 1.3786.
The 1st resistance level at 1.3848 is identified as a swing-high resistance that aligns with the 127.20% Fibonacci extension level. Higher up, the 2nd resistance level at 1.3919 is marked as a resistance level that aligns with the 161.80% Fibonacci extension level, potentially acting as a barrier to further bullish advances.
To the downside, the 1st support level at 1.3786 is identified as a pullback support. Further below, the 2nd support level at 1.3736 is noted as an overlap support, potentially acting as a strong support zone.
AUD/USD:
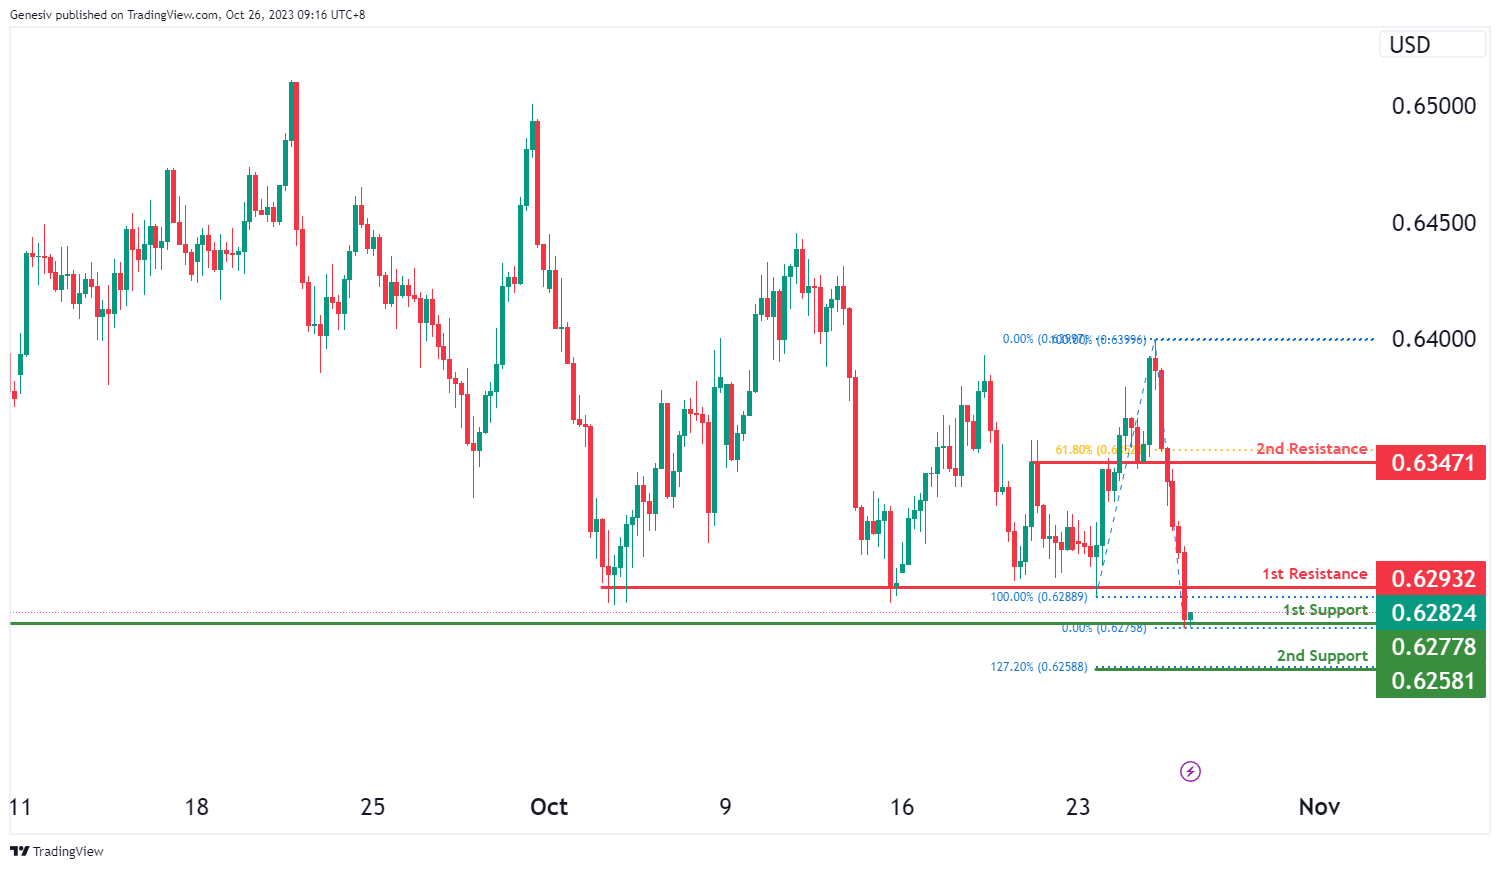
The AUD/USD chart currently exhibits an overall bearish momentum with price potentially making a bearish reaction off the 1st resistance level to drop lower towards the 1st support level.
The 1st resistance level at 0.6293 is identified as a pullback resistance. Higher up, the 2nd resistance level at 0.6347 is marked as an overlap resistance that aligns close to the 61.80% Fibonacci retracement level, making it a potentially strong resistance level.
To the downside the 1st support level at 0.6278 is identified as a multi-swing-low support. Additionally, the 2nd support level at 0.6258 is noted as a support level that aligns with the 127.20% Fibonacci extension level, further reinforcing its importance as a potential support area.
NZD/USD
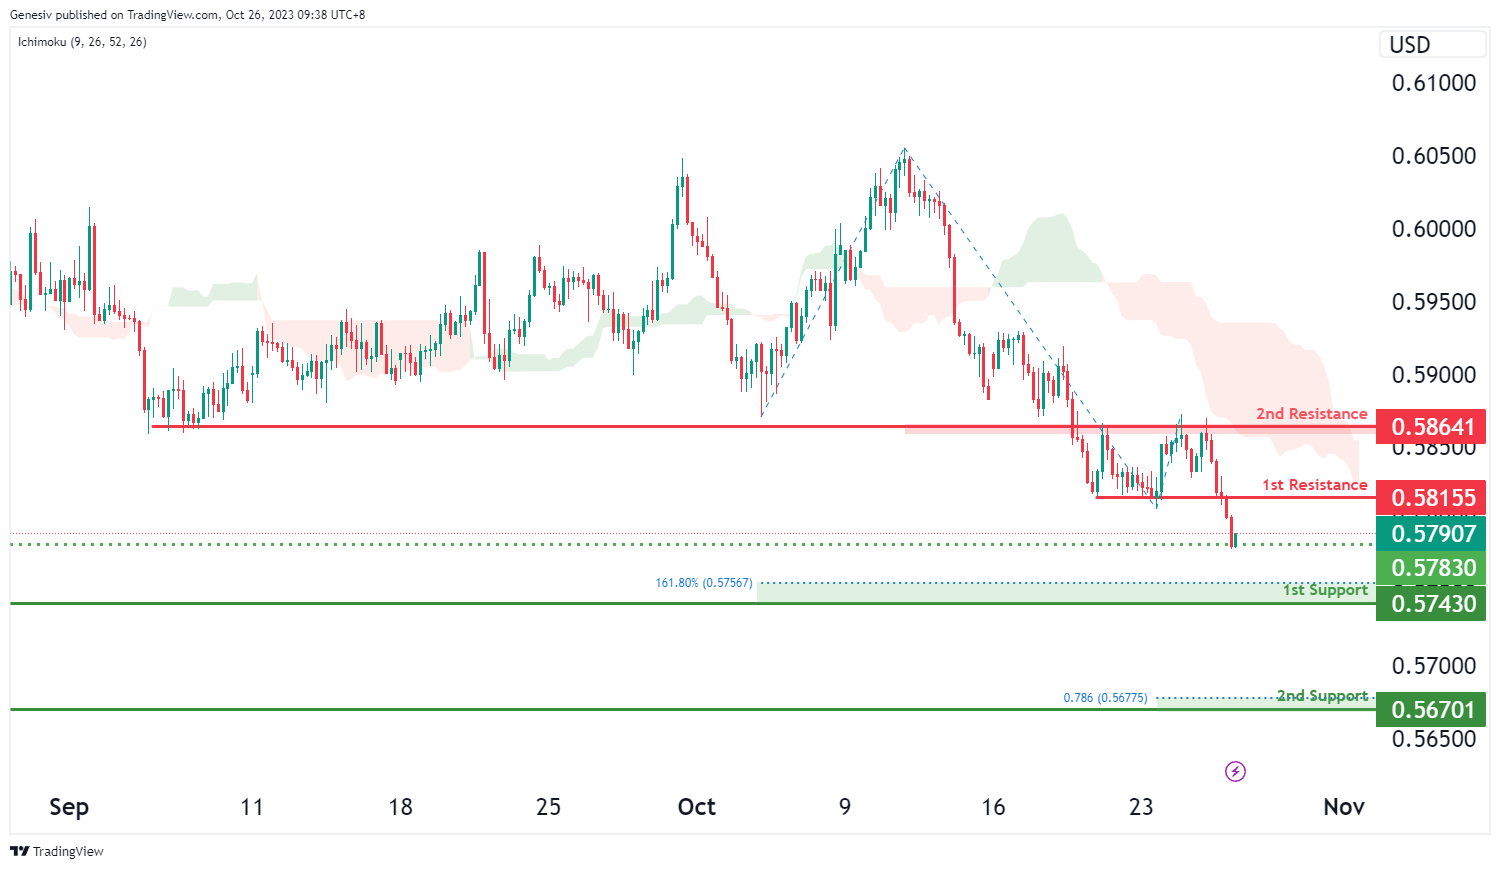
The NZD/USD chart currently exhibits an overall bearish momentum with price potentially making a bearish continuation towards the 1st support level, especially if price breaks below the intermediate support level.
The intermediate support at 0.5783 is identified as an overlap support while the 1st support level at 0.5743 is marked as a swing-low support that aligns close to the 161.80% Fibonacci extension level. Additionally, the 2nd support level at 0.5670 is noted as a pullback support that aligns close to the 78.60% Fibonacci projection level, further reinforcing its importance as a potential support area.
To the upside, the 1st resistance level at 0.5816 is identified as a pullback resistance. Higher up, the 2nd resistance level at 0.5864 is marked as an overlap resistance, making it a potentially strong resistance level.
DJ30:
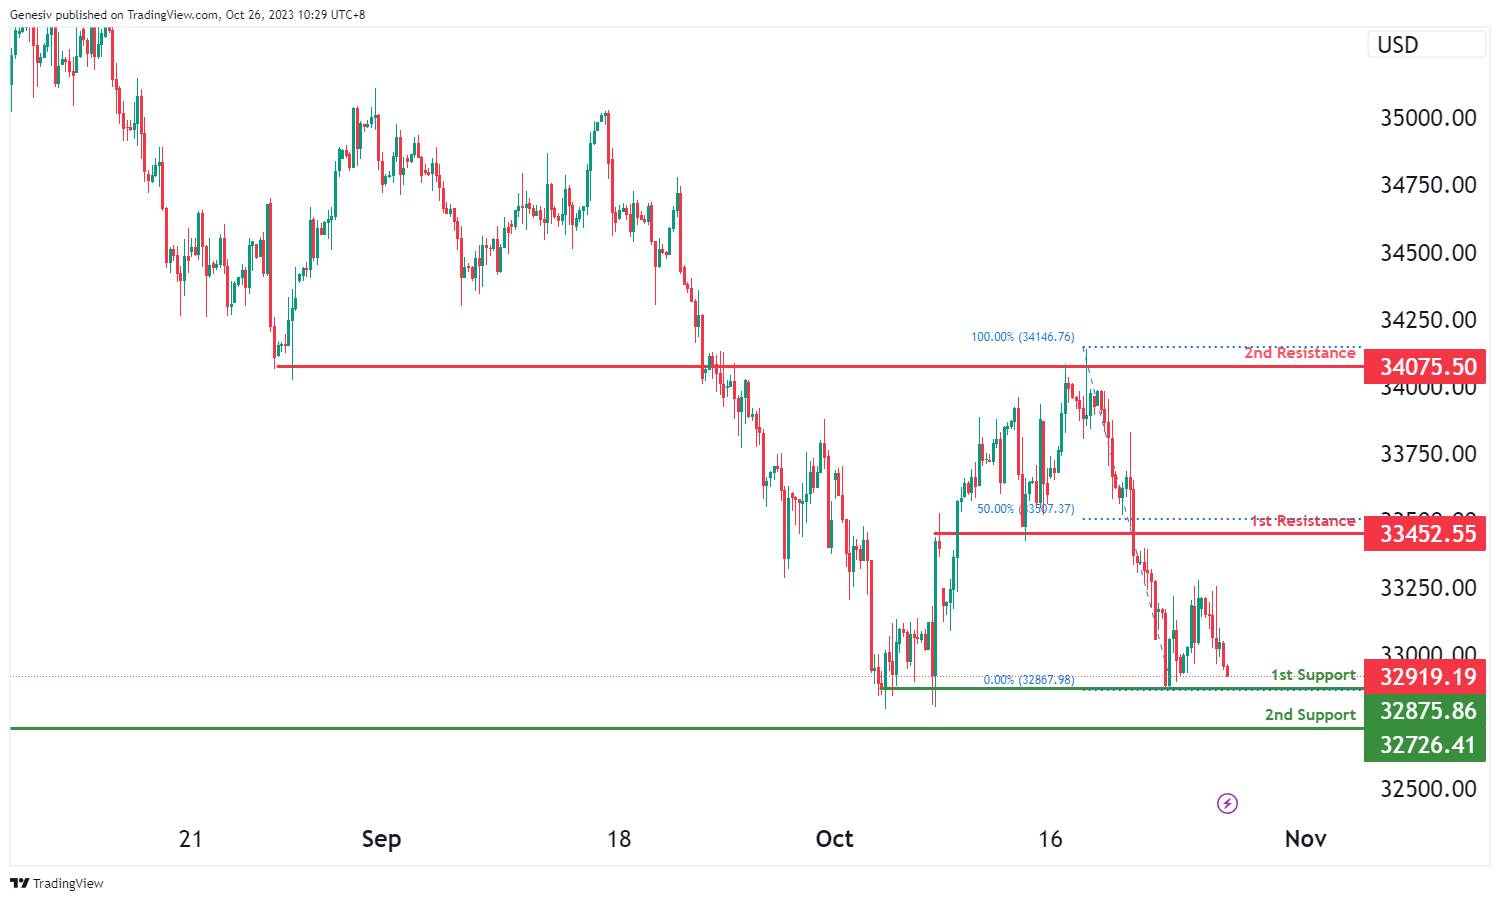
The instrument DJ30 currently exhibits a bullish overall momentum on its chart. The price may potentially drop further to the first support level at 32875.86 in the short term before bouncing from there and rising towards the first resistance at 33452.55.
The first support at 32875.86 is considered a strong level due to its multi-swing low support characteristics, while the second support at 32726.41 shares the same attribute.
On the other hand, the first resistance at 33452.55 is noteworthy for its pullback resistance, and the second resistance at 34075.50 is significant due to an overlap resistance.
GER40:
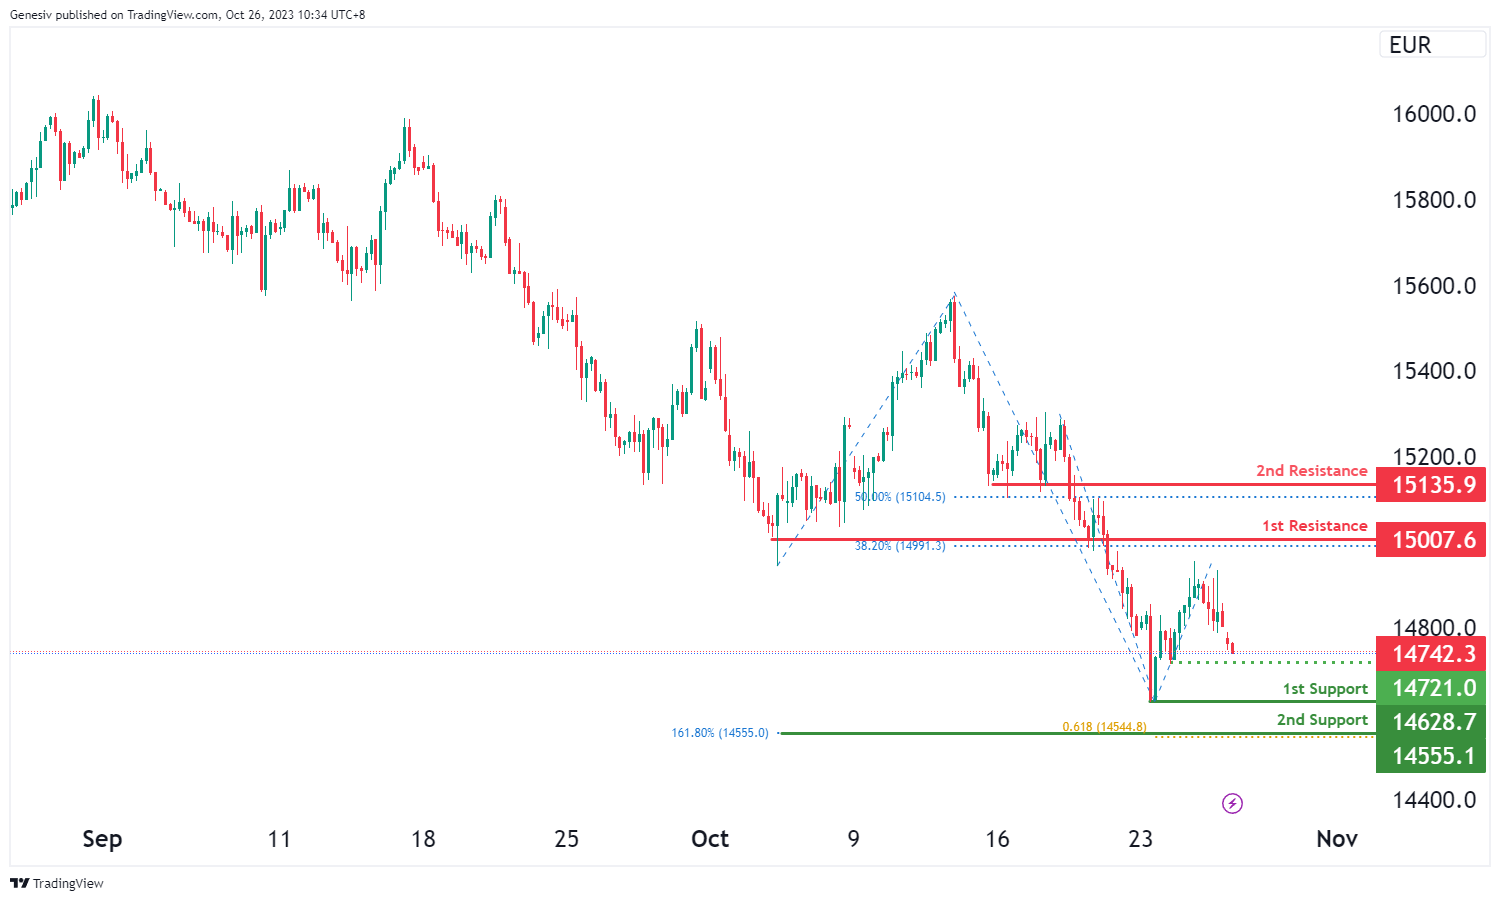
For the GER40 instrument, the chart is currently showing a bearish overall momentum. Price is expected to potentially continue in a bearish direction, heading towards the first support at 14628.70, which is considered a robust level due to its swing low support characteristics. The second support at 14555.10 is also significant, attributed to the 161.80% Fibonacci Extension.
On the other hand, the first resistance at 15007.60 is noteworthy for its pullback resistance and the presence of the 38.20% Fibonacci Retracement, while the second resistance at 15135.90 is marked by pullback resistance and the 50% Fibonacci Retracement. Additionally, there is an intermediate support level at 14721.00, which is supported by its swing low support characteristics.
US500
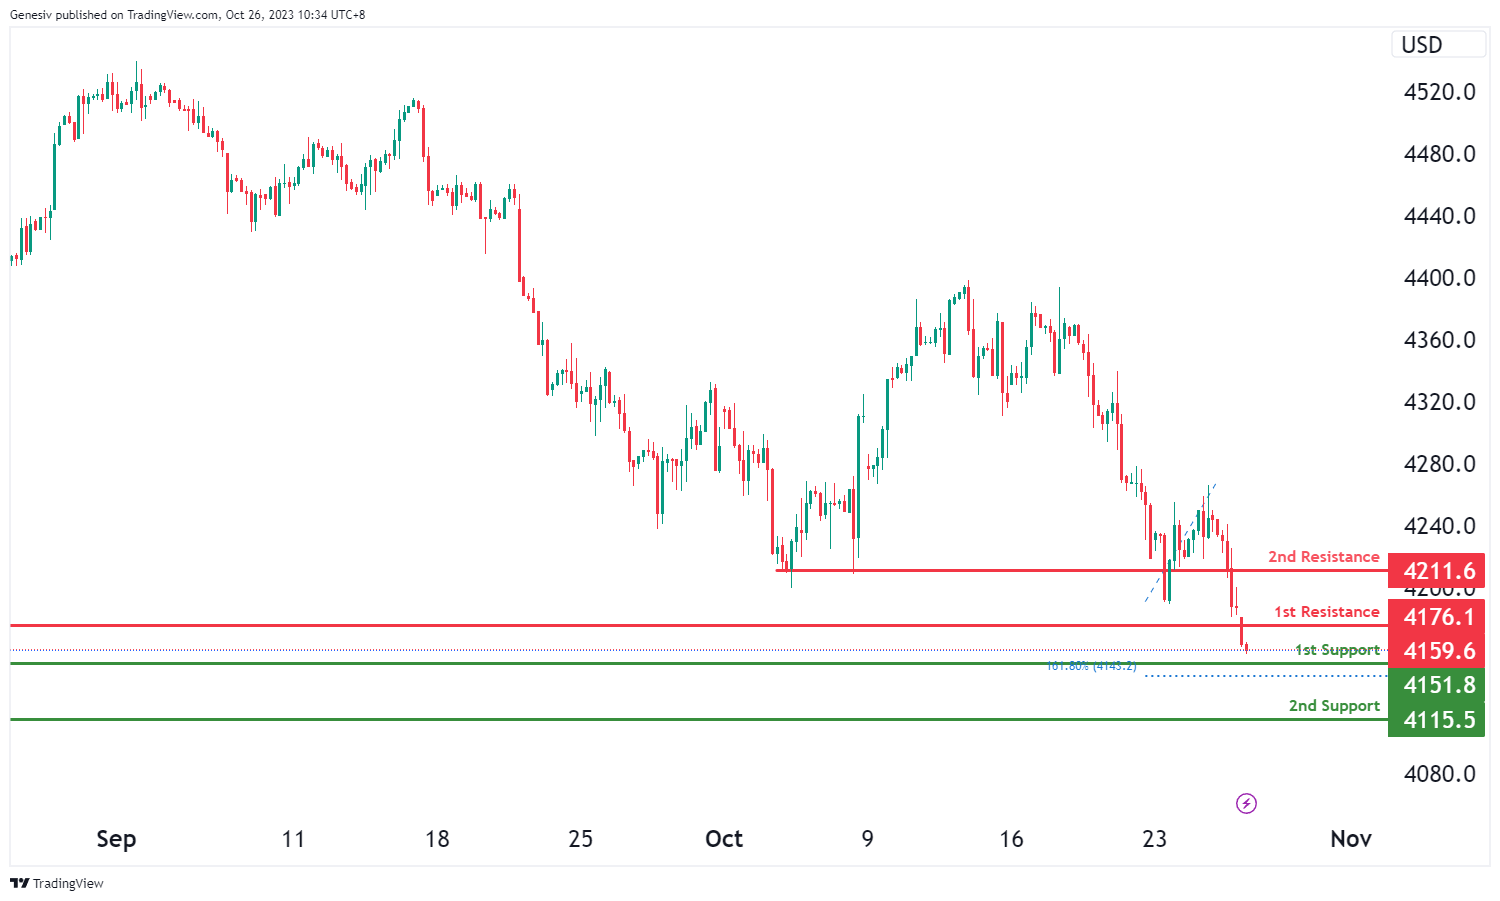
The US500 instrument currently displays a bullish overall momentum on the chart. It’s anticipated that the price may potentially experience a short-term drop to the first support level at 4151.8 before bouncing from there and rising towards the first resistance at 4176.1.
The first support at 4151.8 is considered a strong level due to its pullback support characteristics and the presence of the 161.80% Fibonacci Extension. The second support at 4115.5 is significant because of its swing low support features and the 61.80% Fibonacci Projection.
Conversely, the first resistance at 4176.1 is noteworthy for its pullback resistance. The second resistance at 4211.6 is also significant due to its pullback resistance properties.
BTC/USD:
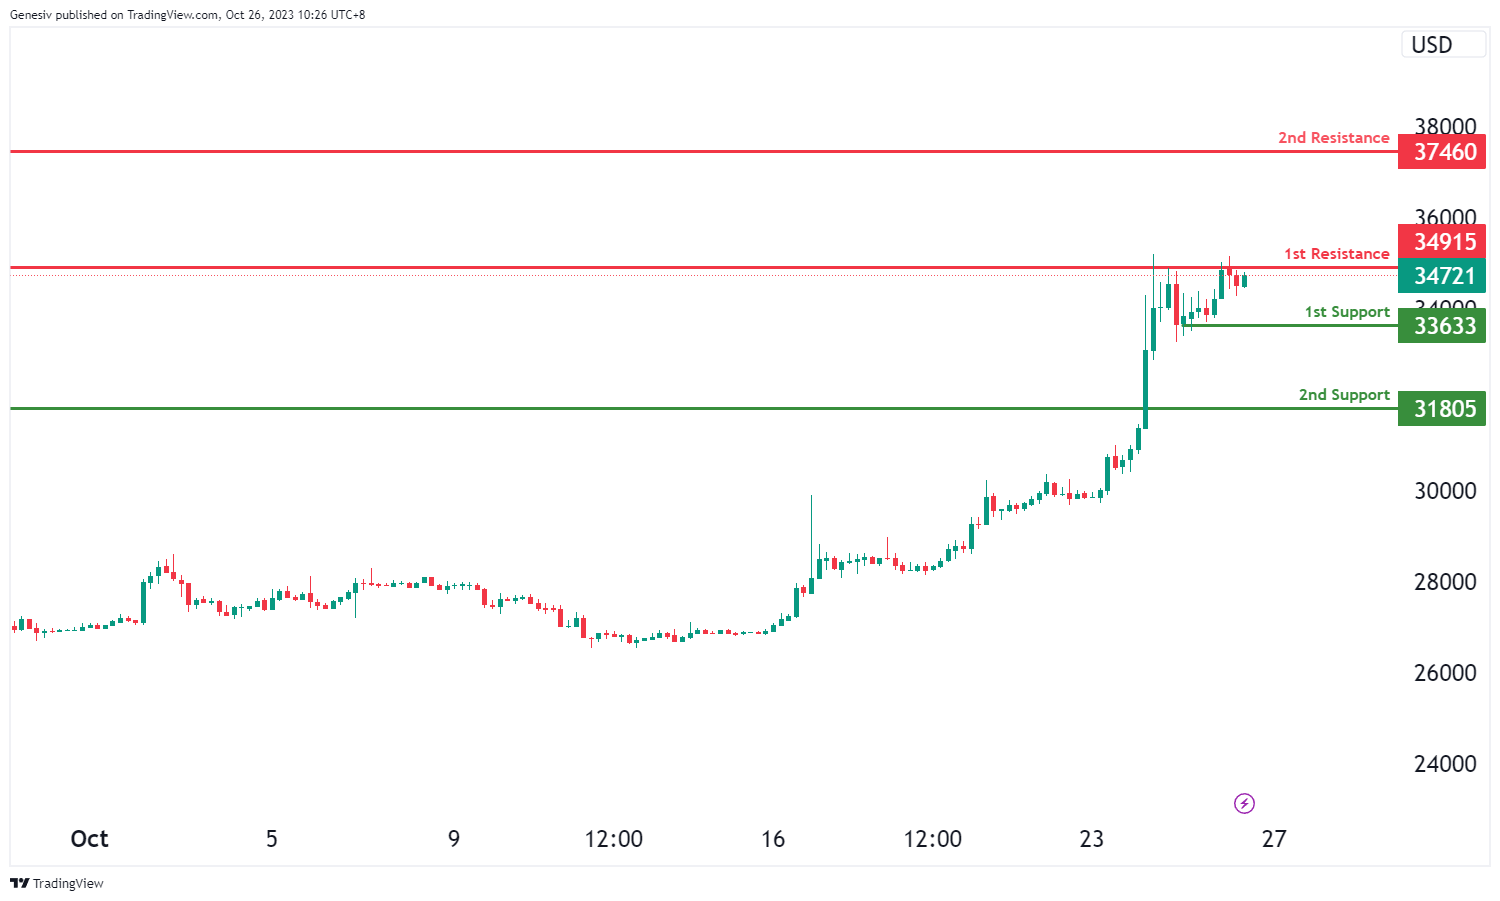
In the analysis of BTC/USD, the overall momentum of the chart indicates a bullish trend.
It is anticipated that the price may continue to move in a bullish direction, potentially heading towards the first resistance level.
The first support level is at 33,633, which is considered significant as it represents a swing low support.
The second support level is at 31,805, and it is also of importance as it denotes a pullback support.
On the resistance side, the first resistance level is at 34,915, which is notable because it marks a pullback resistance.
The second resistance level is at 37,460, and it is significant as well as it represents another pullback resistance level.
ETH/USD:
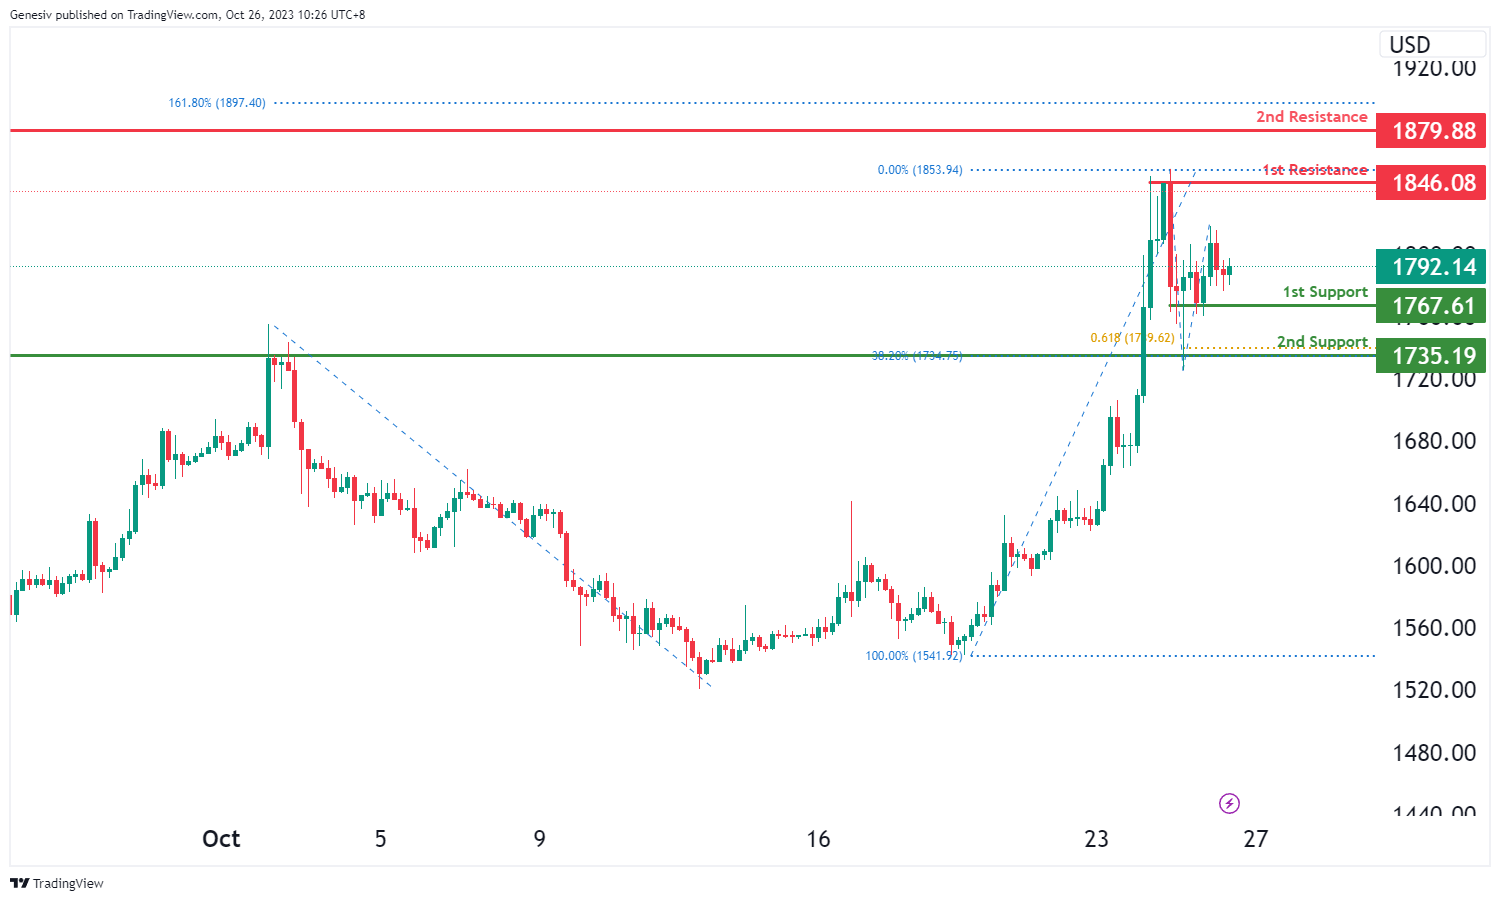
In the analysis of ETH/USD, the overall momentum of the chart indicates a bullish trend.
It is anticipated that the price may continue to move in a bullish direction, potentially heading towards the first resistance level.
The first support level is at 1,767.61, which is considered significant as it represents a multi-swing low support.
The second support level is at 1,735.19, and it is also of importance as it denotes a pullback support, along with confluence from the 38.20% Fibonacci Retracement and the 61.80% Fibonacci Projection.
On the resistance side, the first resistance level is at 1,846.08, which is notable because it marks a multi-swing high resistance.
The second resistance level is at 1,879.88, and it is significant as well as it represents another multi-swing high resistance with the added confluence of the 161.80% Fibonacci Extension. This indicates a potential bullish continuation in the chart.
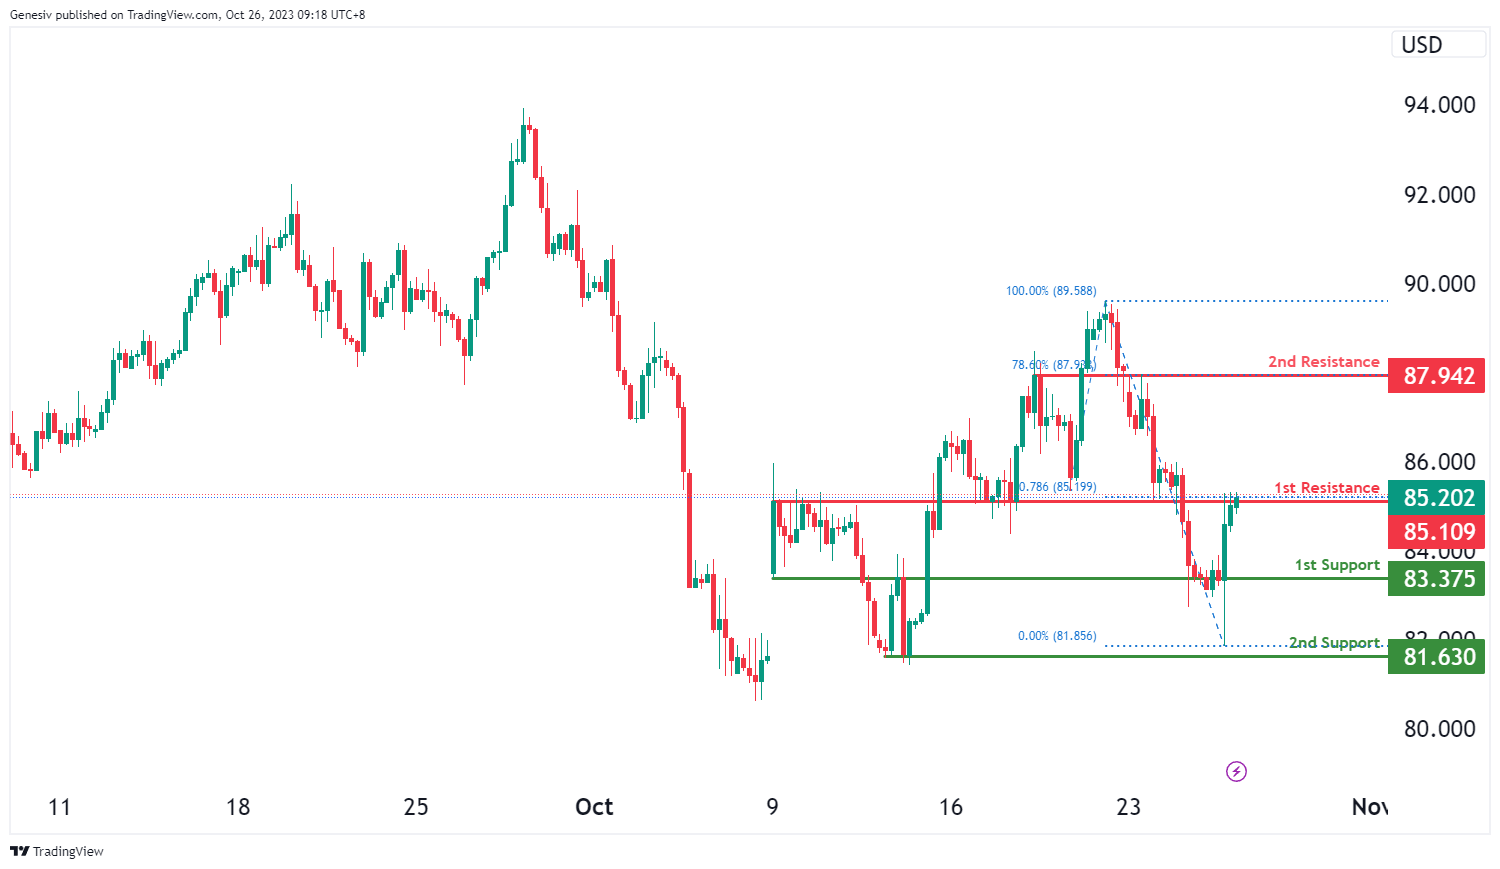
WTI/USD:
The WTI chart currently exhibits an overall bullish momentum, indicating a potential scenario for price to make a bullish continuation towards the 2nd resistance level should it break above the 1st resistance level.
The 1st resistance level at 85.11 is identified as an overlap resistance that aligns with the 78.60% Fibonacci projection level. Beyond this, the 2nd resistance level at 87.94 is noted as an overlap resistance that aligns with the 78.60% Fibonacci retracement level, making it a potentially strong resistance level.
To the downside, the 1st support level at 83.38 is identified as an overlap support. Further below, the 2nd support level at 81.63 is also marked as a swing-low support, indicating a potential support zone.
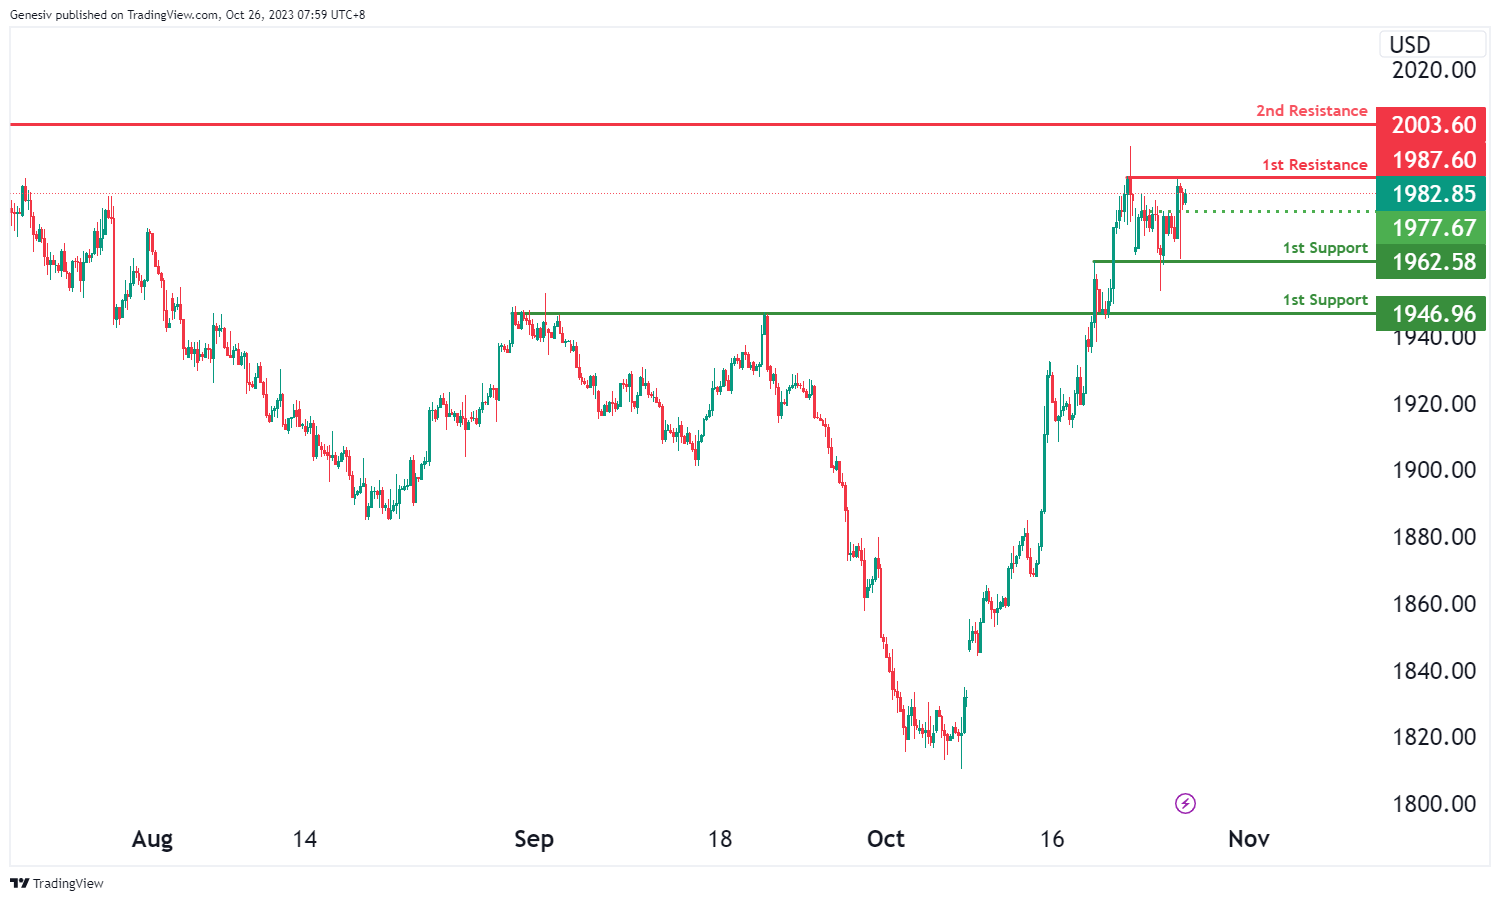
XAU/USD (GOLD):
The XAU/USD chart currently exhibits bearish overall momentum, with the potential scenario of a bearish continuation towards the 1st support level.
The 1st support at 1962.58 is considered significant as it aligns with an overlap support level, indicating a potential area of price support. Additionally, the 2nd support at 1946.96 is also identified as an overlap support, further reinforcing the potential for support at this level.
On the resistance side, the 1st resistance at 1987.60 is characterized as a multi-swing high resistance level, suggesting potential resistance significance that price may encounter as it attempts to move higher. Beyond this, the 2nd resistance at 2003.60 is identified as a swing high resistance, which can act as a significant barrier to upward price movement.
An intermediate support level at 1977.67 is also noted as a pullback support, adding another layer of potential support for price action.