Sample Category Title
Fed’s Bostic eyes late 2024 for possible rate cut, remains focused on curbing inflation
In an interview with CNBC, Atlanta Federal Reserve President Raphael Bostic emphasized that reigning in inflation remains a top priority, and the metric needs to approach the 2% mark before a rate cut can be seriously considered.
"Inflation is job one, we have to get that under control," Bostic asserted. But rate cut is possible next year and "I would say late 2024", he added.
"There's still a lot of momentum in the economy. My outlook says that inflation is going to come down but it's not going to like fall off a cliff," he explained.
"It'll be sort of a progression that's going to take some time. And so we're going to have to be cautious, we're going to have to be patient, but we're going to have to be resolute," added Bostic.
In the context of a broader economic outlook, Bostic dismissed the possibility of a recession. He projected a slowdown in economic activity but remained optimistic about the economy's resilience and the eventual return of inflation to the 2% target.
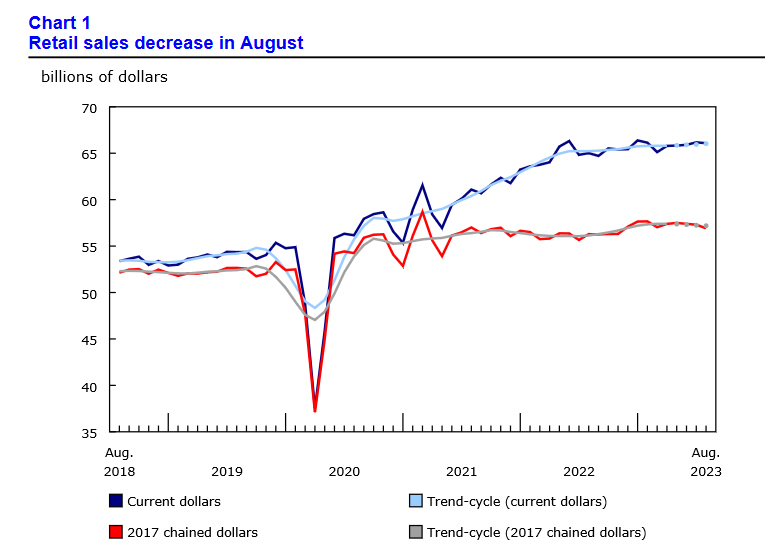
Canada retail sales fell -0.1% mom in Aug, sales volume down -0.7% mom
Canada retail sales fell -0.1% mom to CAD 66.1B in August, matched expectations. Sales were down in six of nine subsectors and were led by decreases at motor vehicle and parts dealers (-0.9%). Excluding gasoline stations, fuel, motor vehicles and parts, sales were down -0.3% mom. In volume terms, retail sales declined -0.7% mom.
Advance estimate suggests that sales were unchanged in September.
Canadian Dollar Calm ahead of Retail Sales
- Canada to release retail sales later today
- Fed’s Powell says inflation still too high, lower growth needed
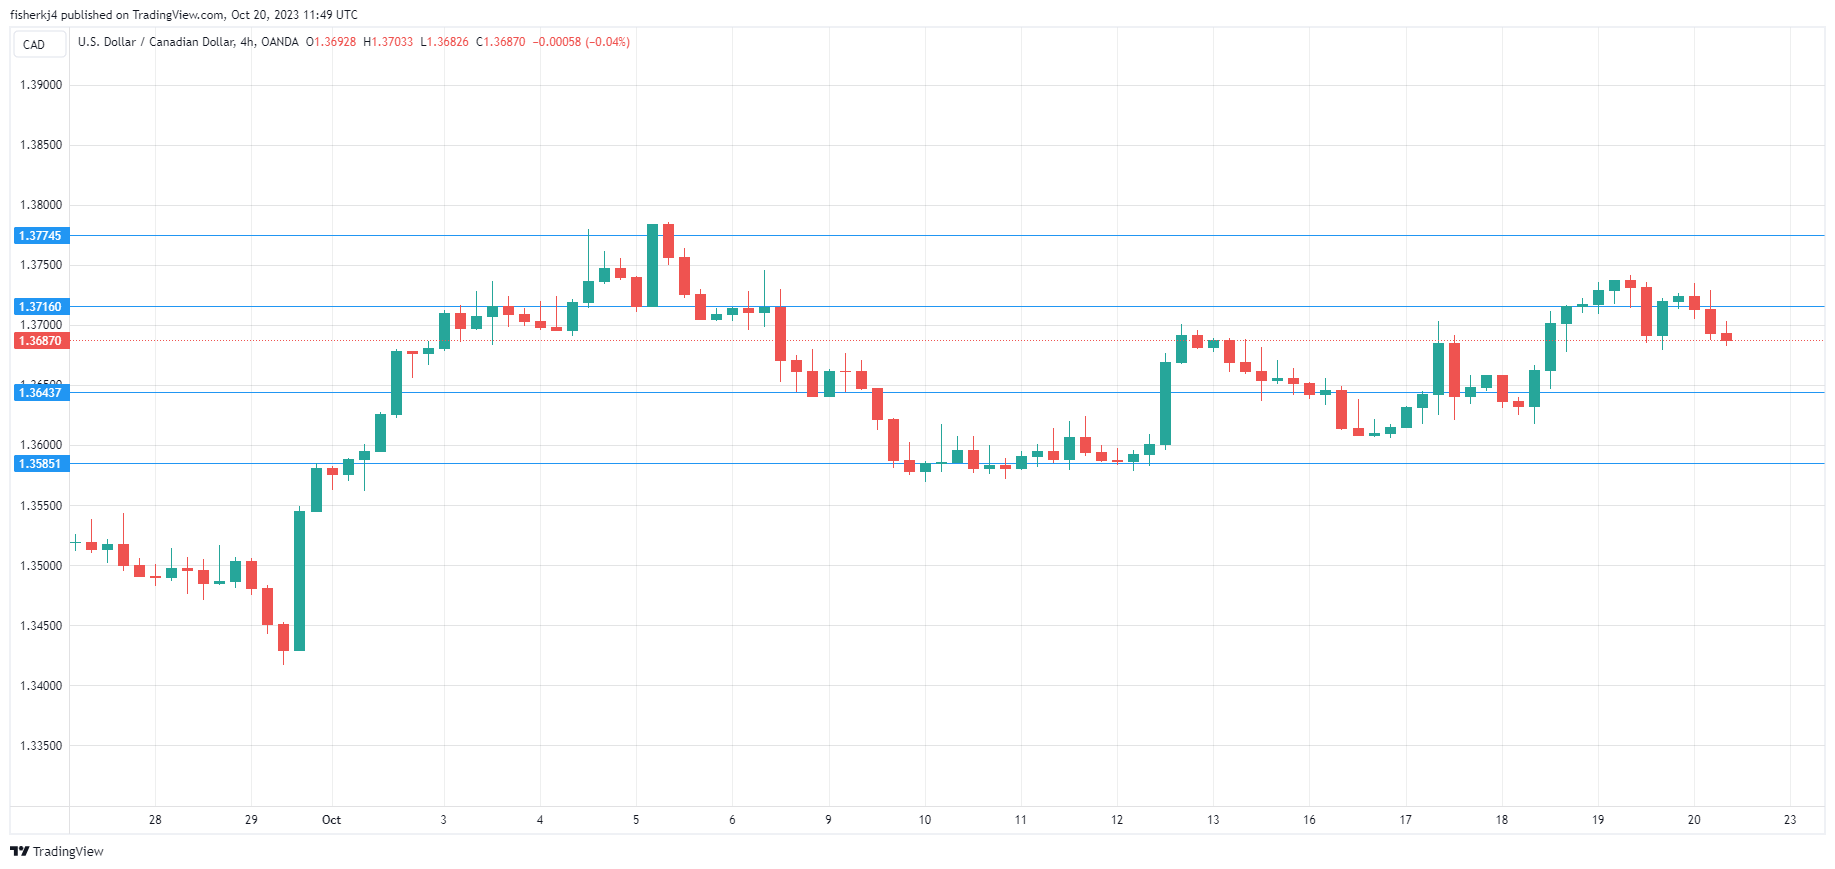
The Canadian dollar has edged higher on Friday. In the European session, USD/CAD is trading at 1.3688, down 0.23%. Canada releases retail sales later today, which could result in volatility from the Canadian dollar.
Canada’s retail sales expected to decline
Canada wraps up the week with the August retail sales report. The markets are bracing for a deceleration, with an estimate of -0.3% m/m, compared to a 0.3% gain in July. On a year-to-year basis, retail sales are projected to slow to 0.2%, down sharply from 2.0% in July.
The Bank of Canada is widely expected to hold rates at 5.0% for a second straight time at the October 25th meeting. The BoC has raised rates to high levels but has only hiked on two occasions in 2023, which indicates that on the whole, interest rates are where the central bank wants them.
I don’t expect to see the BoC trimming rates before mid-2024, but at the same time, the BoC will do its utmost to refrain from further tightening. The takeaway message is that we should expect rates to remain in restrictive territory for some time yet.
Last week’s inflation report showed a decrease of -0.1% for both headline and core CPI in September, which beat expectations. On a year-to-year basis, headline CPI dropped from 4.0% to 3.8% and the core rate eased to 2.8%, down from 3.3%.
Fed Chair Jerome Powell said on Thursday that inflation remained too high and that the 2% target would be difficult to reach if economic growth did not cool. Powell didn’t provide any hints about future rate policy, saying that rate decisions would be based on data and the economic outlook. The Fed has been sending out a “higher for longer” message, and Powell’s focus on high inflation seemed to reiterate this stance.
USD/CAD Technical
- USD/CAD is testing support at 1.3643. Below, there is support at 1.3585
- There is resistance at 1.3716 and 1.3774
Japanese Yen Stays Adrift, Core CPI Falls Below 3%
- Japanese core CPI falls below 3%
- Fed’s Powell says inflation too high, economy too strong
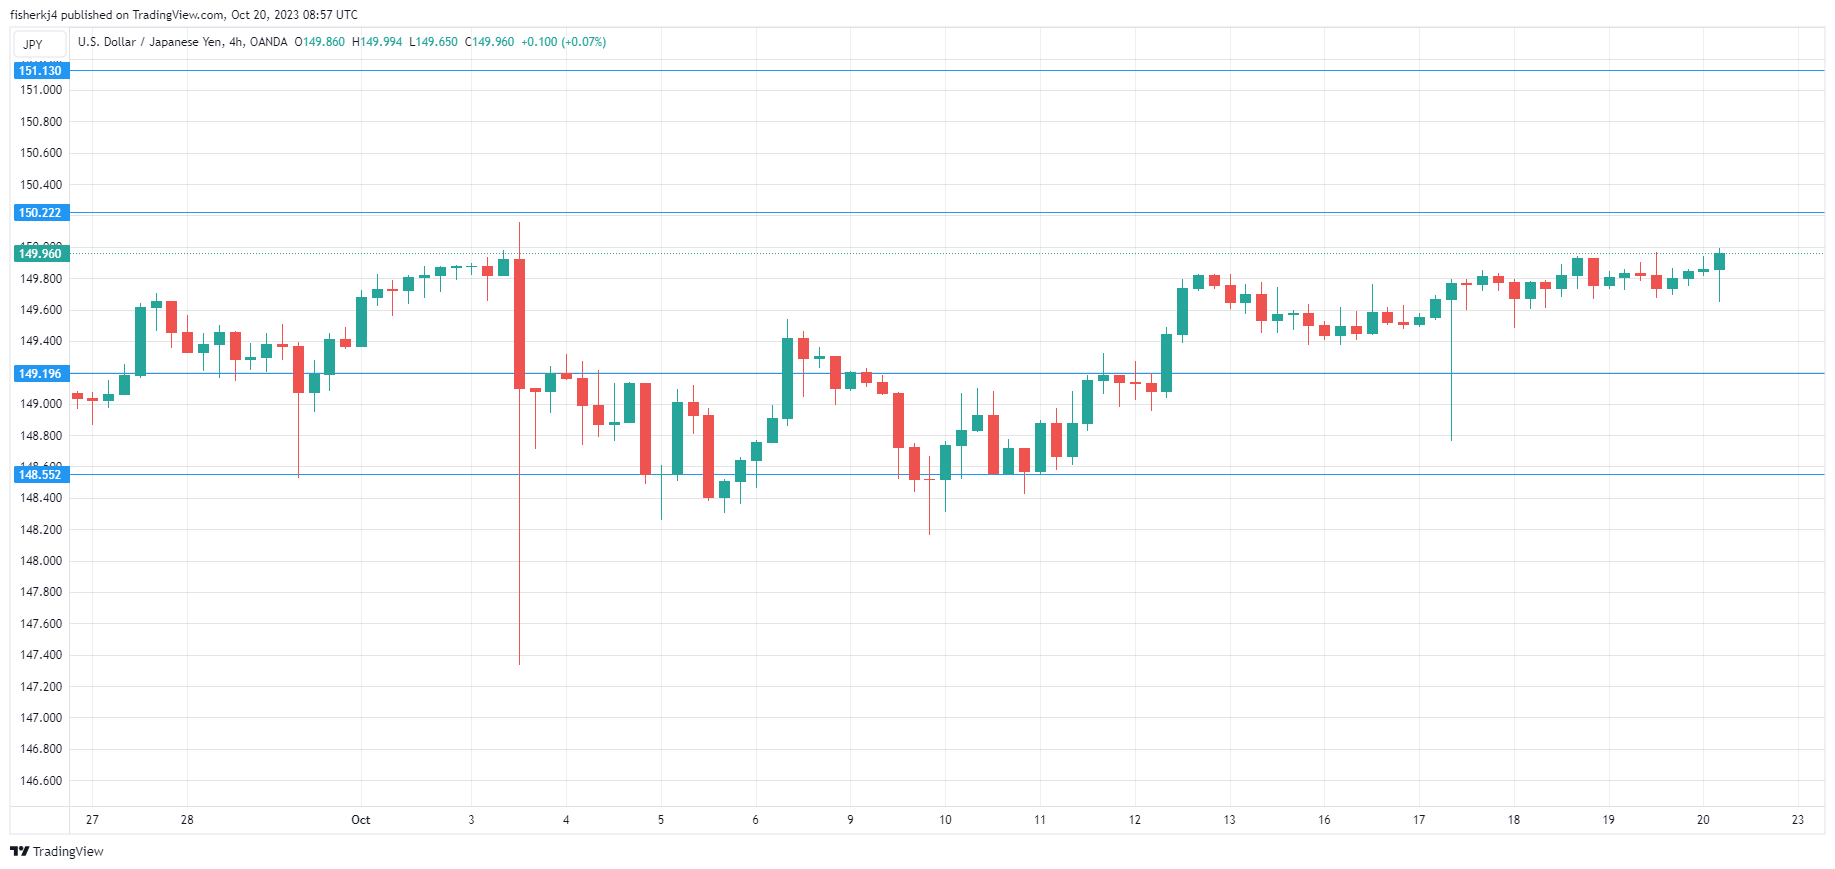
The Japanese yen is slightly lower on Friday. In the European session, USD/JPY is trading at 149.96, up 0.12%. The yen has shown little movement this week and continues to hover just shy of the symbolic 150 level. In early October, the yen breached 150 and then spiked sharply lower. It’s looking very likely that the yen will again breach 150 shortly.
Japan’s core inflation eases below 3%
Japanese core CPI, which excludes fresh food, slowed to 2.8% y/y in September, versus 3.1% in August but above the market consensus of 2.7%. The print fell below the 3% level for the first time since August 2022 but has now exceeded the Bank of Japan’s 2% target for 18 straight months. The “core-core” rate, which excludes fresh food and energy prices and is considered by the BoJ a better gauge of inflation trends, dropped from 4.3% to 4.2% in September, higher than the market consensus of 4.1%.
Inflation has been slowly easing, but the downtrend faces some possible headwinds. The yen continues to lose ground and tensions in the Middle East have raised fears that oil prices could hit $100 or higher. If oil prices rise or the yen continues to decline, the result will be higher inflation.
How will the Bank of Japan react to potential oil inflation and the weakening yen? The central bank holds a two-day meeting ending on October 31st and may have to revise its quarterly inflation and growth forecasts. The markets are on alert for the BoJ to phase out its massive stimulus but BoJ policy makers haven’t shown signs of shifting policy.
In the US, it’s a very light data calendar, highlighted by a speech from FOMC member Patrick Harker. On Thursday, Fed Chair Jerome Powell said that inflation was still too high and that growth would need to slow if inflation is to fall to the 2% target. Powell noted that further hikes might not be needed, as the rise in Treasury yields could help dampen growth and lower inflation.
USD/JPY Technical
- 150.22 is a weak resistance line, followed by resistance at 150.86.
- 149.19 and 148.55 are providing support
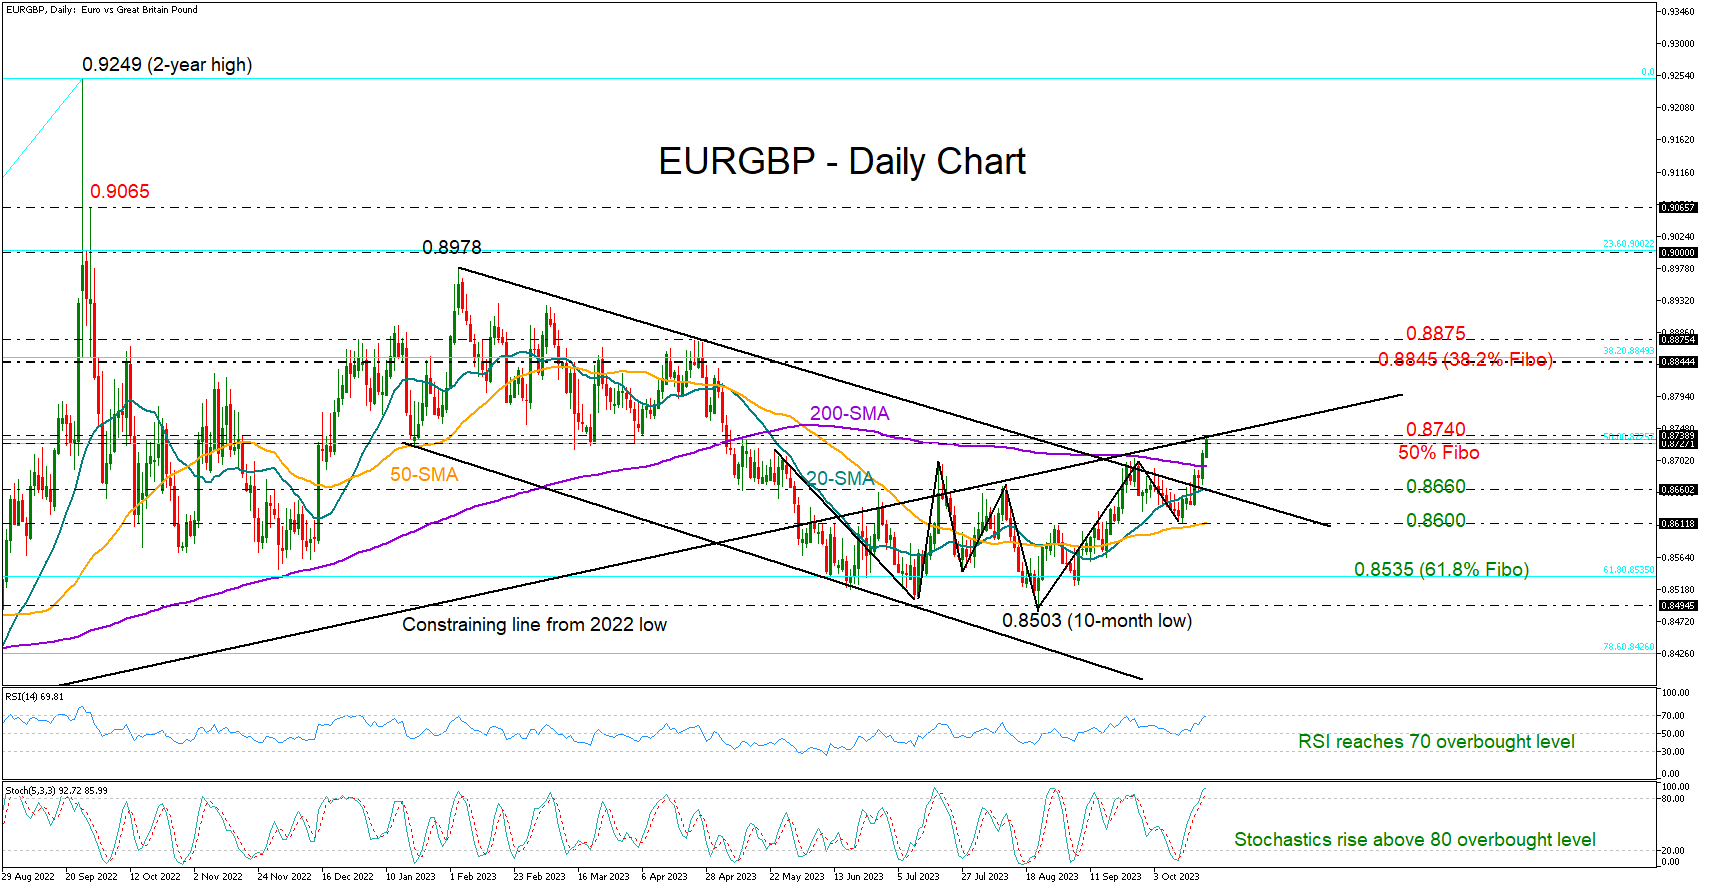
EURGBP Snaps Key Barriers, But One More Remains
- EURGBP heads for a strong weekly close
- Bull run faces another challenge at 0.8740
EURGBP recorded a couple of bullish achievements this week, ascending above the resistance trendline, which halted September’s bull run, and crawling above the 200-day simple moving average (SMA) for the first time since May.
The price resumed its bullish momentum on Friday to unlock a six-month high of 0.8736, but the 50% Fibonacci retracement of the 0.8201-0.9249 upleg at 0.8725 might prove challenging as the RSI and the stochastic oscillator hint at strengthening overbought conditions. It’s also worth noting that the upward-sloping line drawn from the 2022 trough came to block the way higher earlier today.
If the recovery continues above 0.8740, it may pick up steam towards the 38.2% Fibonacci level of 0.8850. The 0.8875 barrier from April is within breathing distance and will be closely watched too. Should it prove easy to overcome, the pair could head for the 0.8930 bar.
In the event sellers take over, initial support might develop around the 20-day simple moving average (SMA) at 0.8660 and near the broken resistance trendline. A drop below that base would neutralize the short-term picture, likely motivating another negative correction towards the 50-day SMA at 0.8611. Additional losses from there could aggressively squeeze the price towards the 61.8% Fibonacci of 0.8535.
All in all, EURGBP is looking cautiously bullish in the short-term picture. A decisive close above 0.8740 could bolster buying appetite, whilst a pullback below 0.8660, and more importantly beneath 0.8600, could create fresh selling interest.
Gold: Continues to Trend Higher on Rising Geopolitical Tensions
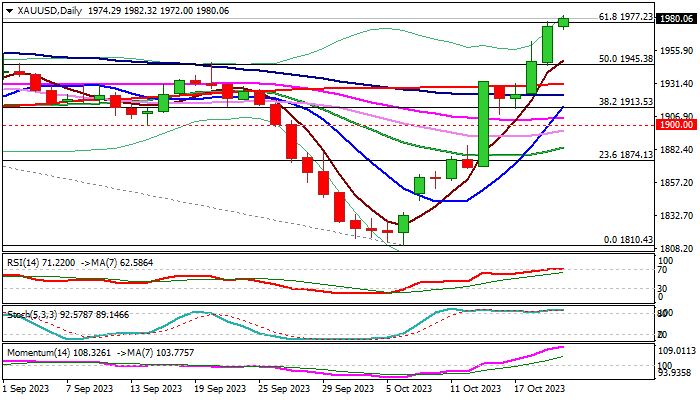
Gold extends steep rally and hit three-month high in early Friday, strongly supported by growing demand for safe haven on overheated situation in the Middle East, which threatens to escalate into possible broader regional crisis with unforeseeable consequences.
The yellow metal was up 4.5% last week and is on track for another strong advance this week (around 2.7% so far), with $50 increase seen in past two days.
Adding to support from geopolitics were the latest comments from Fed Chair Powell, who said that financial conditions were tightened by rise in bond yields which might be sufficient to keep the Fed on hold in its November policy meeting.
Fresh acceleration on Friday broke through important Fibo barrier at $1977 (61.8% of $2080/$1810 fall), generating fresh bullish signal, which will require confirmation on weekly close above this level and open way for attack at psychological $2000 barrier.
Technical studies are in full bullish configuration on daily chart but overbought, suggesting that bulls may take a breather in coming sessions.
Consolidation in current strongly favorable conditions for gold should be limited and offer better levels to re-enter strong bullish market, with dips to find solid support at $1950 zone.
Only significant decrease in geopolitical tensions, which so far looks very unlikely, would hurt bulls and push the price lower.
Res: 1987; 1997; 2000; 2010.
Sup: 1977; 1962; 1952; 1945.
AUD/USD and NZD/USD Signal More Downsides
AUD/USD declined below the 0.6355 and 0.6330 support levels. NZD/USD is also moving lower and might trade below the 0.5800 zone.
Important Takeaways for AUD/USD and NZD/USD Analysis Today
- The Aussie Dollar started a fresh decline from well above the 0.6355 level against the US Dollar.
- There is a key bearish trend line forming with resistance near 0.6330 on the hourly chart of AUD/USD at FXOpen.
- NZD/USD declined steadily from the 0.5930 resistance zone.
- There is a connecting bearish trend line forming with resistance near 0.5840 on the hourly chart of NZD/USD at FXOpen.
AUD/USD Technical Analysis
On the hourly chart of AUD/USD at FXOpen, the pair struggled to clear the 0.6400 zone. The Aussie Dollar started a fresh decline below the 0.6355 support against the US Dollar.
The pair even settled below 0.6330 and the 50-hour simple moving average. A low was formed near 0.6295 before there was an upside correction. The pair climbed above the 50% Fib retracement level of the downward move from the 0.6393 swing high to the 0.6295 low.
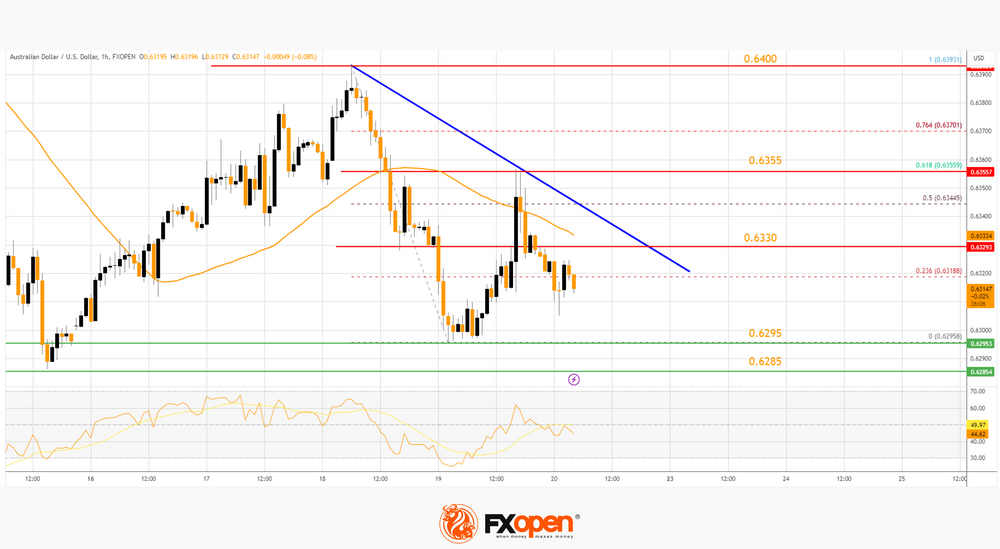
However, the bears were active near the 0.6355 resistance zone. It failed to clear the 61.8% Fib retracement level of the downward move from the 0.6393 swing high to the 0.6295 low.
There is also a key bearish trend line forming with resistance near 0.6330. On the downside, initial support is near the 0.6295 low. The next support sits at 0.6285. If there is a downside break below 0.6285, the pair could extend its decline.
The next support could be 0.6250. Any more losses might send the pair toward the 0.6220 support. On the upside, an immediate resistance is near the trend line at 0.6330.
The next major resistance is near 0.6355, above which the price could rise toward 0.6400. Any more gains might send the pair toward 0.6420. A close above the 0.6420 level could start another steady increase in the near term. The next major resistance on the AUD/USD chart could be 0.6500.
NZD/USD Technical Analysis
On the hourly chart of NZD/USD on FXOpen, the pair also followed a similar pattern and declined from the 0.5930 zone. The New Zealand Dollar gained bearish momentum and traded below 0.5870 against the US Dollar.
The pair even tested the 0.5815 zone before there was a minor recovery wave. The pair climbed above the 23.6% Fib retracement level of the downward move from the 0.5916 swing high to the 0.5815 low. However, it failed to surpass the 50-hour simple moving average at 0.5870.
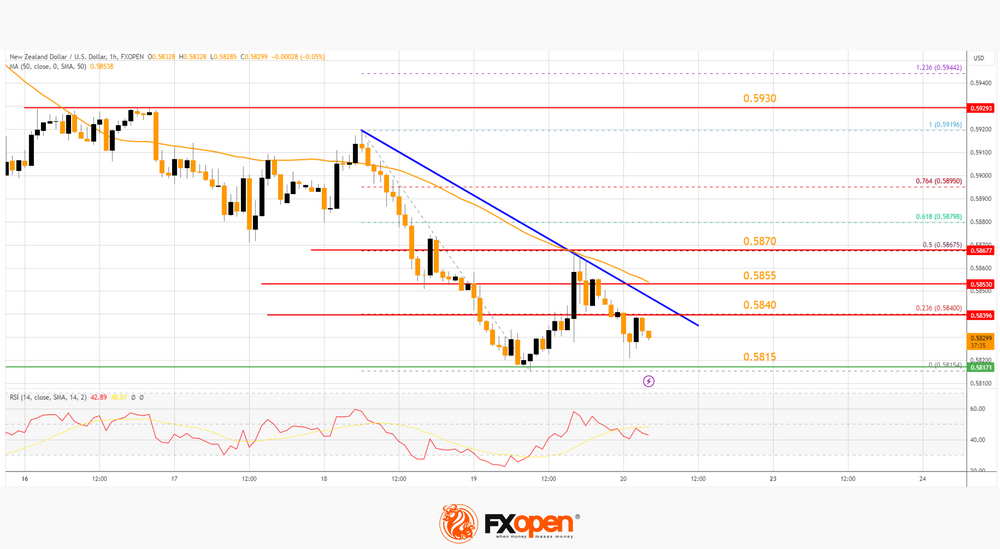
It is now moving lower and trading well below 0.5870. On the downside, immediate support on the NZD/USD chart is near the 0.5815 level.
The next major support is near the 0.5800 zone. If there is a downside break below 0.5800, the pair could extend its decline toward the 0.5740 level. The next key support is near 0.5700.
Immediate resistance on the upside is near a connecting bearish trend line at 0.5840. The next resistance is at 0.5855, followed by 0.5870. If there is a move above 0.5870, the pair could rise toward 0.5930. Any more gains might open the doors for a move toward the 0.5965 resistance zone in the coming days.
Trade global forex with the Innovative Broker of 2022*. Choose from 50+ forex markets 24/5. Open your FXOpen account now or learn more about trading forex with FXOpen.
* FXOpen International, Innovative Broker of 2022, according to the IAFT
This article represents the opinion of the Companies operating under the FXOpen brand only. It is not to be construed as an offer, solicitation, or recommendation with respect to products and services provided by the Companies operating under the FXOpen brand, nor is it to be considered financial advice.
USDCAD Retraces Higher Towards 6-month High
- USDCAD attempts to completely erase its latest pullback
- On track to test the 6-month peak of 1.3784
- Momentum indicators are heavily tilted to the bullish side
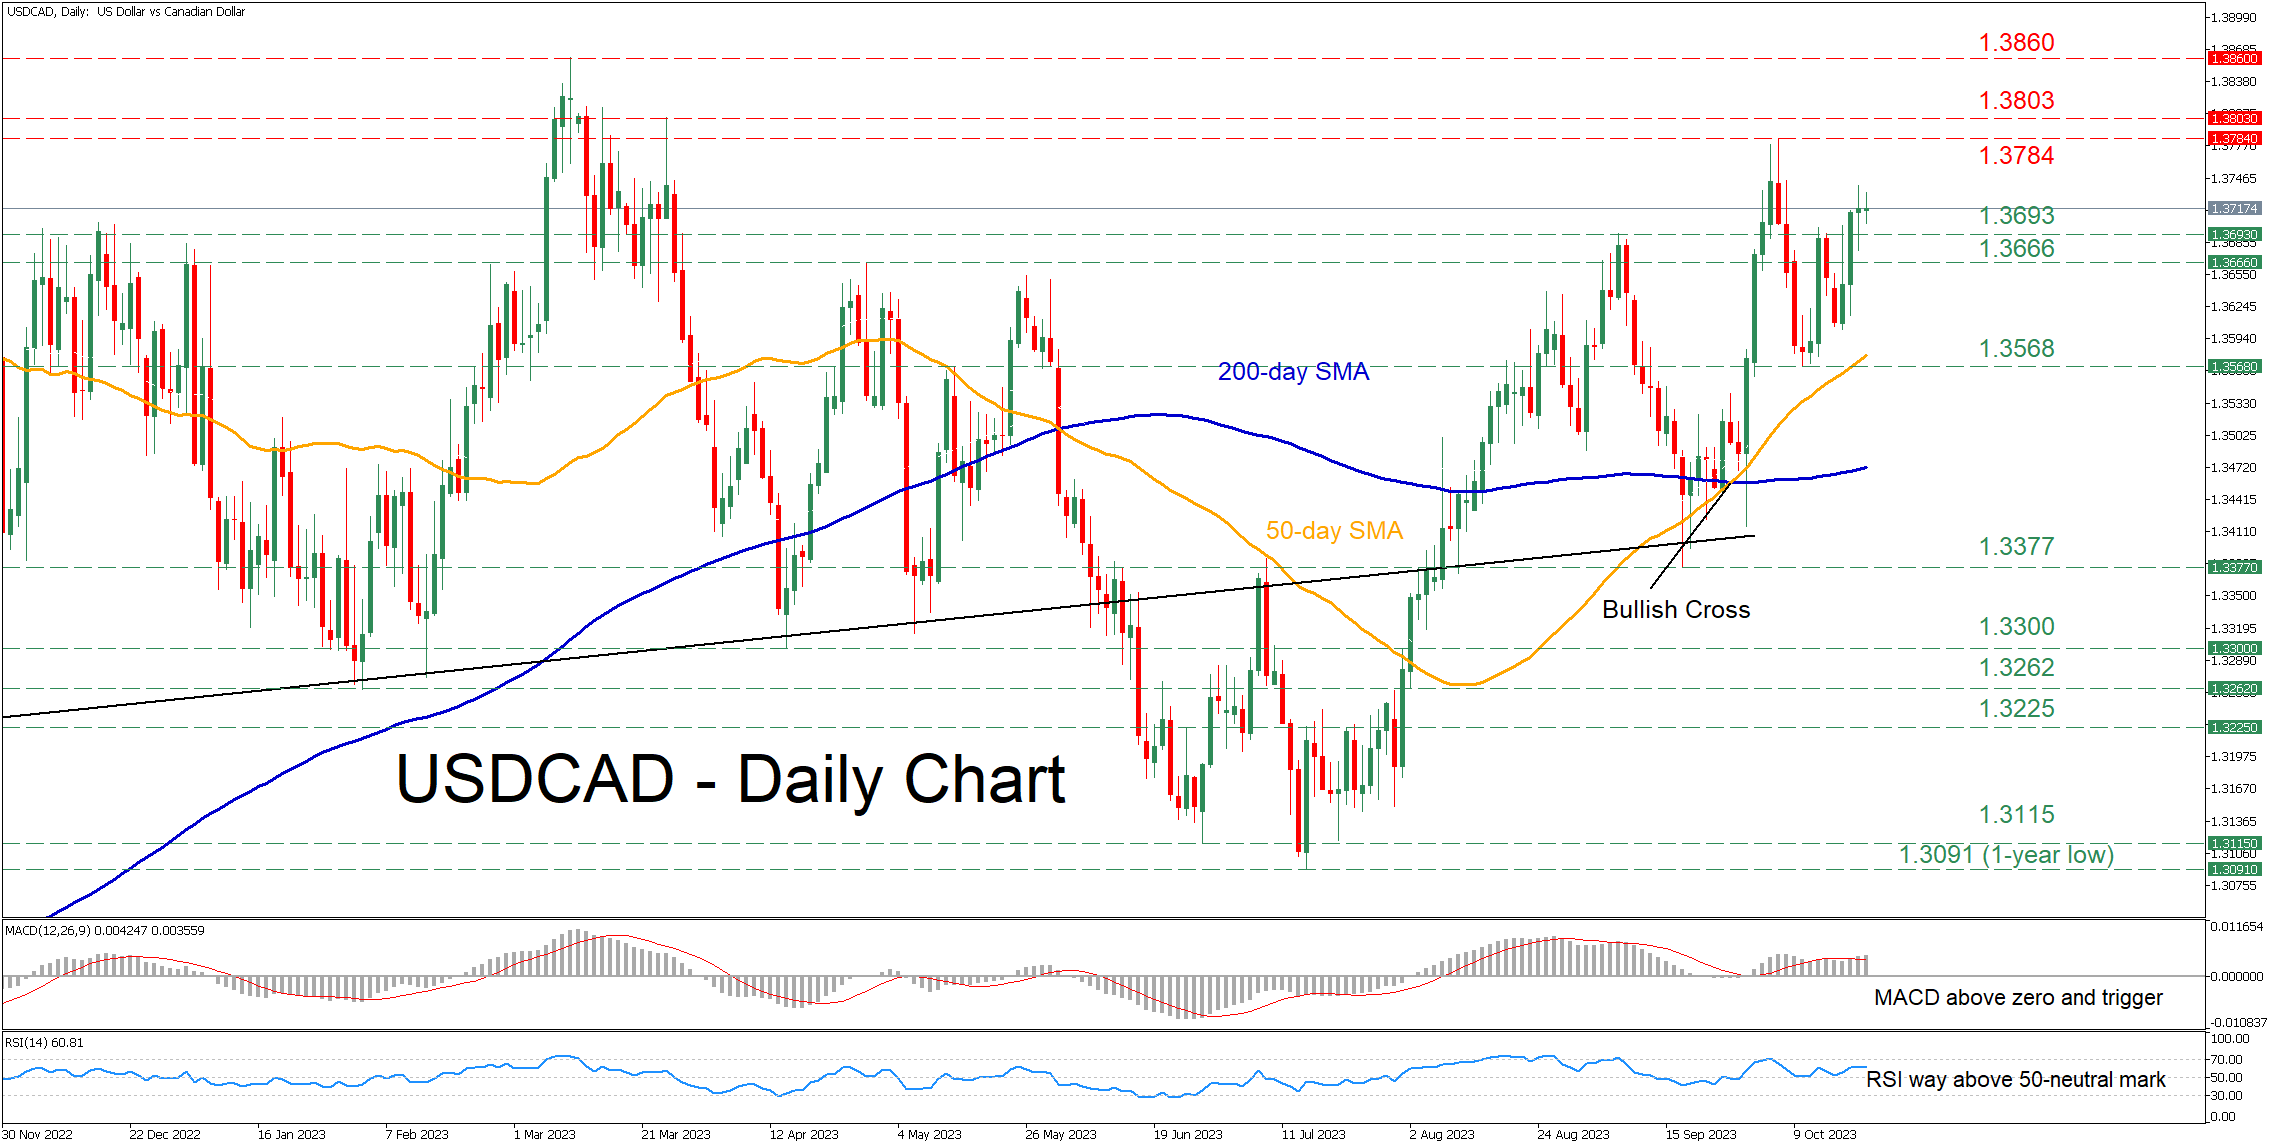
USDCAD had been in a steady advance since late September, posting a fresh six-month high of 1.3784 on October 5. Although the pair corrected to the downside, it quickly found its feet and recouped some losses, while both the RSI and MACD are endorsing this rebound as they are deep in their positive zones.
Should buying interest persist, the pair could re-test the recent rejection region of 1.3784, which is a six-month high. A break above that zone could open the door for the March resistance of 1.3803. Even higher, the 2023 peak of 1.3860 may curb further advances.
Alternatively, if the pair corrects to the downside, a couple of previous resistance regions such as 1.3693 and 1.3666 could provide initial downside protection. Sliding below the latter, the price could then test the October low of 1.3568. Should that barricade also fail, the spotlight could turn to the September bottom of 1.3377.
In brief, USDCAD appears ready to revisit its recent six-month high as near-term risks remain skewed to the upside.
GBP/JPY Daily Outlook
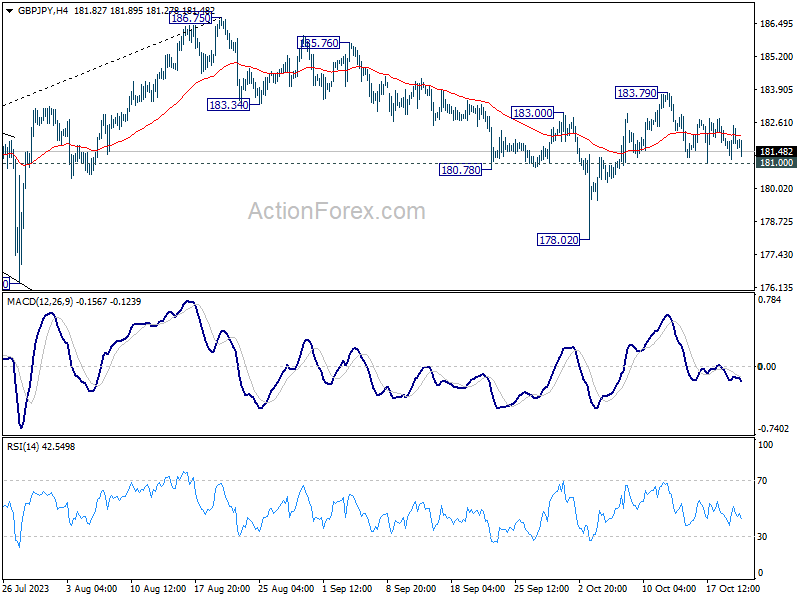
Daily Pivots: (S1) 181.21; (P) 181.86; (R1) 182.55; More...
Intraday bias in GBP/JPY remains neutral and further rise is in favor with 181.00 support intact. The favored case is still that correction from 186.75 has completed at 178.02. Above 183.79 will resume the rise from 178.02 to retest 186.75 high. However, break of 181.00 will dampen this view, and turn bias back to the downside for 178.02 instead.
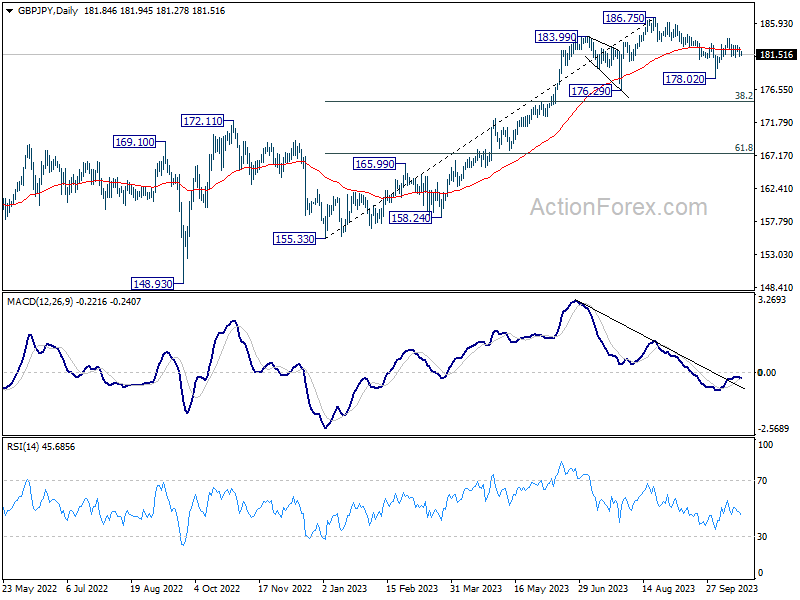
In the bigger picture, fall from 186.75 is seen as a corrective move only. As long as 176.29 support holds, larger up trend from 123.94 (202 low) should still be in progress. Break of 186.75 will target 195.86 (2015 high). Nevertheless, firm break of 176.29 will confirm medium term topping, and bring lengthier and deeper consolidations.
EUR/JPY Daily Outlook
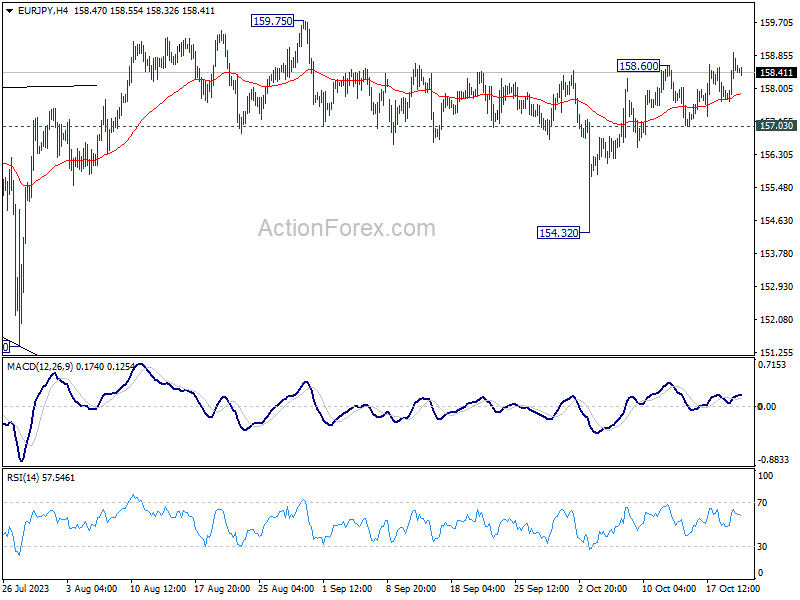
Daily Pivots: (S1) 157.81; (P) 158.38; (R1) 159.07; More....
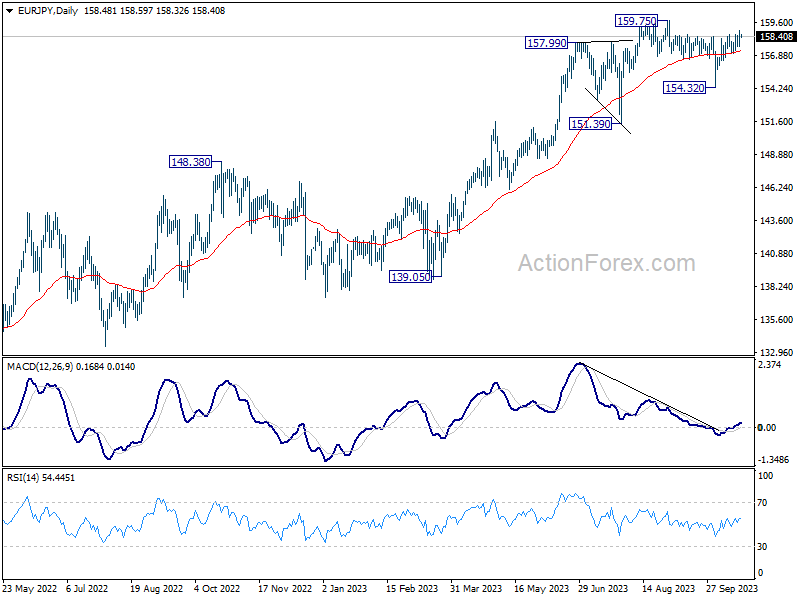
EUR/JPY's rise from 154.32 resumed by breaking 158.60 and intraday bias is back on the upside. Further rally should be seen to retest 159.75 next. Decisive break there will resume larger up trend. On he downside, break of 157.03 support is needed to signal completion of the rebound. Otherwise, further rally will remain in favor in case of retreat.
In the bigger picture, price actions from 159.75 are views as a corrective pattern. As long as 151.39 support holds, rise from 114.42 (2020 low) is expected to continue through 159.75 at a later stage. Nevertheless, firm break of 151.39 will confirm medium term topping, and bring lengthier and deeper correction.