

Sample Category Title
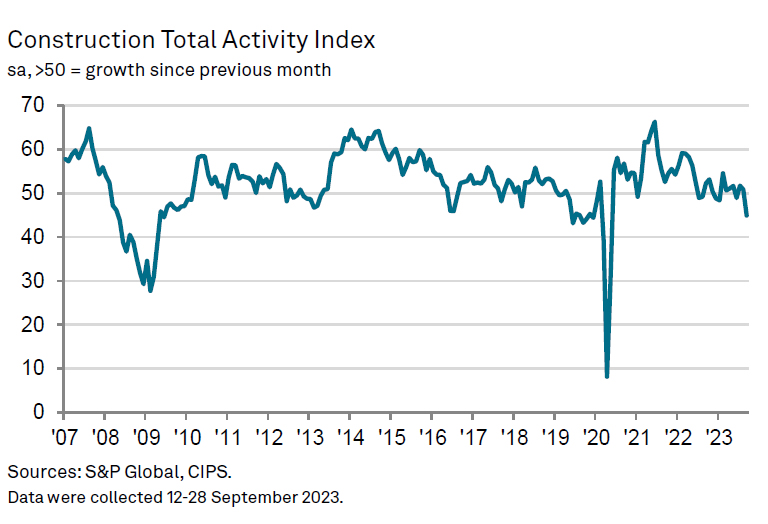
UK PMI construction dives to 45, sharp decline and worst since 2020
UK's construction sector is experiencing a significant setback, as evidenced by the sharp fall in PMI Construction index to 45.0 in September, a level not seen since May 2020 and far below the anticipated 49.9.
The report shows a distinct contraction in the industry, with residential work plunging to an index of 38.1, indicating the steepest decline amongst all sectors. Civil engineering activity isn't faring much better, posting a 45.7 index, while commercial building has shown some resilience, albeit still in the contraction zone at 47.7.
Tim Moore, Economics Director at S&P Global Market Intelligence, paints a grim picture of the current state of the sector. "Output levels declined across the UK construction sector for the first time in three months during September, and the latest downturn marked the worst overall performance since the early stages of the pandemic," he stated.
The future outlook for the construction sector does not instill confidence. Moore points out that the survey's forward-looking measures have remained somewhat pessimistic. "Order books decreased at an accelerated pace and business activity expectations eased to the lowest so far this year," Moore explained. The decrease in project starts has led to an increase in sub-contractor availability, reaching levels not seen since the summer of 2009.
USD/CHF Analysis: Rate Rises to Its Highest in Six Months
This happened against the backdrop of rising US bond yields. Reuters writes that it is in the region of a 16-year high. It is reasonable to assume that big capital was balancing its defensive portfolio by selling the franc, considered a safe haven, and buying dollars to invest in American bonds, which also have high-quality status.
On July 13, we wrote that the franc could rebound from the lower line of the channel (shown in red). This was supposed to be facilitated by hawkish rhetoric from Fed officials and, as a result, the strengthening of the dollar.
However, now the situation has reversed. The USD/CHF rate expanded the range of a larger downward channel and reached its upper limit. It even tried to break out of it on October 3 (but without noticeable success).
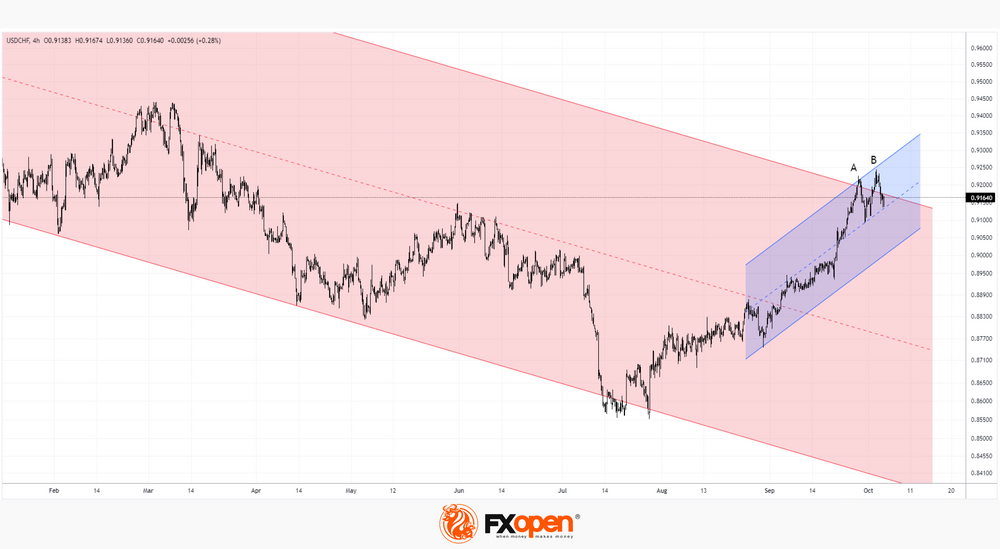
Will the bullish trend described by the rising channel (shown in blue) continue?
Signs of technical analysis provide grounds for doubt:
→ extremes A and B are similar to the double-top pattern. Moreover, the fact that the second peak is higher than the first can be interpreted as a bull trap;
→ the formation of divergence on indicators – as an indication of weakening demand for the dollar;
→ bearish activity may intensify as the listed signs are formed near the upper border of the red channel.
Thus, the likelihood of a decline to the lower border of the blue channel increases, and in the longer term, attempts at its bearish breakout.
This article represents the opinion of the Companies operating under the FXOpen brand only. It is not to be construed as an offer, solicitation, or recommendation with respect to products and services provided by the Companies operating under the FXOpen brand, nor is it to be considered financial advice.
WTI Oil’s Uptrend Faces Hazards
- Oil rally at risk near 84.00 after latest freefall
- Bearish continuation likely, but patience required
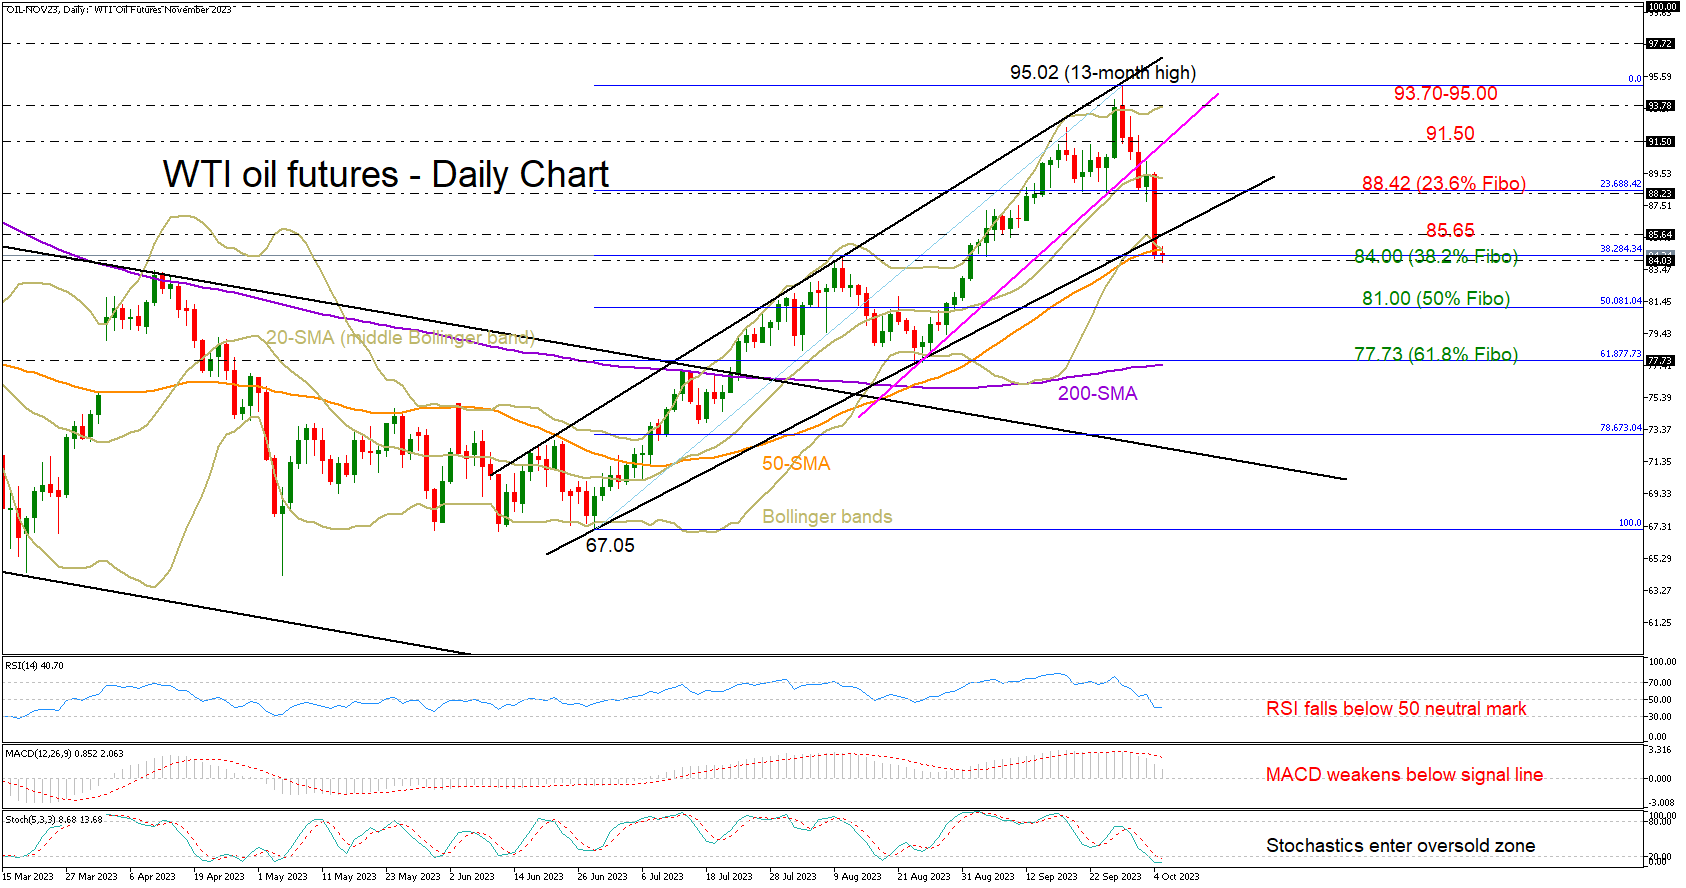
WTI oil futures closed with heavy losses on Wednesday near a one-month low of 84.16 following the rejection near the 20-day simple moving average (SMA) at 89.40.
The 50-day SMA put the brakes on the bear run marginally below the support trendline from June. But the negative trajectory in the RSI, which has slipped below its 50 neutral mark, and the downward move in the MACD are currently suggesting the freefall has not bottomed out yet.
On the other hand, the oversold signals detected by the stochastic oscillator are leading to speculation that a consolidation phase or an upside correction could be underway. Note that the price is trading around the lower Bollinger band.
Hence, sellers could hold off until the price violates the June-September uptrend clearly below the 84.00 mark and the 38.2% Fibonacci retracement of the latest upleg. Such a downfall could pressure the price towards the 50% Fibonacci of 81.00 and then down to the 61.8% Fibonacci of 77.73, where the 200-day SMA is hovering.
Alternatively, a positive change in sentiment could encourage some buying, especially if the price crawls back above the broken support trendline at 85.65. In this case, the price could advance towards the 23.6% Fibonacci of 88.42 and again fight the 20-day SMA at 89.20. A successful move higher is expected to slow down around 91.40 before stretching towards the critical 93.70-95.00 resistance area.
Summing up, WTI oil futures are still vulnerable to downside risks, with selling forces expected to pick up pace below 84.00. Otherwise, the market may attempt to climb back above 85.65.
WTI Oil Remains Under Increased Pressure after Falling by 5.5% on Wednesday
Renewed concerns about demand after the latest soft economic data raised possibilities of further slowdown in global economic growth, soured the sentiment.
The OPEC+ group held their meeting on Wednesday and left the oil output policy unchanged, as Saudi Arabia and Russia decided to keep their voluntary output cut by 1 million bpd and 300,000 bpd respectively, unchanged for the rest of the year.
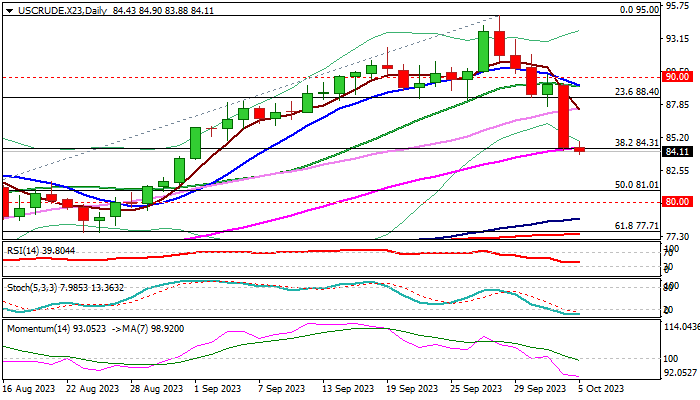
Oil price fell to the lowest in over one month, with Wednesday’s sharp fall contributing to formation of reversal pattern on daily chart.
Fresh weakness probes through pivotal Fibo support at $84.31 (38.2% of $67.02/$95.00 rally, where the action on Wednesday found temporary footstep) signaling that larger bears from $95.00 (2023 top, posted on Sep 28) may resume.
Daily studies maintain very strong bearish momentum and Wednesday’s massive bearish daily candle weighs heavily, opening way for fresh drop towards targets at $81.00 zone (top of rising daily cloud / 50% retracement) and $80.00 (psychological) in extension.
On the other hand, 14-d momentum is overstretched and stochastic in oversold territory, warning that bears may start to lose traction, though upticks should be limited and offer better selling levels in current conditions.
Former consolidation floor and broken Fibo 23.6% at $88.00/40 zone should cap extended upticks to keep bears in play.
Res: 84.90; 86.00; 87.54; 88.00.
Sup: 83.88; 81.71; 81.00; 80.00.
Markets Bounce Ahead Of US NFP Report
Asian shares staged a rebound on Thursday following the broadly positive cues from Wall Street overnight as plunging oil prices and weak US jobs data lifted market sentiment. European futures are pointing to a positive open amid the improving mood with investors directing their attention toward Friday’s US payrolls report which could support or hinder the market rally.
Looking at currencies, the yen is up roughly 0.3% this morning following the aggressive spike in value on Tuesday after touching 150 in USD/JPY. Given how it was the sole gainer versus the dollar, this fuelled speculation around official Japanese intervention. However, markets are still guessing what exactly triggered the move.
In the commodity space, oil prices plunged over 5% on Wednesday thanks to demand-side fears and a huge build in gasoline inventories. Gold is lingering near its lowest level since March, drawing some support from a weaker dollar and falling Treasury yields. Nevertheless, the precious metal remains vulnerable to further losses with sustained weakness below $1830 opening a path towards $1810.
US NFP in focus
The combination of economic data and speeches from Fed officials today could trigger more dollar volatility ahead of the highly anticipated non-farm payrolls report on Friday. Financial markets remain highly sensitive to US Treasury yields, and this continues to be reflected through the dollar rally.
The US economy is forecast to have created 170,000 jobs in September following August’s increase of 187,000 while the unemployment rate is seen cooling to 3.7% from 3.8% in the previous month.
A strong-than-expected US jobs report may support the “higher for longer” expectations around US interest rates, boosting the dollar as a result. However, further evidence of a cooling labour market may support the argument that the Fed is finished with hiking rates this year, weakening the greenback. As of writing, traders are currently pricing in a 20% probability of a 25-basis point hike in November, with this jumping to around 40% by December, according to Fed Funds futures.
Gold Collapses Towards 1,800, Stuck in Oversold Conditions
- Gold posts eighth straight daily loss, touching its lowest levels since March
- Decline shows no signs of easing, widening Bollinger bands point to high volatility
- Oscillators deep in oversold zone for quite some time, bulls remain on the sidelines
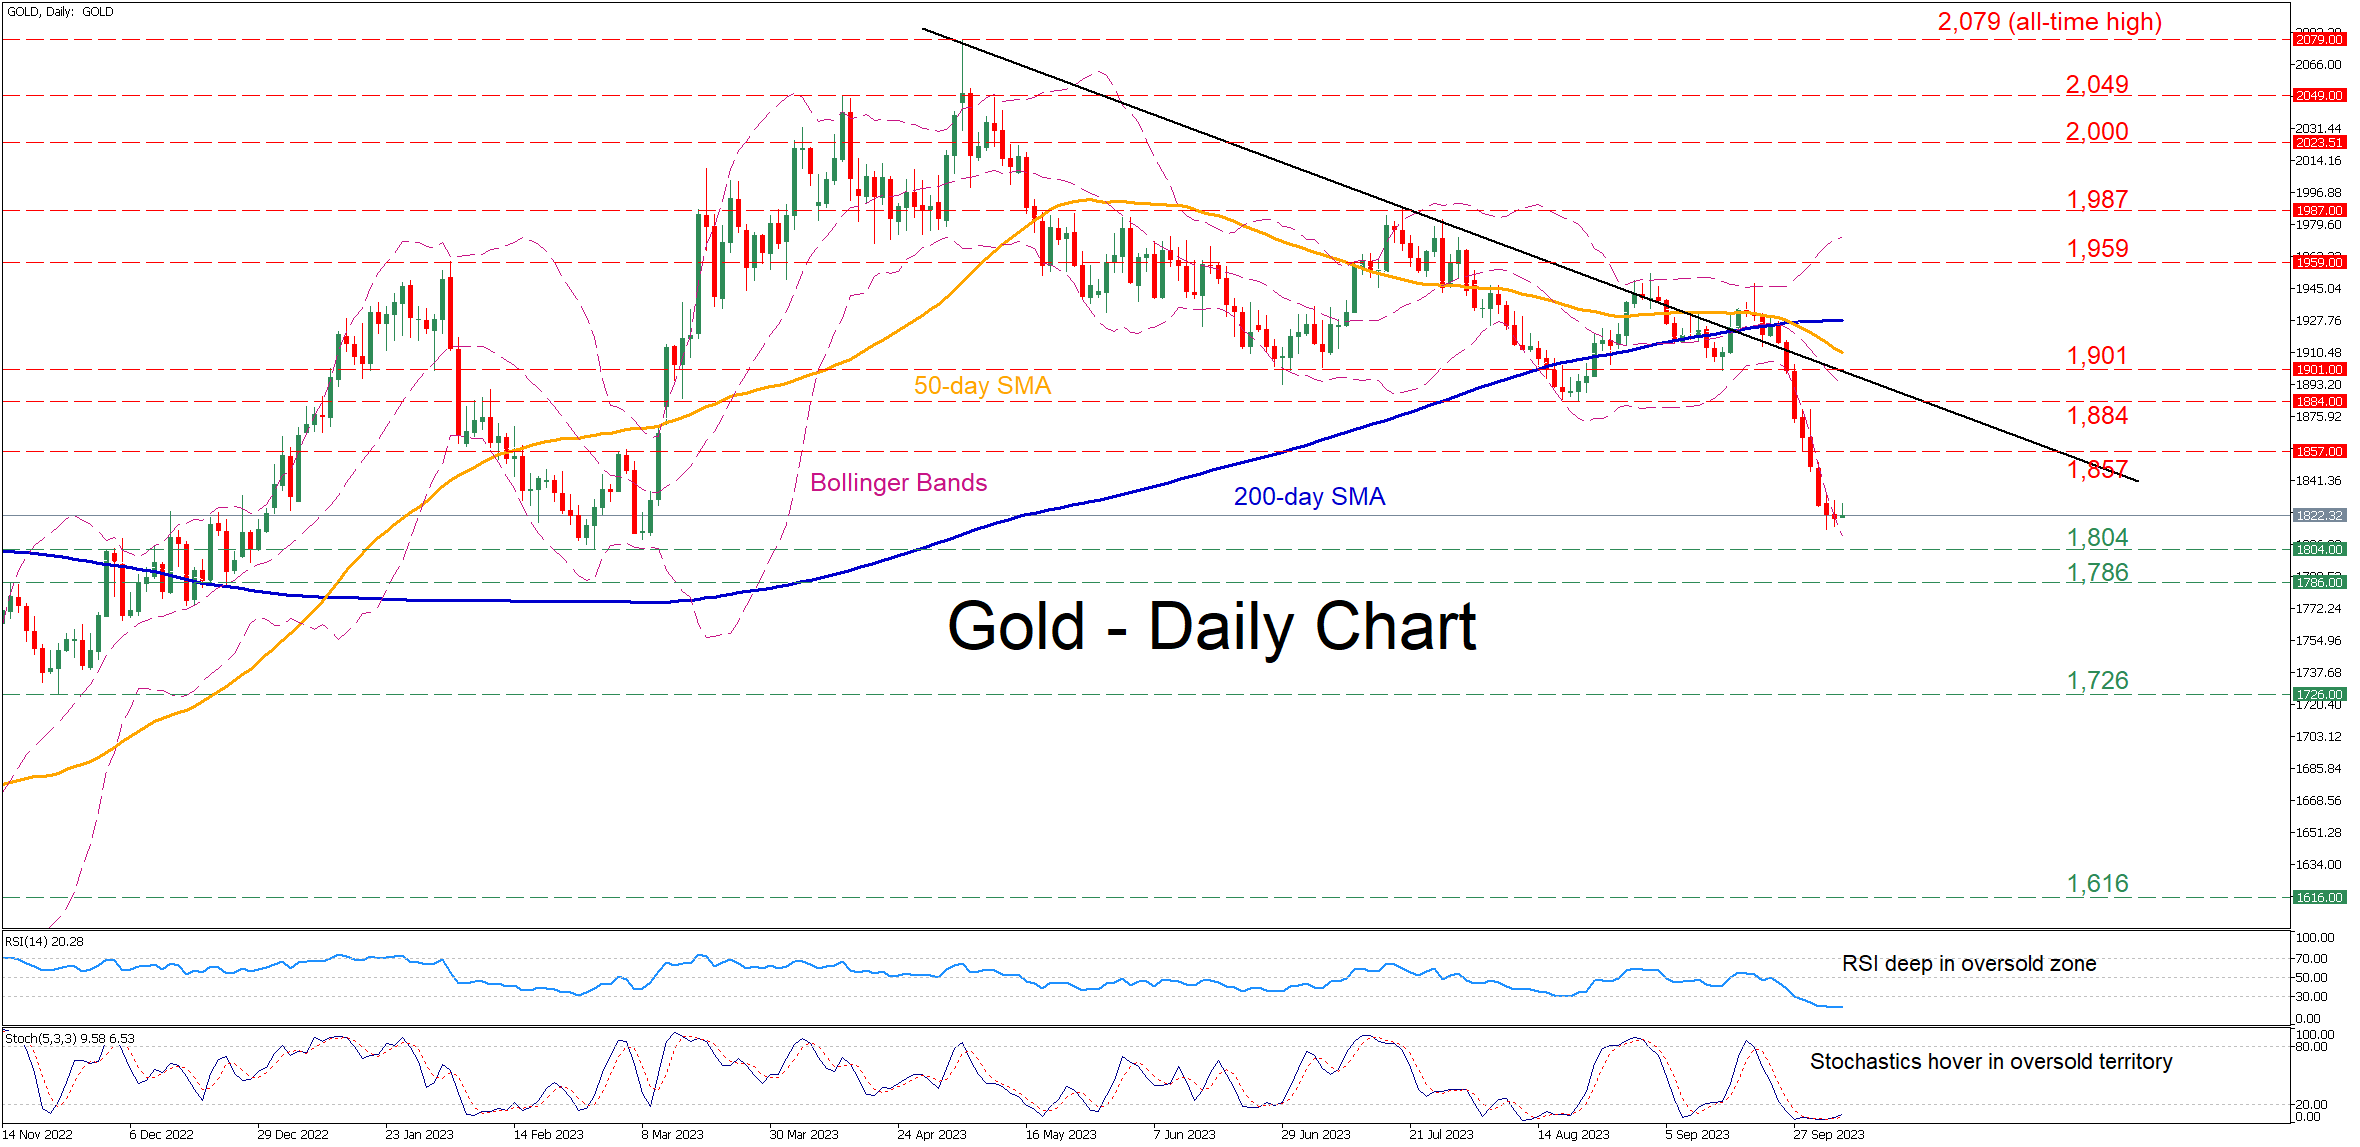
Gold has been in a steep downtrend after violating both its 50- and 200-day simple moving averages (SMAs). Even though the momentum indicators suggest that the retreat has been overstretched, the price appears unable to stage a rebound.
If the bears attempt to push the price even lower, the most prominent support could be the March bottom of 1,804, which is the lowest level observed in 2023. Falling to halt there, bullion might descend towards the November 2022 resistance of 1,786 that could serve as support in the future. Should that barricade also fail, the spotlight could turn to the November 2022 support of 1,726.
On the flipside, bullish actions could propel bullion towards the March resistance of 1,857. Surpassing that region, the price may face a couple of previous support regions such as 1,884 and 1,901. A violation of that region could set the stage for the February peak of 1,959.
All in all, gold seems to be under relentless downside pressure, which has pushed the price into oversold conditions. Can the bulls strike back?
US 30 Cash Index Takes a Much-Needed Breather
- US 30 cash index edges higher, a tad above the May 25 low
- The short-term bearish trend remains dominant
- Momentum indicators don't point to a reversal yet
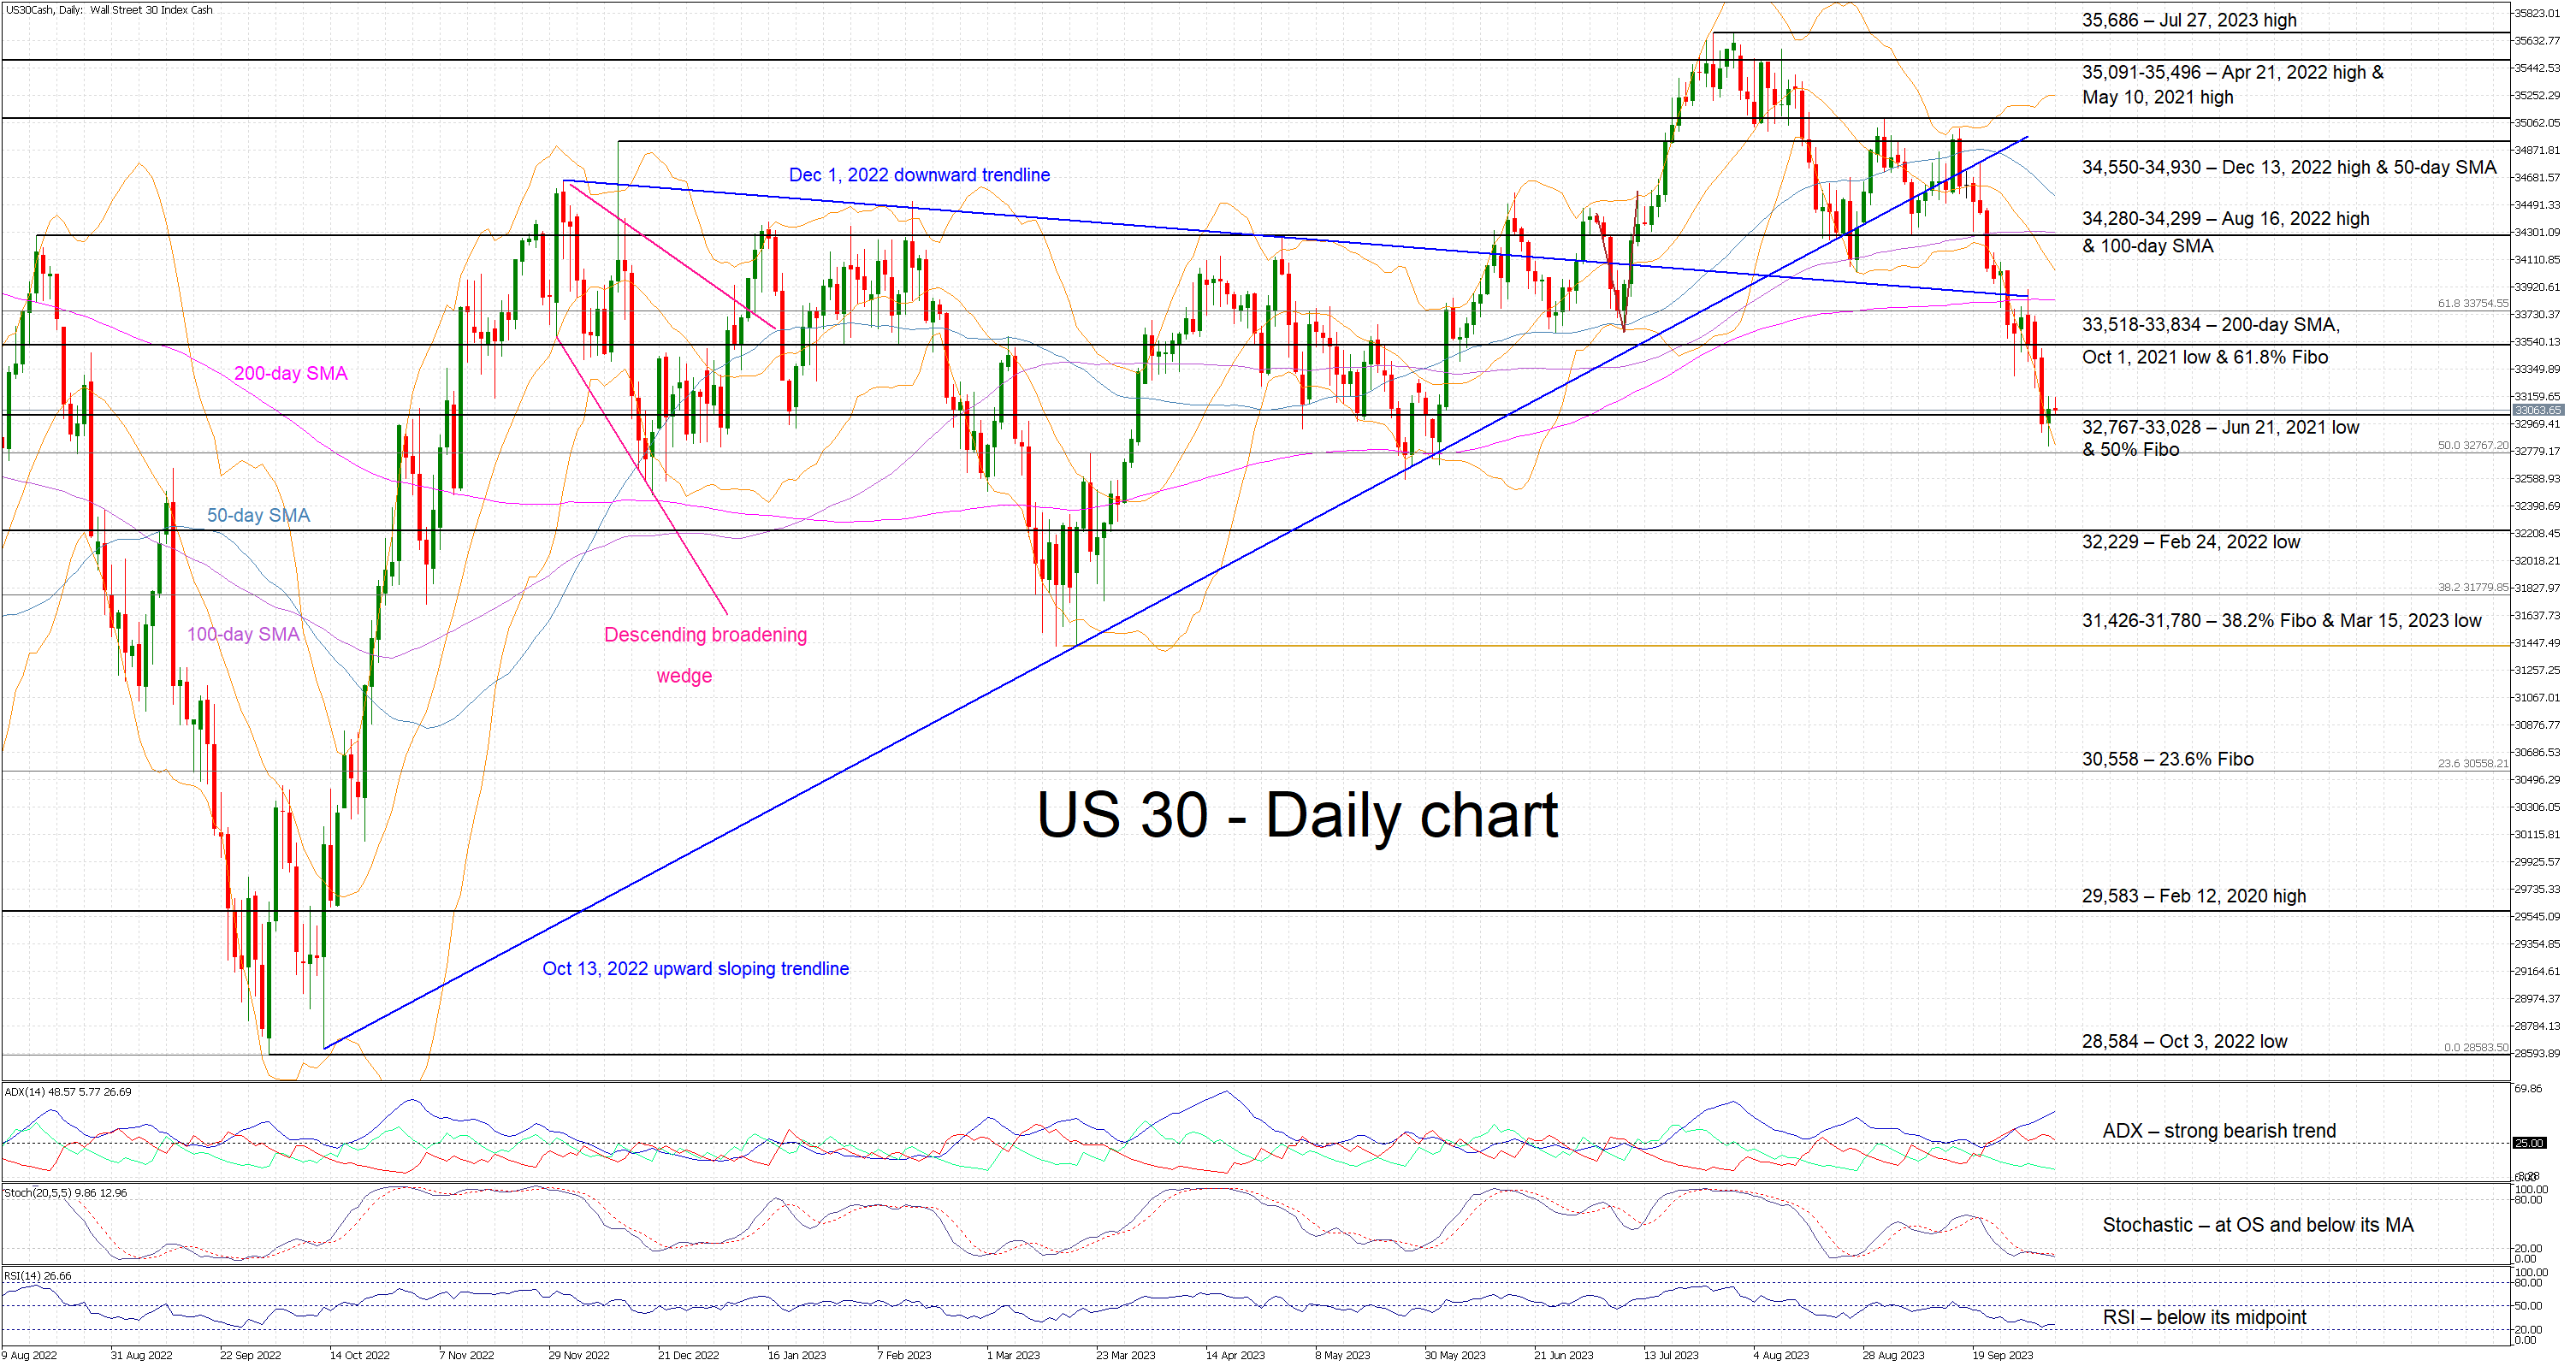
The US 30 cash index is trying to record the second consecutive green candle since it managed to bounce off the 50% Fibonacci retracement of the January 5, 2022 – October 3, 2022 downtrend. The bulls are desperately trying to set up their defense following the aggressive sell-off since the July 27 high, but the bearish series of lower lows and lower highs remains intact.
The momentum indicators appear to support the bears’ intention. The RSI is hovering at its lowest level since the September 2022 bearish move. Similarly, the Average Directional Movement Index (ADX) is still edging higher and signaling the presence of a strong bearish trend. Additionally, the stochastic oscillator continues to trade at the lower end of its oversold territory. While it can stay there for a while, a possible move higher, above both its moving average and oversold region, could be seen as a strong bullish signal.
Should the bears remain confident, they could try to break the busy 32,767-33,028 area that is populated by the June 21, 2021 low and the 50% Fibonacci retracement. If successful, they could set their eyes on the February 24, 2022 low at 32,229, and then potentially plot a course towards the important 31,426-31,780 region.
On the flip side, the bulls are keenly determined to keep the US 30 index above the 32,767-33,028 area. They could then have a go at overcoming the 33,518-33,834 range, set by the 200-day simple moving average (SMA), the October 1, 2021 low and the 61.8% Fibonacci retracement. Even higher, the next resistance area could come at the 34,280-34,302 region.
To sum up, the US 30 cash index bears remain in control of the market and are probably taking a breather after a strong sell-off. The bulls are hoping for a sizeable upleg but lack the support of the momentum indicators.
WTI Oil Analysis: Price Falls 10% in Less Than a Week
In our article “Oil Analysis: Finally, A Bearish Reversal?” on September 21, we drew attention to emerging signs that the initiative was shifting to the bears. This was noticeable in the changes in the dynamics of impulses and corrections, as well as in the analysis of the interaction between trading volumes and prices.
Since then, the bulls were able to update the high of the year on September 28, but the price did not stay there for long, falling sharply in the following days. Three bearish candles formed on the chart, which confirmed the problems of the bulls, and the double top pattern (A-B) also became relevant.
Another principle of technical analysis that emphasized the dominance of supply over demand is that each upward move was approximately 2 times weaker than the downward move. This can be seen in the consistent structure characteristic of a bearish trend:
→ the C→D move is approximately 50% of the B→C bearish momentum;
→ the rebound from the median line of the ascending channel E→F is approximately 50% of the bearish impulse D→E;
→ the bounce from the (now former) support line 87.50 G→H is approximately 50% of the bearish momentum F→G.

Yesterday, the US Energy Information Administration (EIA) reported that supplies of finished motor gasoline, reflecting demand, fell to about 8 million barrels per day, the lowest since the beginning of this year. The news contributed to the formation of a new bearish impulse, which broke through the ascending channel (shown in blue).
It is possible that another I→J rollback will follow. If so, then the formation of top J may be facilitated by resistance from the level of 87.50, the lower border of the ascending channel and the 50% Fibo level.
This article represents the opinion of the Companies operating under the FXOpen brand only. It is not to be construed as an offer, solicitation, or recommendation with respect to products and services provided by the Companies operating under the FXOpen brand, nor is it to be considered financial advice.
Bearish Bond Momentum Can Be on Hold
Markets
A final push lower (in bonds) in yesterday’s Asian session saw the German 10-yr yield touching 3% and the US 30-yr yield kissing 5%. From there on, an oversold market started looking for a floor. A crash in the oil price did the trick from European noon, triggering investors to square some positions after a breath-taking sell-off which started this summer and accelerated after the September FOMC meeting (5%+ policy rate until end 2024). Brent crude prices tumbled from a start above $91/b to $86/b, their lowest level since end August. The move was partly technically related after a drop below the $90.5/b neckline of a double top formation. The Saudi/Russian additional oil production cut confirmation until December, failed to bring counterweight. The oil market is looking for more of an equilibrium as well with $90+ levels being perhaps too optimistic over future demand despite restricted supply. At the end of the session, US yields corrected between 6.3 bps (10-yr) and 9.8 bps (2-yr) lower. The outperformance at the front end of the curve started after the September ADP employment report, which fell short of expectations (+89k vs 150k). The positive run of job gains, dating back to Feb2021, is prolonged but momentum fades bringing the labour market more in balance. The September services ISM moderated as expected from 54.5 to 53.6. Details remained solid, with markets singling out the only weak point which was a more pronounced setback in new orders (51.8 from 57.5). The market implied probability of a final Fed rate hike before the end of the year fell back from 50% to 40%. German yields lost 3 bps to 8.4 bps but contrary to the US it was the very long end which outperformed. Yesterday’s correction on bond markets impacted equity and FX markets as well. While main European stock indices still faced a mixed to slightly weaker close, key US gauges rebounded up to 1.35% for Nasdaq. The dollar correction is modest so far (trade-weighted from 107.06 open to 106.80 close) but continues this morning. EUR/USD follows a similar trajectory from a low near 1.0450 to 1.0520 currently. After yesterday’s move, we believe that bearish bond momentum can be on hold with for some time with consolidation kicking in (rebound on stock markets and further correcting USD). Especially so, if tomorrow’s US payrolls report would show signs of a less robust labour market as well. The consensus bar (+170k) seems on the high end.
News and views
The National Bank of Poland reduced is policy rate by 25 bps to 5.75% yesterday after starting its easing cycle last month with an astonishing 75 bps cut. A further slowdown in CPI inflation in September 8.2%Y/Y from 10.1% justified the easing. While the decline is for an important part due to lower energy and food prices, the NBP also sees a further moderation in core inflation. Together with low economic activity/demand, the NBP expects this will support a further decline in consumer prices in the coming quarters, adding to the restrictiveness of monetary policy. The NBP reiterated that that the decrease in inflation would be faster if supported by an appreciation of the zloty, which it deems consistent with the fundamentals of the Polish economy. It is keeping the option open to intervene in the foreign exchange market. The 2-y zloty swap rate yesterday jumped more than 20 bps (close 4.72%). The zloty after touching an intraday low against the euro just below EUR/PLN 4.65, rebounded to close at EUR/PLN 4.60.
South Korean inflation accelerated substantially more than expected for a second month in a row (0.6% M/M and 3.7% Y/Y). Prices already rose 1.0% M/M and 3.4% Y/Y in August after touching a cycle low of 2.3%Y/Y in July. In a monthly perspective, price gains were mainly driven by higher transport costs (+1.3% M/M), food prices (1.6% M/M) and housing/utility costs (1.3%). Core inflation (excluding volatile food and energy prices) remained unchanged at 3.3%. Both the Korean finance minister and the Bank of Korea indicated that they expect inflation to return to the 3% area at the end of this year. The Bank of Korea after a January rate hike to 3.5%, kept its policy rate unchanged this year. The next meeting is scheduled for Oct 19. Today’s inflation data will force the BOK to maintain a hawkish stance to keep rates at a high level for longer. Yesterday, South Korea August production data also showed a surprisingly strong rebound of 5.5% M/M. The Korean won yesterday touched the weakest level of this year at USD/KRW 1363 on broad-based USD strength. This morning the won ‘rebounds’ modestly to trade in the USD/KRW 1350 area.
USD/JPY Technical: Retesting 20-day Moving Average Support with Bearish Momentum
- Key technical elements have turned bearish for USD/JPY ex-post suspected BoJ’s invention.
- USD/JPY bulls’ first defence line at the 20-day moving average acting as a 148.25 support looks vulnerable.
- The next immediate support to watch will be at 146.10/146.00
The USD/JPY has shaped the expected push-up and hit the key resistance zone of 150.00/150.30 as it printed an intraday high of 150.16 on Tuesday, 3 October during the first half of the US session upon the release of the better-than-expected US JOLTs jobs numbers for August.
Thereafter within just 5 minutes, the USD/JPY tumbled by close to three big figures to print an intraday low of 147.34 on suspected Bank of Japan (BoJ) intervention under the instructions of Japan’s Ministry of Finance.
The odds have increased for a broad-based USD strength pull-back scenario
Yesterday’s movement in the broad-based FX market has started to show signs of a potential multi-week US dollar strength pull-back scenario as the US Dollar Index’s daily RSI indicator, a gauge on momentum has exhibited a bearish divergence condition at its overbought zone (its first occurrence since its medium-term uptrend kickstarted on 14 July 2023).
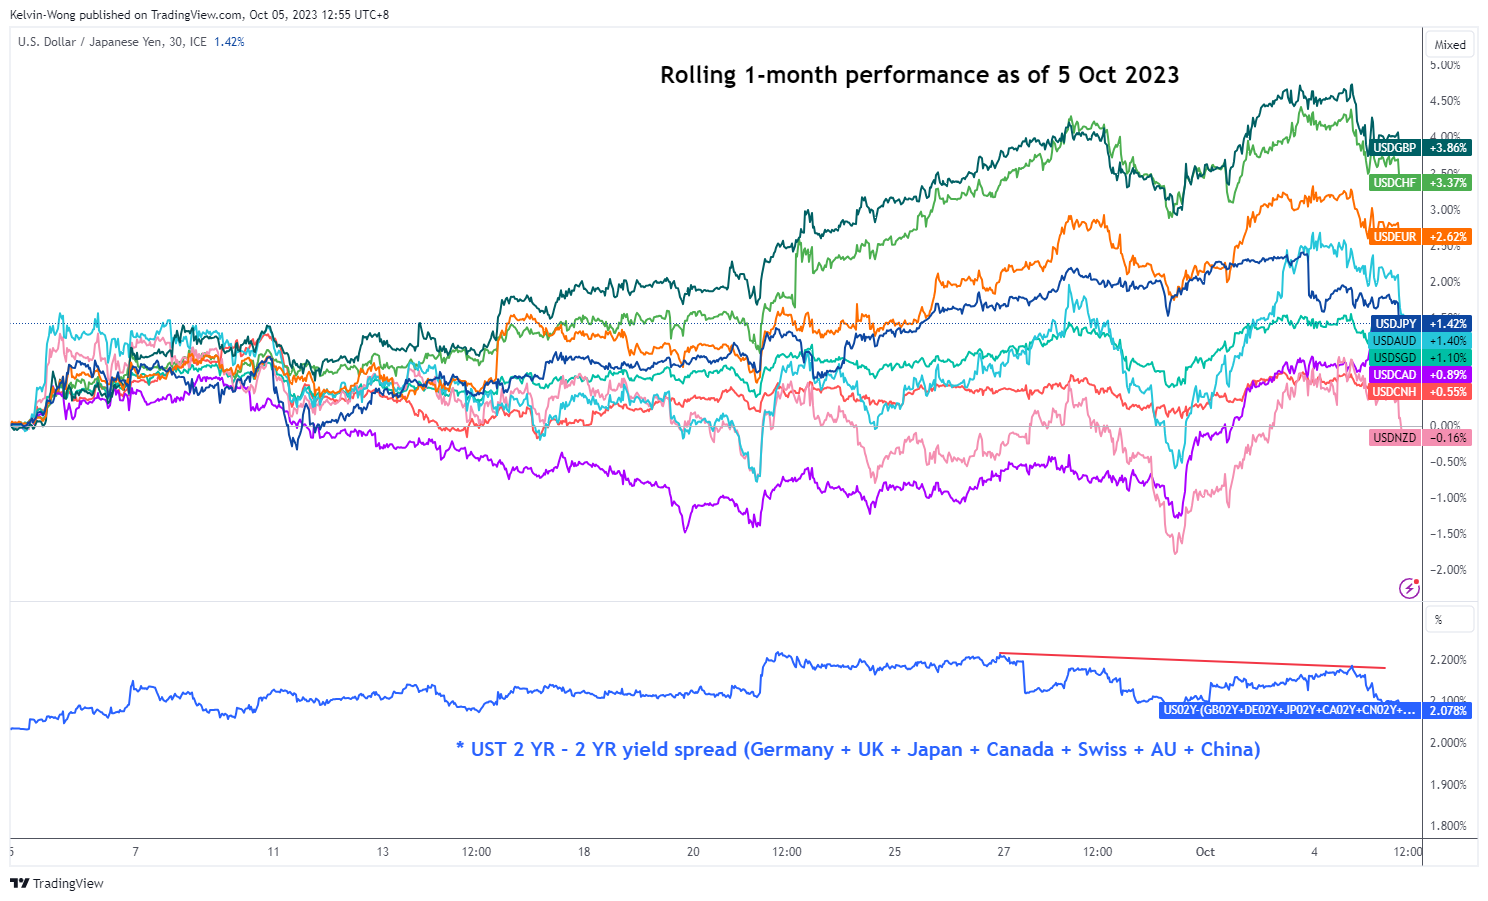
Fig 1: Rolling one-month US dollar performance with 2-year US Treasury yield premium spread as of 5 Oct 2023 (Source: TradingView, click to enlarge chart)
Also, the rolling one-month performances as of 5 October 2023 of the prior weakest currencies against the dollar (GBP, EUR, CHF) have started to display mean reversion movements from 27 September 2023 to cover the prior gaps with the other “lesser weaker” currencies (AUD, NZD, CAD, CNH, SGD) as measured against the US dollar.
In addition, the 2-year US Treasury yield premium over an equal-weighted average of the 2-year sovereign yields of Germany, the UK, Japan, Canada, Switzerland, Australia, and China has started to shrink over the same period.
These latest observations support a potential broad-based multi-week US dollar strength pull-back scenario which in turn reinforces another round of further potential weakness in the USD/JPY where the earlier unconfirmed BoJ’s intervention to halt a multi-month JPY down move is likely to have created a fear element in the mindset of short-term speculators that have a persistent bullish view on the USD/JPY.
Impending medium-term momentum bearish breakdown on USD/JPY
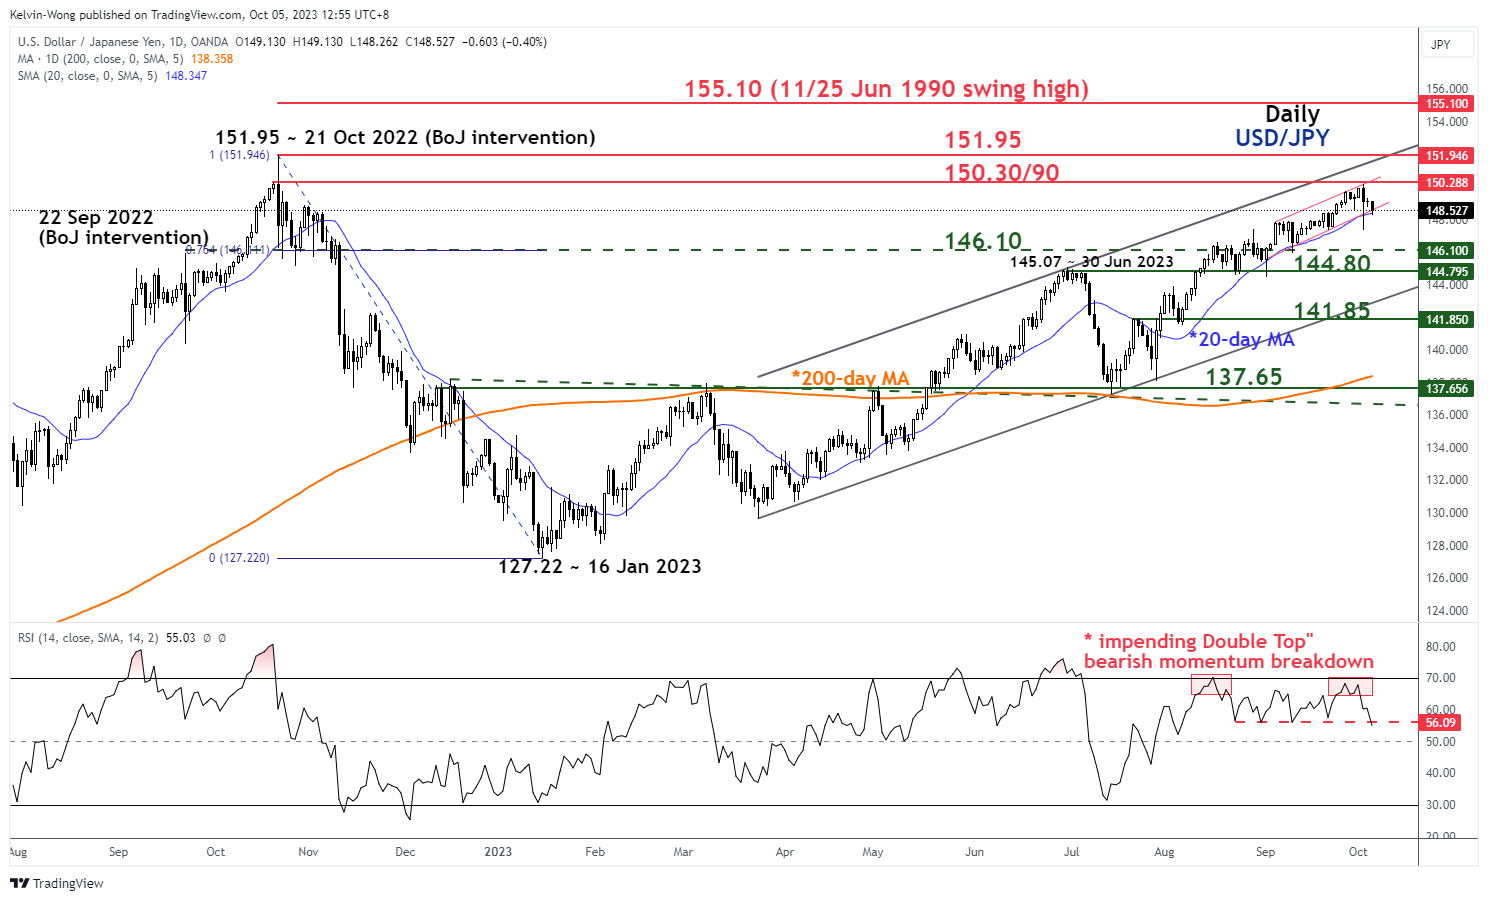
Fig 2: USD/JPY medium-term trend as of 5 Oct 2023 (Source: TradingView, click to enlarge chart)
The daily RSI of the USD/JPY has shaped an impending “Double Top” bearish reversal configuration around its overbought zone and right now, it is attempting to stage a bearish breakdown below a parallel support at the 56 level.
This key technical element suggests that the medium-term downside momentum of the USD/JPY has started to build up which may jeopardize the ongoing short to medium-term uptrend phases of the USD/JPY.
The 20-day moving average support on the USD/JPY looks vulnerable
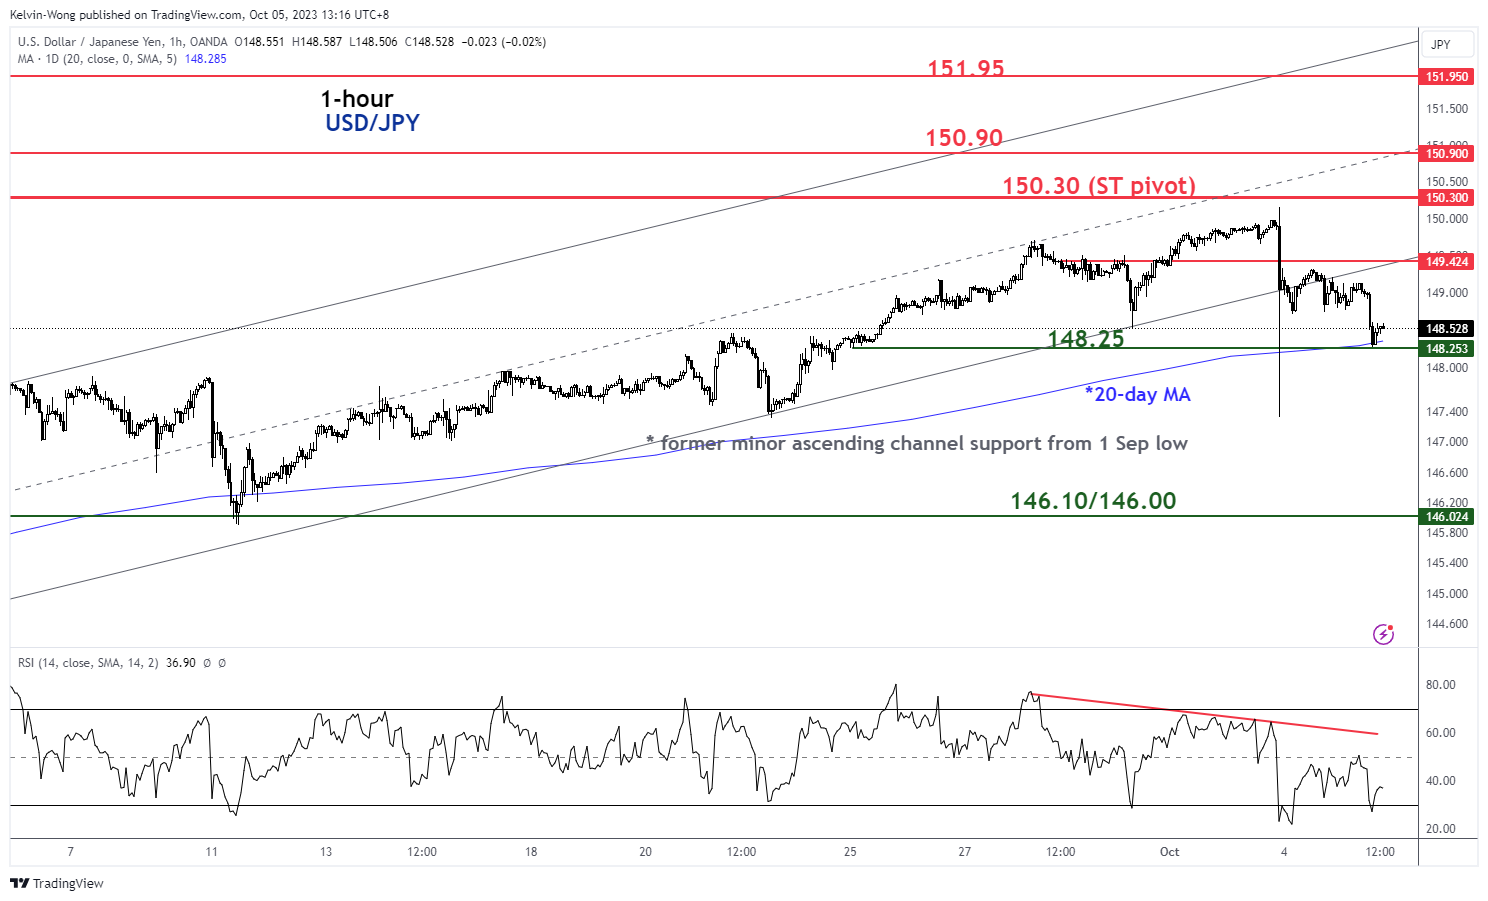
Fig 3: USD/JPY minor short-term trend as of 5 Oct 2023 (Source: TradingView, click to enlarge chart)
The bulls of the USD/JPY have managed to hold the defence line at the upward-sloping 20-day moving during Tuesday’s suspected BoJ’s intervention. The price actions of the USD/JPY have been trading at and above the 20-day moving average since 28 July 2023.
The 20-day moving average is now acting as support at around 148.25 where price actions retested it again in today’s Asian morning session and staged a minor bounce of 29 pips at this time of the writing.
However, other short-term technical elements have turned bearish where the price actions of the USD/JPY have staged a bearish breakdown from the lower boundary of its minor ascending channel from 1 September low now acting as a near-term pull-back resistance at 149.40.
Watch the 150.30 pivotal resistance and a breakdown below 148.25 may trigger the start of a potential short-term downtrend phase to expose the next support at 146.10/146.00 in the first step.
However, a clearance above 150.30 invalidates the bearish tone for a squeeze up towards the next major resistances of 150.90 and 151.95 (21 Oct 2022 swing high).