Sample Category Title
CADJPY Wave Analysis
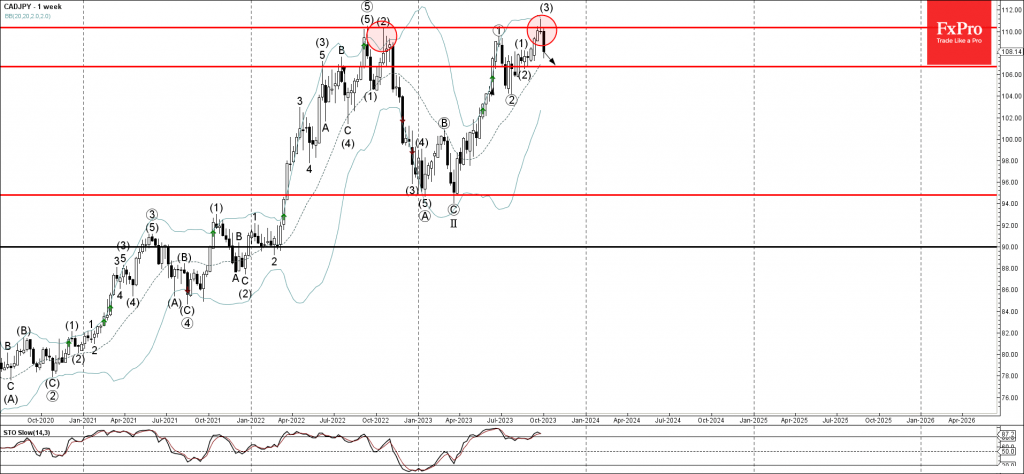
- CADJPY reversed from powerful resistance level 110.35
- Likely to fall to support level 106.7
CADJPY currency pair recently reversed down from the powerful resistance level 110.35 (which stopped the previous weekly uptrend in 2022) standing near the upper weekly daily Bollinger Band.
The downward reversal from the resistance level 110.35 is currently forming the weekly Evening Star – strong sell signal for this currency pair.
Given the bearish divergence one the weekly Stochastic, CADJPY currency pair can be expected to fall further toward the next support level 106.7.
Stocks and Oil Prices Not Seeing Typical Calm Before NFP Friday
Stocks are slightly lower as calm emerges in the bond market. Wall Street is still seeing a lot of strength in the labor market. The S&P 500 index turned negative after slightly lower-than-expected weekly jobless claims. The risk for higher rates remains as a labor market slowdown was supposed to happen before the holiday hiring season.
Positioning ahead of tomorrow’s NFP report will likely be limited given it seems most leading indicators suggest job growth will remain healthy, which should keep the bond market selloff going strong. A strong headline number will likely be expected given we only saw the ADP private payroll miss. Eventually the surging cost of capital will support a softening of the labor market, but it doesn't seem like that will be reflected in tomorrow's report.
As companies are getting ready to show their books to investors next week, in the quarterly ritual known as earnings season, traders want to know if third quarter results come in as good as the first half of the year. The banks kickoff earnings at the end of next week and it seems many are expecting the financials to highlight a much weaker consumer given surging delinquencies and exhausted excess savings. Pessimism for the consumer won't be going away anytime soon and that is probably why stocks are selling off today.
US Data
The last labor market reading before the NFP report provided another reminder that the labor market is still strong. Worker filings for unemployment benefits held steady at 205,000 in the week ending on September 30th. The UAW strikes have yet to really impact the data as Michigan saw only 1,282 claims, Ohio had 1,422, and Missouri only had 532.
The Challenger, Gray & Christmas report showed planned job cuts fell from a 266% year-over-year pace in August to 58%. Companies announced plans to fill over 590,000 jobs last month, which was up 55% from a year ago.
FX
The US dollar is softer across the board as FX traders reduce positions ahead of a key jobs report. The higher-for-longer trade has mostly been priced in for the dollar against all of its major trading partners. CFTC data shows leveraged funds have ramped up dollar futures contract bets to the best levels since June. Unless we see US job growth fall below 100,000, the king dollar trade might remain in place a little while longer.
Oil
This oil market reversal must be frustrating the Saudis. Brent crude has fallen over $10 since the end of last month as surging global bond yields have crippled the global growth outlook. Energy stocks have gone from Wall Street's best trade to it is time to abandon ship. US gasoline demand destruction is intensifying and given how overbought the energy market was in September, momentum oil selling has been fierce.
When oil prices tank, it is hard to estimate where prices could find support. Brent crude’s five-day plunge however could find support around the $83 level, which is around both the 100- and 200-day SMA. If China’s outlook continues to improve, we could easily see a return back to the $90 level. Further bearishness could also trigger further output cuts by OPEC+. OPEC+ worked hard to get oil back to $90 a barrel and they will likely continue to do whatever it takes to make sure we don’t see prices return to the lows of the year, which is around the $70 level.
Gold
Gold prices are softer after another weekly jobless claims report refused to show a labor market slowdown has arrived. Jobless claims are still at historically low levels and that will keep Fed officials sticking to the hawkish script. Wall Street is still mostly maintaining a bearish stance for equities, which should eventually lead to safe-haven flows for gold. Gold just needs the peak in rates in place but we might not have a clear picture until the release of both Friday’s US jobs report and the October 12th inflation data.
Sunset Market Commentary
Markets:
Global (interest rate) markets today were looking for direction after several high profile yield levels were touched earlier this week (3% German 10-y, 5% 30-y US yield). A softer than expected ADP job growth yesterday and a substantial correction of the oil price (brent $84/b this morning from a peak of $97+/b last week) were a good reason for investors to take a more cautious approach going into tomorrow’s key US payrolls report. However, don’t call it a correction yet. The only market relevant US data series, the weekly jobless claims at least didn’t support yesterday’s ‘correction’. Claims stayed at a very low207k. Yields briefly ticked up, but currently again trade near pre-claims levels. The belly of the US curve outperforms (5-y -5 bps). The 30-y still adds 1 bp. The German curve shows a similar pattern, with the 2-y/5-y easing about 2.5 bps but the 30-y rebounding 1 bp (was even higher earlier today). Intra-EMU 10-y spreads versus Germany stay near/at recent peak levels. The 10-y Italian spread (+4 bps revisits the 2% barrier). The tentatively more benign (or is it less negative) sentiment on bond markets slowed the equity down leg. However, with the EuroStoxx 50 ‘gaining’ 0.3% and US indices opening little changed, it’s much too early too call a risk-rebound. Sentiment and the technical picture in most major equity indices remain fragile, to say the least. For example a return of the EuroStoxx 50 above the 4200 previous range bottom for now doesn’t look that evident.
A fragile/cautious underlying risk sentiment explains ongoing USD resilience. Which currency presents itself as alternative for the reference currency carrying a 2%+ long term real yield combined with economic outperformance? At 106.75, the tradeweighted DXY easily holds within the established uptrend channel since mid-July. EUR/USD (1.0525) struggles to prevent a relapse below the 1.05 big figure. Commodity/oil related currencies especially stay in the defensive. USD/CAD intraday touched the 1.378 area, the weakest level for the loonie since March. EUR/NOK rebounds to revisit the EUR/NOK 11.60/62 resistance. AUD/USD (0.634 area) also remains within striking distance of YTD low (0.6286) touched earlier this week. The Swiss franc is looking for a ‘bottom’ after the end September correction (EUR/CHF 0.965). EUR/GBP is holding a tight range, close too, mostly slightly above 0.865. BoE deputy Governor Broadbent indicated that he sees clear signs that the economy is weakening including ‘the beginning of some rise in unemployment’. His comments suggest that the bar for additional BoE hiking is becoming ever higher.
News & Views:
The Bank of England published its Monthly Decision Maker Panel data for September today. The DMP is a survey of CFO’s at UK firms. Firms reported that their output prices rose by an average annual rate of 7.4% in the three months to September, unchanged from August. They expect output price inflation to be 4.8% a year-ahead (down from 5%). One-year ahead CPI inflation expectations increased slightly to 4.9% (up from 4.8%). Three-year ahead CPI inflation expectations remained flat at 3.2%. Current perceived CPI inflation was 7.1%, compared to an official ONS figure of 6.7%. Expected year-ahead wage growth remained unchanged at 5.1% on a three-month moving average basis, down from 6.9% realized wage growth for the three months to September this year. 51% of firms reported that the overall level of uncertainty facing their business was high or very high, marginally lower than 53% in August. Finally, they indicated that the average interest rate that they were paying on their borrowing was 6.6% (from 6.2%) with a year-ahead expectation of 6.3%. Overall, the DMP survey suggests that the BoE better continues to keep a close eye on price (expectations) before calling victory too early.
The WTO lowers its trade growth forecast for this year amid a global manufacturing slowdown. Projections have been scaled back amid a continued slump that began in Q4 2022. The effects of persistent inflation and tighter monetary policy, togethers with strained property markets in China and consequences of the war in Ukraine all cast their shadow. The volume of world merchandise trade is now expected to grow by 0.8% this year (vs 1.7% forecast in April). The 3.3% growth estimate for 2024 remains nearly unchanged.
BTCUSD Gets Capped by 200-day SMA
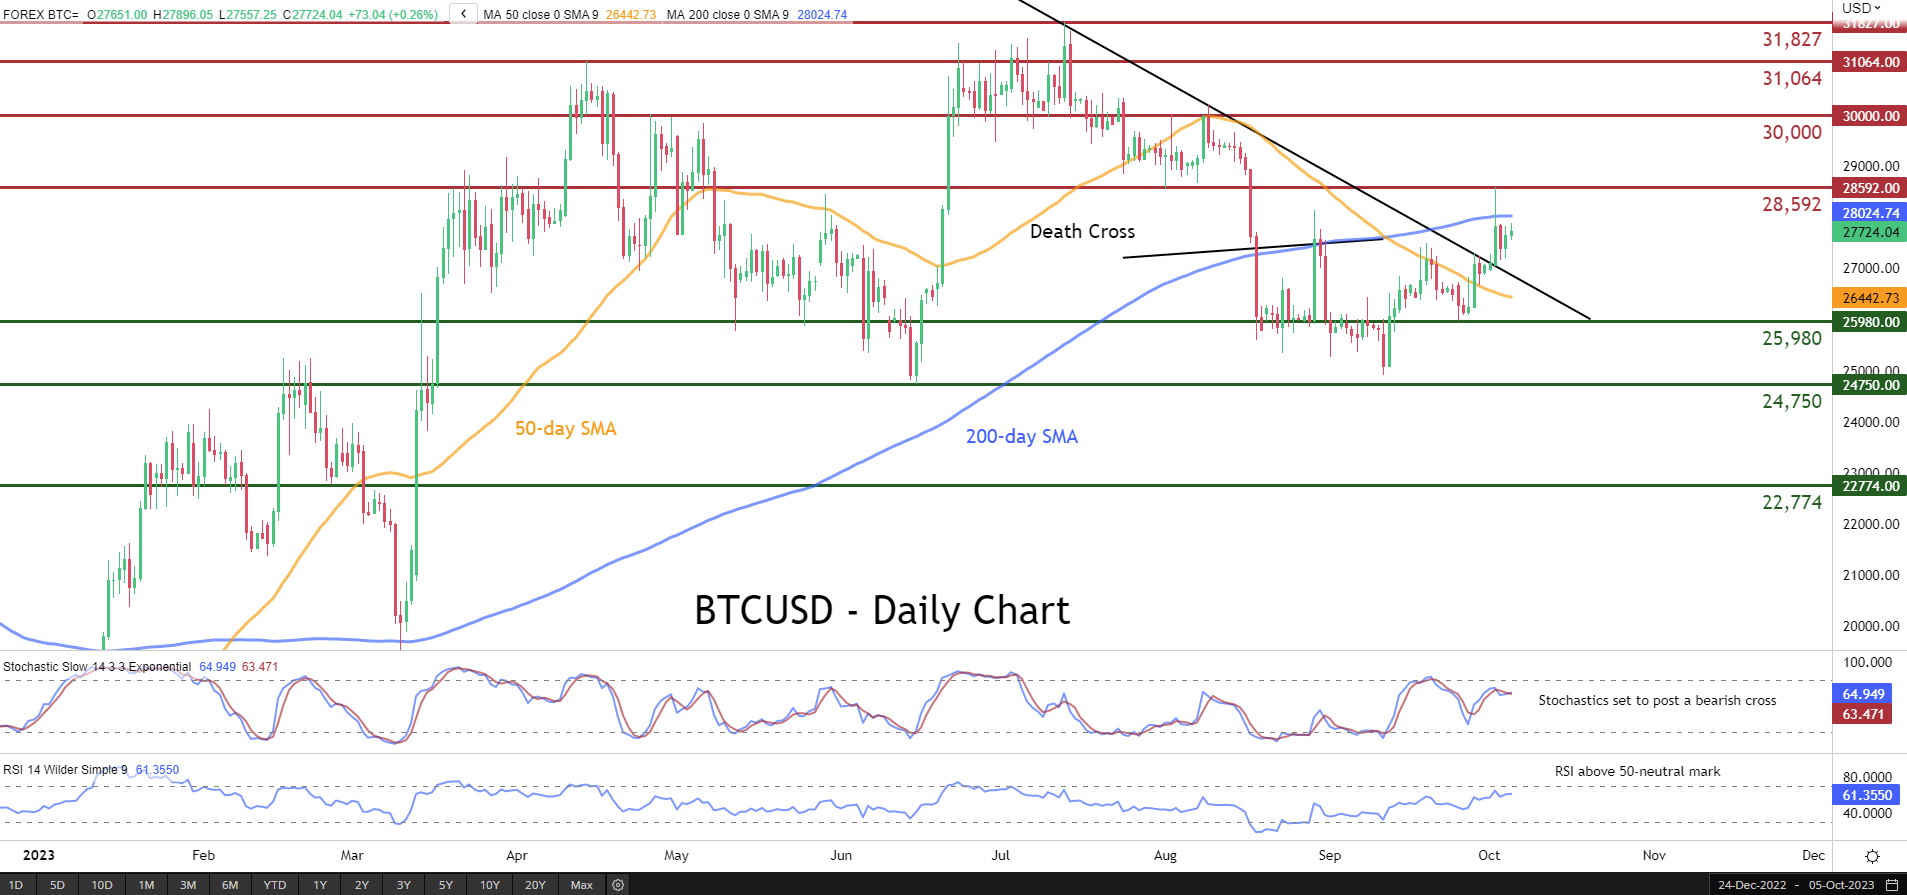
- Bitcoin in a steady advance, jumping above crucial descending trendline
- Despite the jump above 28,000, 200-day seems a tough obstacle
- Death cross points to losses but momentum indicators diverge
BTCUSD (Bitcoin) has been forming a structure of higher highs and higher lows since its bounce off the September bottom of 24,915. Interestingly, the completion of a bearish cross between the 50- and 200-day simple moving averages (SMAs) has failed to trigger a decline.
If buying interest intensifies, the king of cryptos could initially attempt to break above the 200-day SMA before it tests the recent rejection region of 28,592. Even higher, the crucial 30,000 psychological mark could prove to be a tough one for the price to overcome. A jump above that zone may pave the way for the April peak of 31,064.
On the flipside, should the price reverse lower, the recent support of 25,980 could act as the first line of defence. Piercing through that floor, the digital coin might then descend towards the June bottom of 24,750. Further retreats could then come to a halt at 22,774, which has acted both as support and resistance in the past few months.
Overall, BTCUSD seems to be extending its recent upside move amid diverging technical signals. Nevertheless, a break below the downward sloping trendline could be the starting point of a fresh downleg.
Canada’s Trade Accounts Flip to a Surplus In August
Canada's merchandise trade account registered a $718 million surplus in August after three consecutive months of deficits. This comes after July's deficit was revised upward to $437 million.
Exports increased by a healthy 5.7% month-on-month (m/m) in August. Gains were broad-based as 7 of 11 sectors posted increases, with exports of unwrought gold and crude oil doing most of the heavy lifting. Exports of unwrought gold, silver, and platinum metals (+89.5% m/m) were driven by higher exports to the U.S. Due to rising oil prices, crude oil exports rose 19% m/m. As port activity resumed from the B.C. strikes, strong gains in coal (+14.2%), potash (+21.4%), and lumber (+5.8%) were observed.
Meanwhile, total imports bounced back from a weak July, up 3.8% m/m to $63.8 billion. Increases in import activity were driven by many sectors: Industrial machinery and equipment imports rose by 7.5% m/m, imports of chemical products were up 11.2%, and metal ores and non-metallic minerals gained 13.6% m/m. Aircraft equipment and parts imports lagged other sectors (-15.9% m/m). Once again, imports were helped by the port strike resumption, with consumer goods imports edging up 2.2% and electronic equipment and parts gaining 3.7%. Imports were up in 9 of 11 sectors.
In volume terms, overall imports increase by 1.2% m/m while exports moved up by 3.0% m/m in August.
Canada's trade surplus with the United States widened from $8.2 billion in July to $10.4 billion in August, driven by higher exports of energy products.
In a separate report, Statistics Canada noted the country's services trade deficit widened from $1.2 billion in July to $1.5 billion in August.
Key Implications
August's trade data provided further evidence that net exports bounced back in the third quarter of this year. Recall that last quarter, export volumes were effectively flat after a strong Q1 showing, while imports edged higher, leading to a net drag on growth through the trade channel. As it stands, given trade data through July and August, we should see a sizable net contribution to Canada's third quarter GDP.
Last month's trade report cited that the effect of backlogs have affected trade activity. But given the healthy activity in trade this month, especially out of sectors most impacted by the strike, we'd say that the impact from the strike has largely dissipated. The broad-based improvement in imports and exports suggest some resilience in domestic and international demand with key trading partners.
Pound Shrugs Off Soft Construction PMI
- UK Construction PMI declines
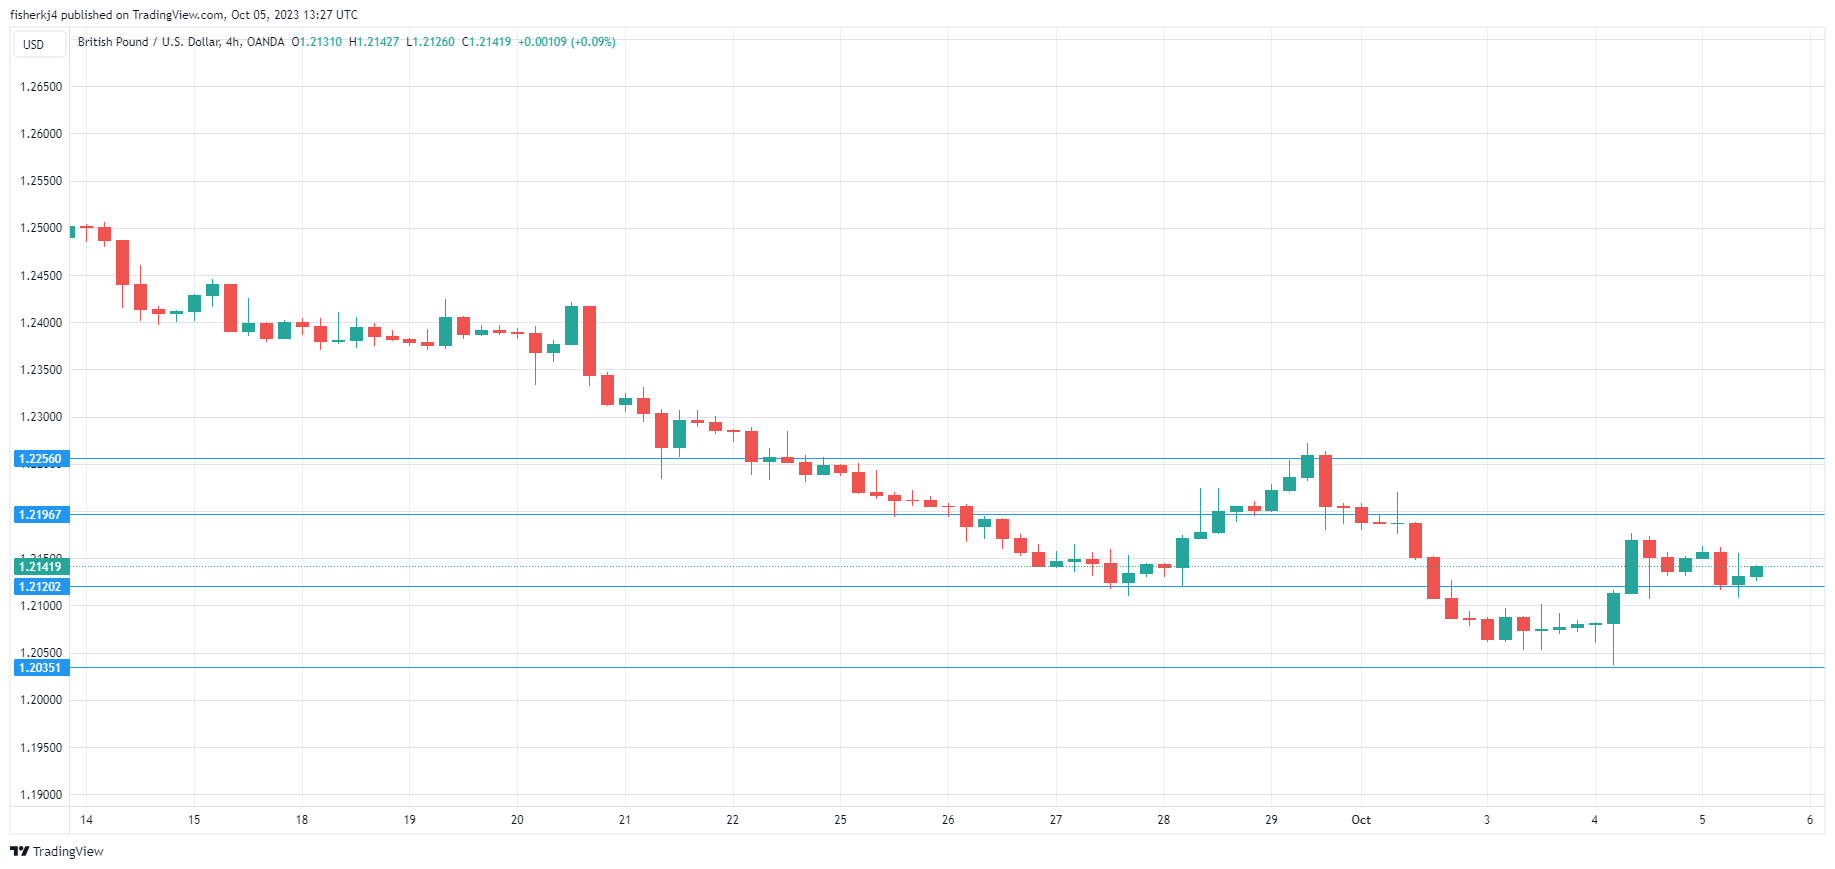
The British pound has ticked higher on Thursday. In the North American session, GBP/USD is trading at 1.2149, up 0.09%.
UK Construction PMI declines
The UK Construction PMI fell to 45.0 in September, down significantly from 50.8 in August and below the consensus estimate of 49.9. This was the first decline in three months and the steepest decline since May 2020. The survey found that high mortgage rates and weak demand for house purchases had a negative impact on the construction industry. As well, business expectations fell to their lowest level this year.
The Construction PMI release is further evidence that the Bank of England’s sharp tightening cycle has cooled down the economy. This week’s Services and Manufacturing PMIs both pointed to contraction in September, with readings below the 50 level. The British pound didn’t react to the Construction PMI release, but the pound continues to fall toward the symbolic 1.20 line and the currency will likely face further headwinds if upcoming releases remain soft.
As inflation continues to ease, many major central banks are close to or at the end of their rate-tightening cycle. The Federal Reserve, Bank of England and the ECB were all late to the rate-hike party and don’t want to prematurely declare that rate hikes are over. Inflation remains well above target for all three central banks and stating that rate hikes remain on the table means that policy makers can raise rates if needed without losing credibility.
The BoE paused in September and another hike at the November meeting is a strong possibility, barring a nasty inflation surprise ahead of the meeting. The BoE, which still has its hands full with inflation, says that rate cuts remain a long way off, but that could change if economic growth continues to weaken and inflation falls sharply.
GBP/USD Technical
- GBP/USD tested support earlier at 1.2120. The next support level is 1.2035
- There is resistance at 1.2196 and 1.2256
EUR/USD Mid-Day Outlook
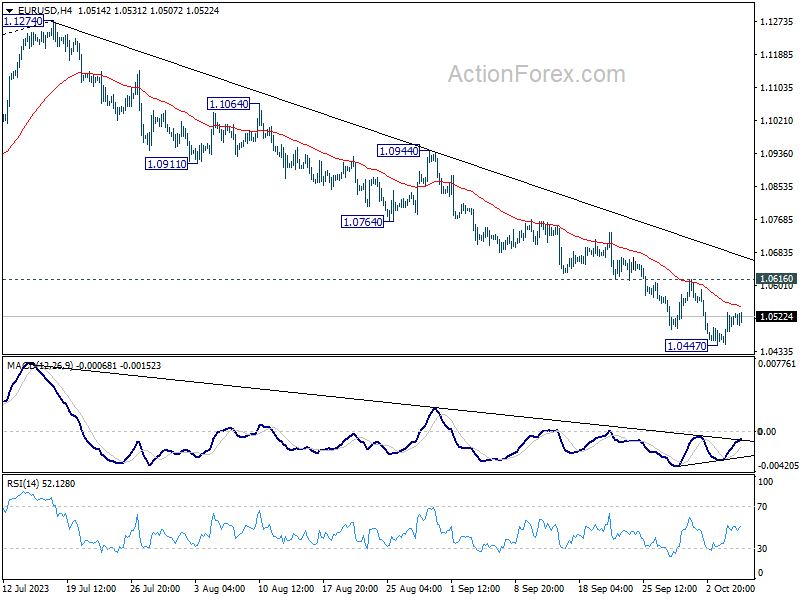
Daily Pivots: (S1) 1.0460; (P) 1.0496; (R1) 1.0540; More...
Intraday bias in EUR/USD stays neutral for the moment. Consolidation continues above 1.0447. Outlook will remain bearish as long as 1.0616 resistance holds. Break of 1.0477 will resume the fall from 1.1274 to 1.0199 fibonacci level next. Nevertheless, firm break of 1.06161 will confirm short term bottoming, and turn bias back to the upside for stronger rebound.
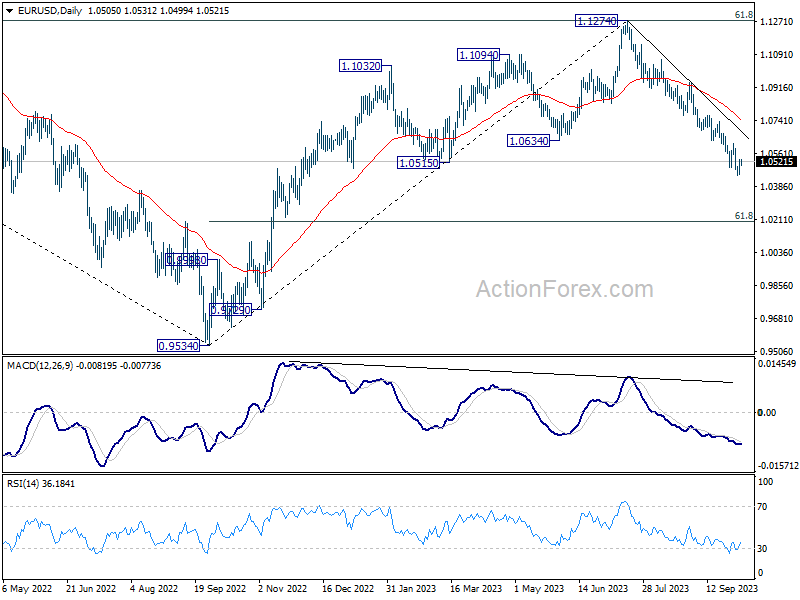
In the bigger picture, fall from 1.1274 medium term top could still be a correction to rise from 0.9534 (2022 low). But chance of a complete trend reversal is rising. In either case, current fall should target 61.8% retracement of 0.9534 to 1.1274 at 1.0199 next. For now, risk will stay on the downside as long as 55 D EMA (now at 1.0759) holds, in case of rebound.
USD/CHF Mid-Day Outlook
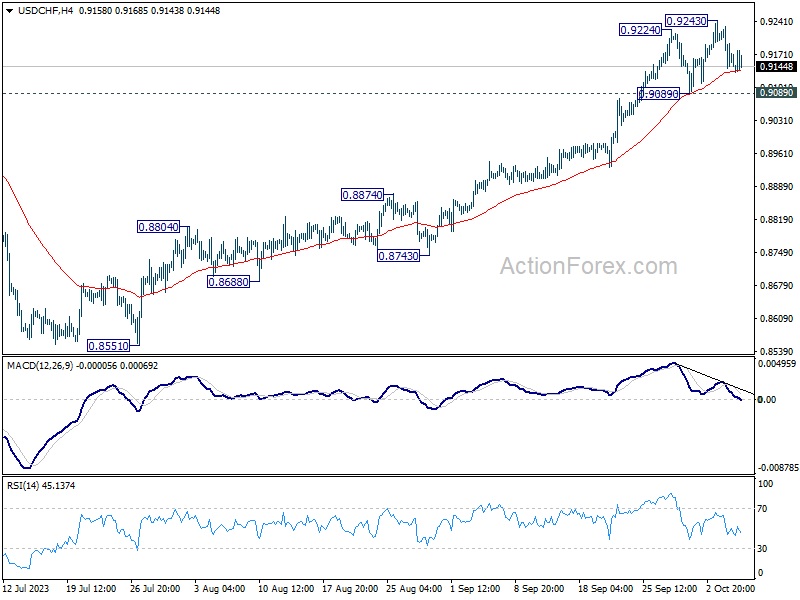
Daily Pivots: (S1) 0.9134; (P) 0.9183; (R1) 0.9223; More....
Intraday bias in USD/CHF stays neutral at this point. Consolidation is continuing below 0.9243. Near term outlook will stay bullish as long as 0.9089 support holds. On the upside, break of 0.9243 will resume the rally from 0.8551 and target 0.9439 resistance next. However, firm break of 0.9089 will confirm short term topping, and turn bias back to the downside for deeper pull back.
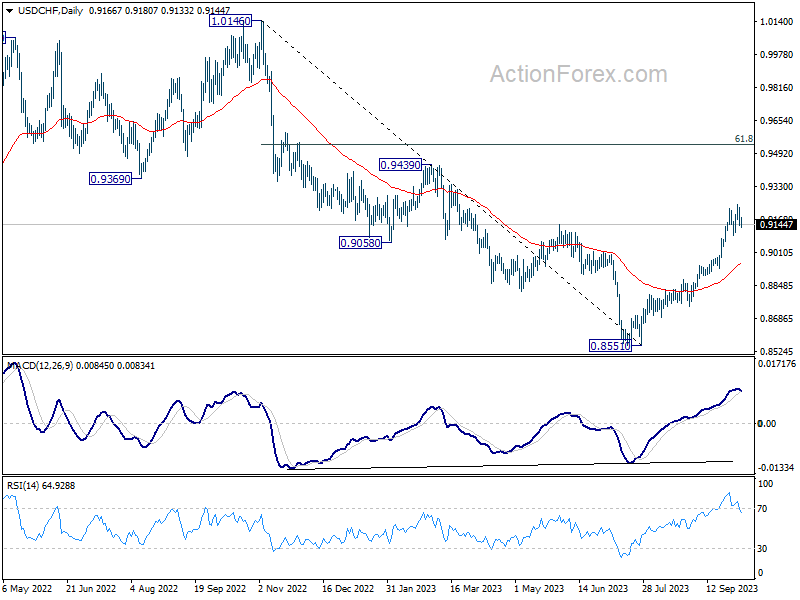
In the bigger picture, current development indicates that rise from 0.8551 is reversing whole down trend from 1.0146. Further rally would then be seen to 61.8% retracement at 0.9537 and above. For now, this will be the favored case as long as 55 D EMA (now at 0.8942) holds, even in case of deep pullback.
USD/JPY Mid-Day Outlook
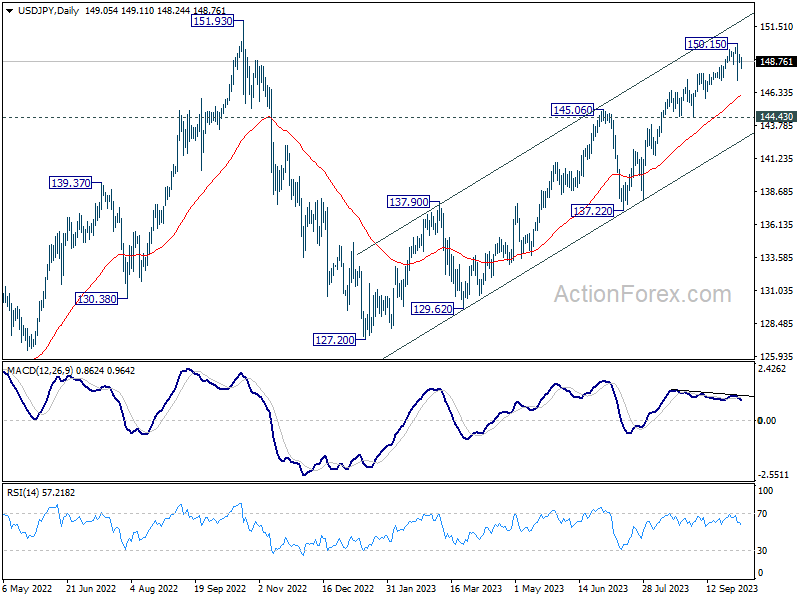
Daily Pivots: (S1) 148.81; (P) 149.06; (R1) 149.39; More...
Intraday bias in USD/JPY stays neutral at this point. Sideway trading could continue below 150.15. On the downside, below 147.28 will turn bias to the downside for deeper pull back. But there is no confirmation of bearish trend reversal before firm break of 144.43 support. Another rally remains mildly in favor through 150.15 to retest 151.93 high.
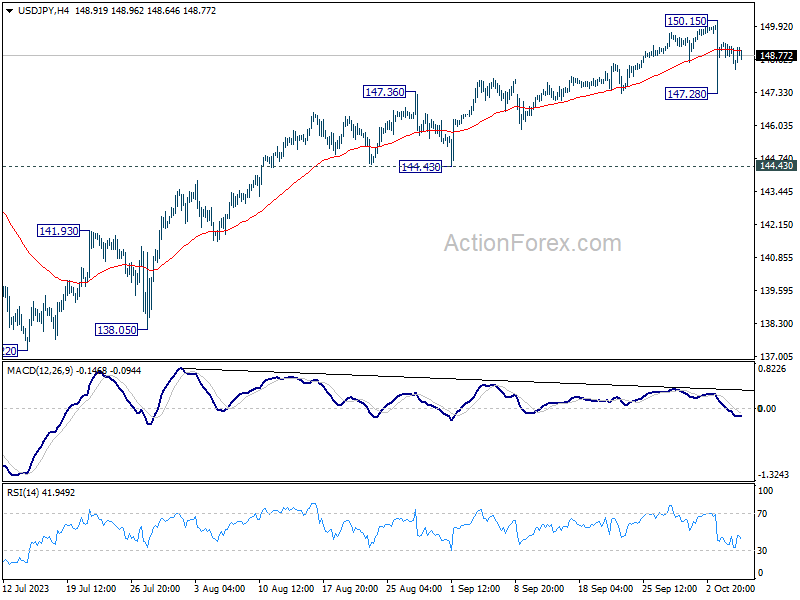
In the bigger picture, while rise from 127.20 is strong, it could still be seen as the second leg of the corrective pattern from 151.93 (2022 high). Rejection by 151.93, followed by sustained break of 145.06 resistance turned support will be the first sign that the third leg of the pattern has started. However, sustained break of 151.93 will confirm resumption of long term up trend.