

Sample Category Title
Why You Should Expect a Once-in-a-Lifetime Debt Crisis
On a national level, a debt crisis occurs when a country is unable to pay back its government debt. This might result from government spending exceeding tax revenues for an extended period.
On an individual level, a crisis can result from too little income and too much debt -- that simple. This sometimes means defaulting on a car loan, for example, or even declaring bankruptcy.
Part 1 of the June Elliott Wave Theorist, a publication which covers major financial and cultural trends, said:
A debt crisis is brewing, and higher long term interest rates will add to the pressure.
Indeed, as Kiplinger noted on Aug. 18:
Credit Card Use Spikes for Cash-Strapped Consumers
Credit card use amps up as consumers reckon with inflation and higher interest rates; 39% of Americans living paycheck-to-paycheck, study shows.
The August Elliott Wave Theorist had more to say about the looming debt crisis as it showed these side-by-side charts:

Excess savings US households built up during the pandemic are nearly gone. ...
At the same time, consumers are borrowing to stay alive, driving indebtedness to yet another milestone: Total credit card debt in the U.S. has just surpassed $1 trillion. Will consumers be able to pay it off?
They had better do it fast, because credit-card interest rates have just soared to a new all-time high above 20%!
And bond yields (and interest rates) continue to climb (Reuters, Sept. 21):
TREASURIES-Two-year yields hit 17-year highs ...
Elliott Wave International warned subscribers to prepare back in 2020 when interest rates were near zero.
Of course, a lot of people are wondering if rates are headed even higher.
Remember, it's the market which determines the direction of interest rates; the Fed merely follows.
A key way to keep tabs on widely traded financial markets is to employ the Elliott wave method.
If you'd like to delve into the details of Elliott wave analysis, read Frost & Prechter's book, Elliott Wave Principle: Key to Market Behavior. Here's a quote from this Wall Street classic:
"When you have eliminated the impossible, whatever remains, however improbable, must be the truth." Thus eloquently spoke Sherlock Holmes to his constant companion, Dr. Watson, in Arthur Conan Doyle's The Sign of Four. This advice is a capsule summary of what you need to know to be successful with Elliott. The best approach is deductive reasoning. By knowing what Elliott rules will not allow, you can deduce that whatever remains is the proper perspective, no matter how improbable it may seem otherwise. By applying all the rules of extensions, alternation, overlapping, channeling, volume and the rest, you have a much more formidable arsenal than you might imagine at first glance. Unfortunately for many, the approach requires thought and work and rarely provides a mechanical signal. However, this kind of thinking, basically an elimination process, squeezes the best out of what Elliott has to offer and besides, it's fun! We sincerely urge you to give it a try.
Club EWI members get free access to the entire online version of Elliott Wave Principle: Key to Market Behavior.
Club EWI is the world's largest Elliott wave educational community and is free to join. Besides the book, members also enjoy complimentary access to a wealth of other Elliott wave resources on investing and trading.
Get started now by following this link: Elliott Wave Principle: Key to Market Behavior -- free and instant access for Club EWI members.
This article was syndicated by Elliott Wave International and was originally published under the headline Why You Should Expect a Once-in-a-Lifetime Debt Crisis. EWI is the world's largest market forecasting firm. Its staff of full-time analysts led by Chartered Market Technician Robert Prechter provides 24-hour-a-day market analysis to institutional and private investors around the world.
USD/CAD Daily Outlook
Daily Pivots: (S1) 1.3678; (P) 1.3731; (R1) 1.3759; More....
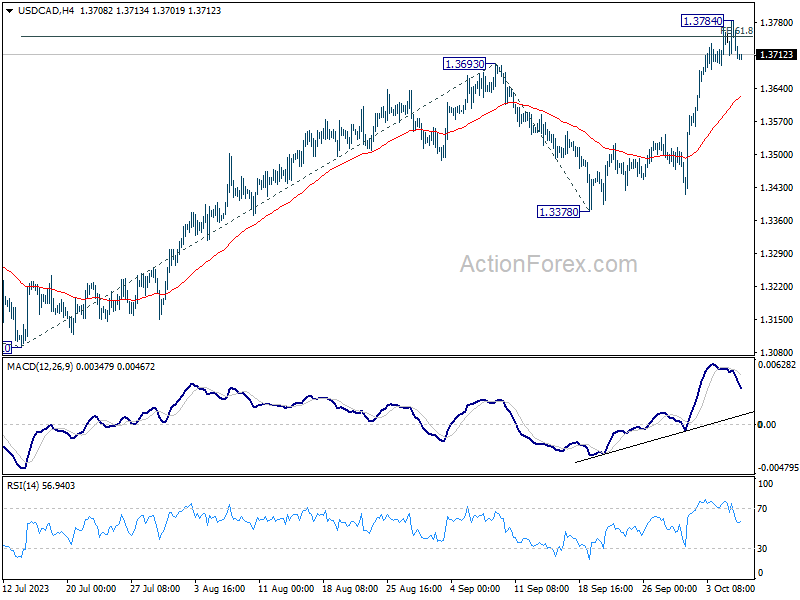
Despite edging higher to 1.3784, USD/CAD quickly retreated back into established range. Intraday bias remains neutral and some more consolidations could be seen. While deeper pull back cannot be ruled out, outlook will stay bullish as long as 1.3378 support holds. Above 1.3778 will resume the rally from 1.3091 and target 100% projection of 1.3091 to 1.3693 from 1.3378 at 1.3980.
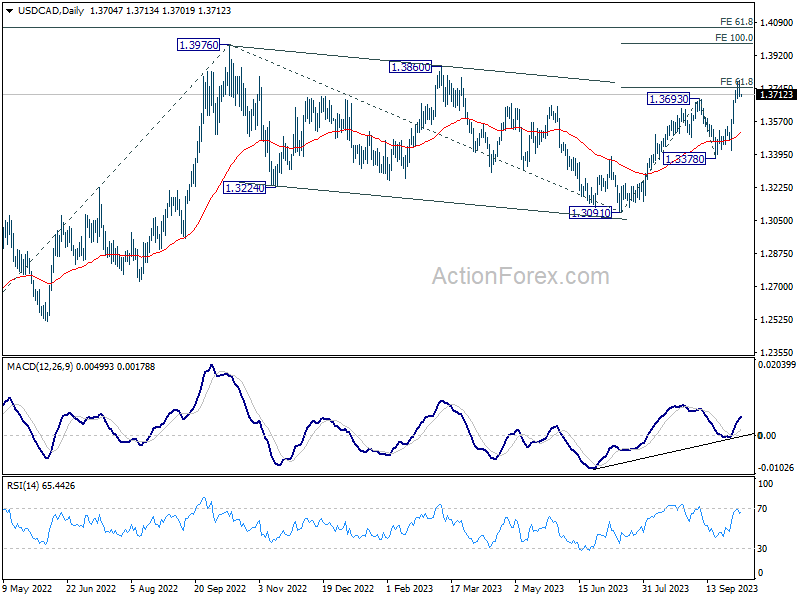
In the bigger picture, current development revives the case that corrective pattern from 1.3976 (2022 high) has completed with three waves down to 1.3091. Decisive break of 1.3976 high will confirm resumption of up trend from 1.2005 (2021 low). Next target will be 61.8% projection of 1.2401 to 1.3976 from 1.3091 at 1.4064. This will now remain the favored case as long as 1.3378 support holds.
Dollar Holds Ground Despite Pullback, Eyes NFP for Fresh Momentum
Dollar, despite retracting some of its earlier gains, remains robust, demonstrating resilience as one of the week's frontrunners. At the same time Yen and, to a lesser extent, Swiss Franc is showing strength too, underscoring the markets' cautious stance. Meanwhile, commodity currencies are languishing at the lower echelons, with New Zealand Dollar marginally outperforming its Australian and Canadian counterparts. The developments align with this week's risk-averse sentiment underscored by the decline in stocks, gold, and oil prices amid a spike in treasury yields.
Today, all eyes are fixed on US non-farm payroll data. This crucial economic indicator, along with next week's CPI, is expected to significantly influence Fed's assessment on the necessity of an additional rate hike. The influence of this data on the markets can be multifaceted. Still, in a scenario where job data outperforms expectations, we may see the strengthening of the case for sustained high interest rates—a development likely to exert pressure on stocks but provide impetus for the greenback.
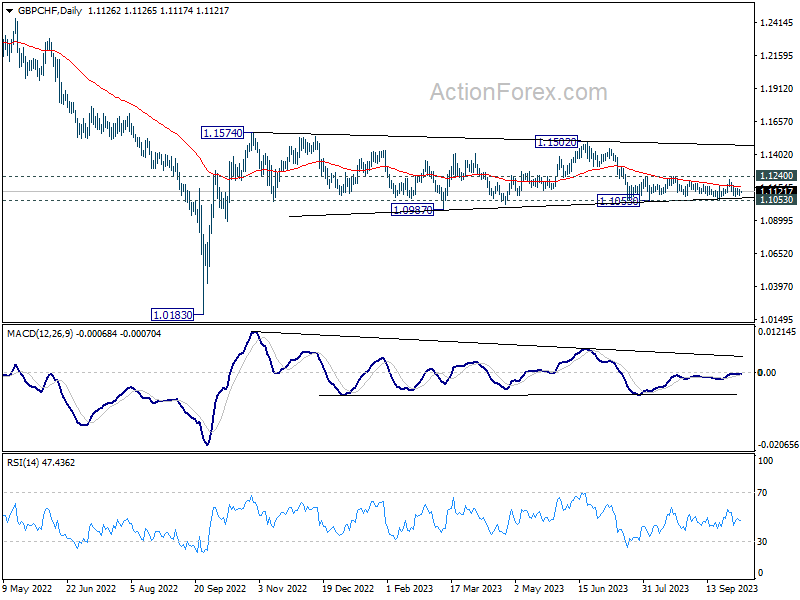
On the technical front, European majors continue to oscillate within a defined range against each other, yet there's a burgeoning interest in Swiss Franc's potential to capitalize on the amplifying risk aversion and break free from these ranges. In the context of GBP/CHF, the pair has been confined above 1.1053 since the onset of August, with a bearish inclination underscored by the ceiling imposed by 55 D EMA. Break of 1.1053 support would suggest resurgence of the descent from 1.1502. Additionally, decisive break below 0.9617 minor support in EUR/CHF could corroborate this trend. These dynamics, in conjunction with Dollar pairings, are worth monitoring before the weekly close.
In Asia, at the time of writing, Nikkei is up 0.04%. Hong Kong HSI is up 1.81%. Singapore Strait Times is up 0.45%. 10-year JGB yield is down -0.002 at 0.803. Overnight, DOW dropped -0.03%. S&P 500 dropped -0.13%. NASDAQ dropped -0.12%. fell -0.018 to 4.717.
US markets in anticipation: Non-Farm Payrolls to dictate direction
The global financial community is poised at the edge, eagerly awaiting US non-farm payroll data due today. This palpable sense of anticipation is evident as DOW is ensnared in sideways motion after crossing the crucial 33,000 psychological mark. Additionally, Dollar Index is retracing steps after touching its highest level in almost a year, and 10-year Treasury yield is cooling off from its pinnacle since 2007.
The upcoming data's multifaceted nature, covering job growth, unemployment rates, and wage growth, complicates the prediction of market reactions. If these metrics present a disjointed picture, deciphering the market's response becomes even trickier. Robust employment figures could potentially reinforce the prospect of an additional Fed rate hike before year's end. However, a spike in Treasury yields, a byproduct of strong data, could, paradoxically, reduce the necessity for another move due to tightened financial conditions. Nevertheless, both scenarios would likely dampen stocks, and in a climate of risk aversion, bolster Dollar.
Today's market expectations hinge on a 168k increase in headline non-farm payrolls growth for September, with an anticipated decline in the unemployment rate from 3.8% to 3.7%. Predictions also point towards a 0.3% mom rise in average hourly earnings, keeping the annual rate steady at 4.3% yoy.
However, other employment-related metrics present a mixed picture, notably the disappointing 89k growth shown by ADP private employment. On the brighter side, ISM Manufacturing employment index showed improvement 48.5 to 51.2, even as its services counterpart registered a dip from 54.7 to 53.4. The four-week average of initial jobless claims also saw a decrease from 229k to 209k.
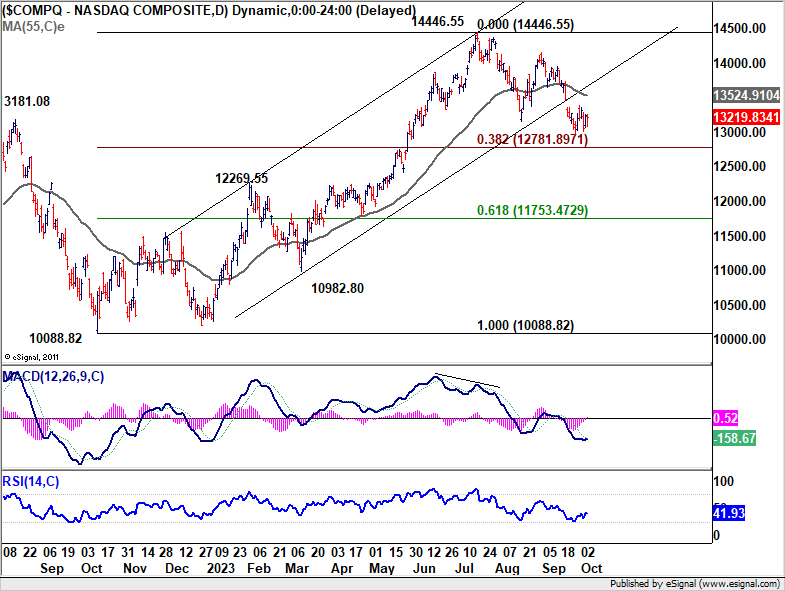
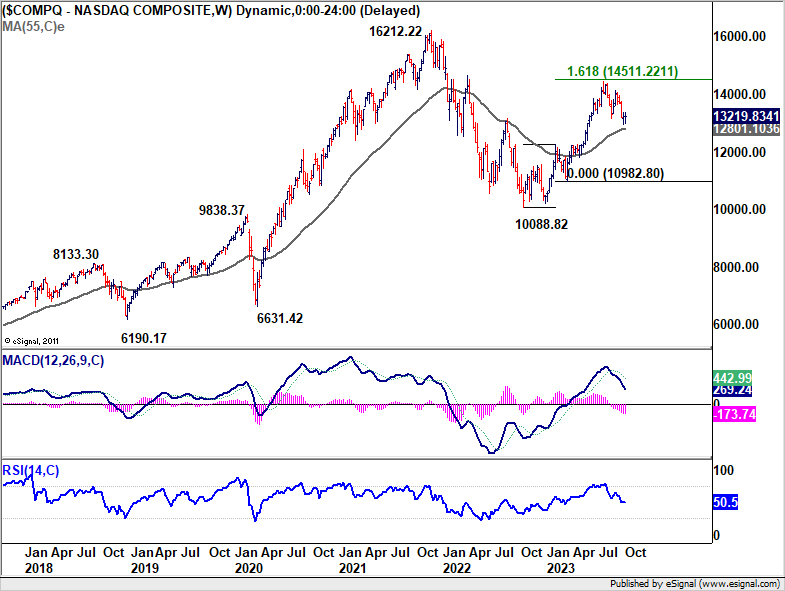
Technically, NASDAQ has been in range trading since falling to 12963.16 late last month. Sustained break of 38.2% retracement of 10088.82 to 14446.55 at 12781.89 will strengthen the case that rise from 10088.82 has completed. That would also mean that the long term pattern from 16212.22 has already started third leg. Deeper fall would be seen to 61.8% retracement at 11753.47 next in the near term.
Nevertheless, strong rebound from current level, followed by sustained break of 55 D EMA (now at 13524.91) would argue that rise from 10088.82 is still intact. Another rally through 14446.55 would likely be seen before NASDAQ tops.
Japanese wages growth underwhelm as real income sinks for 17th mth
Subdued wage growth data in Japan is raising eyebrows, particularly at BoJ. An essential element for the central bank's policy normalization is the establishment of a harmonious cycle between wage growth and prices. The recent figures, however, indicate that this equilibrium remains elusive.
In August, labor cash earnings in Japan rose by a meager 1.1% yoy. This increase, while consistent with the prior month, fell short of the anticipated 1.5% growth. Furthermore, base salary growth, although increasing to 1.6% yoy from the preceding month's 1.4%, has yet to manifest signals of a robust and sustainable upward momentum.
The bright spot, perhaps, is the increase in overtime pay, which is often used as an indicator of business vibrancy, as 1.0% yoy ascent was observed, rebounding from July's flat growth.
However, inflation-adjusted real wages continued their downward spiral for the 17th consecutive month. August's real wages declined by -2.5% yoy, surpassing the projected -2.1% yoy dip. This trend starkly reveals that despite any increments, wages are struggling to keep up with the consistent price surges, placing added strain on the average consumer's pocket.
Also released, household spending, a critical driver of economic activity, contracted by -2.5% yoy, a figure that, while better than the anticipated -4.3% yoy decline and an improvement from July's -5.0% yoy reduction, still underscores constrained consumer expenditure.
Fed's Barkin links yield surge to robust data, abundant supply
Richmond Fed President Thomas Barkin expressed a cautious stance yesterday, indicating it's "too early to know if another rate increase would be needed this year."
He further elaborated on the need for a wait-and-see approach, suggesting, "We have time to see if we've done enough or whether there's more work to do."
"The path forward depends on whether we can convince ourselves inflationary pressures are behind us or whether we see them persistent." Alongside inflation, Barkin pinpointed the labor market as a pivotal area of focus.
Addressing the recent surge in Treasury yields, Barkin attributed it to an abundant fiscal issuance, indicating, "There's a lot of fiscal issuance out there. That's creating a lot of supply." He also acknowledged the role of recent strong economic data in pushing the yields higher.
Fed's Daly points to rising yields and diminishing need for rate hike
San Francisco Fed President Mary Daly weighed in on the implications of the recent spike in the benchmark 10-year Treasury note yield, which marked a 16-year peak at 4.8%.
"If financial conditions... remain tight, the need for us to take further action is diminished," she said yesterday, adding that the role of the financial markets in this scenario, suggesting that "they've done the work."
On the market's response to rising bond yields, she observed a dip in probabilities for another hike at the upcoming November meeting. "To me, that says the markets are understanding how we think about things and they do have the reaction function in mind," she elaborated.
Daly reiterated that continual observation of economic indicators, specifically a "cooling labor market" and inflation gravitating towards target, could justify steadiness in interest rates.
She elaborated that maintaining rates isn't a passive stance but an "active policy action," especially as declining inflation augments the restrictive impact of existing policy measures.
However, she also emphasized adaptability, hinting that should economic indicators such as growth and inflation not decelerate as expected, or if financial conditions become overly relaxed, Fed is prepared to raise rates until monetary policy achieves its desired restrictiveness. "We need to keep an open mind, and have optionality," she underscored.
ECB's Villeroy points to plateau in rates; dismisses need for rate hike
ECB Governing Council member Francois Villeroy de Galhau, in an interview with the German newspaper Handelsblatt published yesterday, weighed in on the current debate surrounding ECB's interest rates. Stating his view clearly, Villeroy remarked, "Today, I think there's no justification for an additional increase in the ECB rates."
Rather than focusing on the peak in rates, Villeroy believes the dialogue should shift towards the concept of a rate "plateau." In his words, "we'll remain on this plateau as long as necessary."
Villeroy also provided reassurance regarding the economic outlook of the Eurozone. Contrary to the hard landing fears that loomed last winter, he noted, "We are not facing the worst-case scenario." Elaborating further, he added, "I believe our monetary policy can and should now aim for a soft landing for the euro zone: We'll exit inflation, and we'll probably do so without a recession."
Commenting on the broader market sentiments, Villeroy observed that expectations, both in Europe and US, have historically been "a little too optimistic regarding a future rate cut."
Elsewhere
Swiss unemployment rate and foreign currency reserves, Germany factory orders, France trade balance and Italy retail sales will be released in European session. Later in the day, Canada will also publish employment data.
USD/CAD Daily Outlook
Daily Pivots: (S1) 1.3678; (P) 1.3731; (R1) 1.3759; More....
Despite edging higher to 1.3784, USD/CAD quickly retreated back into established range. Intraday bias remains neutral and some more consolidations could be seen. While deeper pull back cannot be ruled out, outlook will stay bullish as long as 1.3378 support holds. Above 1.3778 will resume the rally from 1.3091 and target 100% projection of 1.3091 to 1.3693 from 1.3378 at 1.3980.
In the bigger picture, current development revives the case that corrective pattern from 1.3976 (2022 high) has completed with three waves down to 1.3091. Decisive break of 1.3976 high will confirm resumption of up trend from 1.2005 (2021 low). Next target will be 61.8% projection of 1.2401 to 1.3976 from 1.3091 at 1.4064. This will now remain the favored case as long as 1.3378 support holds.
Economic Indicators Update
| GMT | Ccy | Events | Actual | Forecast | Previous | Revised |
|---|---|---|---|---|---|---|
| 23:30 | JPY | Labor Cash Earnings Y/Y Aug | 1.10% | 1.50% | 1.30% | 1.10% |
| 23:30 | JPY | Overall Household Spending Y/Y Aug | -2.50% | -4.30% | -5.00% | |
| 05:00 | JPY | Leading Economic Index Aug P | 109 | 108.2 | ||
| 05:45 | CHF | Unemployment Rate Sep | 2.10% | 2.10% | ||
| 06:00 | EUR | Germany Factory Orders M/M Aug | 1.50% | -11.70% | ||
| 06:45 | EUR | France Trade Balance (EUR) Aug | -8.9B | -8.1B | ||
| 07:00 | CHF | Foreign Currency Reserves (CHF) Sep | 694B | |||
| 08:00 | EUR | Italy Retail Sales M/M Aug | 0.00% | 0.40% | ||
| 12:30 | USD | Nonfarm Payrolls Sep | 168K | 187K | ||
| 12:30 | USD | Unemployment Rate Sep | 3.70% | 3.80% | ||
| 12:30 | USD | Average Hourly Earnings M/M Sep | 0.30% | 0.20% | ||
| 12:30 | CAD | Net Change in Employment Sep | 28.0K | 39.9K | ||
| 12:30 | CAD | Unemployment Rate Sep | 5.60% | 5.50% |
US markets in anticipation: Non-Farm Payrolls to dictate direction
The global financial community is poised at the edge, eagerly awaiting US non-farm payroll data due today. This palpable sense of anticipation is evident as Dow is ensnared in sideways motion after crossing the crucial 33,000 psychological mark. Additionally, Dollar Index is retracing steps after touching its highest level in almost a year, and 10-year Treasury yield is cooling off from its pinnacle since 2007.
The upcoming data's multifaceted nature, covering job growth, unemployment rates, and wage growth, complicates the prediction of market reactions. If these metrics present a disjointed picture, deciphering the market's response becomes even trickier. Robust employment figures could potentially reinforce the prospect of an additional Fed rate hike before year's end. However, a spike in Treasury yields, a byproduct of strong data, could, paradoxically, reduce the necessity for another move due to tightened financial conditions. Nevertheless, both scenarios would likely dampen stocks, and in a climate of risk aversion, bolster Dollar.
Today's market expectations hinge on a 168k increase in headline non-farm payrolls growth for September, with an anticipated decline in the unemployment rate from 3.8% to 3.7%. Predictions also point towards a 0.3% mom rise in average hourly earnings, keeping the annual rate steady at 4.3% yoy.
However, other employment-related metrics present a mixed picture, notably the disappointing 89k growth shown by ADP private employment. On the brighter side, ISM Manufacturing employment index showed improvement 48.5 to 51.2, even as its services counterpart registered a dip from 54.7 to 53.4. The four-week average of initial jobless claims also saw a decrease from 229k to 209k.
Technically, NASDAQ has been in range trading since falling to 12963.16 late last month. Sustained break of 38.2% retracement of 10088.82 to 14446.55 at 12781.89 will strengthen the case that rise from 10088.82 has completed. That would also mean that the long term pattern from 16212.22 has already started third leg. Deeper fall would be seen to 61.8% retracement at 11753.47 next in the near term.
Nevertheless, strong rebound from current level, followed by sustained break of 55 D EMA (now at 13524.91) would argue that rise from 10088.82 is still intact. Another rally through 14446.55 would likely be seen before NASDAQ tops.
Technical Outlook and Review
DXY:
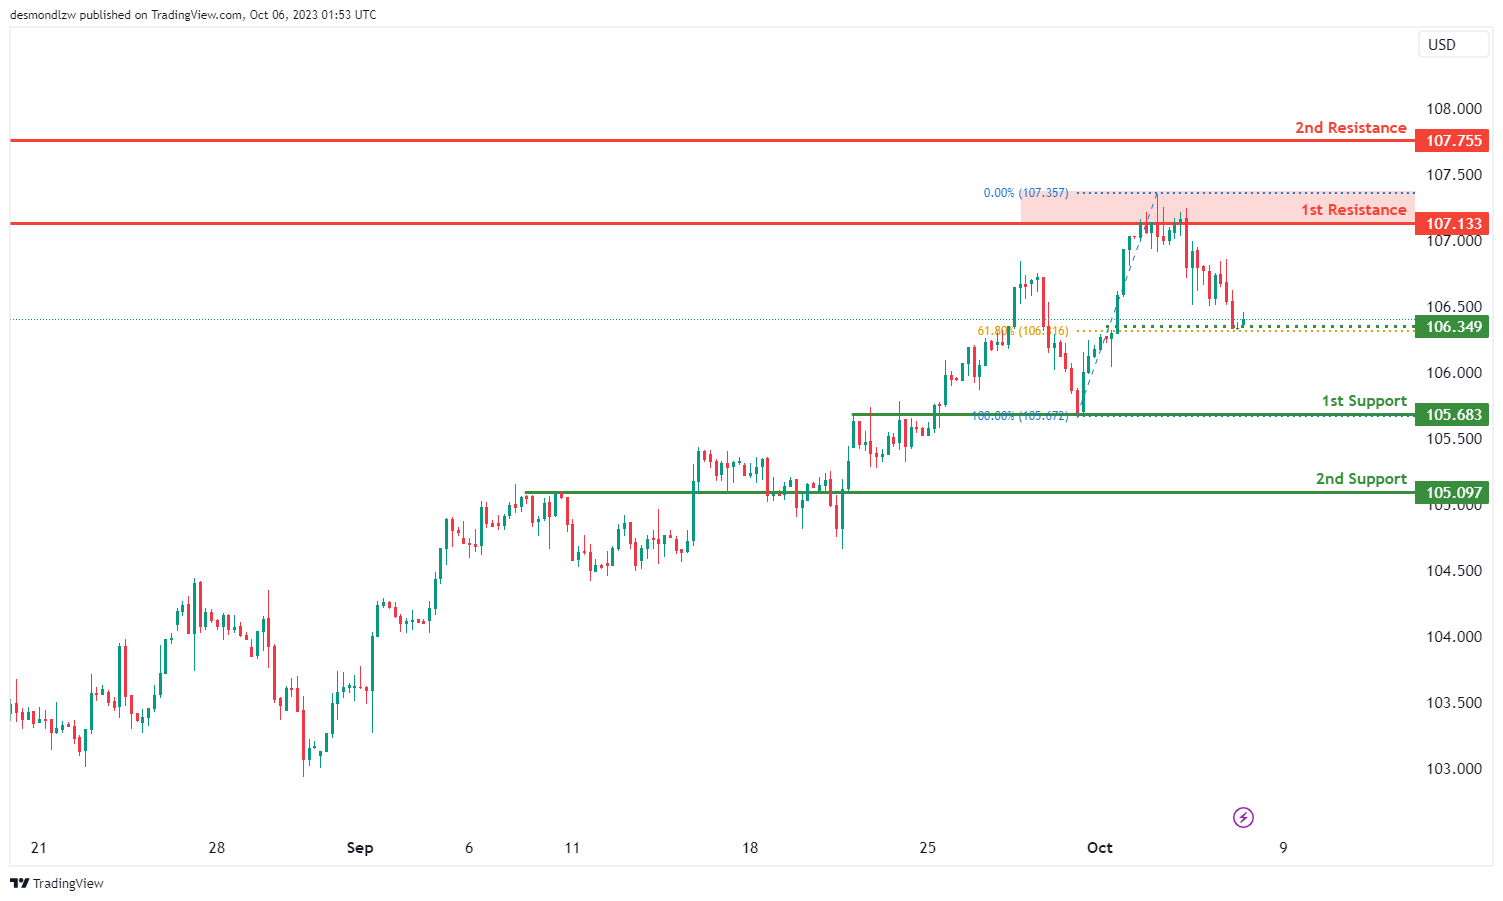
The DXY (US Dollar Index) chart currently maintains a bearish overall momentum, and there’s a potential scenario of a bearish continuation towards the 1st support level.
The 1st support at 105.68 is considered significant as it’s identified as an overlap support, making it an important level for potential price support. Additionally, the 2nd support at 105.09 is categorized as a pullback support, further reinforcing its significance as a potential area where price could find support.
On the resistance side, the 1st resistance level at 107.13 is recognized as a multi-swing high resistance, indicating its potential role as a barrier to upward movements. Beyond this, the 2nd resistance at 107.75 is identified as a swing high resistance.
Furthermore, there’s an intermediate support at 106.34, which is also considered a pullback support and is associated with the 61.80% Fibonacci Retracement level. This level adds another layer of potential support for price movements.
EUR/USD:
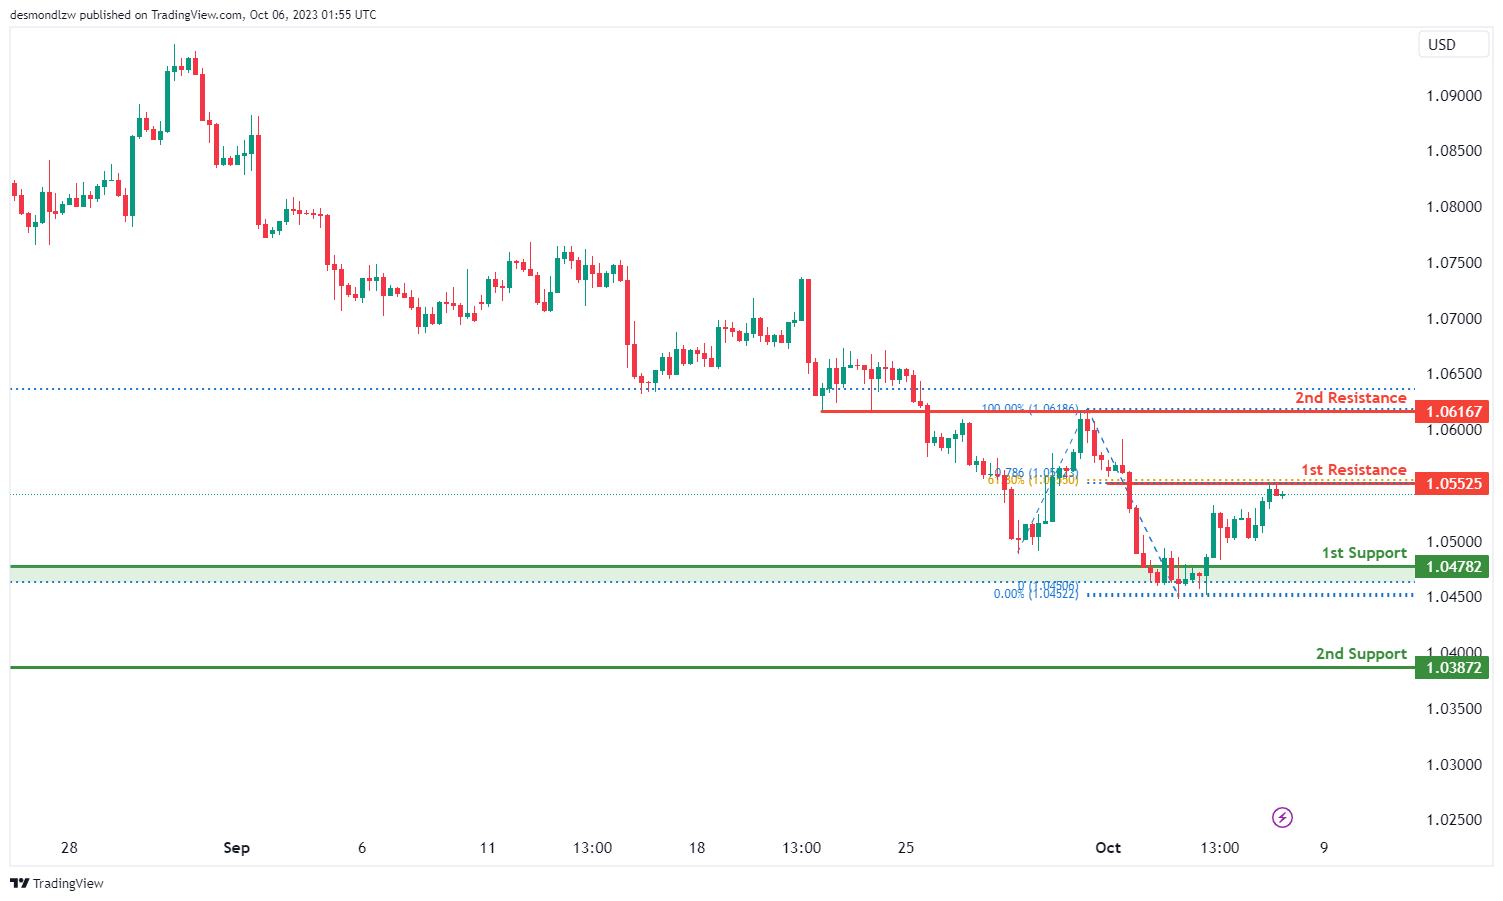
The EUR/USD chart currently maintains a bearish overall momentum, and there’s a potential scenario of a bearish reaction off the 1st resistance level, leading to a drop towards the 1st support.
The 1st support at 1.0478 is considered significant as it’s identified as a pullback support, making it an important level for potential price support. Additionally, the 2nd support at 1.0387 is categorized as a swing low support, further reinforcing its significance as a potential area where price could find support.
On the resistance side, the 1st resistance level at 1.0552 is recognized as a pullback resistance. It’s noteworthy that this level is associated with the confluence of the 61.80% Fibonacci Retracement and the 78.60% Fibonacci Projection, indicating strong Fibonacci confluence and suggesting it may act as a barrier to upward movements. Beyond this, the 2nd resistance at 1.0633 is identified as an overlap resistance.
EUR/JPY:
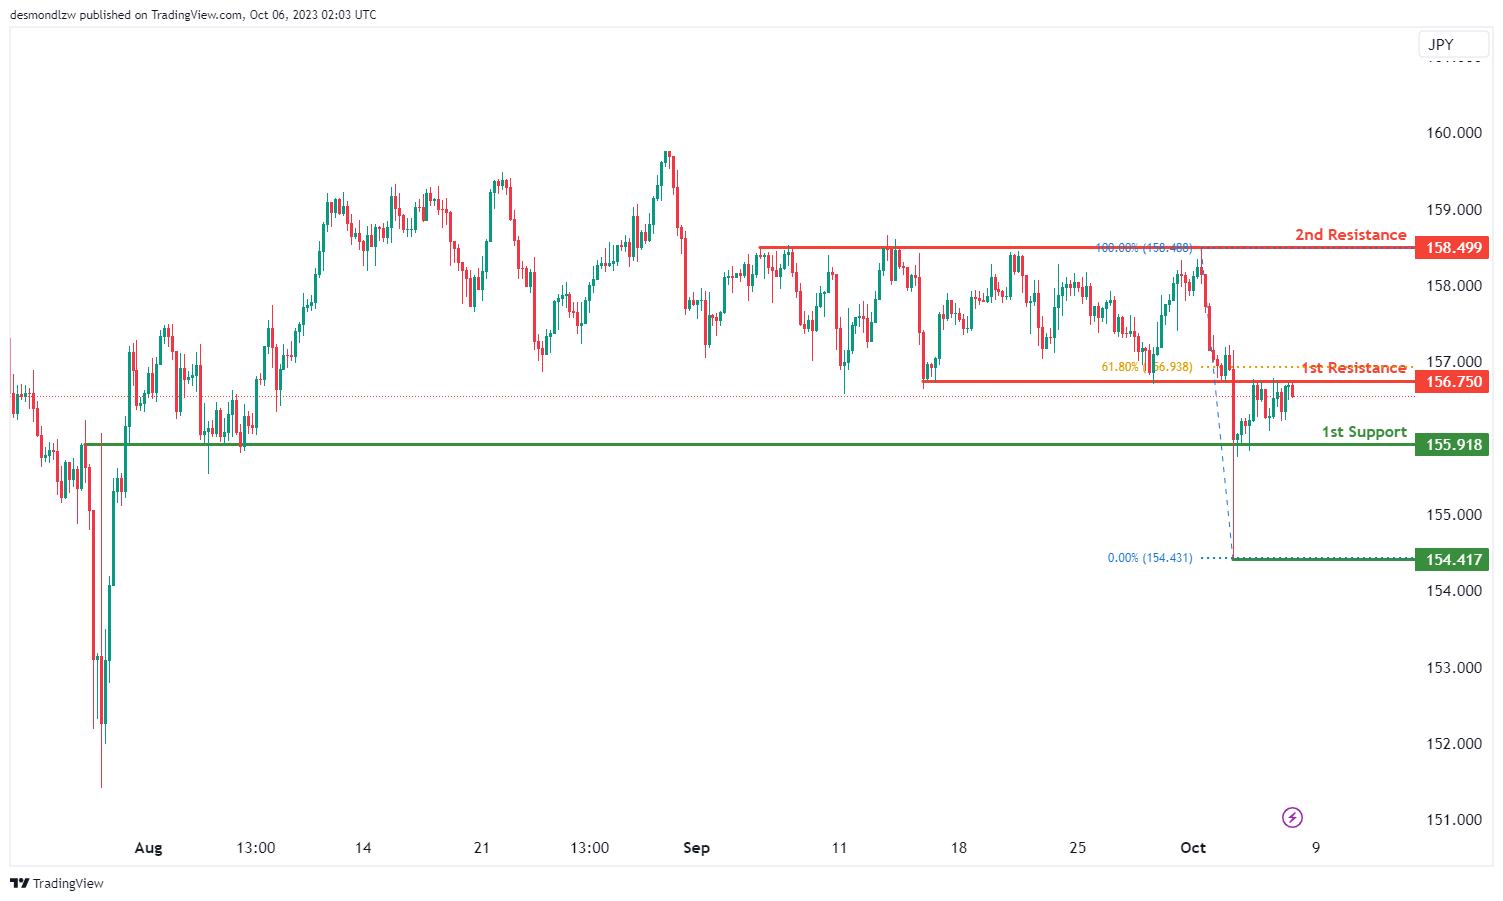
The EUR/JPY chart currently exhibits bearish momentum, suggesting the potential scenario of a bearish reaction off the 1st resistance level and a subsequent drop towards the 1st support level.
The 1st support at 155.91 is considered significant as it is identified as an overlap support, indicating a potential area where buying interest may arise. Additionally, the 2nd support at 154.41 is a swing low support, further reinforcing its importance as a potential level for price rebounds.
On the resistance side, the 1st resistance level at 156.75 is characterized as an overlap resistance and is accompanied by the presence of the 61.80% Fibonacci Retracement, suggesting it could act as a strong barrier to upward price movement. Beyond this, the 2nd resistance at 158.49 is identified as a multi-swing high resistance, adding to its significance as a potential area where selling pressure may emerge.
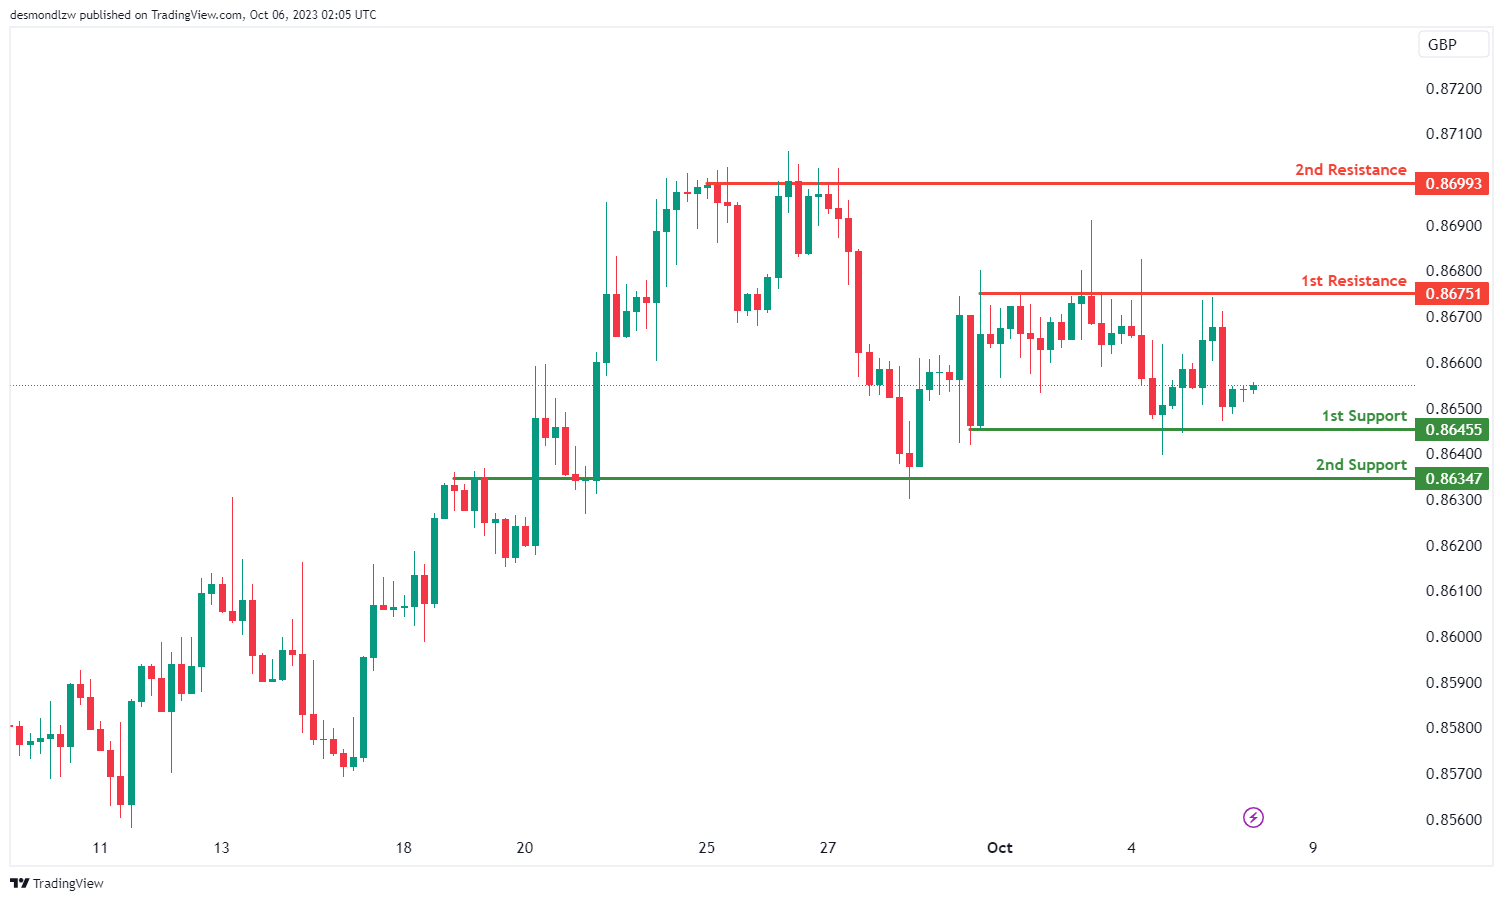
EUR/GBP:
The EUR/GBP chart currently displays a bullish overall momentum, indicating the potential scenario of a bullish continuation towards the 1st resistance level.
The 1st support at 0.8646 is considered significant as it is identified as a multi-swing low support, suggesting it could act as a key level for potential price rebounds. Additionally, the 2nd support at 0.8635 is an overlap support, reinforcing its importance as a level where buying interest may emerge.
On the resistance side, the 1st resistance level at 0.8675 is characterized as a multi-swing high resistance, signifying a potential area where price might encounter selling pressure. Beyond this, the 2nd resistance at 0.8699 is also identified as a multi-swing high resistance, further supporting the idea of potential upward price movement.
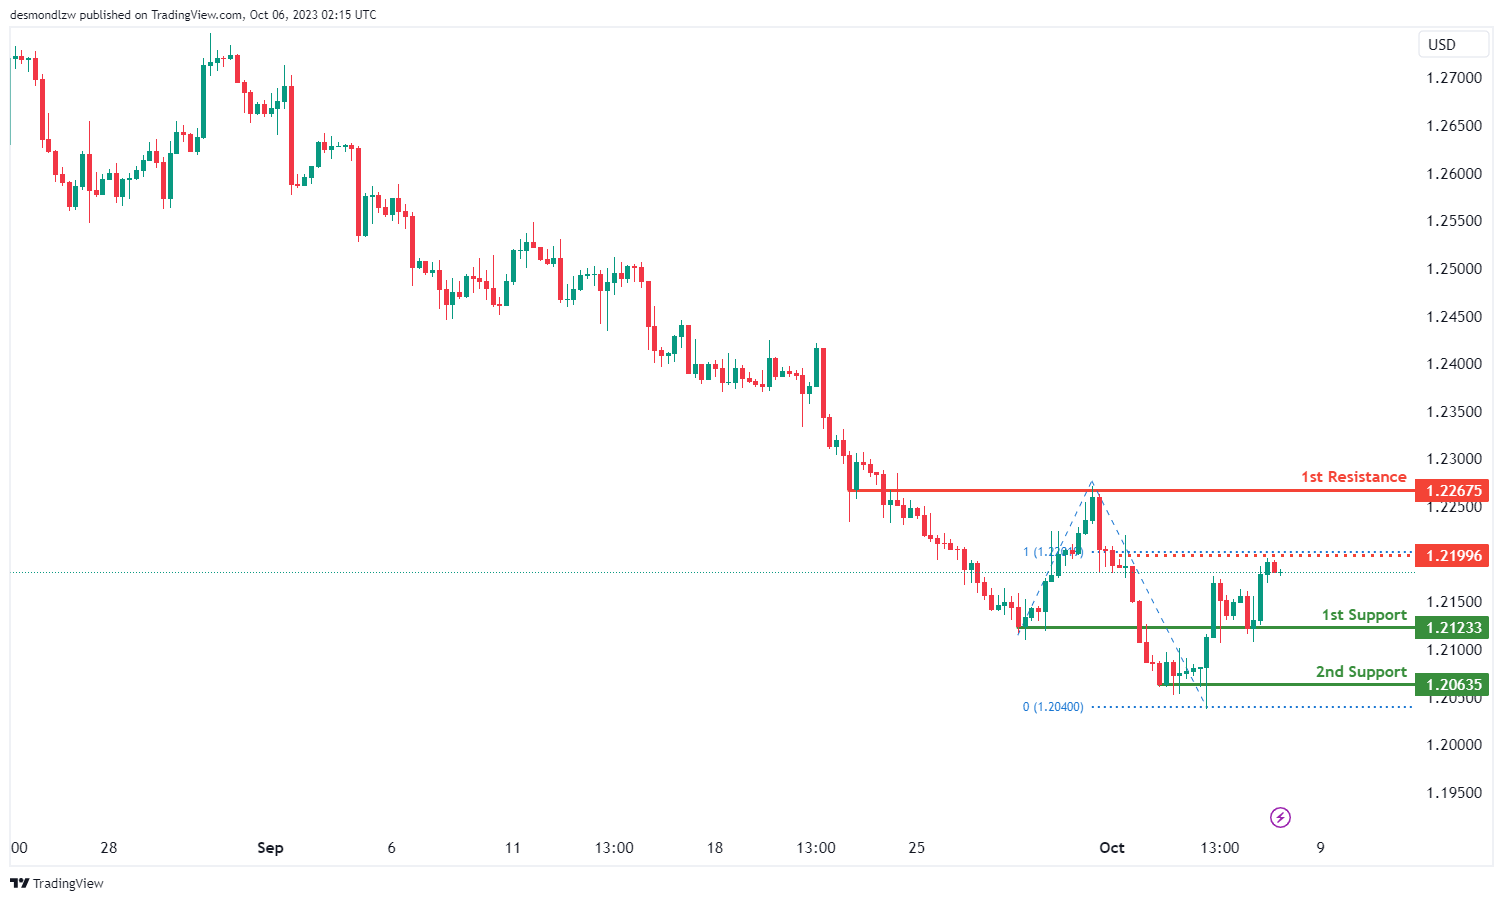
GBP/USD:
The GBP/USD chart currently exhibits a bullish overall momentum, and there’s a potential scenario of a bullish continuation towards the 1st resistance.
The 1st support at 1.2124 is considered significant as it’s identified as an overlap support, making it an important level for potential price support. Additionally, the 2nd support at 1.2067 is categorized as a multi-swing low support, further reinforcing its significance as a potential area where price could find support.
On the resistance side, the 1st resistance level at 1.2267 is recognized as an overlap resistance. It’s noteworthy that this level is associated with the 78.60% Fibonacci Projection, suggesting it may act as a barrier to upward movements. Beyond this, there’s an intermediate resistance at 1.2199, which aligns with the 78.60% Fibonacci Projection as well.
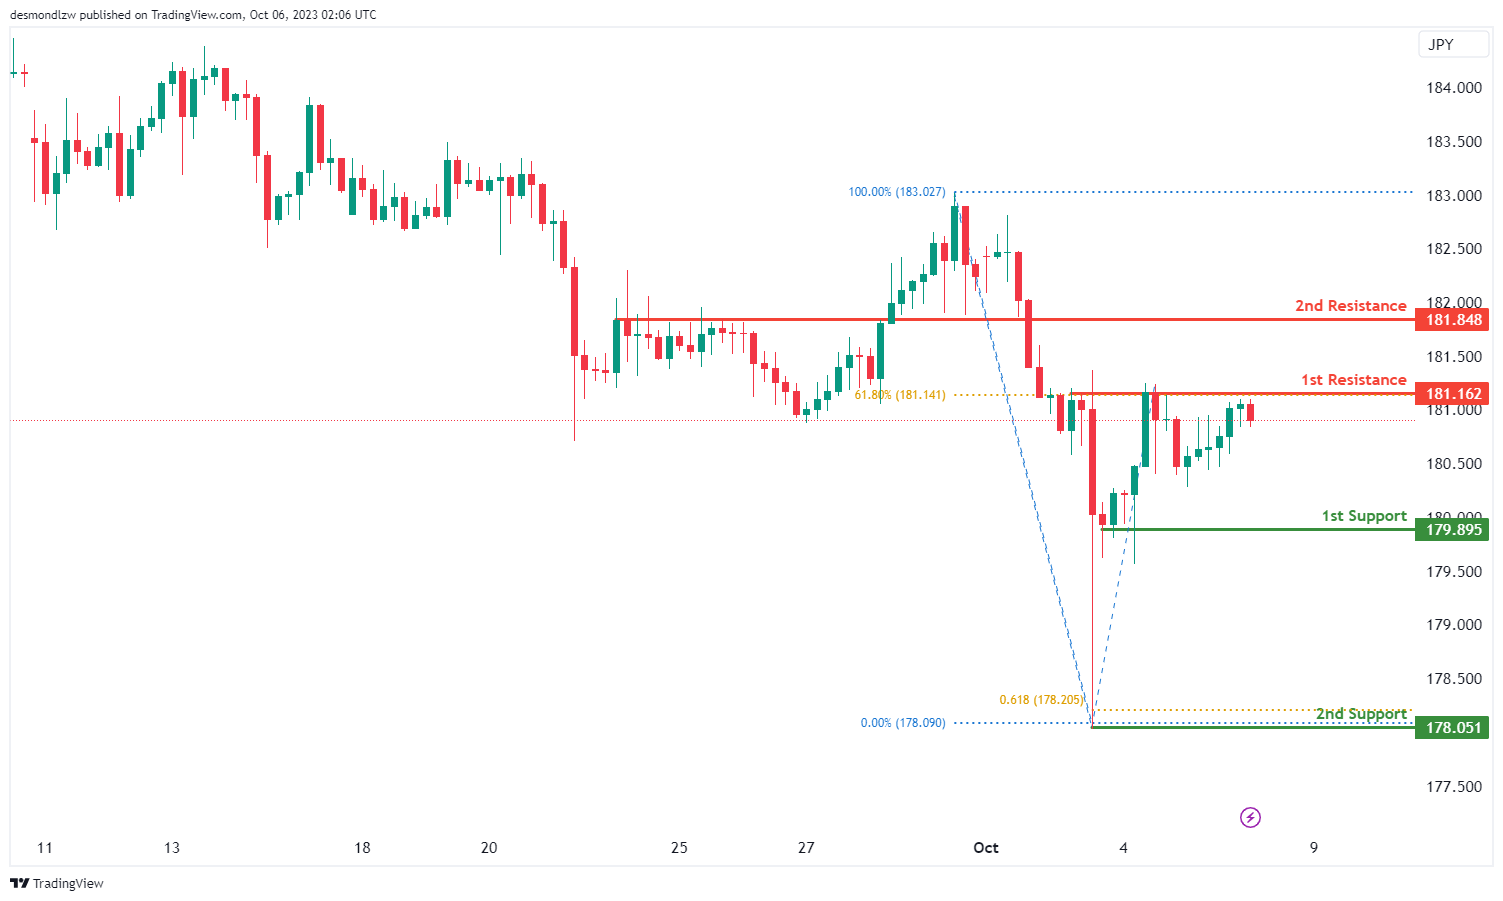
GBP/JPY:
The GBP/JPY chart currently exhibits a bearish overall momentum, suggesting the potential scenario of a bearish reaction off the 1st resistance level with a subsequent drop towards the 1st support.
The 1st support at 179.89 is considered significant as it is identified as a multi-swing low support, indicating its potential role as a key level for potential price rebounds. Additionally, the 2nd support at 178.05 is a swing low support and is further reinforced by the presence of the 61.80% Fibonacci Projection, making it a notable support level.
On the resistance side, the 1st resistance level at 181.16 is characterized as a multi-swing high resistance, marked by the 61.80% Fibonacci Retracement level. Beyond this, the 2nd resistance at 181.84 is identified as a pullback resistance, indicating a potential area where price might encounter selling pressure.
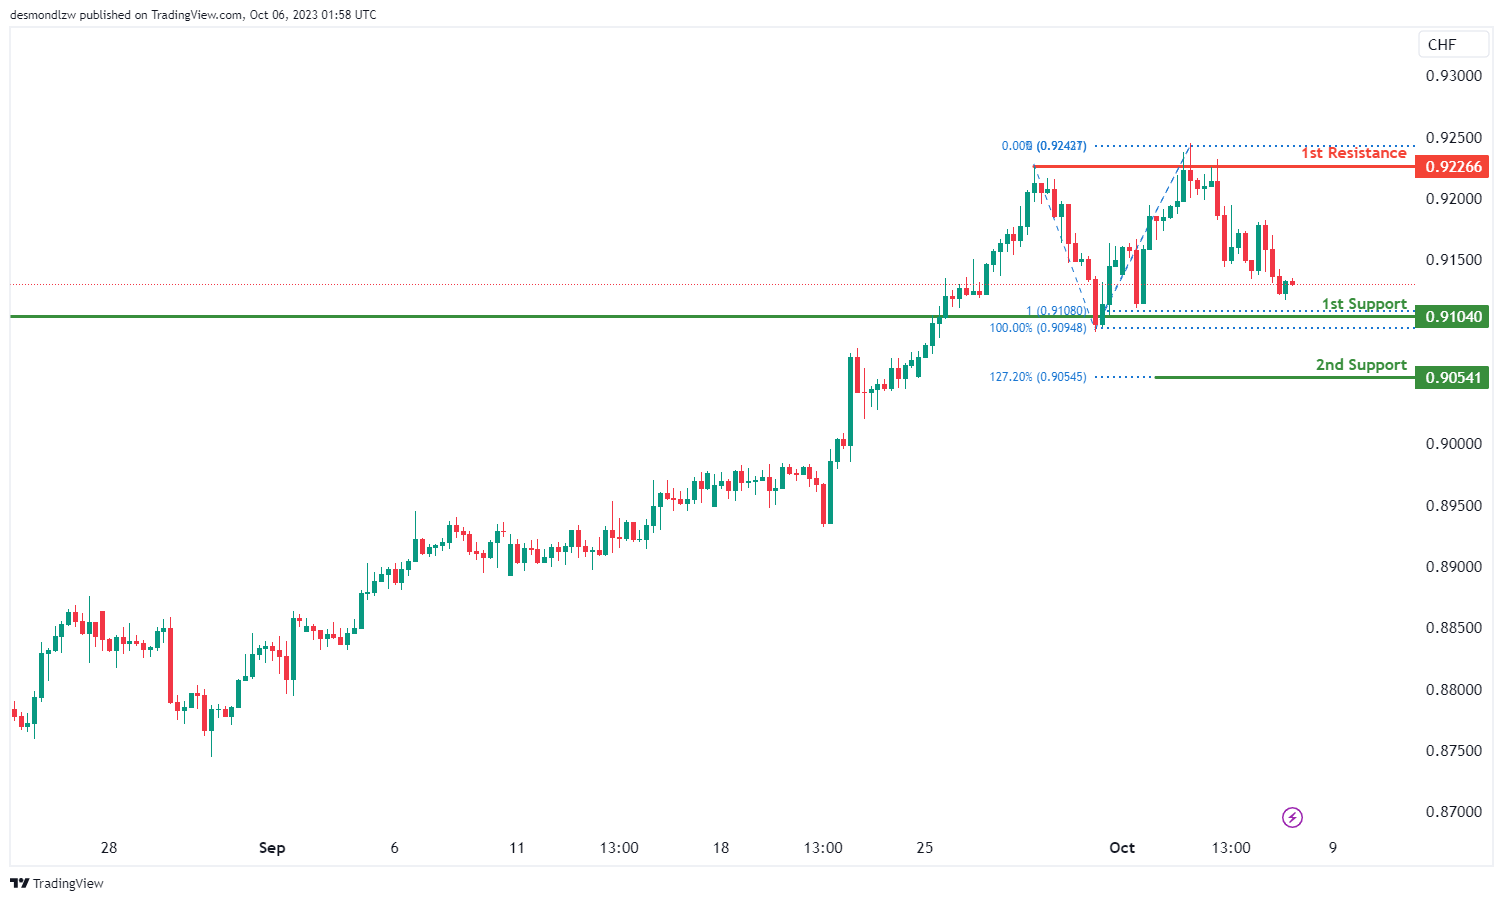
USD/CHF:
The USD/CHF chart currently maintains a bearish overall momentum, and there’s a potential scenario of a bearish continuation towards the 1st support.
The 1st support at 0.9104 is considered significant as it’s identified as an overlap support, and it also aligns with the 100% Fibonacci Projection, indicating its importance as a potential level for price support. Additionally, the 2nd support at 0.9054 is categorized as a support level, specifically the 127.20% Fibonacci Extension, further reinforcing its significance as an area where the price may find support.
On the resistance side, the 1st resistance level at 0.9226 is recognized as a multi-swing high resistance, and it’s associated with the 50% Fibonacci level. This resistance level may act as a barrier to price increases.
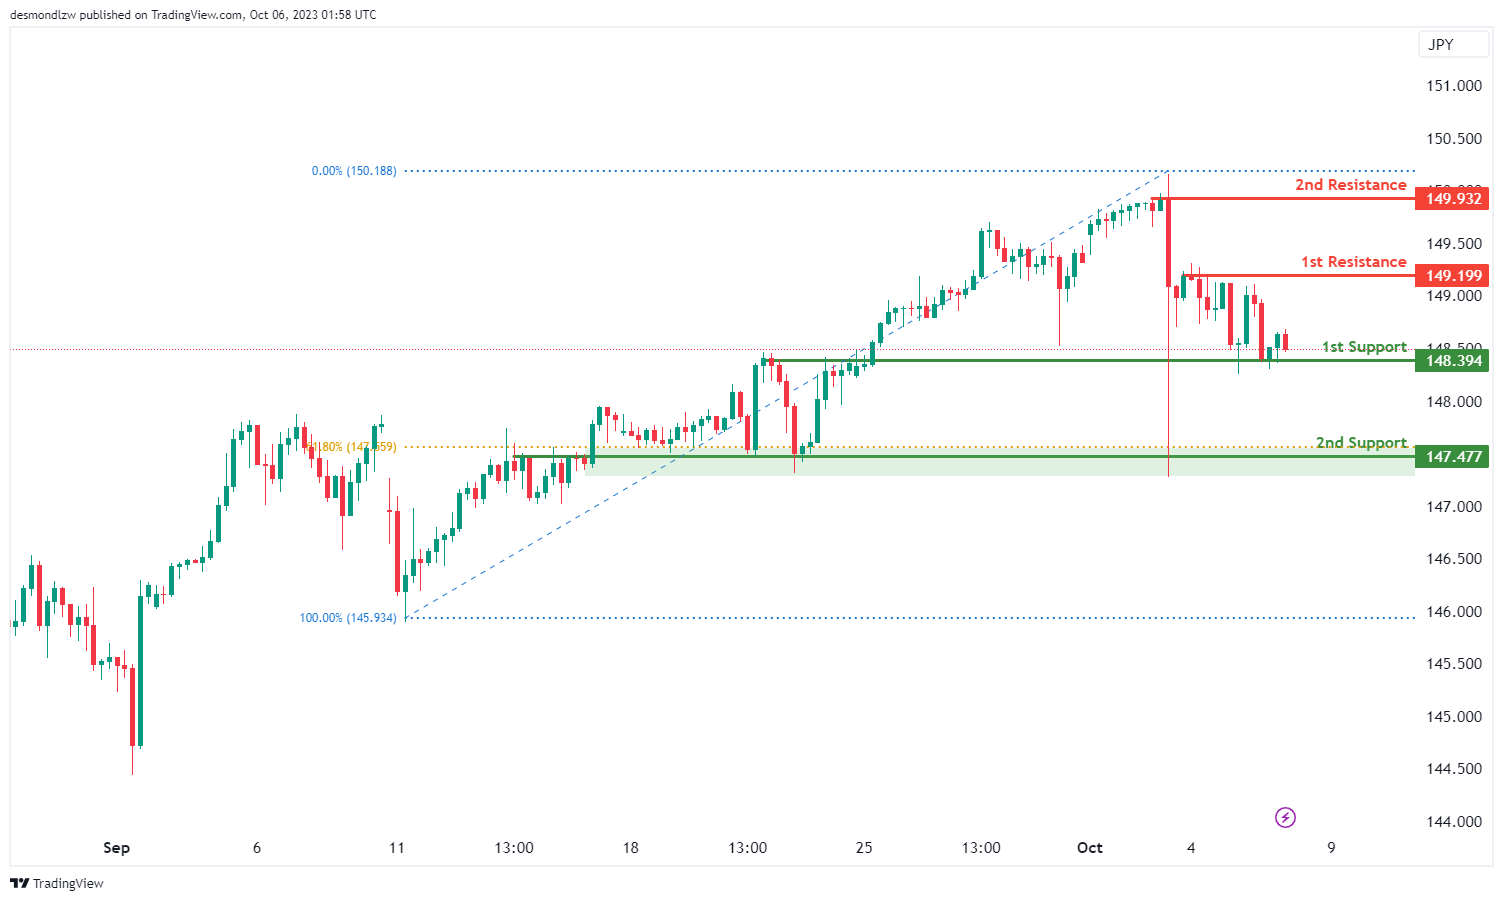
USD/JPY:
The USD/JPY chart currently exhibits a bearish momentum, but there’s a potential short-term scenario of a price rise towards the 1st resistance level before reversing and moving towards the 1st support.
The 1st support at 148.39 is considered significant, as it’s identified as an overlap support. Additionally, the 2nd support at 147.47 aligns with the 61.80% Fibonacci Retracement, further emphasizing its importance as a potential support level.
On the resistance side, the 1st resistance level at 149.19 is characterized as a swing high resistance, and beyond this, the 2nd resistance at 149.93 is also identified as a swing high resistance.
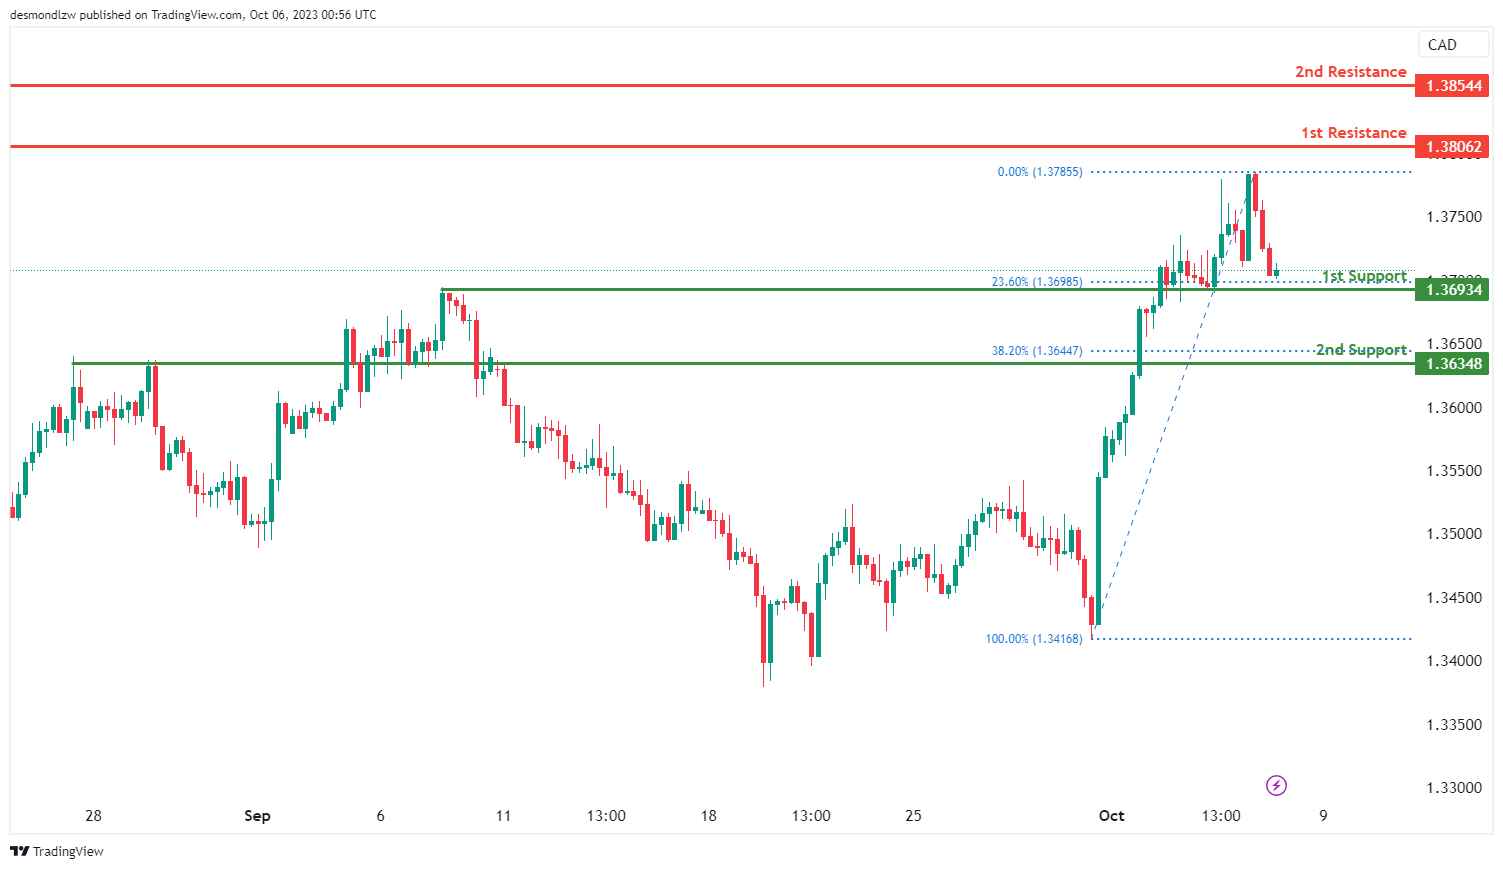
USD/CAD:
The USD/CAD chart is currently showing an overall bearish momentum suggesting the possibility of a bearish continuation towards the 1st support.
The 1st support level at 1.3693 is identified as an overlap support that aligns with the 23.60% Fibonacci retracement level. Additionally, the 2nd support level at 1.3634 is also noted as an overlap support that aligns with the 38.20% Fibonacci retracement level, further reinforcing its importance.
To the upside, the 1st resistance level at 1.3806 is identified as a pullback resistance while the 2nd resistance level at 1.3854 is also marked as a pullback resistance, further emphasizing its significance as a barrier for future price increases.
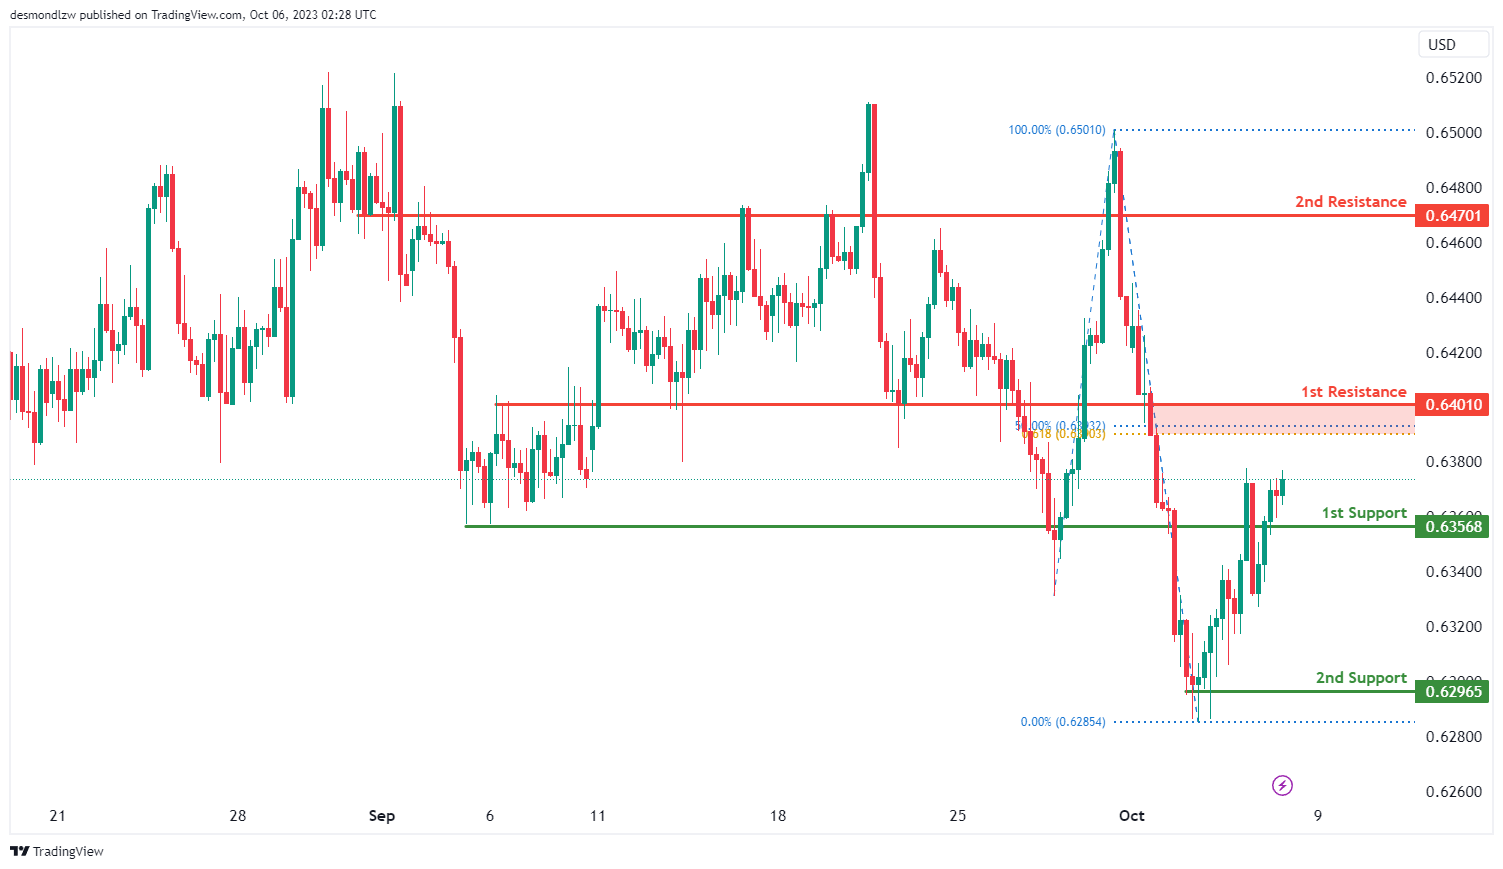
AUD/USD:
The AUD/USD chart currently exhibits an overall bullish momentum with a potential scenario of a bullish continuation towards the 1st resistance level.
The 1st resistance level at 0.6401 is identified as an overlap resistance that aligns close to a confluence of Fibonacci levels i.e. the 50.00% retracement and the 61.80% projection levels. Further up, the 2nd resistance level at 0.6470 is also marked as an overlap resistance, further emphasizing its significance as a barrier for future price increases.
To the downside, the 1st support level at 0.6357 is identified as a pullback support while the 2nd support level at 0.6297 is marked as a swing-low support, reinforcing its importance as a potential support level.
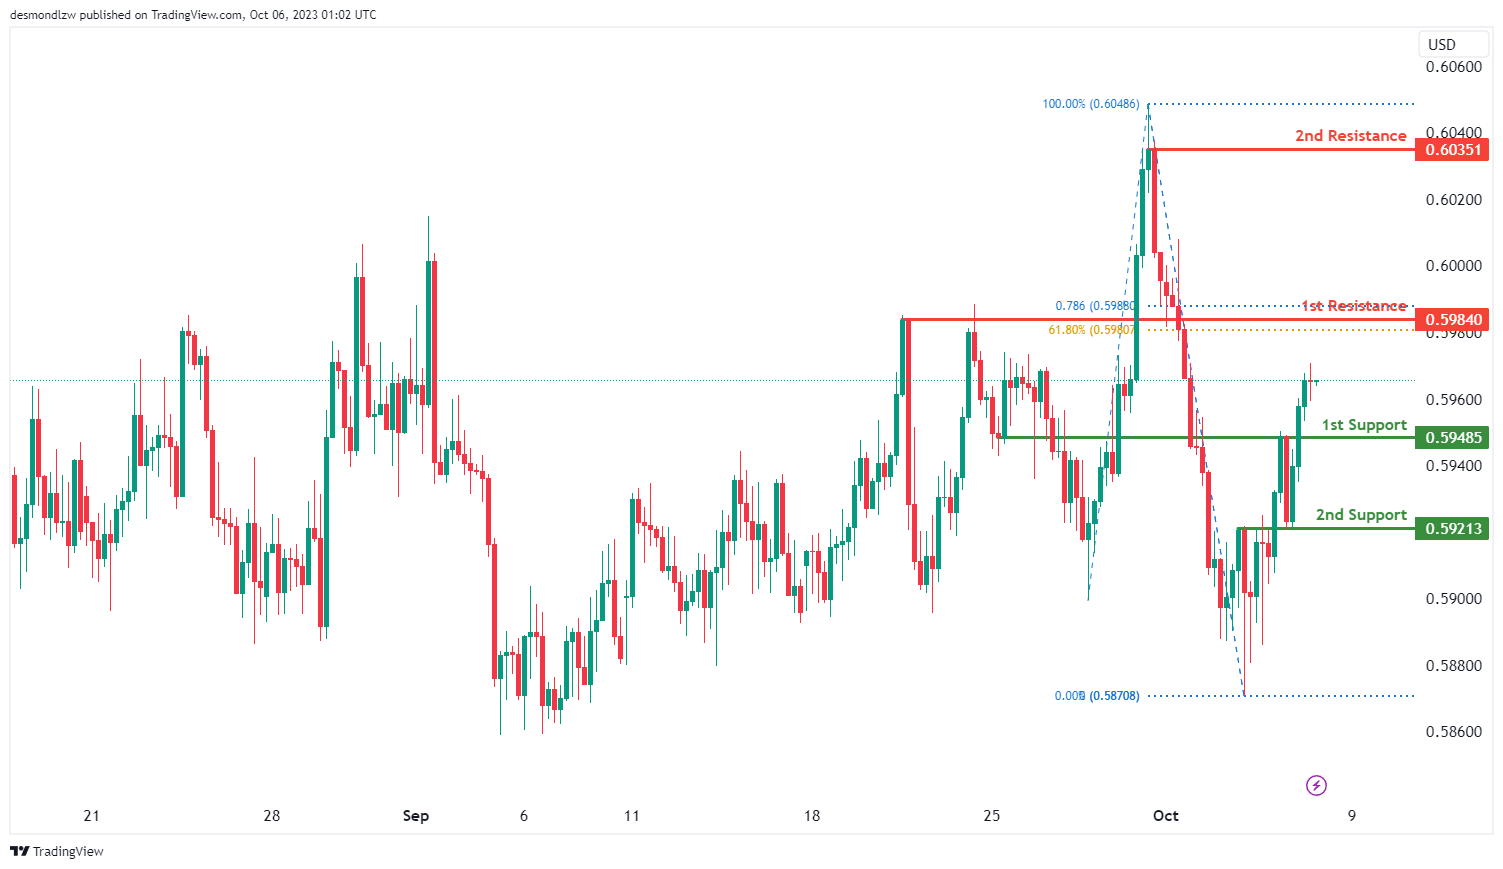
NZD/USD
The NZD/USD chart currently exhibits an overall bullish momentum with a potential scenario of a bullish continuation towards the 1st resistance level.
The 1st resistance level at 0.5984 is identified as a pullback resistance that aligns with a confluence of Fibonacci levels i.e. the 61.80% retracement and the 78.60% projection levels. Additionally, the 2nd resistance level at 0.6035 is marked as a swing-high resistance, further emphasizing its significance as a barrier for future price increases.
To the downside, the 1st support level at 0.5949 is identified as an overlap support. Further below, the 2nd support level at 0.5921 is also noted as an overlap support, further reinforcing its significance as an area where price may find support.
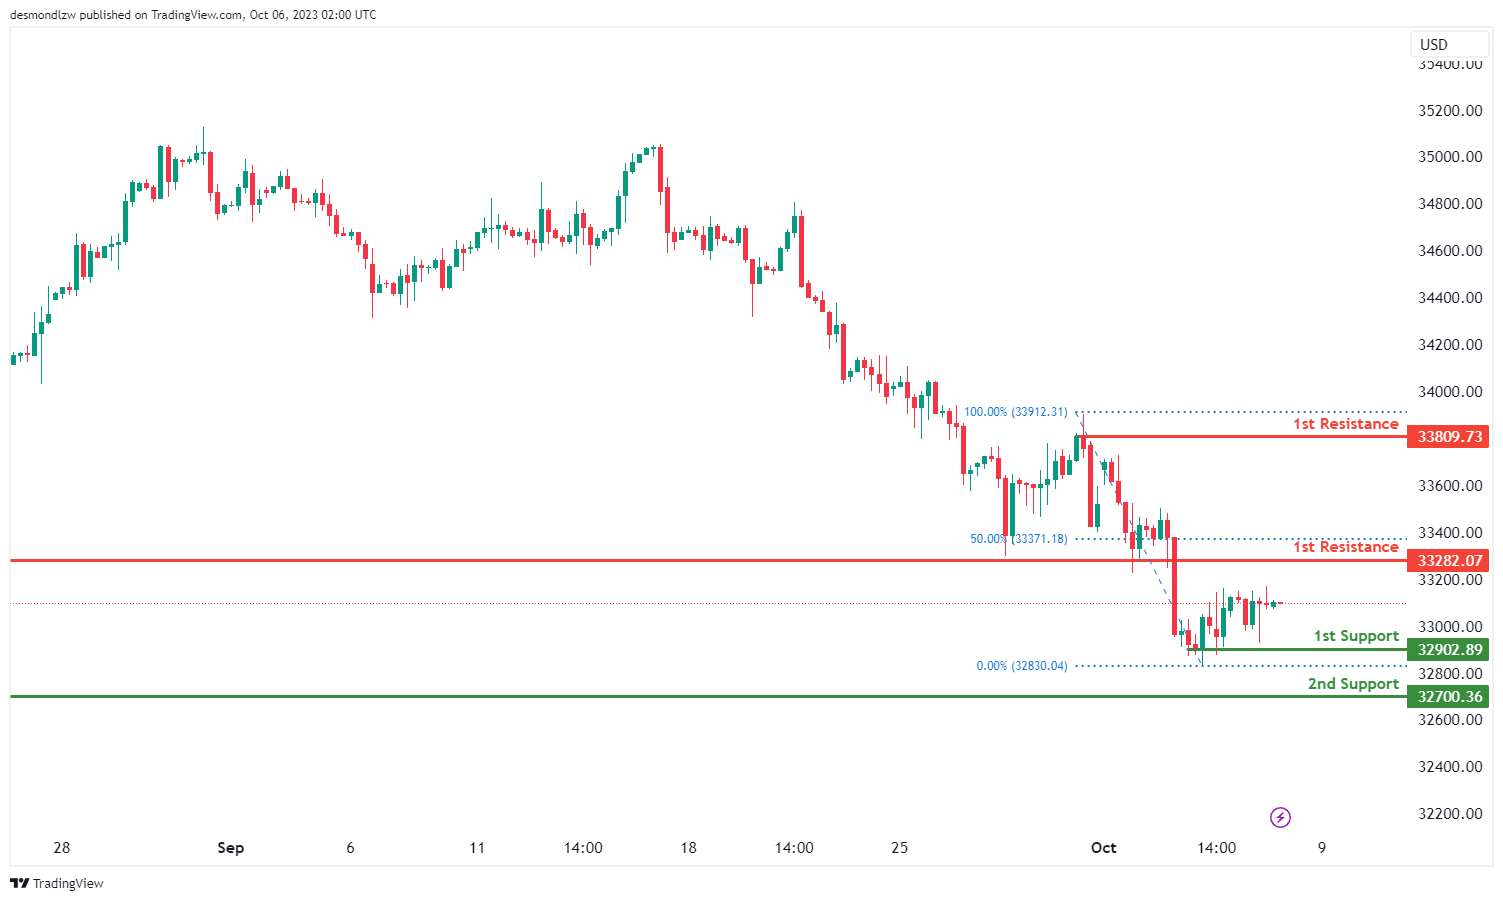
DJ30:
The DJ30 (Dow Jones 30) chart is currently displaying a neutral overall momentum, indicating the potential scenario of price fluctuating between the 1st resistance and 1st support levels.
The 1st support level at 32902.89 is considered significant as it’s identified as a multi-swing low support, suggesting that it may act as a reliable level for potential price rebounds. Additionally, the 2nd support at 37700.36 is also a multi-swing low support, providing another important level to watch.
On the resistance side, the 1st resistance level at 33282.07 is characterized as a pullback resistance, potentially acting as a barrier to further upward movement. Beyond this, the 2nd resistance at 33809.73 represents a swing high resistance, indicating another key level where price might encounter selling pressure.
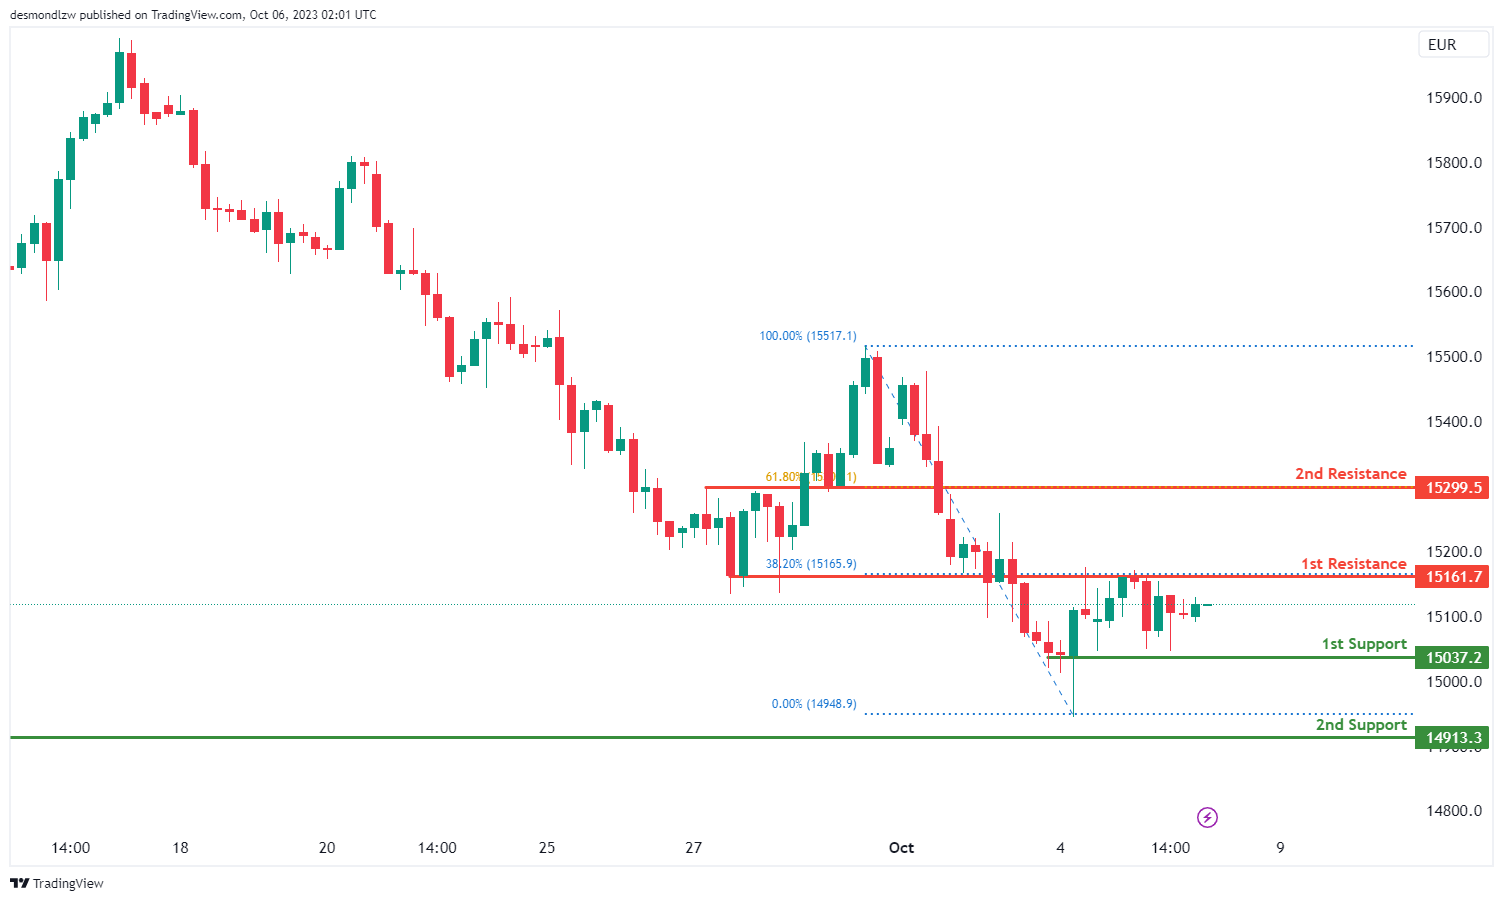
GER40:
The GER40 chart currently exhibits a neutral momentum, suggesting a potential scenario of price fluctuation between the 1st resistance and 1st support levels.
The 1st support at 15037.20 is considered significant as it’s identified as a multi-swing low support. Additionally, the 2nd support at 14913.30 is a swing low support, adding to its importance as a potential level where price might find buying interest.
On the resistance side, the 1st resistance level at 15161.70 is characterized as an overlap resistance, and it also coincides with the 38.20% Fibonacci Retracement level. Beyond this, the 2nd resistance at 15299.50 represents a pullback resistance and is marked by the 61.80% Fibonacci Retracement level.
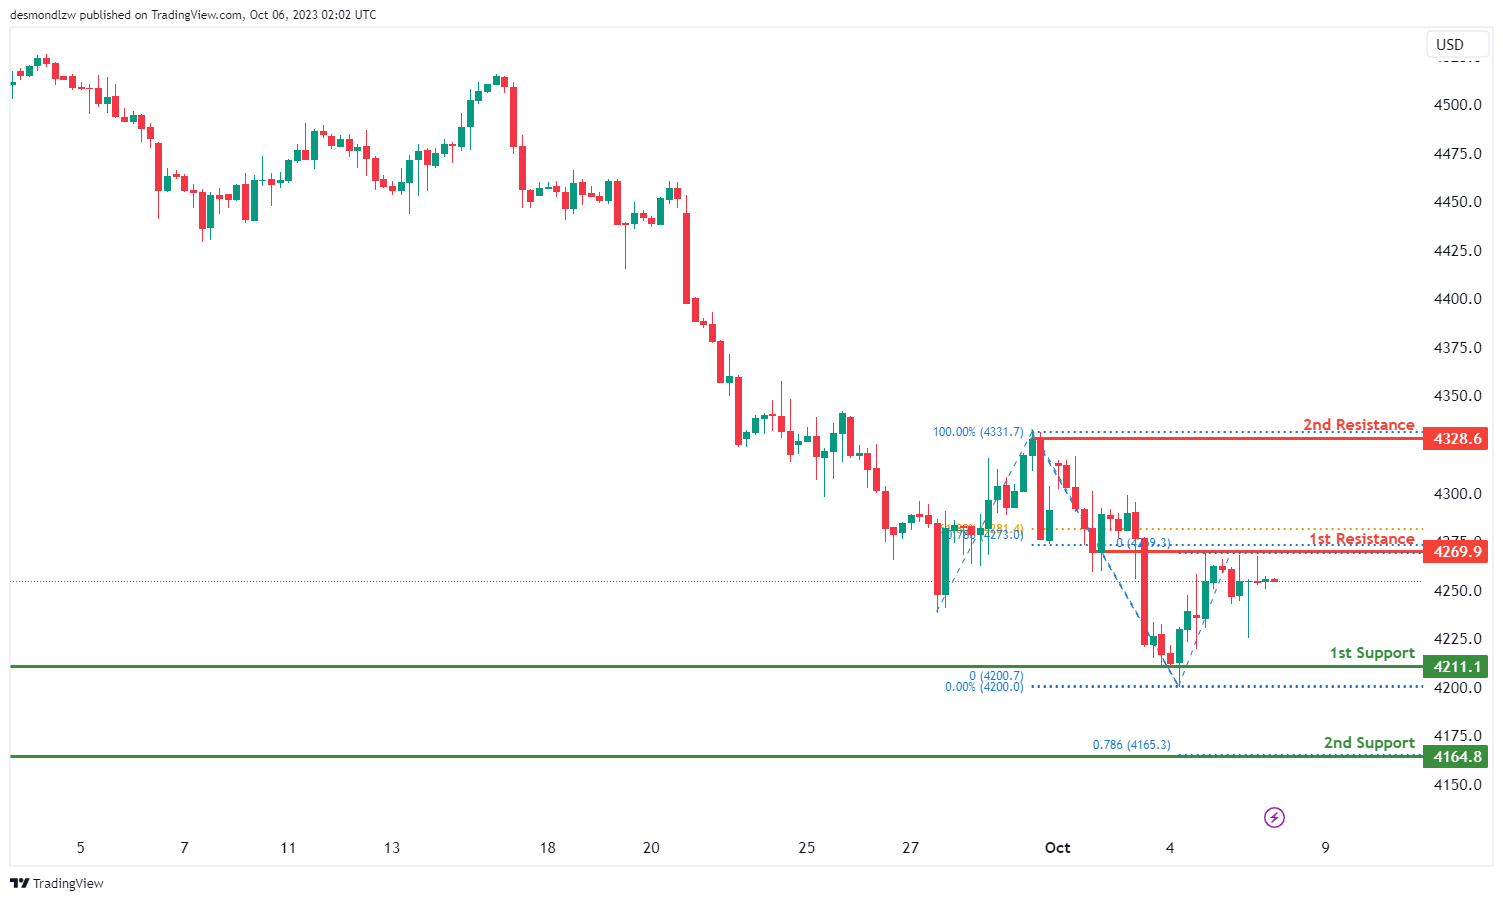
US500
TThe US500 chart currently exhibits a bearish momentum, suggesting a potential scenario of a bearish reaction off the 1st resistance level, with a subsequent drop towards the 1st support.
The 1st support at 4211.1 is significant as it’s identified as a swing low support. Additionally, the 2nd support at 4164.8 is also a swing low support and is further reinforced by the presence of the 78.60% Fibonacci Projection and the 61.80% Fibonacci Retracement, indicating a strong confluence of technical factors at this level.
On the resistance side, the 1st resistance level at 4269.9 is characterized as an overlap resistance, and it coincides with the 78.60% Fibonacci Projection, adding to its significance as a potential barrier for price movement. Beyond this, the 2nd resistance at 4328.6 represents a swing high resistance.
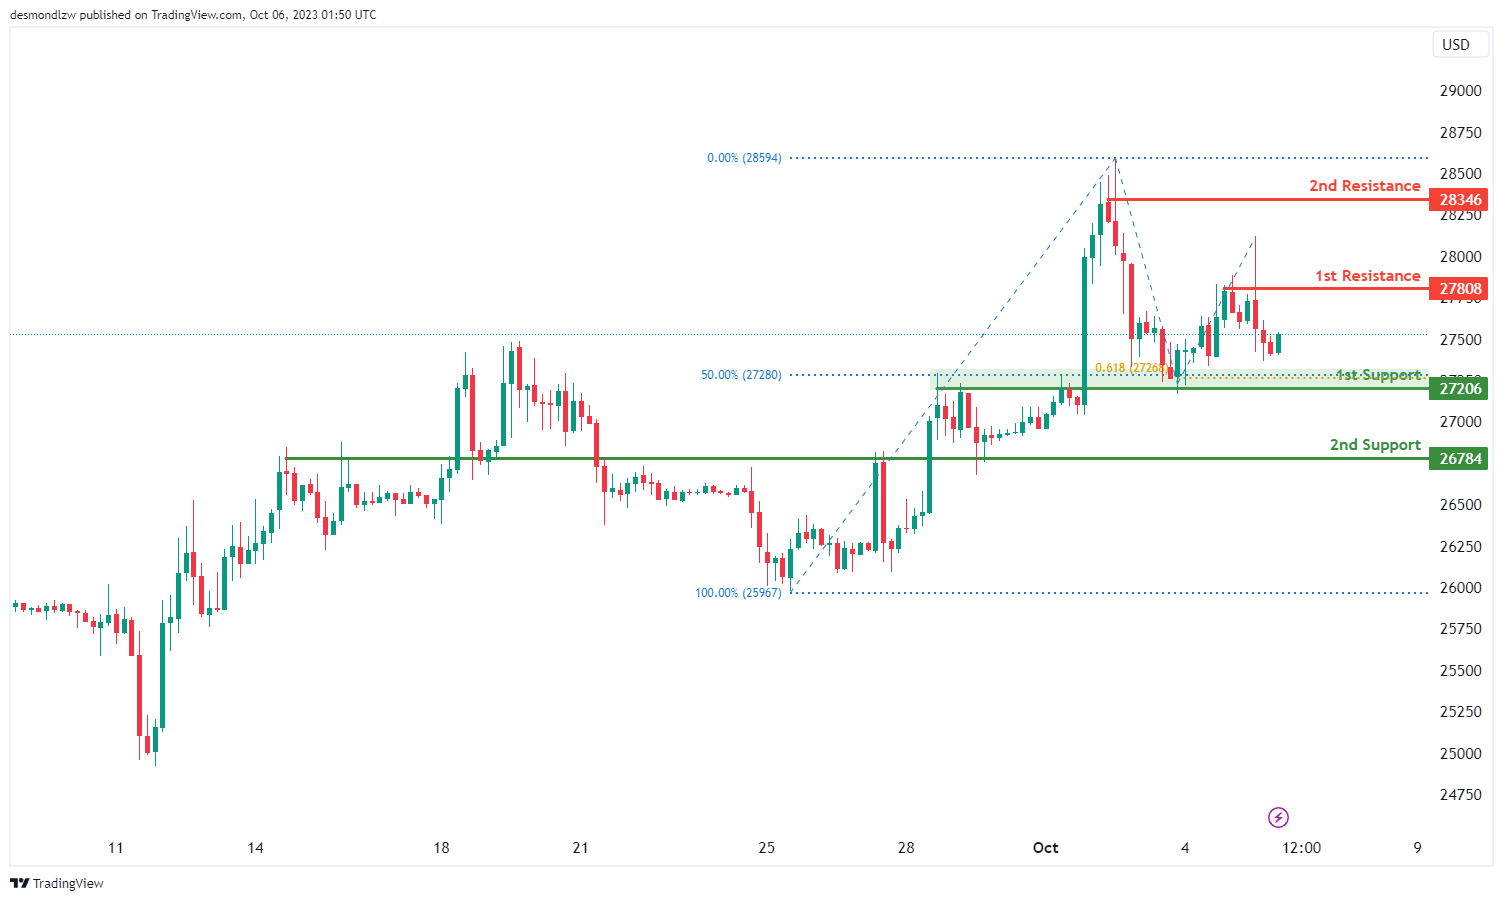
BTC/USD:
The BTC/USD chart currently has a bearish momentum, and there is a potential scenario of a bearish reaction off the 1st resistance, followed by a drop towards the 1st support.
The 1st support at 27206 is considered significant due to its alignment with both the 50% Fibonacci Retracement level and the 61.80% Fibonacci Projection, indicating a potential Fibonacci confluence, which suggests it could act as a strong support level.
The 2nd support at 26784 is also identified as an overlap support, reinforcing its importance as a potential level of price support.
On the resistance side, the 1st resistance level at 27808 is recognized as a swing high resistance, and beyond this, the 2nd resistance at 28346 is also categorized as a swing high resistance.
ETH/USD:
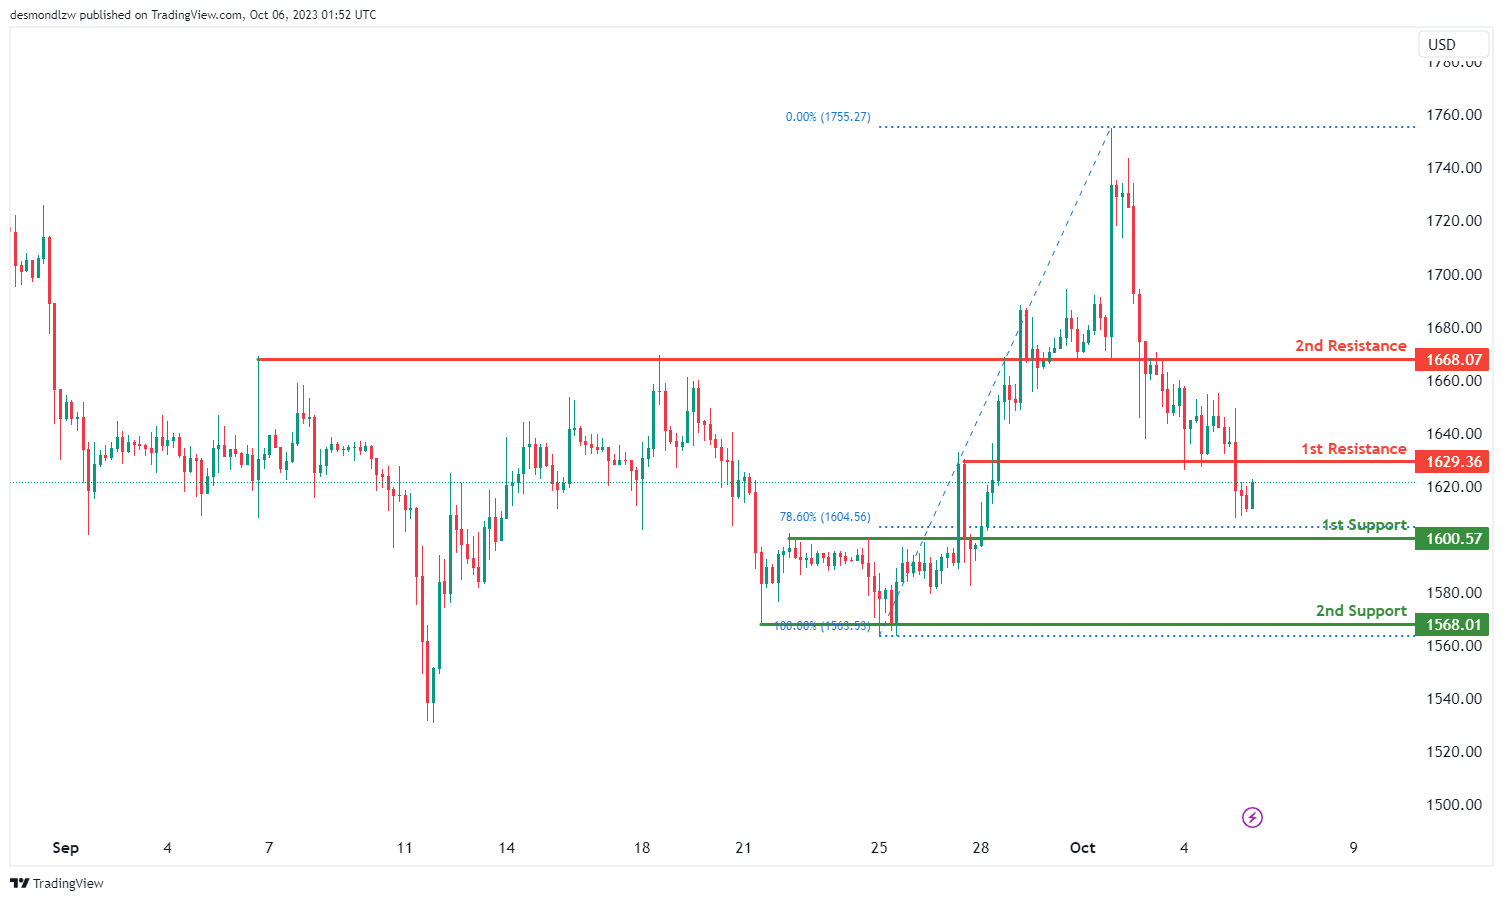
The ETH/USD chart currently exhibits a bearish momentum, and there is a potential scenario of a bearish reaction off the 1st resistance, followed by a drop to the 1st support.
The 1st support level at 1600.57 is considered significant as it is an overlap support, indicating that it has previously acted as a price support level. The 2nd support at 1568.01 is another important level, characterized as a multi-swing low support, suggesting it could provide additional support to price if it declines.
On the resistance side, the 1st resistance at 1629.36 is identified as a pullback resistance, which could act as a barrier to further upside movement.
Beyond the 1st resistance, the 2nd resistance at 1668.07 is recognized as an overlap resistance, implying that it has previously held as a price barrier.
WTI/USD:
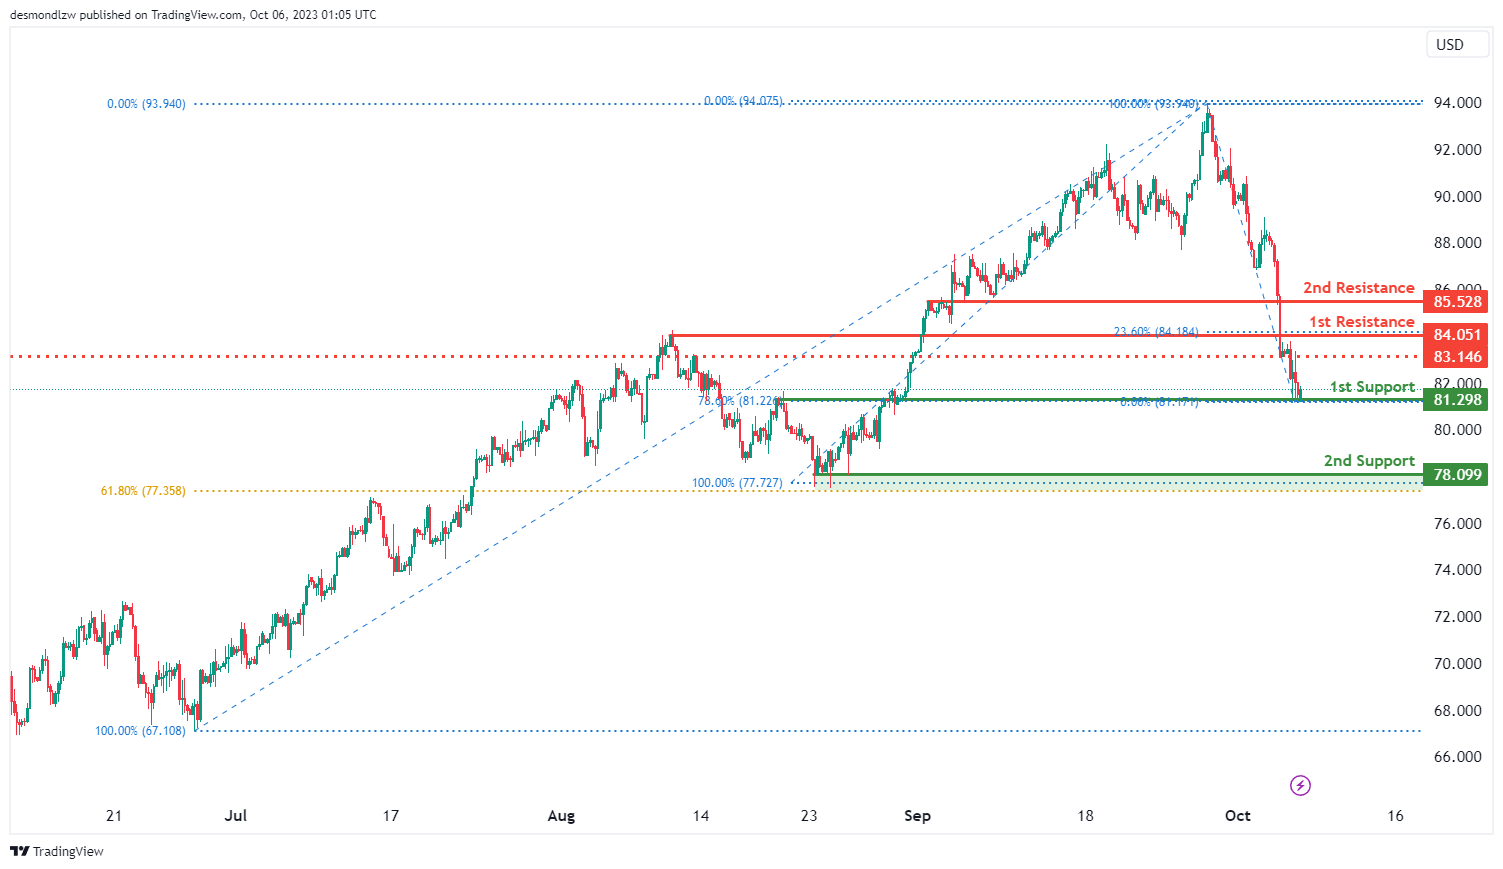
The WTI chart currently shows an overall bearish momentum but there is a potential for price to make a short-term bullish bounce towards the intermediate resistance before resuming the downturn.
The intermediate resistance level at 83.15 is identified as a pullback resistance while the 1st resistance level at 84.05 is also identified as a pullback resistance that aligns with the 23.60% Fibonacci retracement level. Additionally, the 2nd resistance level at 85.53 is noted as an overlap resistance.
To the downside, the 1st support level at 81.29 is identified as an overlap support that aligns with the 78.60% Fibonacci retracement level. Further below, the 2nd support level at 78.09 is marked as a pullback support that aligns close to the 61.80% Fibonacci retracement level.
XAU/USD (GOLD):
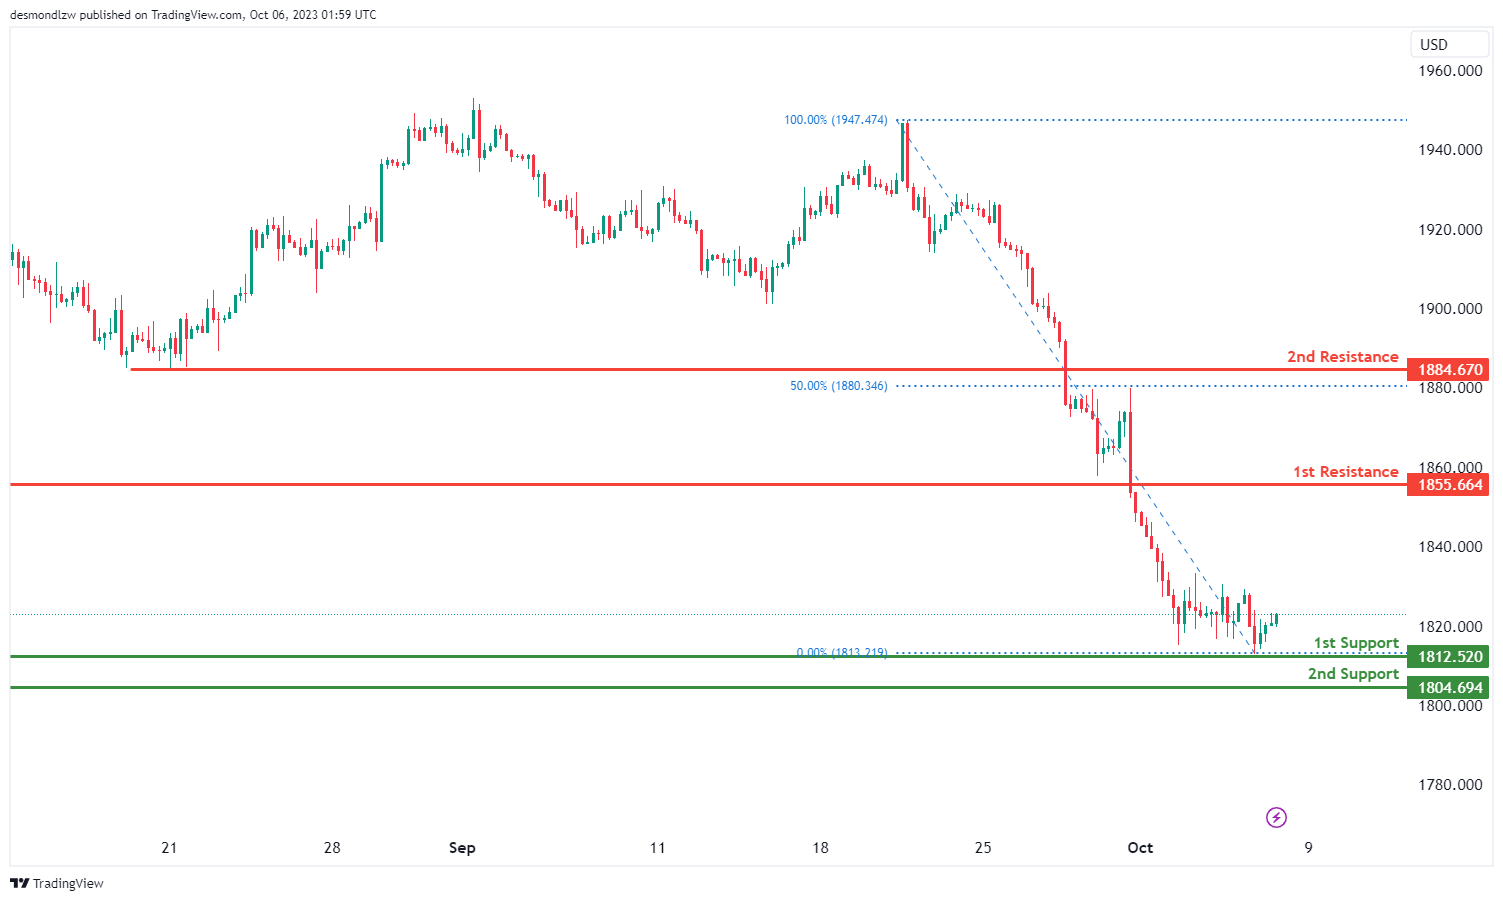
The XAU/USD chart currently exhibits bullish momentum, with the potential scenario of a bullish continuation towards the 1st resistance.
The 1st support at 1812.52 is considered significant as it’s identified as a swing low support. Additionally, the 2nd support at 2804.69 appears to be an erroneous value; please verify and provide the correct level if needed.
On the resistance side, the 1st resistance level at 1855.66 is characterized as a pullback resistance, and beyond this, the 2nd resistance at 1884.64 is identified as an overlap resistance and coincides with the 50% Fibonacci Retracement level.
USD/JPY Could Correct Lower, US Nonfarm Payrolls Next
Key Highlights
- USD/JPY struggled above 150.00 and reacted to the downside.
- It traded below a key bullish trend line with support at 149.00 on the 4-hour chart.
- Gold prices are accelerating lower and might drop toward the $1,780 support.
- The US nonfarm payrolls could increase by 170K in Sep 2023, down from 187K.
USD/JPY Technical Analysis
The US Dollar rallied above the 148.00 resistance zone against the Japanese Yen. USD/JPY even broke the 149.50 and 149.80 levels before the bears appeared.
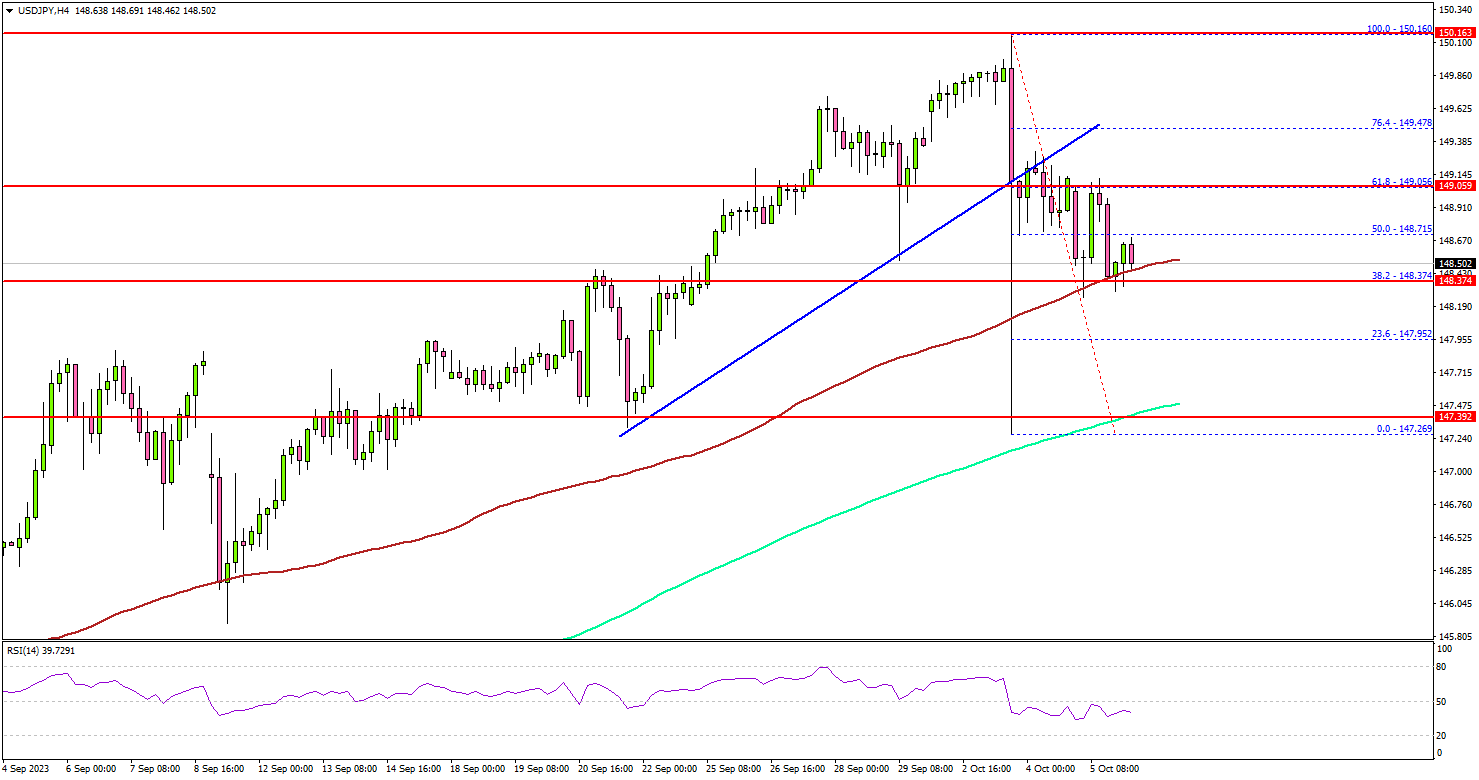
Looking at the 4-hour chart, the pair struggled above 150.00 and reacted to the downside. A high was formed near 150.16 before the pair declined. There was a move below a key bullish trend line with support at 149.00.
The pair flash crashed toward the 147.25 level before recovering to 149.00, the 100 simple moving average (red, 4 hours), and the 200 simple moving average (green, 4 hours).
However, the pair is struggling to clear the 149.00 resistance. A close above 149.00 could start a steady increase. In the stated case, USD/JPY might rise and recover toward the 150.00 resistance zone.
Immediate support is near the 148.35 level. The next key support is seen near the 148.00 level, below which it could test 147.40 and the 200 simple moving average (green, 4 hours). Any more losses might send the pair toward the 146.60 level.
Looking at gold, the bears remained in control, and they seemed to be aiming for a move toward the $1,780 support zone.
Economic Releases
- US nonfarm payrolls for Sep 2023 – Forecast 170K, versus 187K previous.
- US Unemployment Rate for Sep 2023 - Forecast 3.7%, versus 3.8% previous.
- Canada’s Employment Change for Sep 2023 – Forecast 20K, versus 39.9K previous.
- Canada’s Unemployment Rate for Sep 2023 - Forecast 5.6%, versus 5.5% previous.
Japanese wages growth underwhelm as real income sinks for 17th mth
Subdued wage growth data in Japan is raising eyebrows, particularly at BoJ. An essential element for the central bank's policy normalization is the establishment of a harmonious cycle between wage growth and prices. The recent figures, however, indicate that this equilibrium remains elusive.
In August, labor cash earnings in Japan rose by a meager 1.1% yoy. This increase, while consistent with the prior month, fell short of the anticipated 1.5% growth. Furthermore, base salary growth, although increasing to 1.6% yoy from the preceding month's 1.4%, has yet to manifest signals of a robust and sustainable upward momentum.
The bright spot, perhaps, is the increase in overtime pay, which is often used as an indicator of business vibrancy, as 1.0% yoy ascent was observed, rebounding from July's flat growth.
However, inflation-adjusted real wages continued their downward spiral for the 17th consecutive month. August's real wages declined by -2.5% yoy, surpassing the projected -2.1% yoy dip. This trend starkly reveals that despite any increments, wages are struggling to keep up with the consistent price surges, placing added strain on the average consumer's pocket.
Also released, household spending, a critical driver of economic activity, contracted by -2.5% yoy, a figure that, while better than the anticipated -4.3% yoy decline and an improvement from July's -5.0% yoy reduction, still underscores constrained consumer expenditure.
Fed’s Barkin links yield surge to robust data, abundant supply
Richmond Fed President Thomas Barkin expressed a cautious stance yesterday, indicating it's "too early to know if another rate increase would be needed this year."
He further elaborated on the need for a wait-and-see approach, suggesting, "We have time to see if we've done enough or whether there's more work to do."
"The path forward depends on whether we can convince ourselves inflationary pressures are behind us or whether we see them persistent." Alongside inflation, Barkin pinpointed the labor market as a pivotal area of focus.
Addressing the recent surge in Treasury yields, Barkin attributed it to an abundant fiscal issuance, indicating, "There's a lot of fiscal issuance out there. That's creating a lot of supply." He also acknowledged the role of recent strong economic data in pushing the yields higher.
Fed’s Daly points to rising yields and diminishing need for rate hike
San Francisco Fed President Mary Daly weighed in on the implications of the recent spike in the benchmark 10-year Treasury note yield, which marked a 16-year peak at 4.8%.
"If financial conditions... remain tight, the need for us to take further action is diminished," she said yesterday, adding that the role of the financial markets in this scenario, suggesting that "they've done the work."
On the market's response to rising bond yields, she observed a dip in probabilities for another hike at the upcoming November meeting. "To me, that says the markets are understanding how we think about things and they do have the reaction function in mind," she elaborated.
Daly reiterated that continual observation of economic indicators, specifically a "cooling labor market" and inflation gravitating towards target, could justify steadiness in interest rates.
She elaborated that maintaining rates isn't a passive stance but an "active policy action," especially as declining inflation augments the restrictive impact of existing policy measures.
However, she also emphasized adaptability, hinting that should economic indicators such as growth and inflation not decelerate as expected, or if financial conditions become overly relaxed, Fed is prepared to raise rates until monetary policy achieves its desired restrictiveness. "We need to keep an open mind, and have optionality," she underscored.
ECB’s Villeroy points to plateau in rates; dismisses need for rate hike
ECB Governing Council member Francois Villeroy de Galhau, in an interview with the German newspaper Handelsblatt published yesterday, weighed in on the current debate surrounding ECB's interest rates. Stating his view clearly, Villeroy remarked, "Today, I think there's no justification for an additional increase in the ECB rates."
Rather than focusing on the peak in rates, Villeroy believes the dialogue should shift towards the concept of a rate "plateau." In his words, "we'll remain on this plateau as long as necessary."
Villeroy also provided reassurance regarding the economic outlook of the eurozone. Contrary to the hard landing fears that loomed last winter, he noted, "We are not facing the worst-case scenario." Elaborating further, he added, "I believe our monetary policy can and should now aim for a soft landing for the euro zone: We'll exit inflation, and we'll probably do so without a recession."
Commenting on the broader market sentiments, Villeroy observed that expectations, both in Europe and US, have historically been "a little too optimistic regarding a future rate cut."