

Sample Category Title
Technical Outlook and Review
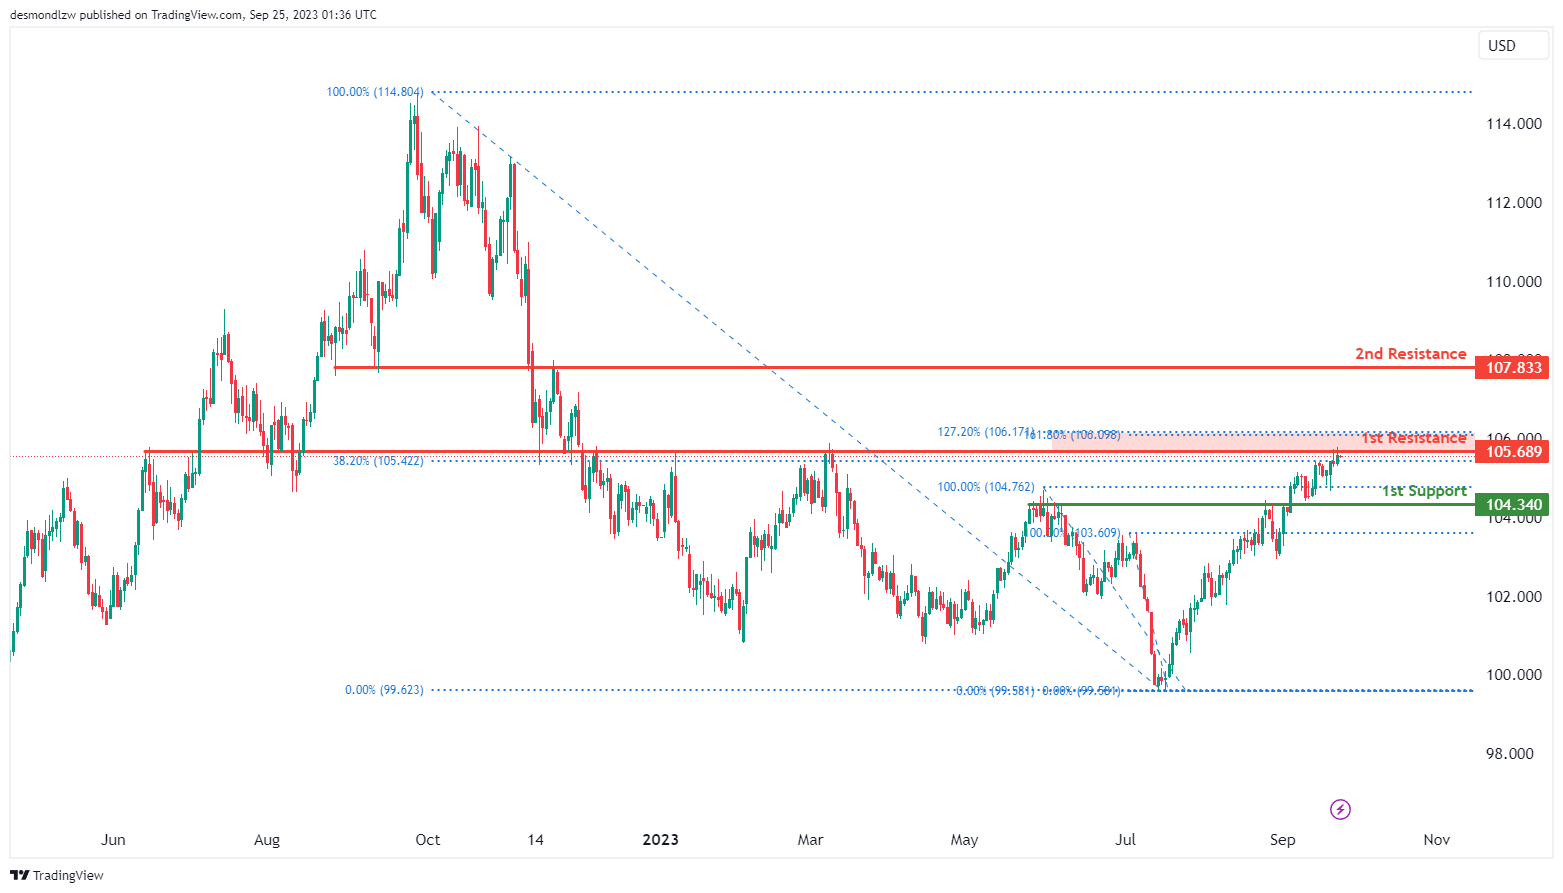
DXY:
The chart for DXY (US Dollar Index) currently exhibits a bearish overall momentum. In this context, there’s a potential scenario where the price could encounter a bearish reaction upon reaching the 1st resistance level at 105.68, possibly leading to a decline towards the 1st support level at 104.34.
The 1st support level at 104.34 is identified as an overlap support level, suggesting that it may serve as a critical support zone where buyers could potentially step in to prevent further downward movement.
On the resistance side, the 1st resistance level at 105.68 is characterized as an overlap resistance level. Additionally, it coincides with the 127.20% Fibonacci Extension, making it a significant potential barrier for any bullish attempts.
Furthermore, the 2nd resistance level at 107.83 is marked as another overlap resistance level, further reinforcing its potential importance as a point of resistance.
EUR/USD:
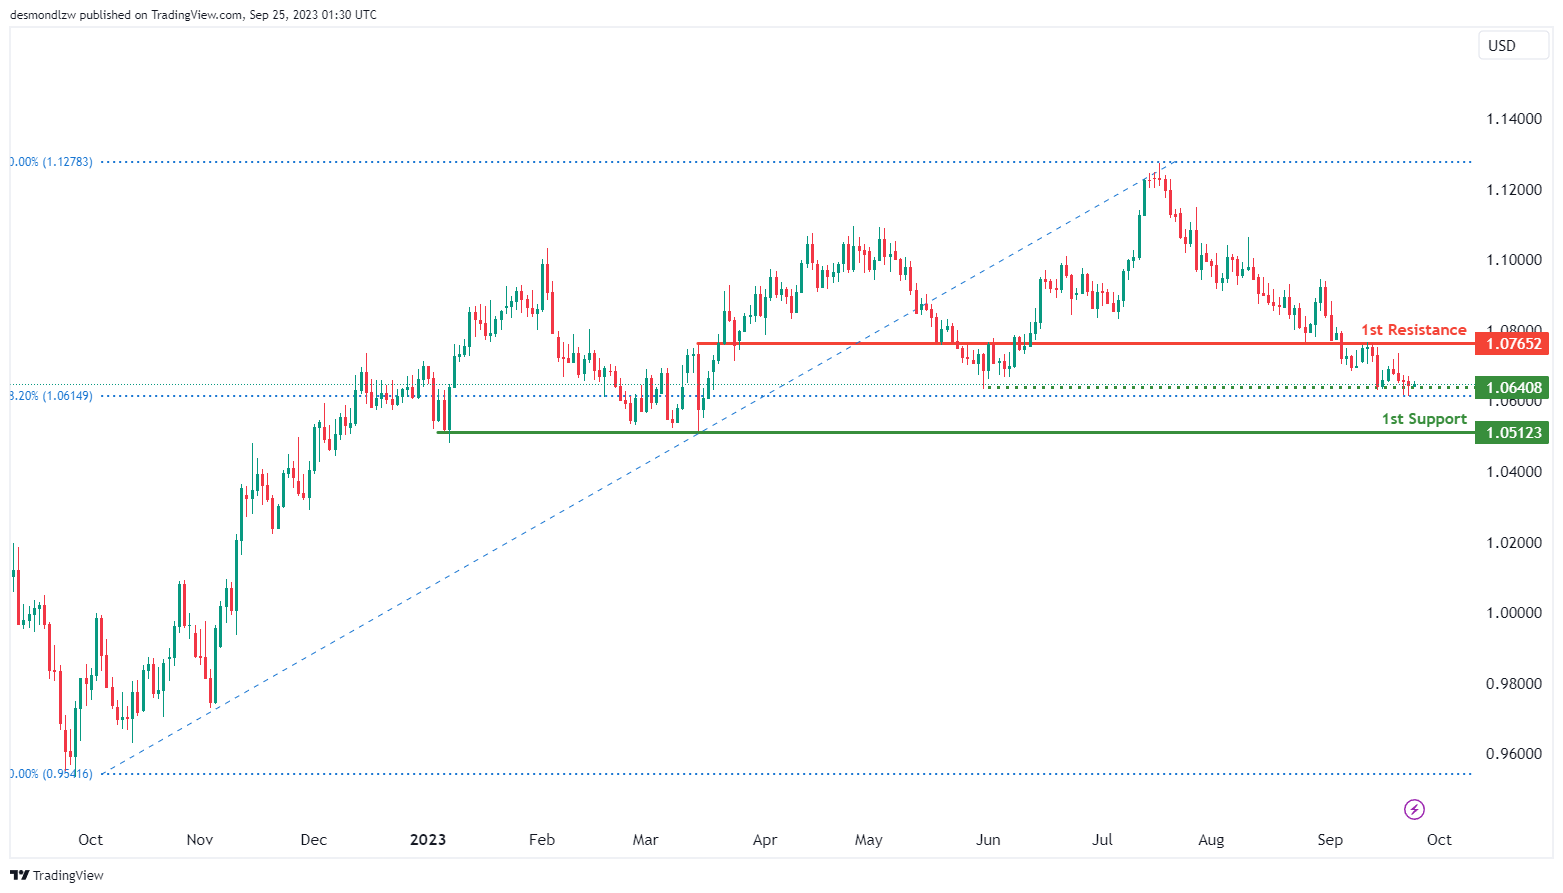
The EUR/USD chart is currently exhibiting a bullish overall momentum. In this context, there is a potential scenario where the price may experience a short-term drop towards the 1st support level at 1.0512 before potentially bouncing from this level and rising towards the 1st resistance at 1.0765.
The 1st support level at 1.0512 holds significance as it is identified as a multi-swing low support. This suggests that it could potentially act as a strong support zone where buying interest may emerge, preventing further downside movement.
Additionally, there is an intermediate support level at 1.0640, which is characterized by the 38.20% Fibonacci Retracement. While this level is not the primary support, it may come into play if the price retraces and provides an additional potential support zone.
On the resistance side, the 1st resistance level at 1.0765 is marked as an overlap resistance. This level could serve as a point of interest for potential bullish movements
EUR/JPY:
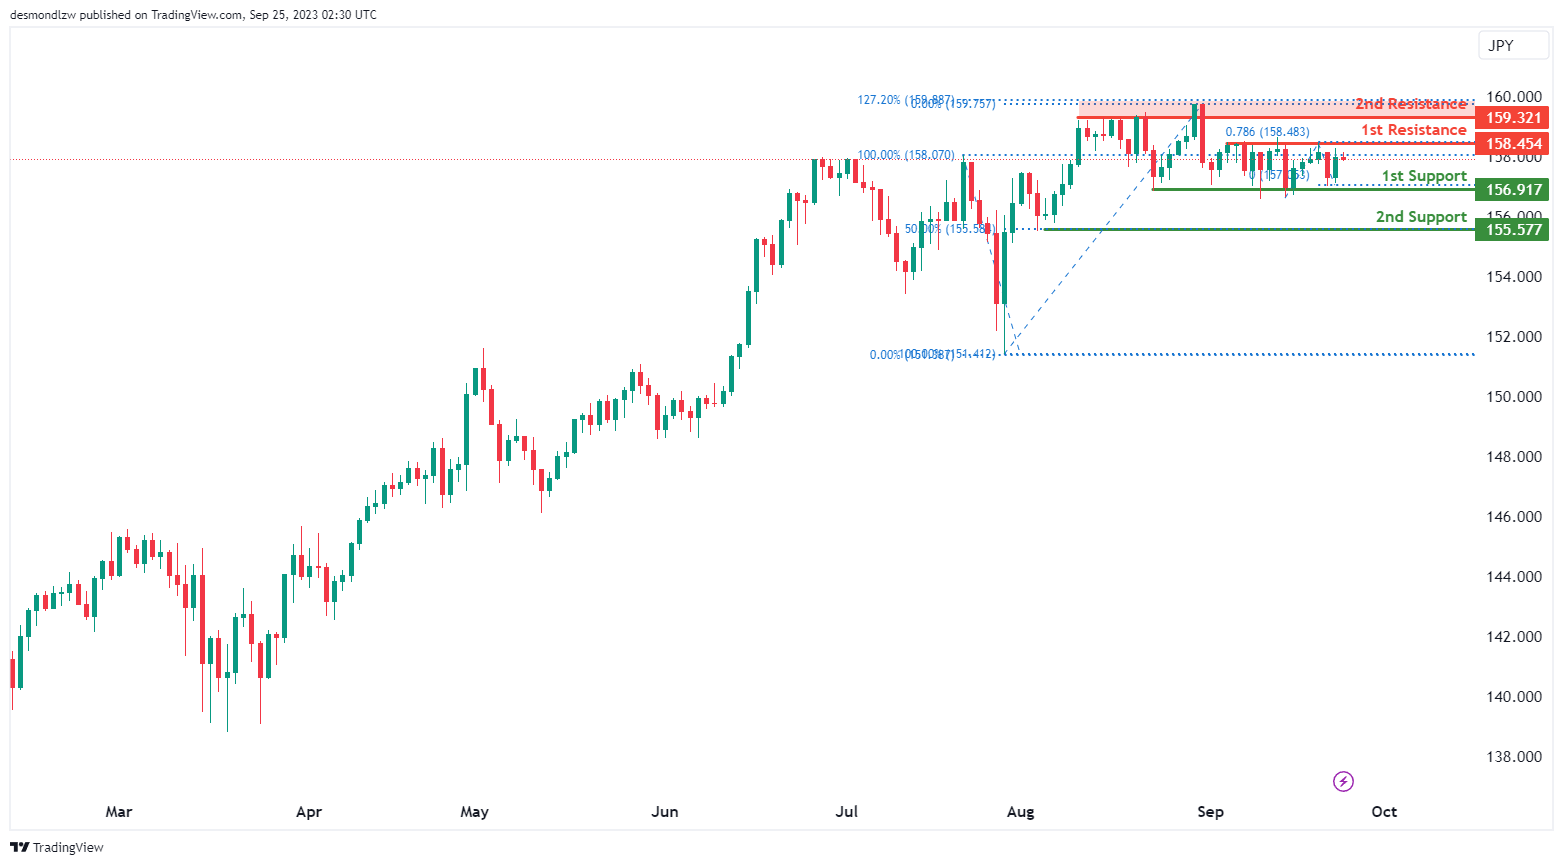
The instrument EUR/JPY currently shows a bearish overall momentum on the chart. There’s potential for a short-term rise towards the 1st resistance before reversing off it and dropping towards the 1st support.
The 1st support at 156.91 is considered good due to its nature as a multi-swing low support.
The 2nd support at 155.57 is also notable as it acts as a swing low support and is associated with the 50% Fibonacci Retracement, offering an additional layer of potential support.
On the resistance side, we have the 1st resistance at 158.45, which is significant because it represents a multi-swing high resistance and is linked to the 78.60% Fibonacci Projection.
Meanwhile, the 2nd resistance at 159.32 is noteworthy as it functions as a pullback resistance and is associated with the 127.20% Fibonacci Extension, suggesting a potential point where the price may reverse its short-term rise and start to drop.
EUR/GBP:
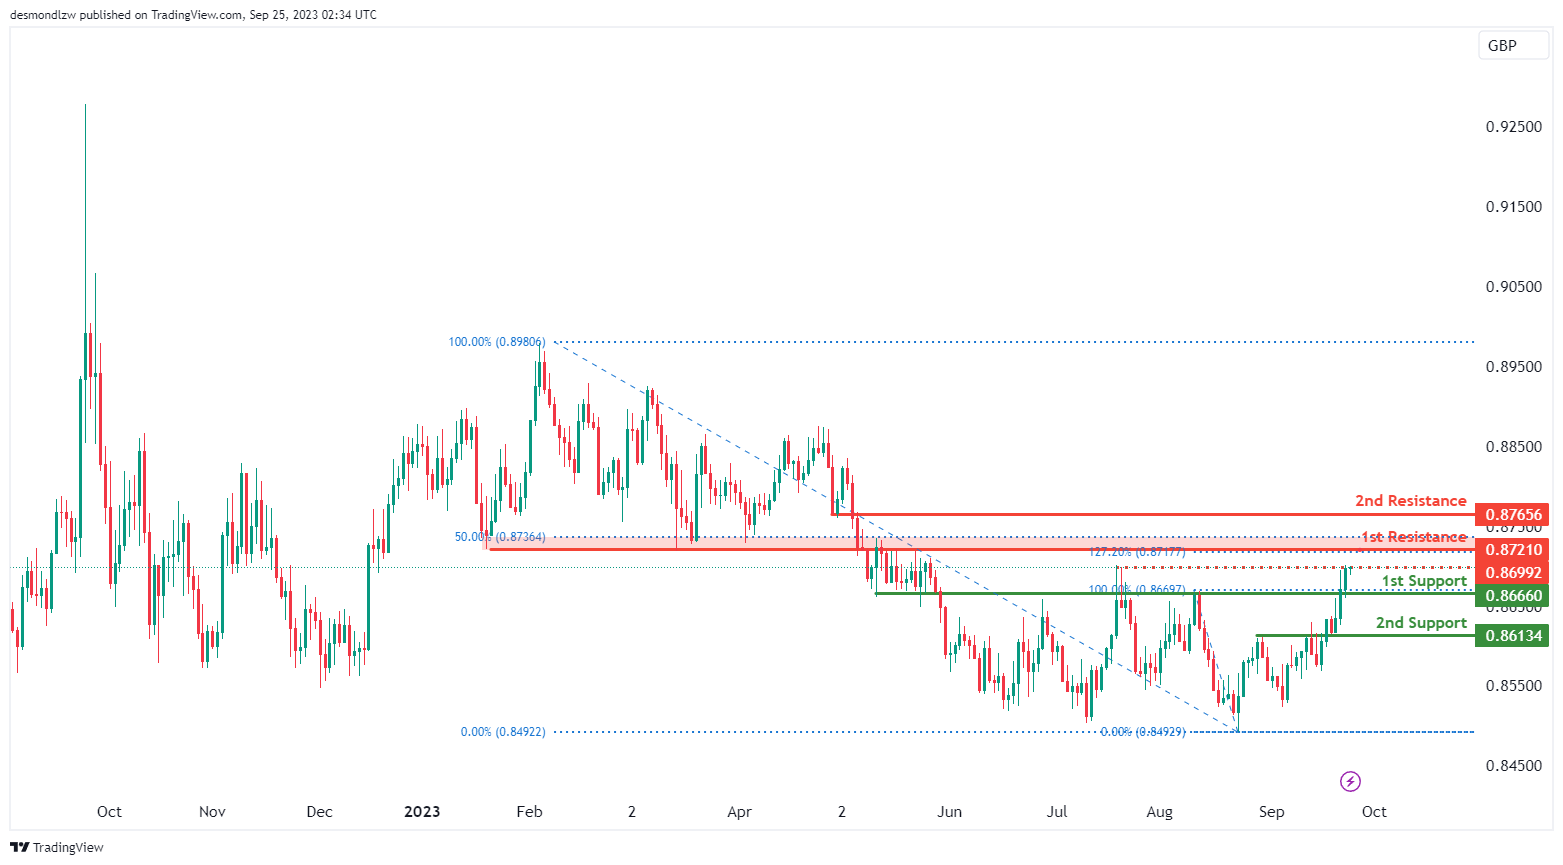
The instrument EUR/GBP currently indicates a bullish overall momentum on the chart, and there’s potential for a bullish continuation towards the 1st resistance.
The 1st support at 0.8666 is considered good due to its nature as a pullback support.
The 2nd support at 0.8613 is also notable as it acts as an overlap support.
On the resistance side, we have the 1st resistance at 0.8721, which is significant because it represents an overlap resistance and is associated with the 127.20% Fibonacci Extension.
The 2nd resistance at 0.8765 is also considered good as it functions as a pullback resistance.
Additionally, there’s an intermediate resistance at 0.8699, which is noteworthy because it acts as a swing high resistance, potentially contributing to the overall resistance levels as the price moves towards the 1st resistance.
GBP/USD:
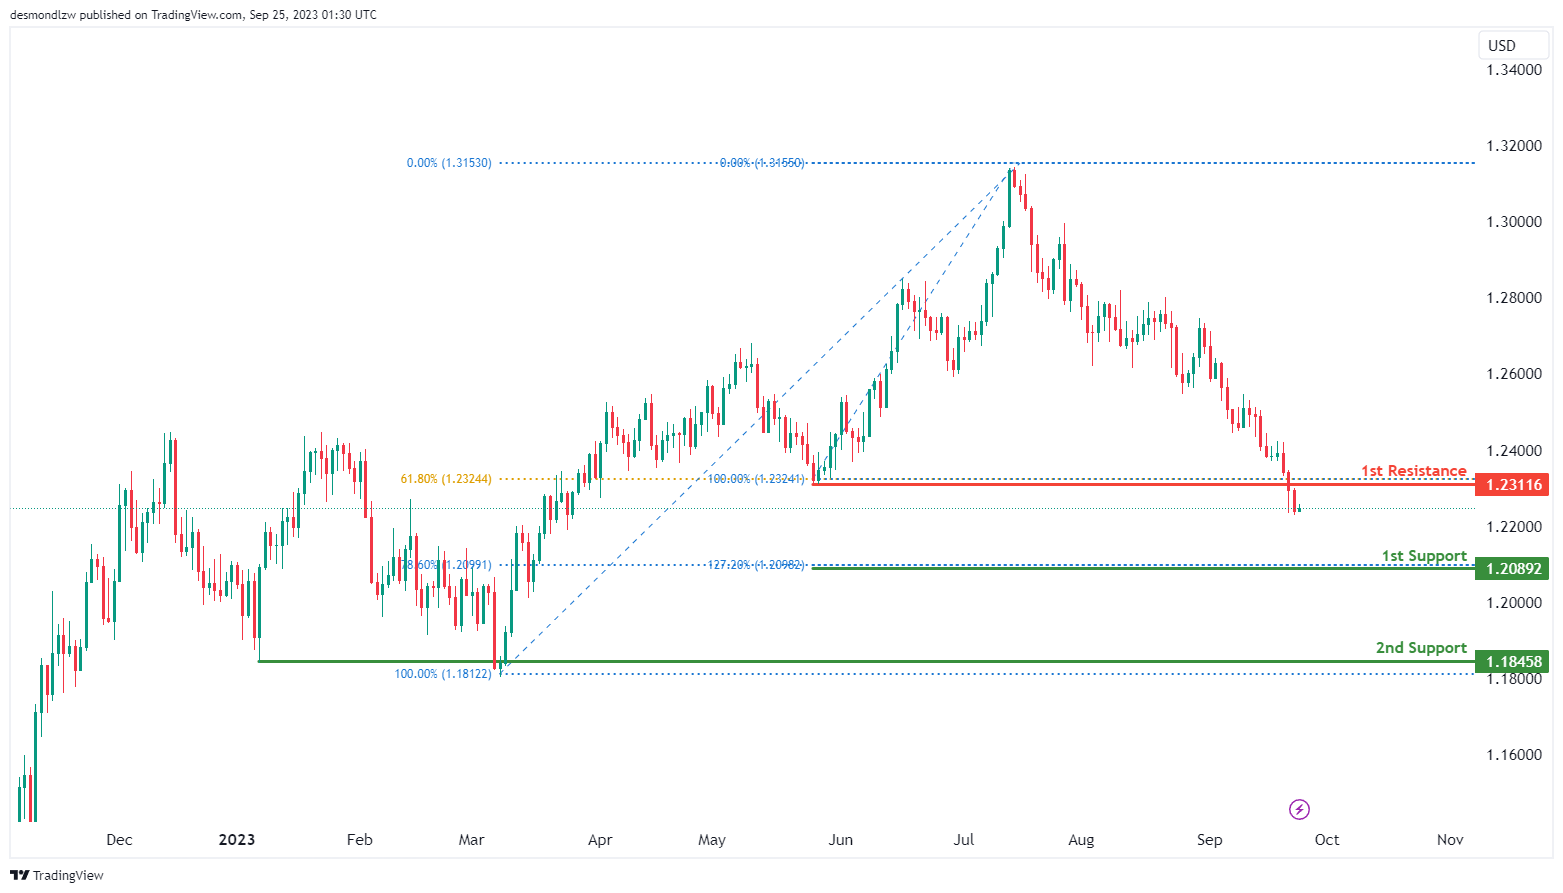
The GBP/USD chart currently reflects a bearish overall momentum. Given this scenario, there is potential for a bearish continuation with a focus on the 1st support level.
The 1st support level at 1.2089 holds particular significance. It is a critical support level due to the confluence of two technical factors: the 127.20% Fibonacci Extension and the 78.60% Fibonacci Retracement. This convergence suggests that 1.2089 could act as a strong support zone where price may find buying interest.
Additionally, the 2nd support level at 1.1845 is another notable area, characterized as a swing low. It signifies a historical level where price has found support in the past.
On the resistance side, the 1st resistance level at 1.2311 stands out as a significant barrier. This level is marked by pullback resistance, indicating a historical point where price retracements have encountered selling pressure. Furthermore, it coincides with the presence of the 61.80% Fibonacci Retracement, adding to its technical significance as a potential resistance zone.
GBP/JPY:
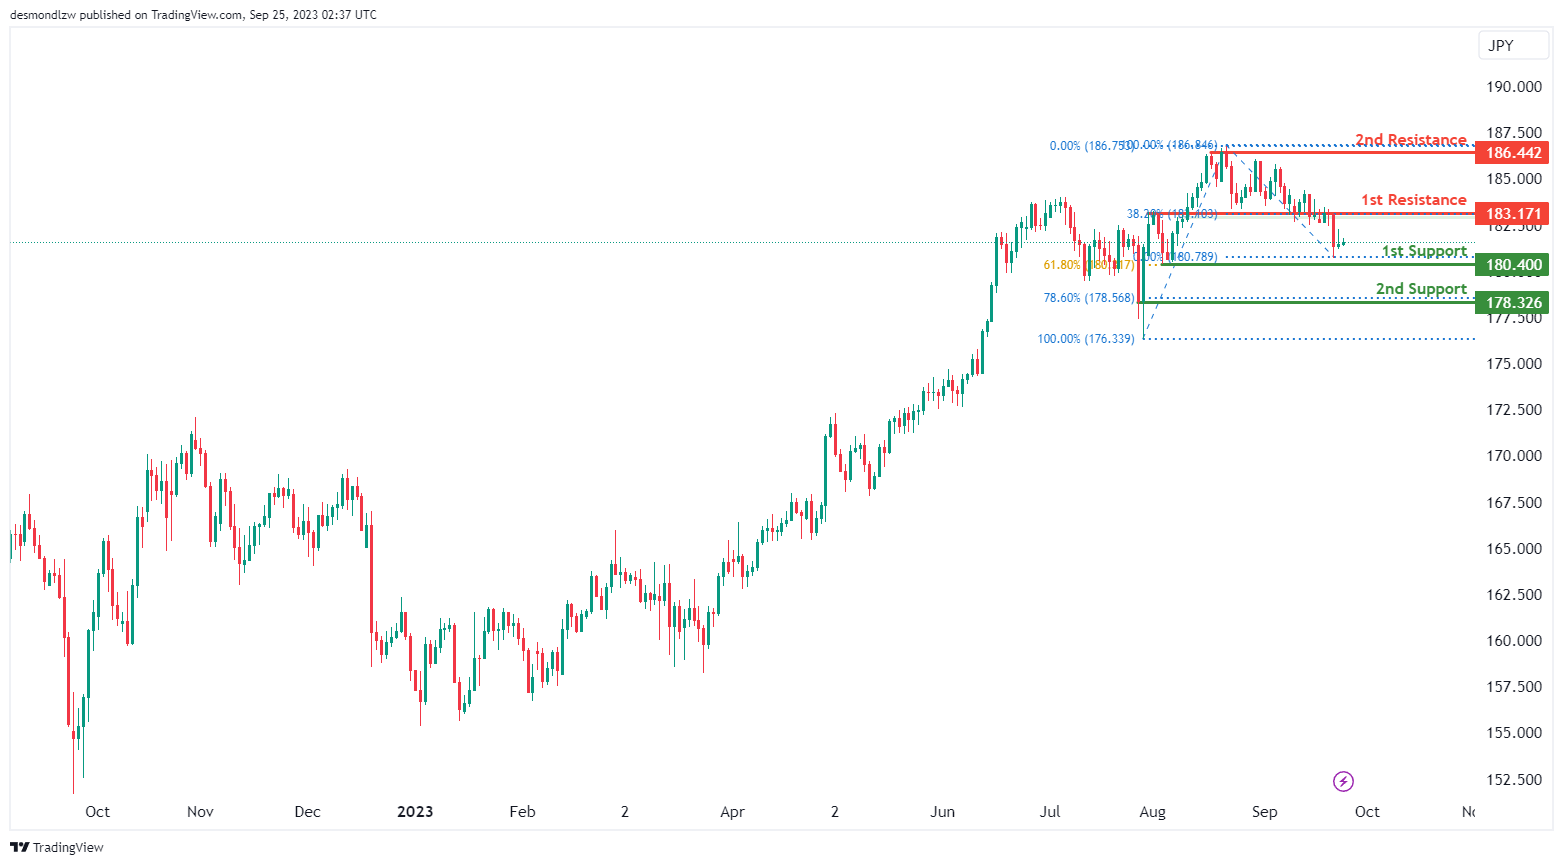
The instrument GBP/JPY currently indicates a bullish overall momentum on the chart, and there’s potential for a bullish continuation towards the 1st resistance.
The 1st support at 180.40 is considered good due to its nature as a swing low support and its association with the 61.80% Fibonacci Retracement.
The 2nd support at 178.32 is also notable as it acts as a swing low support and is associated with the 78.60% Fibonacci Retracement, offering an additional layer of potential support.
On the resistance side, we have the 1st resistance at 183.17, which is significant because it represents an overlap resistance and is linked to the 38.20% Fibonacci Retracement.
Similarly, the 2nd resistance at 186.44 is noteworthy as it functions as a swing high resistance, suggesting potential barriers to further bullish movement at these levels.
USD/CHF:
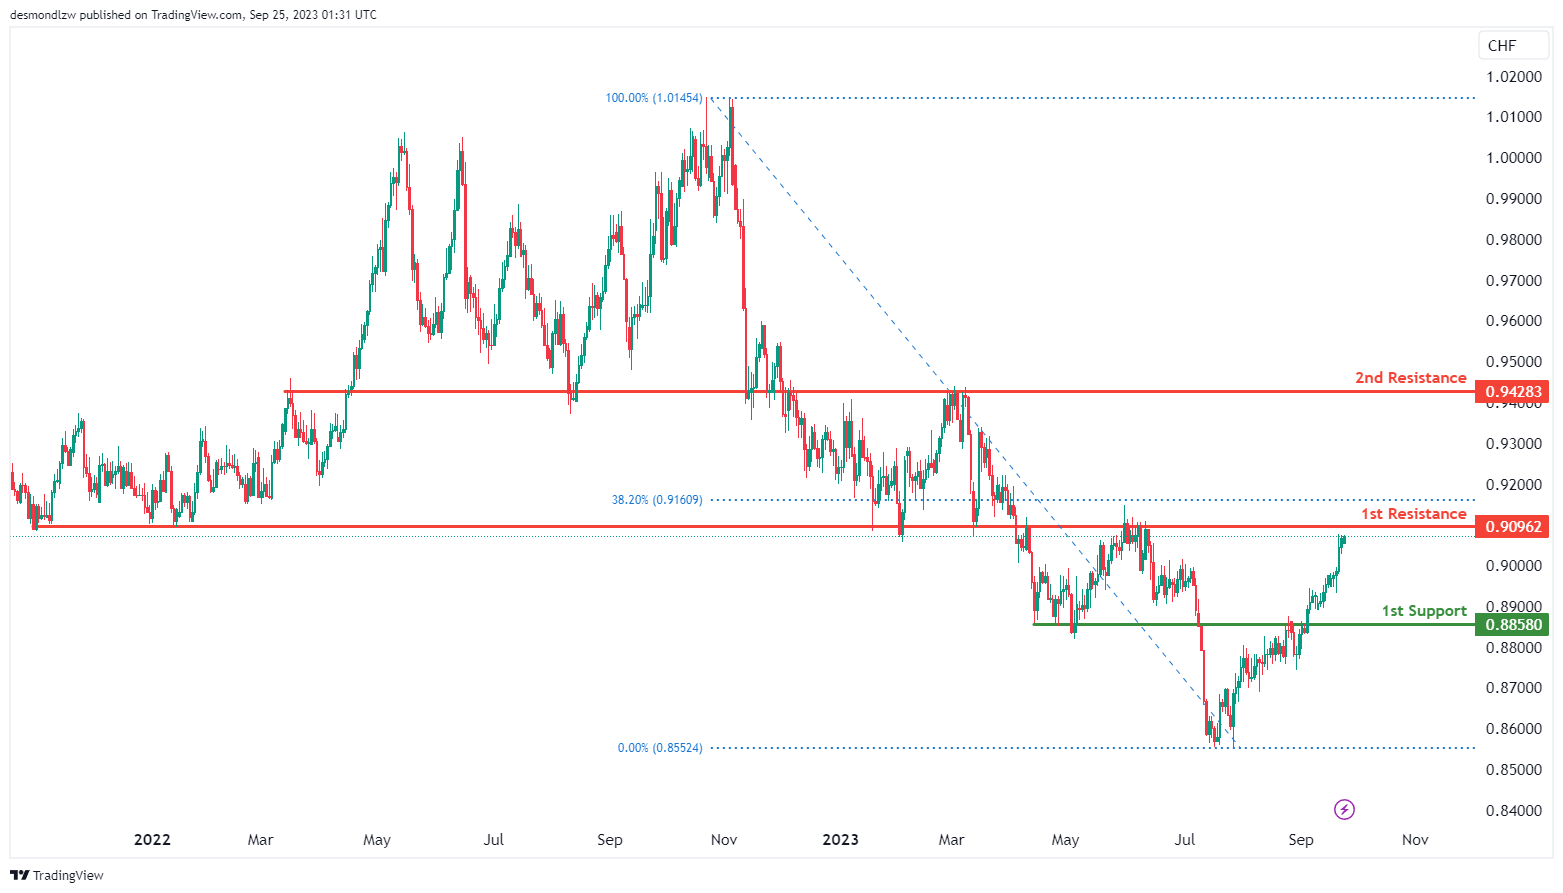
The USD/CHF chart presently indicates a bearish overall momentum. In this context, potential price developments may entail a bearish response upon approaching the 1st resistance level.
The 1st support level at 0.8858 is a crucial support level, characterized as a pullback support. This level could play a significant role in providing support to the price in the event of a bearish move.
On the resistance side, the 1st resistance level at 0.9096 stands out as a notable resistance point. It is marked by the presence of an overlap resistance, which often carries significance in technical analysis. Additionally, this level coincides with the 38.20% Fibonacci Retracement, adding to its potential importance as a barrier to further upward price movement.
Furthermore, the 2nd resistance level at 0.9424 is another noteworthy resistance level, characterized by an overlap resistance.
USD/JPY:
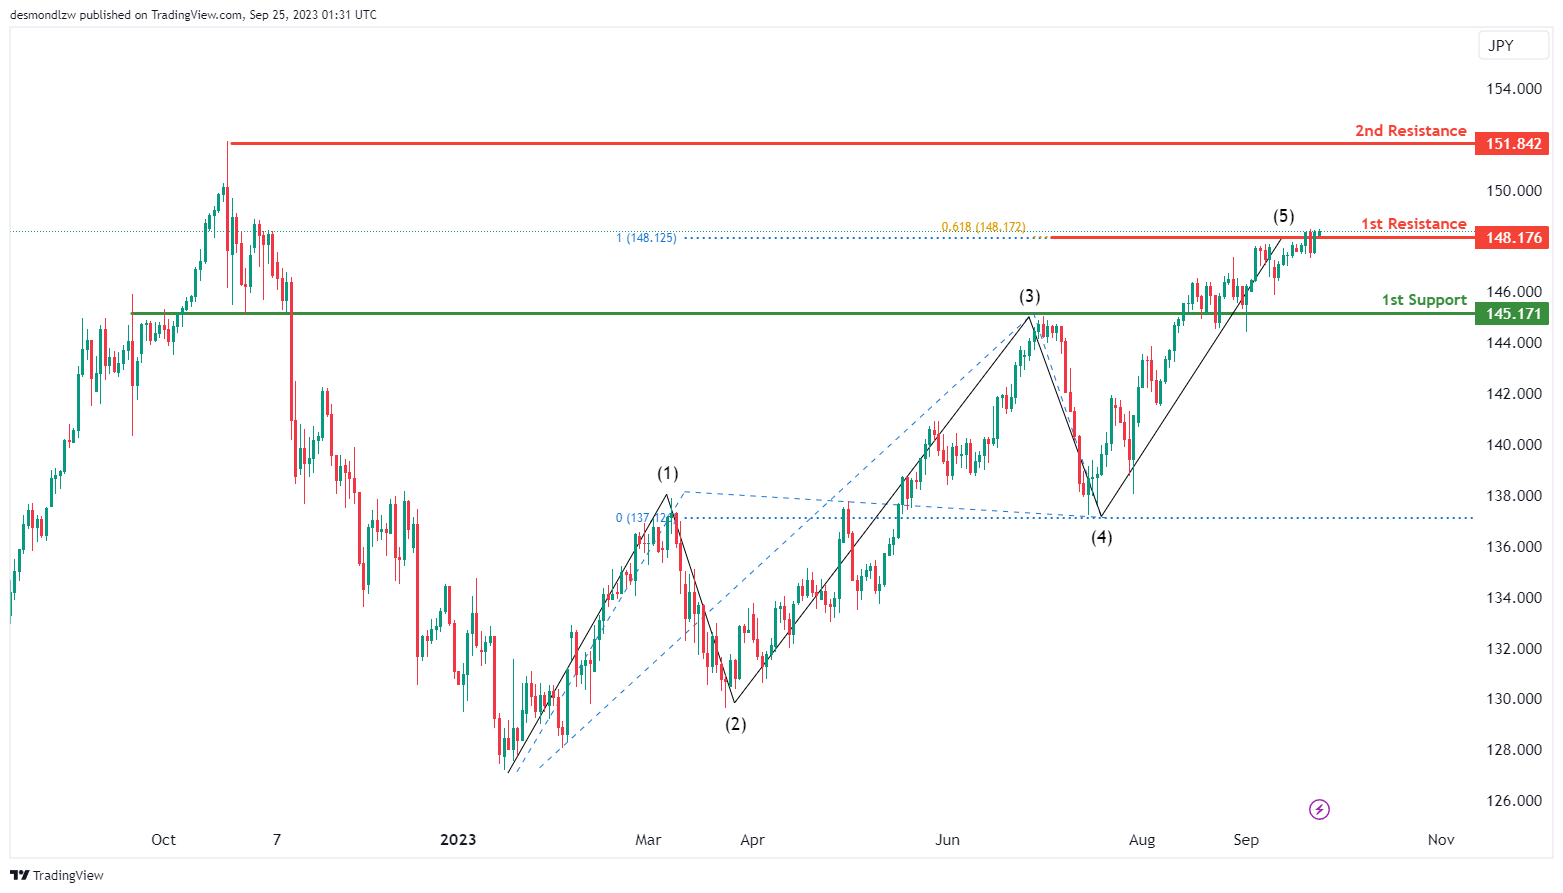
The USD/JPY chart currently reflects a bearish overall momentum. In this bearish scenario, the potential price action suggests a bearish reaction as it approaches the 1st resistance level.
The 1st support level at 145.17 holds significant importance, characterized as an overlap support. This level may play a crucial role in providing support to the price in case of a bearish move.
On the resistance side, the 1st resistance at 148.17 is a notable level to watch. It is marked by the presence of swing high resistance, and it also exhibits a confluence of technical factors, including the 100% Fibonacci Projection and the 61.80% Fibonacci Projection. This suggests that the 148.17 level may act as a strong barrier to further upward price movements.
Additionally, the 2nd resistance level at 151.84 represents another notable resistance point, characterized by swing high resistance.
USD/CAD:
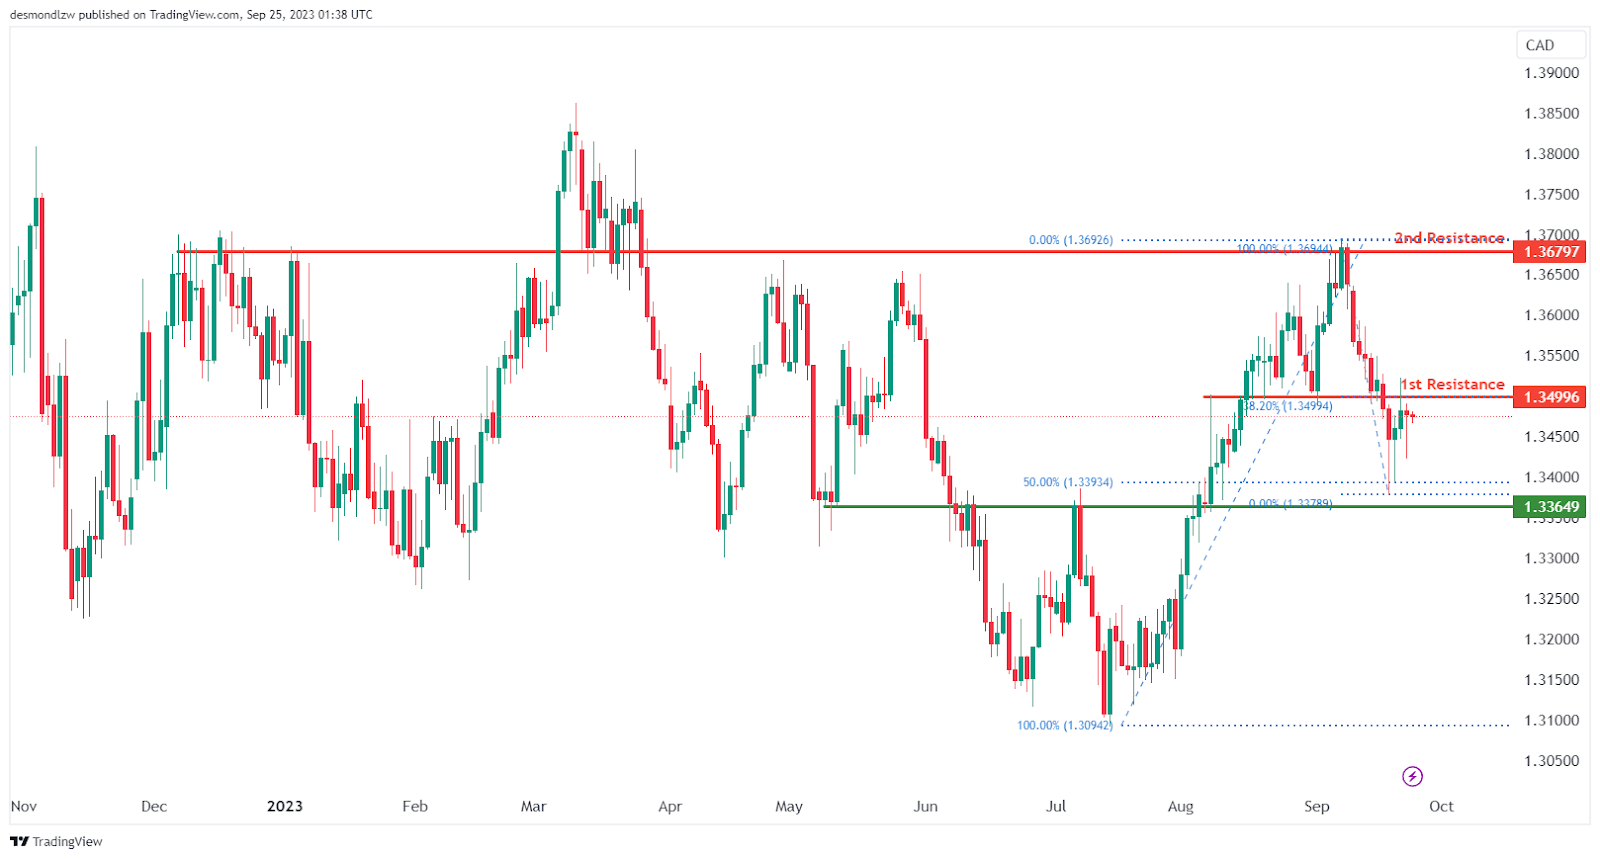
The chart for USD/CAD is currently indicating an overall bearish momentum. In this scenario, there is a potential setup for a bearish reaction off the 1st resistance level and drop towards the 1st support level.
The 1st resistance level at 1.3499 is identified as an overlap resistance that aligns with the 38.20% Fibonacci retracement level. Further up, the 2nd resistance level at 1.3679 is also marked as an overlap resistance level, further indicating its potential significance as a point of resistance.
To the downside, the 1st support level at 1.3365 is identified as an overlap support that coincides with the 50.00% Fibonacci Retracement level, offering a strong level of potential support.
AUD/USD:
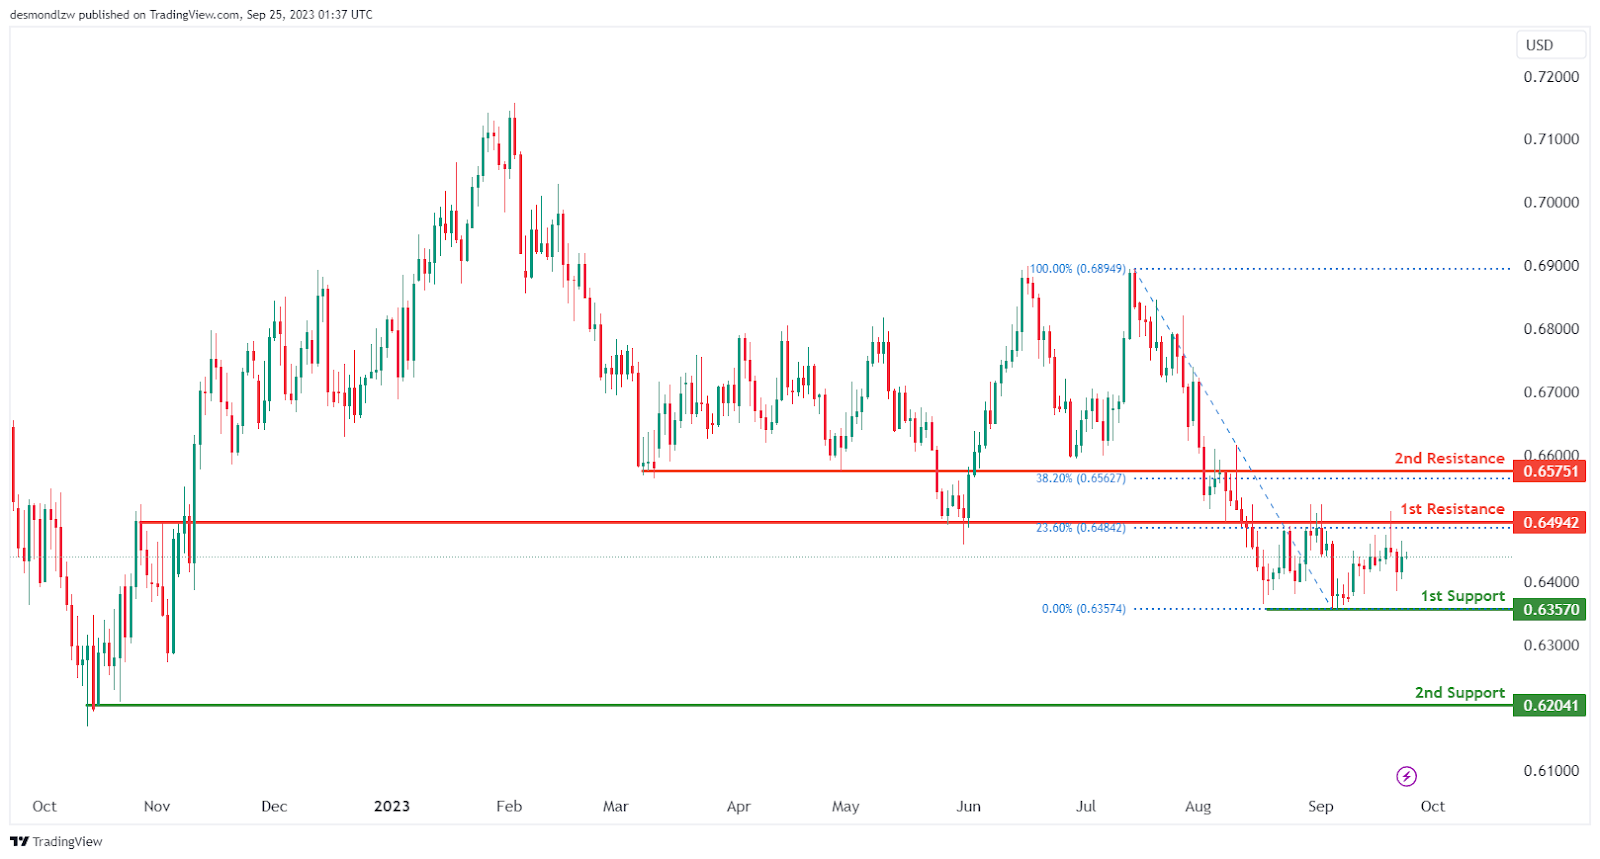
The AUD/USD chart is currently displaying an overall neutral momentum, suggesting that price may range-bound or oscillate between the 1st support and the1st resistance levels.
The 1st support level at 0.6357 is identified as a pullback support while the 2nd support level at 0.6204 is noted as a swing-low support, suggesting a potential strong support level in the past.
To the upside, the 1st resistance level at 0.6494 is identified as an overlap resistance that aligns with the 23.60% Fibonacci retracement level. Further up, the 2nd resistance level at 0.6575 is also marked as an overlap resistance that coincides with the 38.20% Fibonacci retracement level.
NZD/USD
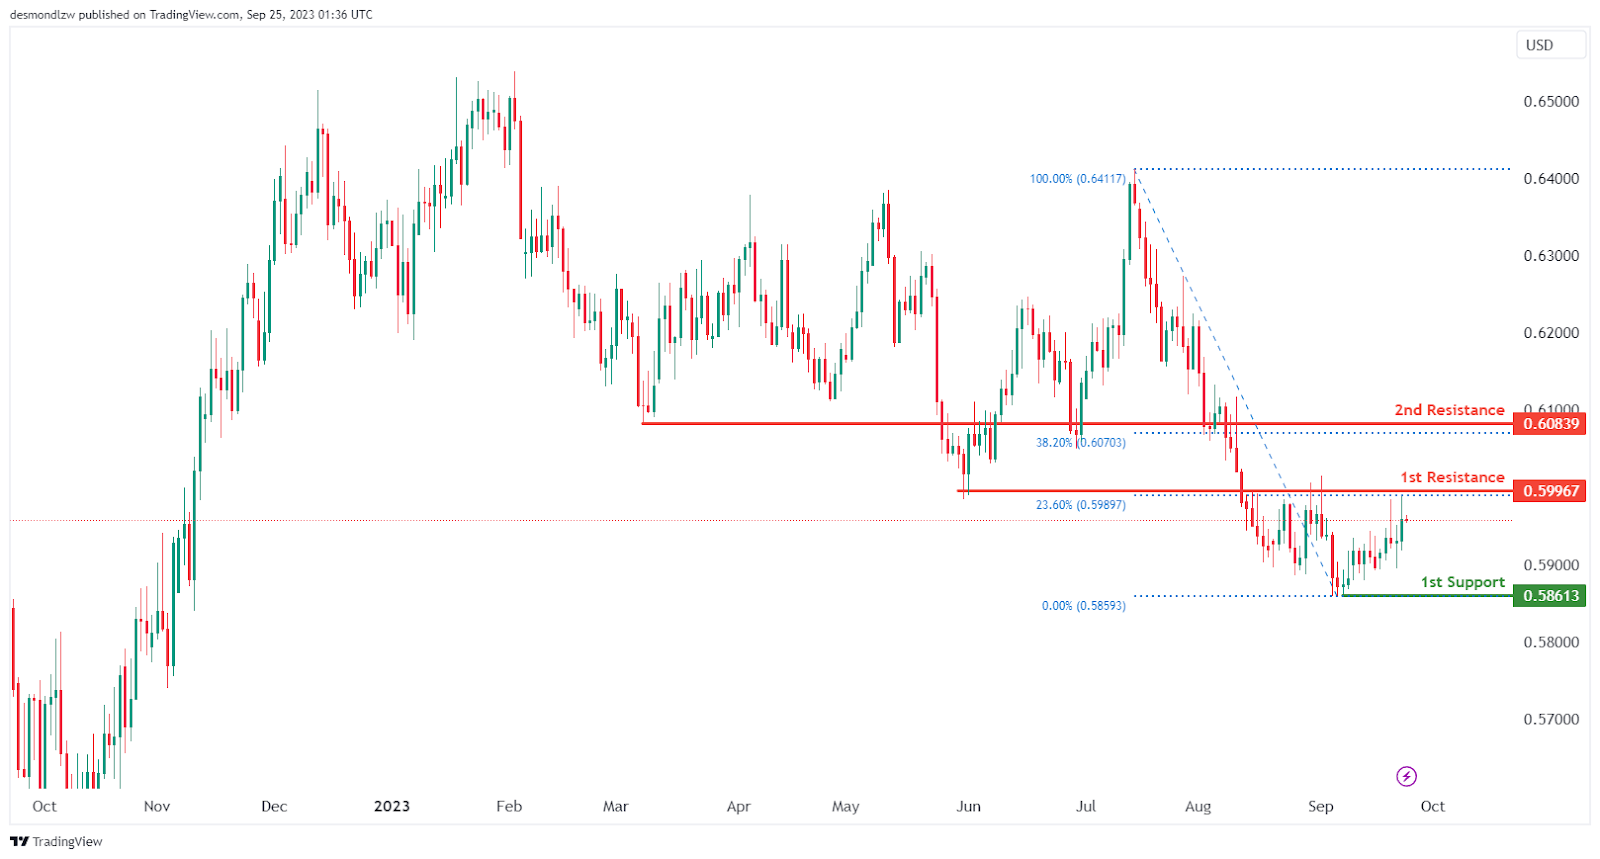
The NZD/USD chart is currently showing an overall neutral momentum, suggesting that the price may consolidate or move within the 1st support and the 1st resistance levels.
The 1st support level at 0.5861 is identified as a pullback support, where price found strong support in early September.
To the upside, the 1st resistance level at 0.5997 is identified as an overlap resistance that aligns with the 23.60% Fibonacci retracement level. Further up, the 2nd resistance level at 0.6084 is also marked as an overlap resistance that coincides with the 38.20% Fibonacci retracement level.
DJ30:
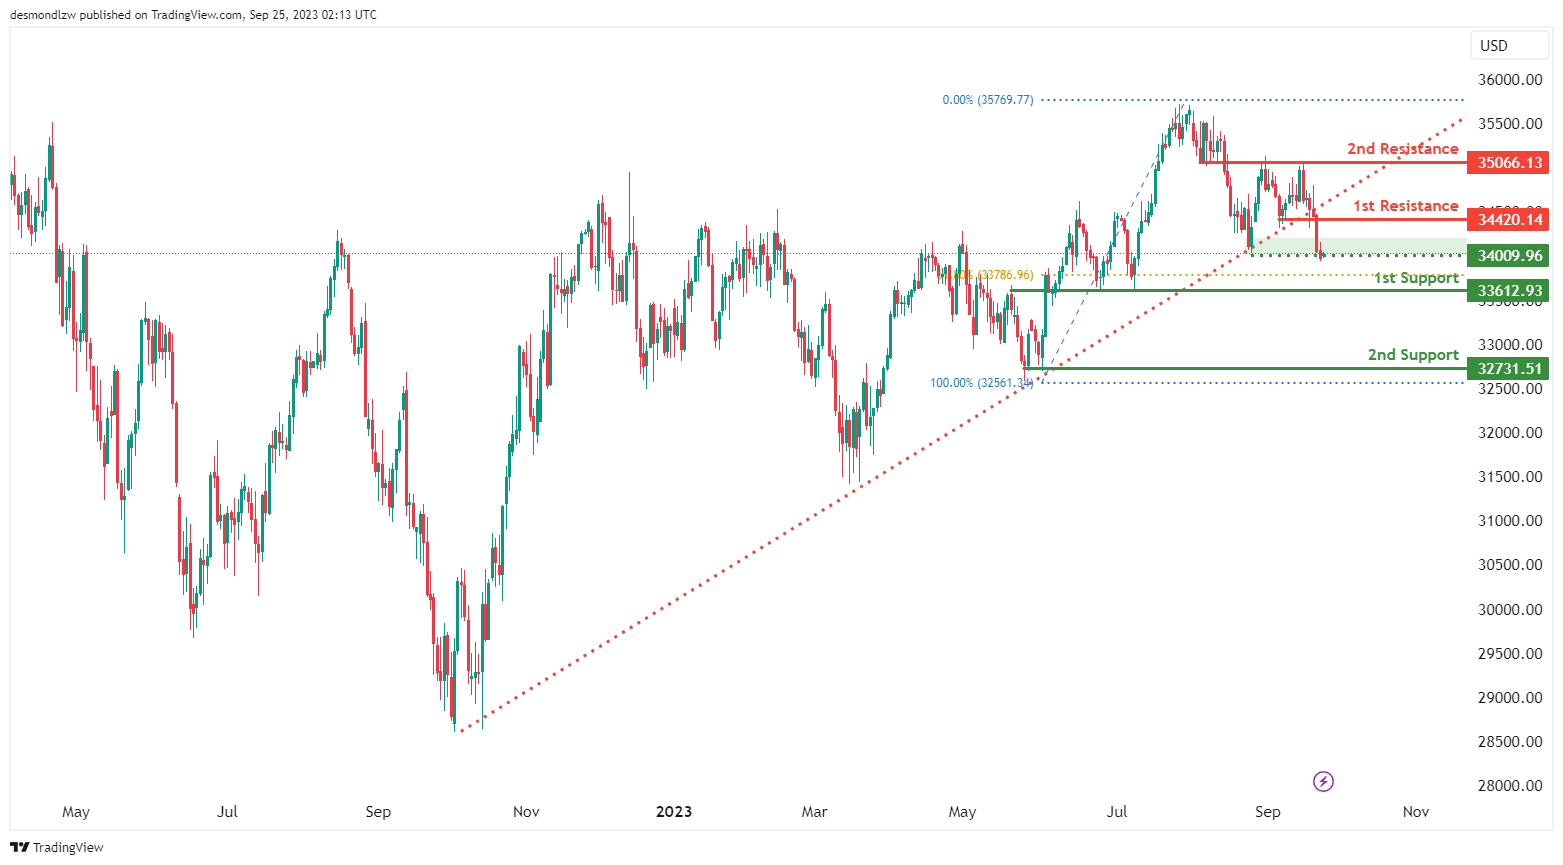
The instrument DJ30 currently exhibits a bearish overall momentum on the chart, and this bearish momentum has been triggered by the price breaking below an ascending support line. There’s potential for a bearish continuation towards the 1st support at 33612.93.
The 1st support at 33612.93 is considered strong due to its nature as an overlap support, and it’s associated with the 61.80% Fibonacci Retracement, indicating a robust level of potential support.
The 2nd support at 32731.51 is also notable as it acts as a multi-swing low support, offering an additional layer of potential support.
On the resistance side, we have the 1st resistance at 34420.14, which is significant because it represents a pullback resistance.
Similarly, the 2nd resistance at 35066.13 is also an overlap resistance, suggesting potential barriers to further bullish movement at these levels.
GER30:
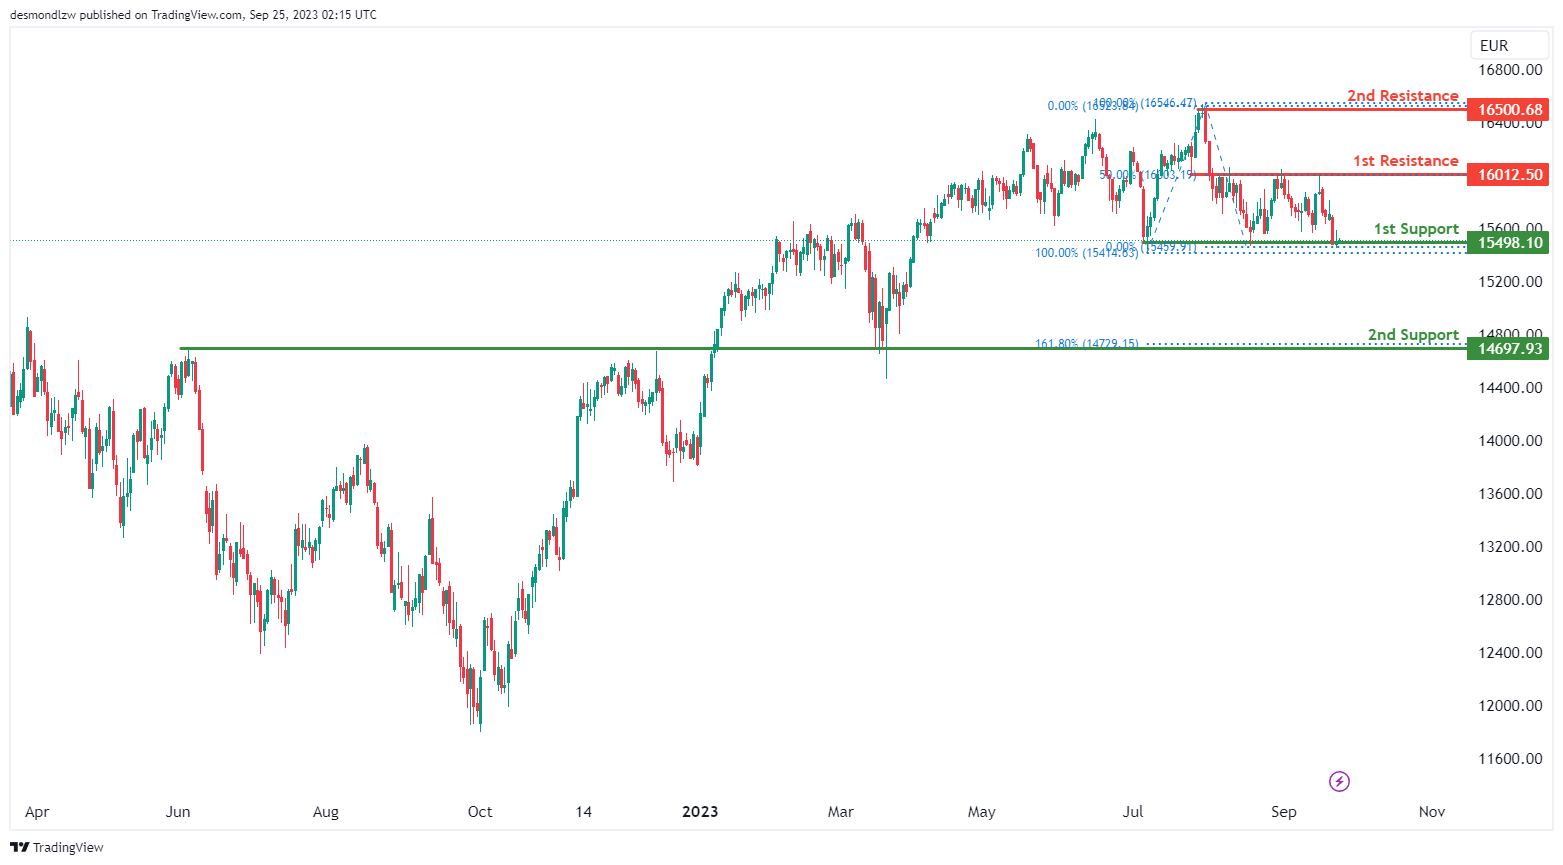
The instrument GER30 currently suggests a bullish overall momentum on the chart. There’s potential for a bullish bounce off the 1st support at 15498.10 and a move towards the 1st resistance.
The 1st support at 15498.10 is considered strong due to its nature as a multi-swing low support.
The 2nd support at 14697.93 is also notable as it acts as an overlap support and is associated with the 161.80% Fibonacci Extension, providing another layer of potential support.
On the resistance side, we have the 1st resistance at 16012.50, which is significant because it represents an overlap resistance and is linked to the 50% Fibonacci Retracement.
Similarly, the 2nd resistance at 16500.68 is noteworthy as it functions as a swing high resistance, suggesting potential barriers to further bullish movement at these levels.
US500
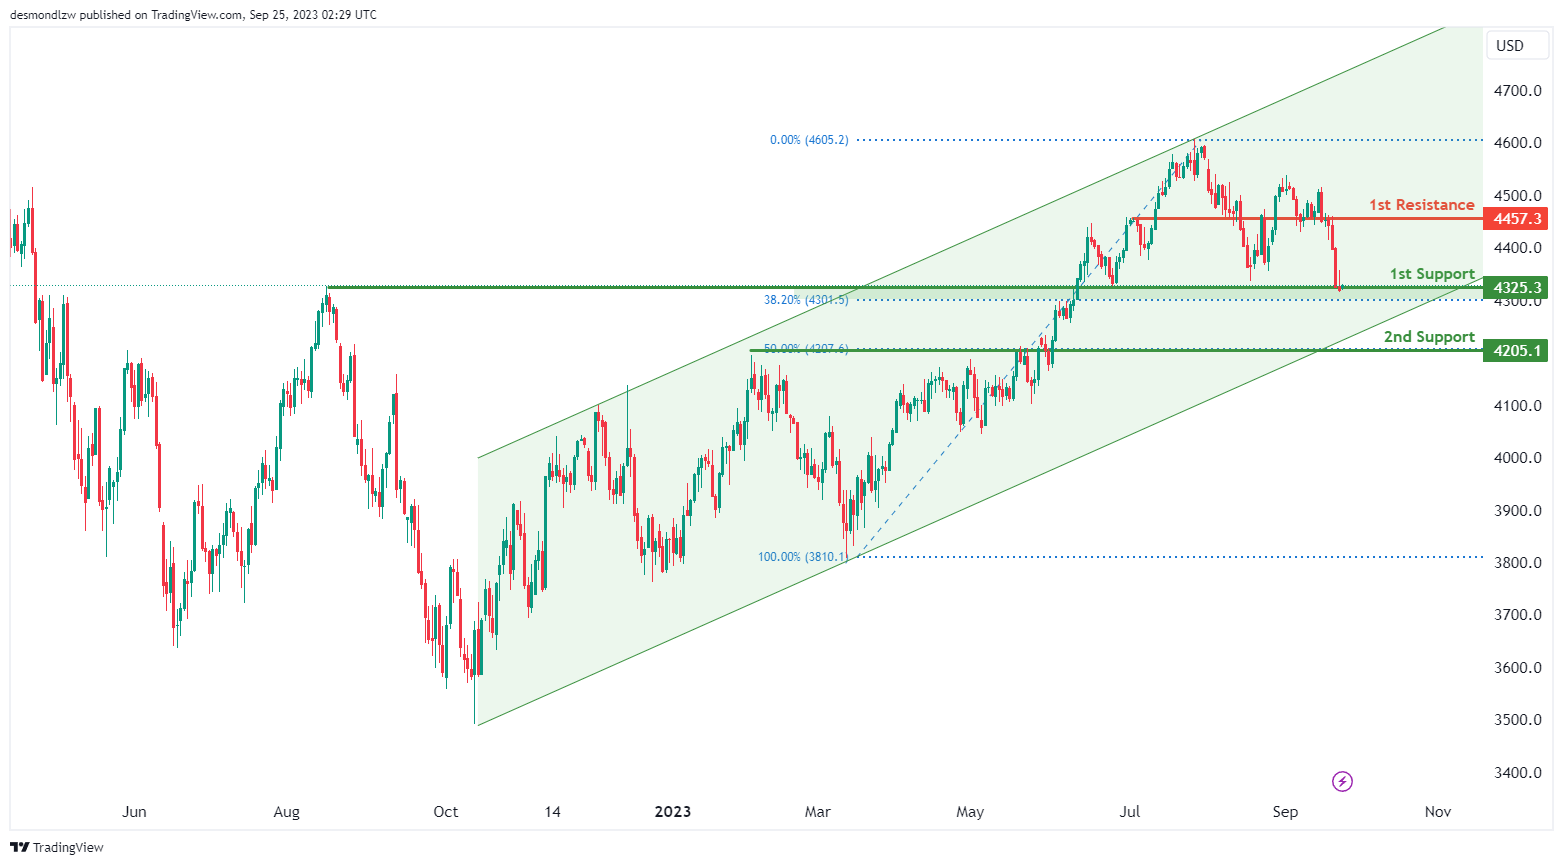
The instrument US500 currently indicates a bullish overall momentum on the chart, and this momentum is supported by the fact that the price is in a bullish ascending channel. There’s potential for a bullish bounce off the 1st support at 4325.3 and a move towards the 1st resistance.
The 1st support at 4325.3 is considered strong due to its nature as an overlap support and its association with the 38.20% Fibonacci Retracement.
The 2nd support at 4205.1 is also notable as it acts as a pullback support and is associated with the 50% Fibonacci Retracement, providing an additional layer of potential support.
On the resistance side, we have the 1st resistance at 4457.3, which is significant because it represents a pullback resistance, suggesting a potential barrier to further bullish movement at this level.
BTC/USD:
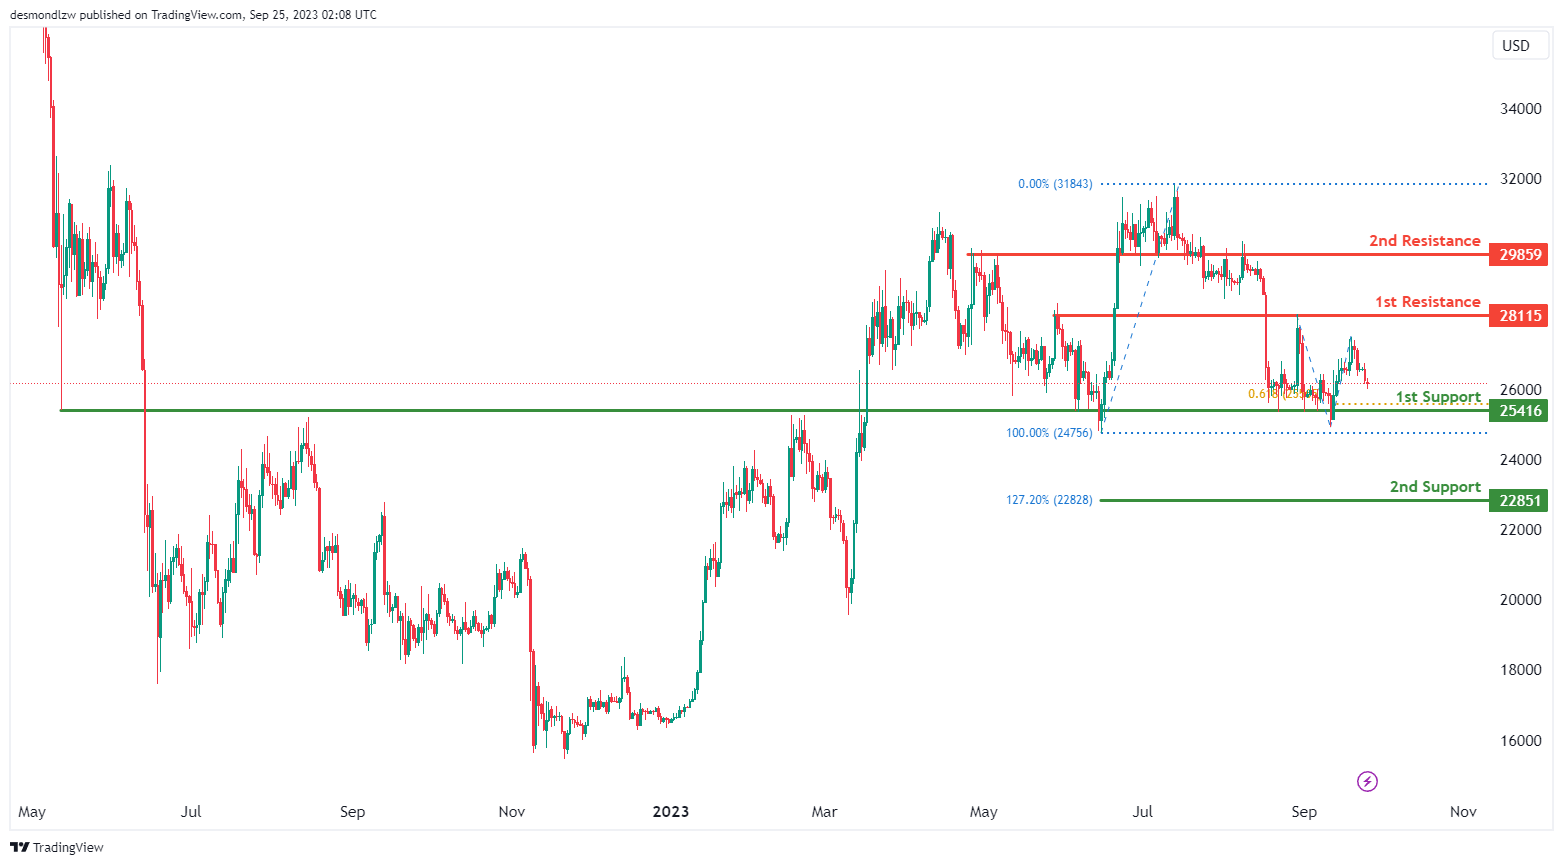
The instrument BTC/USD currently has a bearish overall momentum on the chart, and factors contributing to this bearish momentum include the potential for a bearish continuation towards the 1st support at 25416.
The 1st support at 25416 is considered strong due to its nature as an overlap support and its association with the 61.80% Fibonacci Projection, indicating a solid level of potential support.
The 2nd support at 22851 is also noteworthy as it is associated with the 127.20% Fibonacci Extension, providing another layer of potential support.
On the resistance side, we have the 1st resistance at 28115, which is significant because it represents an overlap resistance.
Similarly, the 2nd resistance at 29859 is also an overlap resistance, suggesting potential barriers to further bullish movement at these levels.
ETH/USD:
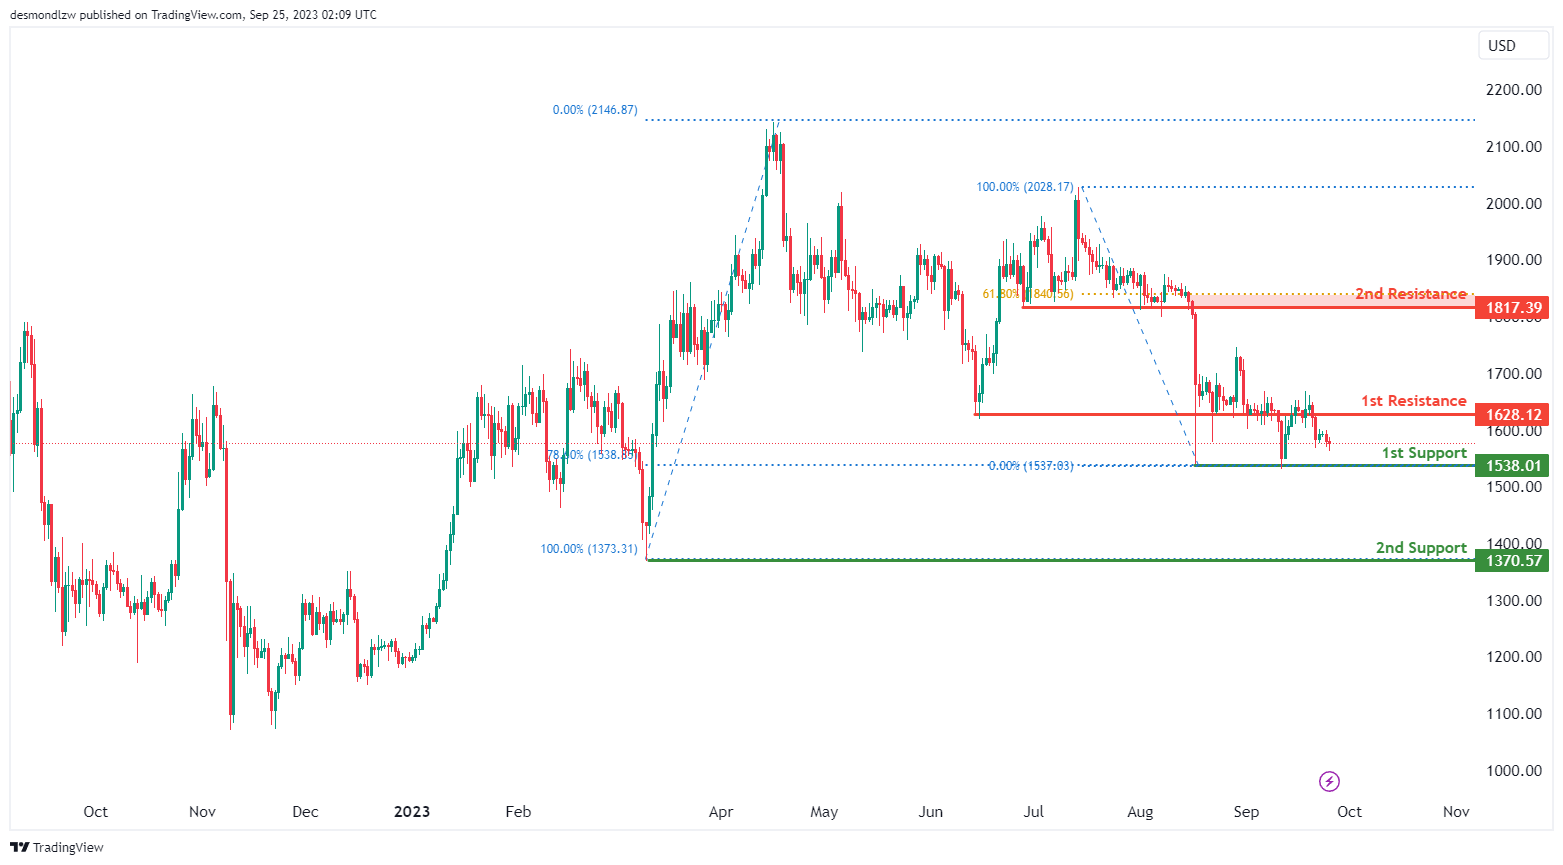
The instrument ETH/USD currently exhibits a bearish overall momentum on the chart, and there’s potential for a bearish continuation towards the 1st support at 1538.01.
The 1st support at 1538.01 is considered strong due to its nature as a multi-swing low support, and it’s associated with the 78.60% Fibonacci Retracement, indicating a robust level of potential support.
The 2nd support at 1370.57 is also notable as it acts as a swing low support, offering an additional layer of potential support.
On the resistance side, we have the 1st resistance at 1628.12, which is significant because it represents an overlap resistance.
Meanwhile, the 2nd resistance at 1817.39 is noteworthy as it functions as a pullback resistance and is associated with the 61.80% Fibonacci Retracement, suggesting potential barriers to further bullish movement at this level.
WTI/USD:
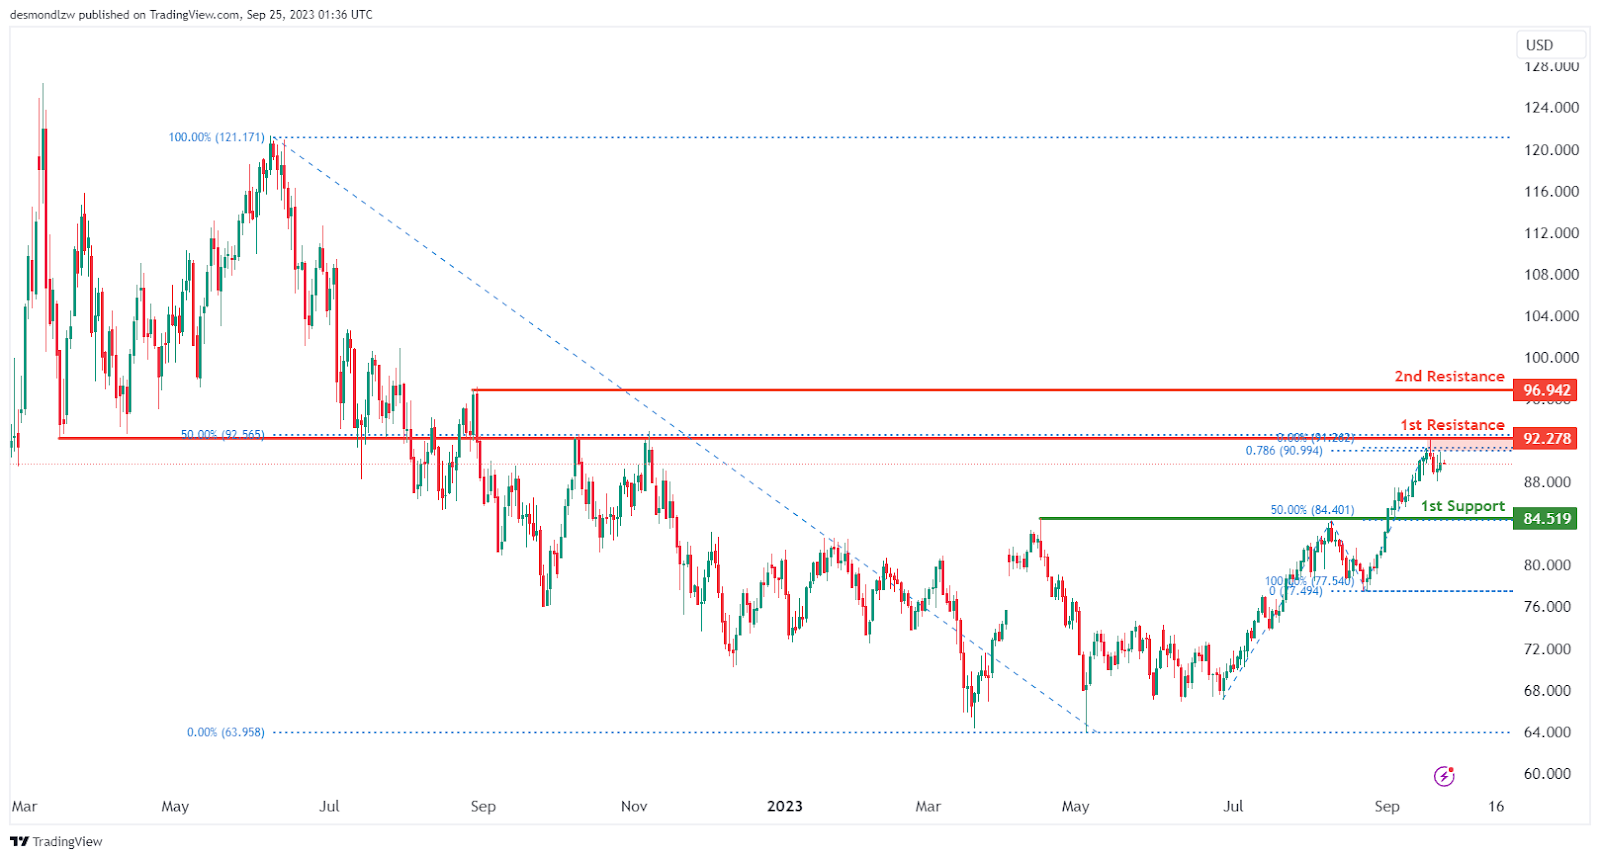
The WTI (West Texas Intermediate) chart currently exhibits a weak bearish momentum with low confidence with price potentially making a bearish reaction off the 1st resistance level.
The 1st resistance level at 92.28 is identified as an overlap resistance that aligns with the 78.60% Fibonacci projection level while the 2nd resistance level at 96.94 is marked as a pullback resistance; this level may act as a significant barrier to any potential upward movements.
To the downside, the 1st support level at 84.52 is identified as a pullback support that coincides with the 50.0% Fibonacci retracement level, a level where price could potentially find strong support.
XAU/USD (GOLD):
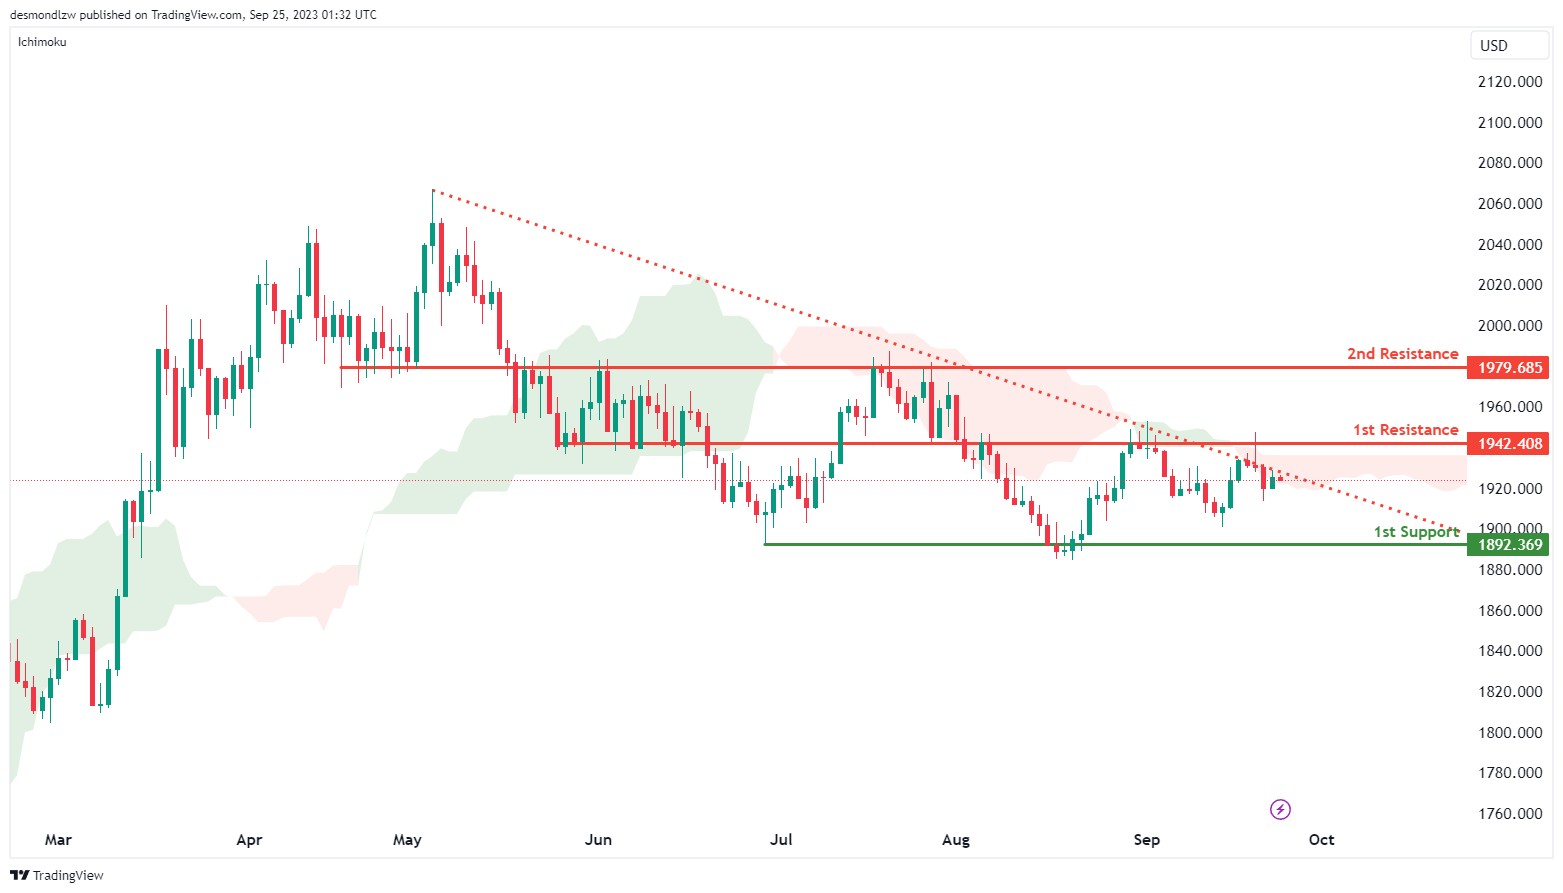
The XAU/USD chart is currently showing a bearish overall momentum. This bearish sentiment is influenced by the fact that the price is below the bearish Ichimoku cloud and is also trading beneath a major descending trend line, indicating a prevailing bearish trend.
Looking ahead, there is a potential scenario where the price could experience a short-term rise towards the 1st resistance level before eventually reversing and moving towards the 1st support.
The 1st support level at 1892.36 is significant and can be described as an overlap support. It is an important level to watch for potential bullish reversals or increased buying interest.
On the resistance side, the 1st resistance at 1942.40 is noteworthy due to its characterization as an overlap resistance. This level may act as a barrier to further price increases.
Additionally, the 2nd resistance at 1979.68 is another notable resistance level, also marked as an overlap resistance.
AUD/USD Daily Report
Daily Pivots: (S1) 0.6408; (P) 0.6437; (R1) 0.6469; More...
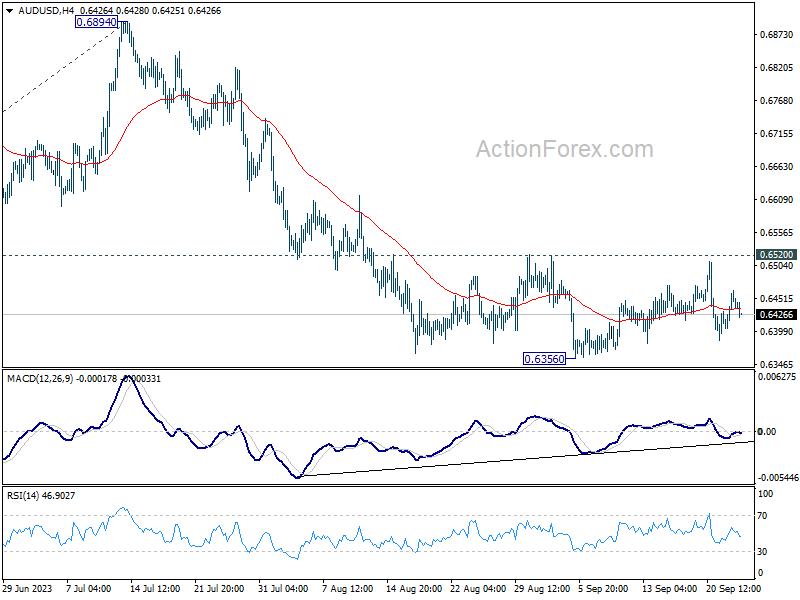
AUD/USD is staying in consolidation from 0.6356 and outlook is unchanged. Intraday bias remains neutral at this point. Further decline is expected as long as 0.6520 resistance holds. Break of 0.6356 will resume larger down trend to 100% projection of 0.7156 to 0.6457 from 0.6894 at 0.6195.
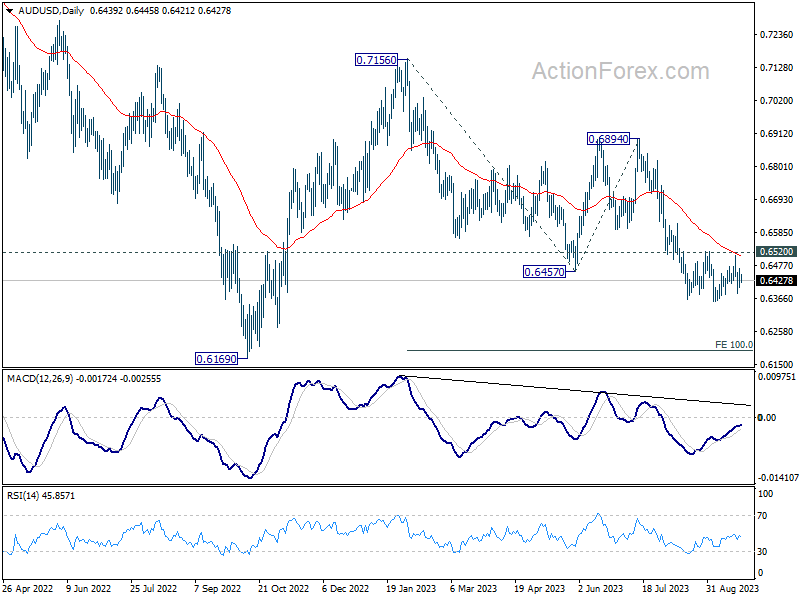
In the bigger picture, down trend from 0.8006 (2021 high) is possibly still in progress. Decisive break of 0.6169 will target 61.8% projection of 0.8006 to 0.6169 to 0.7156 at 0.6021. This will now remain the favored case as long as 0.6894, in case of strong rebound.
Aussie Dips as Evergrande Concerns Resurface; More Global Inflation Data Ahead
Asian stock markets commenced the week with divergent performances. While Japan's Nikkei showed resilience, bouncing back after enduring its most challenging week this year, Hong Kong's stocks weren't as fortunate. The uncertainty surrounding China Evergrande Group's protracted debt restructuring initiative ignited a fresh wave of selling, impacting not just Evergrande but also its contemporaries. Consequently, apprehensions around the beleaguered property sector have once again come to the fore.
In the currency markets, mixed market sentiments have cast a shadow Australian and New Zealand Dollar, making them a tad softer. Swiss Franc seems eager to further its selloff from last week. Meanwhile, both Dollar and Euro, along with Canadian Dollar, show signs of firmness. British Pound is making an attempt at a comeback, but the momentum remains tepid. Meanwhile, the Yen is leaning on the softer end of the spectrum. As the week progresses, eyes will be keenly set on inflation data releases from Australia, Eurozone, and US, potentially guiding the subsequent moves in currency markets.
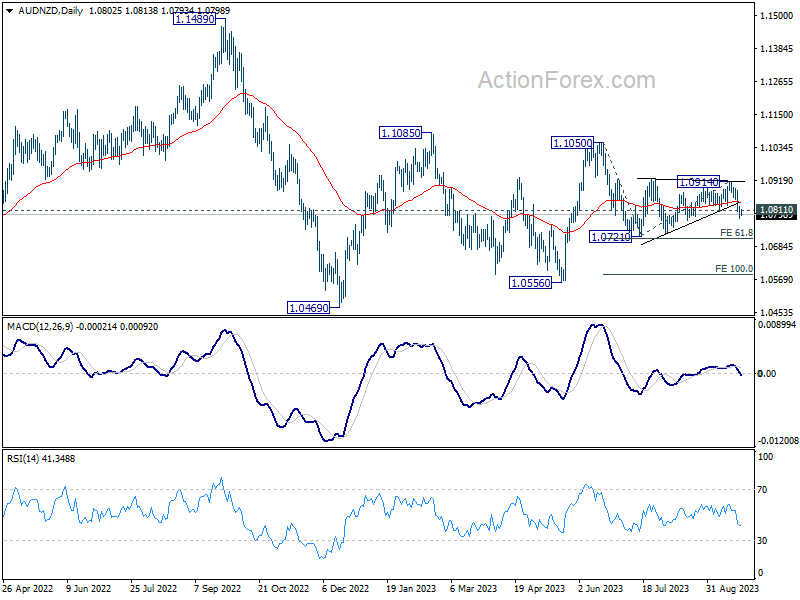
On the technical front, AUD/NZD's break of 1.0811 support last week argues that the consolidation pattern from 1.0721 has completed at 1.0914. That is fall from 1.1050 is ready to resume. Near term risk will stay on the downside as long as 55 D EMA (now at 1.0839) holds. Next target is 61.8% projection of 1.1050 to 1.0721 from 1.0914 at 1.0711.
In Asia, at the time of writing, Nikkei is up 0.84%. Hong Kong HSI is down -1.24%. China Shanghai SSE is down -0.39% Singapore Strait Times is up 0.22%. Japan 10-year JGB yield is down -0.0142 at 0.735.
ECB's Villeroy: Patience is more important now
ECB Governing Council member Francois Villeroy de Galhau spoke about the current monetary policy outlook in an interview with France Inter radio on Saturday. Emphasizing the need for a patient approach, Villeroy stated, "From today's perspective, patience is more important than raising rates further."
He highlighted the current deposit rate, which stands at a record 4%. According to Villeroy, this level should be held steady as it plays a crucial role in controlling inflation within Eurozone.
Amid concerns over the potential inflationary impact of rising oil prices on the global economy, Villeroy remained steadfast in the ECB's commitment to its objectives.
"The recent increase in oil prices won't derail the European Central Bank's fight to tame inflation," he asserted. Elaborating further on this, he said, "We're very attentive, but [this] doesn't put into doubt the underlying disinflation."
Villeroy reiterated ECB's target: "Our outlook and engagement is to bring inflation to around 2% in 2025."
Oil's ascension pauses as momentum exhausted, but 100 still a possibility
The financial world was abuzz last week with discussions of oil potentially breaking the 100 mark. While some pundits deem this as a stretch, the consensus is that no one can entirely dismiss the possibility.
The recent spike in oil prices brings with it a myriad of concerns, particularly about its ripple effect on the broader economy. As central banks globally grapple to suppress rising inflation, the surge in energy costs, with gasoline taking the lead, is becoming a pressing issue. Notably, August's inflation readings surpassed expectations in several countries, with energy prices being the main instigator.
Tracing back to late June, energy prices have witnessed a consistent rise. This surge can be attributed to crude output reductions by major oil producers in OPEC+, coupled with additional cuts from Saudi Arabia. These decisions have propelled crude futures by approximately 30% over the past quarter.
With the possibility of OPEC+ announcing another surprise cut, bullish momentum could very well drive oil prices beyond 100. Contrarily, some anticipate that if prices climb above 95 per barrel, there might be a significant dip in demand, causing oil price to recalibrate and settle within a more balanced range.
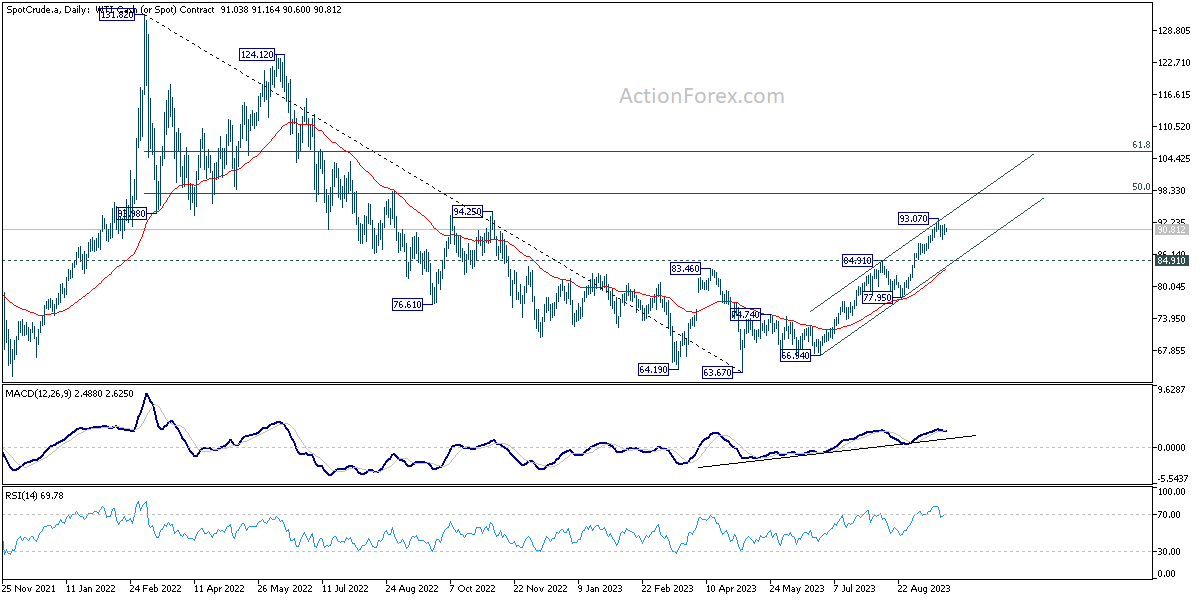
From a technical perspective, WTI crude seems to have hit a near-term ceiling at 93.07 last week. Given that D MACD has already slid beneath the signal line, the prevailing bullish momentum may have been exhausted for the near term.
Nevertheless, decisive drop below 84.91 resistance turned support is essential to counteract the uptrend that began at 66.94. If this doesn't materialize, the prospects of a continued rally remain. Break of 93.07 will put key resistance level at 50% retracement of 131.82 to 63.67 at 97.74 into focus.
Inflation data to stay in the global spotlight
Inflation continues to be the talk of global markets, as expectations and actual data often seem to dance around each other. Upcoming data from Australia, Eurozone, and US are poised to play a pivotal role in the evolving narrative.
Australia's upcoming monthly CPI is projected to ascend from 4.9% yoy to 5.2% yoy in August. While this monthly figure doesn't encompass the full spectrum of the CPI - given that a significant chunk of the data is disseminated quarterly - it does offer vital cues for market players to recalibrate their anticipations. Present consensus leans toward RBA maintaining its current policy in October, especially as Q3 figures will remain undisclosed. The November decision, however, remains contentious. A Bloomberg poll depicts a divide among experts, with 18 forecasting another hike by the year's end and 17 foreseeing the status quo.
Moving to Europe, Eurozone's CPI flash is anticipated to register a deceleration, coming in at 4.5% yoy in September, a dip from the previous 5.2%. Core CPI might also reflect a decline from 5.3% yoy to 4.8%. Following ECB recent 25bps rate increase, the bank is inclined toward a sustained pause. Philip Lane, the bank's Chief Economist, underscored the adequacy of the current 4% deposit rate to realign inflation with 2% target within the projection horizon. This week's figures could fortify this perspective.
Across the Atlantic, US core PCE inflation is projected to taper off to 3.9% yoy in August from the previous 4.2% yoy. Despite market skepticism, Fed's recent communiqué underscored the possibility of another rate hike this year. With the subsequent FOMC meet slated for November 1, a slew of pertinent data remains to be assessed prior to policy determinations.
In addition to the above, markets will be tuned into several other key indicators this week, including US durable goods orders and consumer confidence, Germany's Ifo business climate, Canada's GDP, and Australia's retail sales.
Here are some highlights for the week:
- Monday: Germany Ifo business climate.
- Tuesday: Japan corporate service prices; US house prices, new homes sales, consumer confidence.
- Wednesday: BoJ minutes; Australia CPI; Germany Gfk consumer sentiment; Eurozone M3; US durable goods orders.
- Thursday: New Zealand ANZ business confidence; Australia retail sales; Germany CPI flash; ECB bulletin; US Q2 GDP final, jobless claims, pending home sales.
- Friday: Japan Tokyo CPI, unemployment rate, industrial production, retail sales, consumer confidence, housing starts; Germany import prices, retail sales, unemployment; UK Q2 GDP final, M4 money supply, mortgage supply; France consumer spending; Swiss KOF economic barometer; Eurozone CPI flash; Canada GDP; US goods trade balance, personal income and spending, PCE inflation; Chicago PMI.
AUD/USD Daily Report
Daily Pivots: (S1) 0.6408; (P) 0.6437; (R1) 0.6469; More...
AUD/USD is staying in consolidation from 0.6356 and outlook is unchanged. Intraday bias remains neutral at this point. Further decline is expected as long as 0.6520 resistance holds. Break of 0.6356 will resume larger down trend to 100% projection of 0.7156 to 0.6457 from 0.6894 at 0.6195.
In the bigger picture, down trend from 0.8006 (2021 high) is possibly still in progress. Decisive break of 0.6169 will target 61.8% projection of 0.8006 to 0.6169 to 0.7156 at 0.6021. This will now remain the favored case as long as 0.6894, in case of strong rebound.
Economic Indicators Update
| GMT | Ccy | Events | Actual | Forecast | Previous | Revised |
|---|---|---|---|---|---|---|
| 08:00 | EUR | Germany IFO Business Climate Sep | 85.2 | 85.7 | ||
| 08:00 | EUR | Germany IFO Current Assessment Sep | 88.0 | 89.0 | ||
| 08:00 | EUR | Germany IFO Expectations Sep | 82.8 | 82.6 |
Oil’s ascension pauses as momentum exhausted, but 100 still a possibility
The financial world was abuzz last week with discussions of oil potentially breaking the 100 mark. While some pundits deem this as a stretch, the consensus is that no one can entirely dismiss the possibility.
The recent spike in oil prices brings with it a myriad of concerns, particularly about its ripple effect on the broader economy. As central banks globally grapple to suppress rising inflation, the surge in energy costs, with gasoline taking the lead, is becoming a pressing issue. Notably, August's inflation readings surpassed expectations in several countries, with energy prices being the main instigator.
Tracing back to late June, energy prices have witnessed a consistent rise. This surge can be attributed to crude output reductions by major oil producers in OPEC+, coupled with additional cuts from Saudi Arabia. These decisions have propelled crude futures by approximately 30% over the past quarter.
With the possibility of OPEC+ announcing another surprise cut, bullish momentum could very well drive oil prices beyond 100. Contrarily, some anticipate that if prices climb above 95 per barrel, there might be a significant dip in demand, causing oil price to recalibrate and settle within a more balanced range.
From a technical perspective, WTI crude seems to have hit a near-term ceiling at 93.07 last week. Given that D MACD has already slid beneath the signal line, the prevailing bullish momentum may have been exhausted for the near term.
Nevertheless, decisive drop below 84.91 resistance turned support is essential to counteract the uptrend that began at 66.94. If this doesn't materialize, the prospects of a continued rally remain. Break of 93.07 will put key resistance level at 50% retracement of 131.82 to 63.67 at 97.74 into focus.
EUR/USD At Risk of Drop Toward 1.0550
Key Highlights
- EUR/USD extended losses and traded below 1.0650.
- A key bearish trend line is forming with resistance near 1.0700 on the 4-hour chart.
- GBP/USD is diving and trading below the 1.2350 level.
- USD/JPY is eyeing more gains above the 148.50 level.
EUR/USD Technical Analysis
The Euro started a fresh decline after it failed to clear 1.0750 against the US Dollar. EUR/USD dropped below 1.0700 and 1.0650 to move further into a bearish zone.
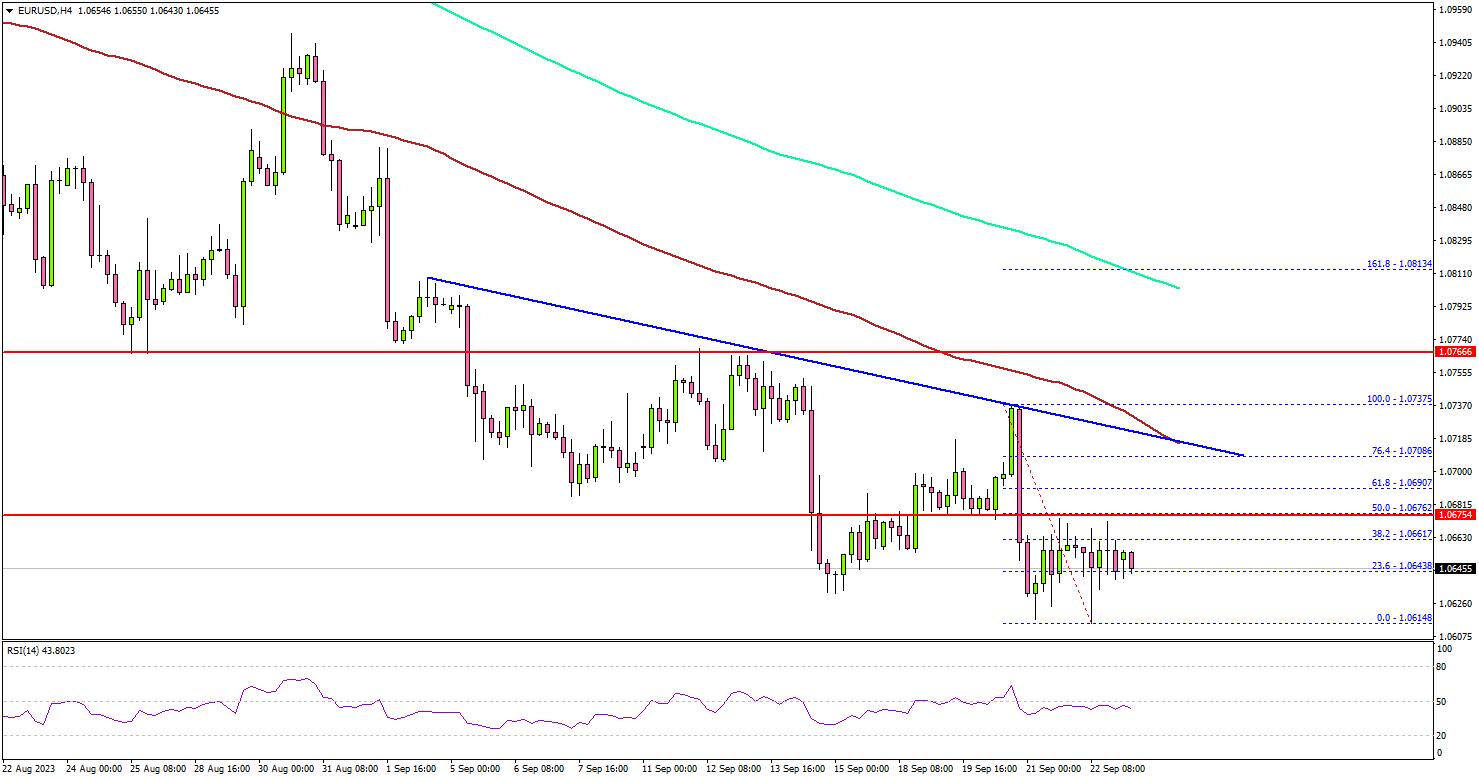
Looking at the 4-hour chart, the pair settled below the 1.0700 level, the 100 simple moving average (red, 4 hours), and the 200 simple moving average (green, 4 hours).
A new multi-week low was formed near 1.0614 and the pair is now consolidating losses. It is now facing resistance near the 1.0675 level. It is close to the 50% Fib retracement level of the recent decline from the 1.0737 swing high to the 1.0614 low.
The next major resistance is near the 1.0700 zone. There is also a key bearish trend line forming with resistance near 1.0700 on the same chart.
A close above 1.0700 could start a steady increase toward 1.0750. Any more gains might send EUR/USD toward the 1.0820 resistance. On the downside, initial support is near the 1.0610 level. The next key support is seen near the 1.0550 level, below which it could test 1.0500.
If there is a move below 1.0500, the pair could dive toward 1.0440. Any more losses might send the pair toward the 1.0350 level.
Looking at GBP/USD, there were strong bearish moves and the pair even declined below the 1.2350 support zone.
Economic Releases
- German IFO Business Climate Index for Sep 2023 – Forecast 85.2, versus 85.7 previous.
- German IFO Current Assessment Index for Sep 2023 - Forecast 88.0, versus 89.0 previous.
- German IFO Expectations Index for Sep 2023 – Forecast 82.8, versus 82.6 previous.
ECB’s Villeroy: Patience is more important now
ECB Governing Council member Francois Villeroy de Galhau spoke about the current monetary policy outlook in an interview with France Inter radio on Saturday. Emphasizing the need for a patient approach, Villeroy stated, "From today's perspective, patience is more important than raising rates further."
He highlighted the current deposit rate, which stands at a record 4%. According to Villeroy, this level should be held steady as it plays a crucial role in controlling inflation within Eurozone.
Amid concerns over the potential inflationary impact of rising oil prices on the global economy, Villeroy remained steadfast in the ECB's commitment to its objectives.
"The recent increase in oil prices won't derail the European Central Bank's fight to tame inflation," he asserted. Elaborating further on this, he said, "We're very attentive, but [this] doesn't put into doubt the underlying disinflation."
Villeroy reiterated ECB's target: "Our outlook and engagement is to bring inflation to around 2% in 2025."
GBPUSD Wave Analysis
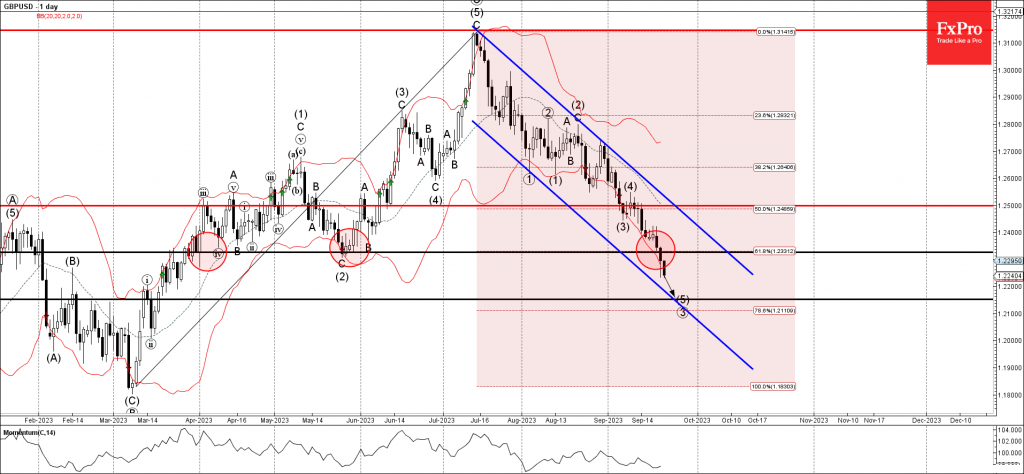
- GBPUSD broke support level 1.2325
- Likely to fall to support level 1.2150
GBPUSD recently broke the strong support level 1.2325 (which has been reversing the price from April) intersecting with the 61.8% Fibonacci correction of the uptrend from March.
The breakout of the support level 1.2325 accelerated the active impulse wave (5), which belongs to the higher impulse wave 3 from July.
GBPUSD can be expected to fall further toward the next support level 1.2150 (target for the completion of the active impulse wave (5)).
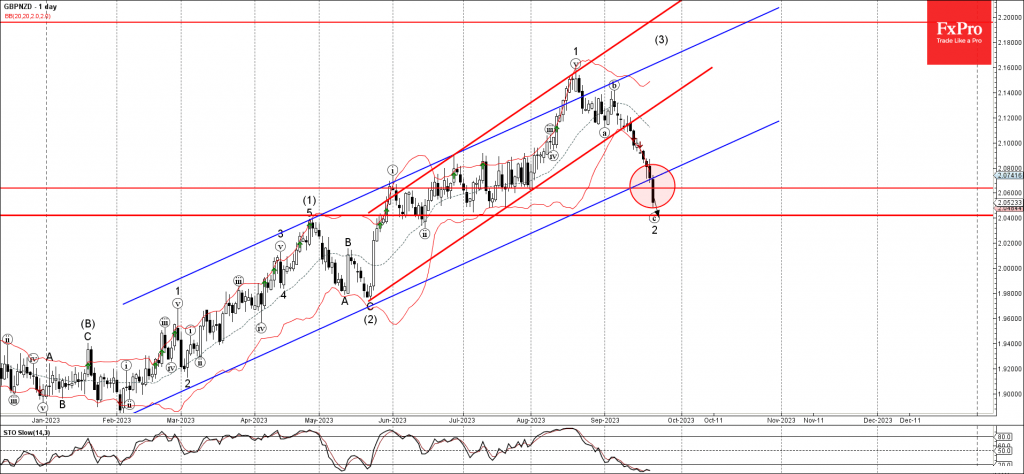
GBPNZD Wave Analysis
- GBPNZD broke support level 2.0640
- Likely to fall to support level 2.0400
GBPNZD recently broke the support level 2.0640 (which reversed the pair multiple times in July) intersecting with the support trendline of the weekly up channel from February.
The breakout of the up channel from February follows the earlier breakout of the sharp up channel from May, accelerating the active impulse wave c.
GBPNZD can be expected to fall further toward the next support level 2.0400 (target for the completion of the active ABC correction 2).
Forex and Cryptocurrency Forecasts
EUR/USD: Verbal Interventions by the Federal Reserve Support the Dollar
In previous reviews, we extensively discussed the verbal interventions made by Japanese officials who aim to bolster the yen through their public statements. This time, similar actions have been taken by FOMC (Federal Open Market Committee) officials, led by the Chairman of the Federal Reserve, Jerome Powell. At their meeting on September 20th, the FOMC decided to maintain the interest rate at 5.50%. This was largely expected, as futures markets had indicated a 99% probability of such an outcome. However, in the subsequent press conference, Mr. Powell indicated that the battle against inflation is far from over, and that the 2.0% target may not be achieved until 2026. Therefore, another rate hike of 25 basis points is very much in the cards. According to the Fed Chairman, there is no recession on the horizon, and the U.S. economy is sufficiently robust to sustain such high borrowing costs for an extended period. Furthermore, it was revealed that 12 out of 19 FOMC members anticipate a rate hike to 5.75% within this year. According to the Committee's economic forecast, this rate level is expected to persist for quite some time. Specifically, the updated forecast suggests that the rate could only be lowered to 5.1% a year from now (as opposed to the previously stated 4.6%), and a decrease to 3.9% is expected in a two-year outlook (revised from 3.4%).
Market participants have mixed beliefs about these prospects, but the fact remains that the hawkish assertions from officials have bolstered the dollar, despite the absence of tangible actions. It's possible that the Federal Reserve has learned from the mistakes of their European Central Bank (ECB) counterparts, who have led market players to believe that the monetary tightening cycle in the Eurozone has concluded. As a reminder, ECB President Christine Lagarde made it clear that she considers the current interest rate level to be acceptable, while the Governor of the Bank of Greece, Yannis Stournaras, stated that, in his opinion, interest rates have peaked, and the next move will likely be a reduction. A similar sentiment: that the September act of monetary tightening was the last, was also expressed by Stournaras's colleague, Boris Vujčić, the Governor of the National Bank of Croatia.
As a result of the Federal Reserve's verbal intervention, the Dollar Index (DXY) soared from 104.35 to 105.37 within just a few hours, while EUR/USD declined to a level of 1.0616. Economists at Oversea-Chinese Banking Corporation (OCBC) believe that, given the Fed's decision to retain flexibility concerning another rate hike, it is not advisable to anticipate a dovish turn in the foreseeable future.
Danske Bank strategists opine that "the Fed was as hawkish as it could be without actually raising rates." However, they contend that "despite the ongoing strengthening of the dollar, there may be some upside potential for EUR/USD in the near term." Danske Bank further states, "We believe that peak rates, improvements in the manufacturing sector compared to the service sector, and/or a reduction in pessimism towards China could support EUR/USD over the next month. However, in the longer term, we maintain our strategic position favouring a decline in EUR/USD, expecting a breakthrough below 1.0300 within the next 12 months."
Data on U.S. business activity released on Friday, September 22, presented a mixed picture. The Manufacturing PMI index rose to 48.9, while the Services PMI declined to 50.2. Consequently, the Composite PMI remained above the 50.0 threshold but showed a slight dip, moving from 50.2 to 50.1.
Following the PMI release, EUR/USD concluded the week at 1.0645. Seventy percent of experts favoured further strengthening of the dollar, while 30% voted for an uptrend in the currency pair. In terms of technical analysis, not much has changed over the nearly completed week. All trend indicators and oscillators on the D1 timeframe are still unanimously supporting the American currency and are coloured red. However, 15% of them are signalling the pair's oversold condition. The nearest support levels for the pair lie in the 1.0620-1.0630 range, followed by 1.0490-1.0525, 1.0370, and 1.0255. Resistance levels will be encountered in the 1.0670-1.0700 zone, then at 1.0745-1.0770, 1.0800, 1.0865, 1.0895-1.0925, 1.0985, and 1.1045.
As for the upcoming week's events, Tuesday, September 26 will see the release of U.S. real estate market data, followed by durable goods orders in the U.S. on Wednesday. Thursday, September 28 promises to be a busy day. Preliminary inflation (CPI) data from Germany as well as U.S. GDP figures for Q2 will be disclosed. Additionally, the customary U.S. labour market statistics will be released, and the day will conclude with remarks from Federal Reserve Chairman Jerome Powell. On Friday, we can also expect a slew of significant macroeconomic data, including the Eurozone's preliminary Consumer Price Index (CPI) and information regarding personal consumption in the United States.
GBP/USD: BoE Withdraws Support for the Pound
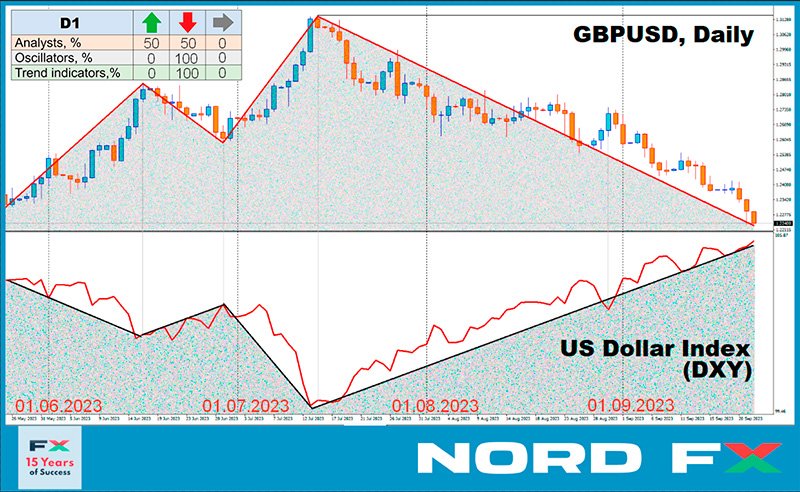
The financial world doesn't revolve around the Federal Reserve's decisions alone. Last week, the Bank of England (BoE) also made its voice heard. On Thursday, September 21, the BoE's Monetary Policy Committee left the interest rate for the pound unchanged at 5.25%. While a similar decision by the Federal Reserve was expected, the BoE's move came as a surprise to market participants. They had anticipated a 25 basis point increase, which did not materialize. As a result, the strengthening dollar and weakening pound drove GBP/USD down to 1.2230.
The BoE's decision was likely influenced by encouraging inflation data for the United Kingdom published the day before. The annual Consumer Price Index (CPI) actually declined to 6.7%, compared to the previous 6.8% and a forecast of 7.1%. The core CPI also fell from 6.9% to 6.2%, against a forecast of 6.8%. Given such data, the decision to pause and not burden an already struggling economy appears reasonable. This rationale is further supported by the United Kingdom's preliminary Services Purchasing Managers' Index (PMI) for September, which hit a 32-month low at 47.2, compared to 49.5 in August and a forecast of 49.2. The Manufacturing PMI was also reported at 44.2, significantly below the critical level of 50.0.
According to economists at S&P Global Market Intelligence, these "disheartening PMI results suggest that a recession in the United Kingdom is becoming increasingly likely. [...] The sharp decline in production volumes indicated by the PMI data corresponds to a GDP contraction of more than 0.4% on a quarterly basis, and the broad-based downturn is gaining momentum with no immediate prospects for improvement.".
Analysts at one of the largest banks in the United States, Wells Fargo, believe that the BoE's decision signals a loss of rate-based support for the British pound. According to their forecast, the current rate of 5.25% will mark the peak of the cycle, followed by a gradual decline to 3.25% by the end of 2024. Consequently, they argue that "in this context, a movement of the pound to 1.2000 or lower is not out of the question."
Their counterparts at Scotiabank share a similar sentiment. New lows and strong bearish signals on the oscillator for short-term, medium-term, and long-term trends indicate an elevated risk of the pound dropping to 1.2100-1.2200.
Economists at Germany's Commerzbank do not rule out the possibility of a slight recovery for the pound if inflation outlooks significantly improve. They believe that the Bank of England has left the door open for another rate hike. The vote for maintaining the current rate was surprisingly close at 5:4, meaning four members of the Monetary Policy Committee voted in favour of a 25 basis point increase. This underscores the high level of uncertainty. Nevertheless, due to the weakness in the UK economy, the outlook for the pound remains bearish.
GBP/USD closed the past week at 1.2237. Analyst opinions on the pair's immediate future are evenly split: 50% expect further downward movement, while the other 50% anticipate a correction to the upside. All trend indicators and oscillators on the D1 chart are coloured in red; moreover, 40% of these oscillators are in the oversold zone, which is a strong signal for a potential trend reversal.
If the pair continues its downward trajectory, it will encounter support levels and zones at 1.2190-1.2210, 1.2085, 1.1960, and 1.1800. On the other hand, if the pair rises, it will face resistance at 1.2325, 1.2440-1.2450, 1.2510, 1.2550-1.2575, 1.2600-1.2615, 1.2690-1.2710, 1.2760, and 1.2800-1.2815.
In terms of economic events impacting the United Kingdom for the upcoming week, the highlight will be the release of the country's GDP data for Q2, scheduled for Friday, September 29.
USD/JPY: Lacklustre Meeting at the Bank of Japan
Following their counterparts at the Federal Reserve and the Bank of England, the Bank of Japan (BoJ) held its meeting on Friday, September 22. "It was a lacklustre meeting," commented economists at TD Securities. "All members unanimously voted to keep policy unchanged. The statement was largely similar to the one issued in July, and no changes were made to the forward guidance." The key interest rate remained at the negative level of -0.1%.
The subsequent press conference led by BoJ Governor Kazuo Ueda also disappointed yen bulls. Ueda did not speak against the weakening of the national currency; instead, he reiterated that the exchange rate should reflect fundamental indicators and remain stable. The central bank's head also noted that the regulator "could consider the possibility of ending yield curve control and altering the negative interest rate policy when we are confident that achieving the 2% inflation target is near."
Japan's Finance Minister Shunichi Suzuki's speech was also a typical form of verbal intervention for him. "We are closely monitoring currency exchange rates with a high sense of urgency and immediacy," the minister declared, "and we do not rule out any options for responding to excessive volatility." He added that last year's currency intervention had its intended effect but did not indicate whether similar steps could be expected in the near future.
Ten-year U.S. Treasury bonds and the USD/JPY currency pair are traditionally directly correlated. When the yield on the bonds rises, so does the dollar against the yen. This week, following hawkish statements from the Federal Reserve, rates on 10-year Treasuries soared to their highest peak since 2007. This propelled USD/JPY to a new high of 148.45. According to economists at TD Securities, considering the rise in U.S. yields, the pair could break above 150.00. Meanwhile, at the French bank Societe Generale, target levels of 149.20 and 150.30 are being cited.
The last note of the five-day trading session sounded at the 148.36 mark. A majority of surveyed experts (70%) agreed with the views of their colleagues at TD Securities and Societe Generale regarding the further rise of USD/JPY. A correction to the downside, and possibly a sharp drop due to currency interventions, is expected by 20% of analysts. The remaining 10% took a neutral stance. All 100% of trend indicators and oscillators on the D1 timeframe are coloured green, although 10% of the latter are signalling overbought conditions. The nearest support level is in the 146.85-147.00 zone, followed by 145.90-146.10, 145.30, 144.50, 143.75-144.05, 142.20, 140.60-140.75, 138.95-139.05, and 137.25-137.50. The nearest resistance is at 148.45, followed by 148.45, 148.85-149.20, 150.00, and finally, the October 2022 high of 151.90.
No significant economic data related to the state of the Japanese economy is scheduled for release in the upcoming week. However, traders may want to mark Friday, September 29 on their calendars, as consumer inflation data for the Tokyo region will be published on that day.
CRYPTOCURRENCIES: Battle for $27,000
On Monday, September 18, the price of the leading cryptocurrency began to soar, pulling the entire digital asset market upward. Interestingly, the reason behind this surge was not directly related to bitcoin, but rather to the U.S. dollar. Specifically, it was tied to the Federal Reserve's decisions regarding interest rates. High dollar rates limit the flow of investments into riskier assets, including cryptocurrencies, as large investors prefer stable returns. In this case, ahead of the upcoming Federal Reserve meeting, market participants were confident that the regulator would not only refrain from raising rates but would also keep them unchanged until year-end. Riding on these expectations, BTC/USD surged, reaching a peak of $27,467 on August 19, adding more than 10% since September 11.
However, although the rate did indeed remain unchanged, it became clear following the meeting that the fight against inflation would continue. Therefore, any hopes of a shift away from the Fed's hawkish stance should be set aside for now. As a result, the price of bitcoin reversed course. After breaking through the support zone at $27,000, it returned to its starting positions.
Despite the recent pullback, many in the crypto community remain confident that the digital gold will continue to rise. For instance, an analyst going by the alias Yoddha believes that bitcoin has a chance to refresh its local high in the short term and reach $50,000 by year-end. After which, he suggests, a correction to $30,000 may occur in early 2024, ahead of the halving event. Blogger Crypto Rover also anticipates that troubles in the U.S. economy will fuel BTC's growth. If the pair manages to firmly establish itself above $27,000, he expects the price to move towards $32,000.
Analyst DonAlt is of the opinion that bitcoin stands a chance to stage a new impressive rally and update its 2023 high. "If we rise and overcome the resistance we are currently battling," he writes, "the target, I believe, could be $36,000. [...] I won't rule out missing a good entry at $30,000 because if the price takes off, it may rise too quickly. [But] we have enough compelling reasons to also move downward. In the worst case, I'll take a minor hit if it plunges into the $19,000 to $20,000 range.".
Trader and analyst Jason Pizzino believes that bitcoin's bullish market cycle began forming around January, and this process is still not complete despite the recent price consolidation. According to the expert, bitcoin will confirm its bullish sentiment if it crosses a key level at $28,500. "This market has seldom seen sub-$25,000 levels. I'm not saying it can't go down, but for six months now, the weekly closings have been above these levels. So far, so good, but we're not in bull territory yet. Bulls need to see closings above $26,550 at least occasionally," states Pizzino. "Bulls still have much to do. I'll start talking about them once we cross the white line at the $28,500 level again. This is one of the key levels for bitcoin to start moving upwards and then try to break $32,000.".
John Bollinger, the creator of the Bollinger Bands volatility indicator, does not rule out the possibility that the leading crypto asset is preparing for a breakout. The indicator uses the standard deviation from the simple moving average to determine volatility and potential price ranges for an asset. Currently, BTC/USD is forming daily candles that touch the upper band. This could indicate a reversal back to the central band or, conversely, an increase in volatility and upward movement. Narrow Bollinger Bands on the charts suggest that the latter scenario is more likely. However, Bollinger himself comments cautiously, believing that it is still too early to draw definitive conclusions.
PlanB, the well-known creator of the S2FX model, has reaffirmed his forecast made earlier this year. He noted that the November 2022 low was the bottom for bitcoin, and its ascent will begin closer to the halving event. PlanB believes that the 2024 halving will drive the leading cryptocurrency up to $66,000, and the subsequent bull market in 2025 could push its price above the $100,000 mark.
Investor and best-selling author of "Rich Dad Poor Dad," Robert Kiyosaki, has high hopes for the halving event as well. According to the expert, the U.S. economy is on the verge of a serious crisis, and cryptocurrencies, particularly bitcoin, offer investors a safe haven during these turbulent times. Kiyosaki predicts that the price of bitcoin could soar to $120,000 next year, and the 2024 halving will serve as a key catalyst for the rally.
In conclusion, to balance out the optimistic forecasts mentioned earlier, let's introduce some pessimism. According to popular analyst and host of the DataDash channel, Nicholas Merten, the crypto market could experience another downturn. He cites the declining liquidity of stablecoins as an indicator. "It's a good metric for identifying trends in the cryptocurrency market. For instance, from April 2019 to July 2019, bitcoin rose from $3,500 to $12,000. During the same period, the liquidity of stablecoins increased by 119%. Then we see a period of consolidation where liquidity also remained at a constant level. When bitcoin rose from $3,900 to $65,000 in 2021, the liquidity of stablecoins surged by 2,183%," the expert shares his observations.
"Liquidity and price growth are interconnected. If liquidity is declining or consolidating, the market is likely not going to grow. This is true for both cryptocurrencies and financial markets. For market capitalization to grow, you need liquidity, but what we are seeing is a constant decline in liquidity, which makes a price drop for cryptocurrencies more probable," Nicholas Merten states.
As of the time of writing this review, Friday evening, September 22, BTC/USD is trading around $26,525. The overall market capitalization of the crypto market has remained virtually unchanged, standing at $1.053 trillion (compared to $1.052 trillion a week ago). The Bitcoin Crypto Fear & Greed Index has dropped by 2 points, moving from 45 to 43, and remains in the 'Fear' zone.