Sample Category Title
Swiss Q2 GDP stagnates as manufacturing slumps
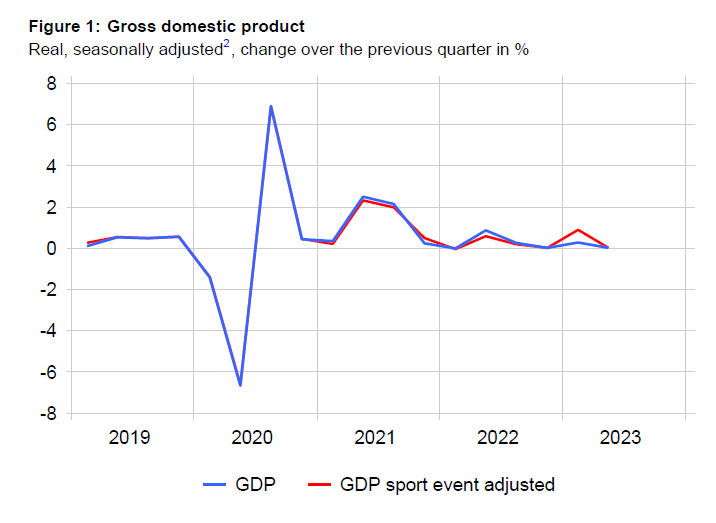
Switzerland's GDP growth for Q2 came in flat at 0.0% qoq, missing the modest expectation of a 0.1% qoq growth. While this paints a grim picture, particularly for manufacturing and construction sectors, certain segments like trade and accommodation services displayed resilience, leaving a mixed bag of results for economists and investors to sift through.
The manufacturing sector contracted sharply by -2.9% qoq, weighed down significantly by a decline in the chemical and pharmaceutical industry, which shrank by -2.3%. Mechanical engineering and metal construction also faced headwinds, reflecting the sector's sensitivity to challenging international conditions. Furthermore, the construction sector didn't fare well either, contracting by -0.7% qoq.
On a brighter note, both private and government consumption showed marginal growth at 0.4% and 0.1% qoq, respectively. These figures indicate that domestic demand remains somewhat steady, offering a counterbalance to the weaknesses observed in production sectors.
Equipment and software investment plunged by -3.7% qoq, while exports of goods fell by -1.2% qoq. However, export of services saw a rise of 2.6% qoq, and imports of goods and services contracted by -3.7%, making a net positive contribution to GDP.
EUR/USD Resumes Downtrend after US NFP and ISM manufacturing PMI Data
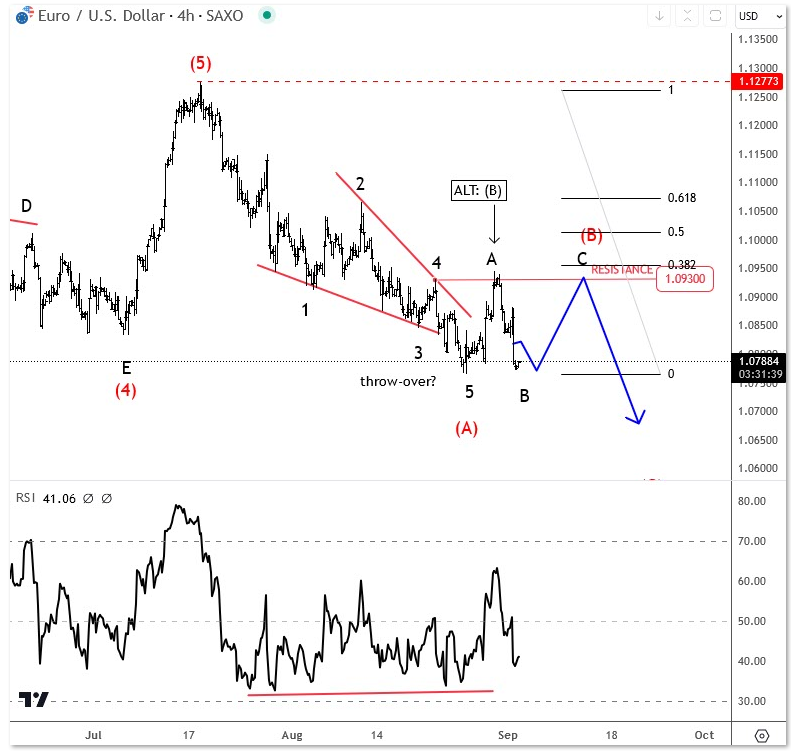
EURUSD is coming down after a rally back to 1.0930 resistance after a completed leading diagonal in wave (A). Well, pair turned back to the lows after latest US NFP report so it seems that euro will stay bearish, either straight from here down for wave (C) to around 1.06, or there can still be a flat int wave (B) if suddenly price will turn up for 1.0930 again. In either case, we think that a corrective pullback from summer highs is still underway and that euro will retest lower levels. When looking at the daily chart, big supports are at 1.06 and 1.05 from where a higher degree uptrend may resume.
Soft US Jobs Data, Further China Stimulus Fuel Appetite
Last week ended on a positive note, and this week started with a solid risk appetite, as the US jobs data hinted at a finally loosening jobs market, while Chinese stocks rallied on further measures deployed by the Chinese government to support the country’s faltering property market. In fact, the latest news suggests that more than 1800 new homes were sold in Beijing on Saturday alone after the government eased mortgage rules last week (vs. around 3100 homes were sold in Beijing during the entire August). The Hang Seng index jumped more than 3% this Monday before paring gains.
In the US, Friday’s jobs data was good, in terms of Federal Reserve (Fed) expectations. The US economy added 187K new nonfarm jobs last month, above expectations, but the unemployment rate ticked higher to 3.8% as the participation rate rose. The wages growth fell from 4.4% to 4.3% in August. The US 2-year yield, which is the most sensitive to changes in Fed expectations, tipped a toe below the 4.80% level, as investors took the opportunity to increase their bets that the Fed is certainly done with its rate hikes this cycle. Activity on Fed funds futures gives around 93% chance for another skip at the September meeting, and the probability of a pause in November has almost jumped to two thirds. The S&P500 recorded its best week since June, and rebounded to the highest level in a month, while Nasdaq 100 ended last week a few points below the 15500 level, and with trend and momentum indicators pointing at further strength.
Today, the US and Canada will be closed, but Europe is open for business and even though the week starts with a favourable risk appetite, there is nothing in the latest economic data to make the European investors cheer. Released last Friday, the euro area manufacturing PMI came in lower than expected, and posted the 14th consecutive month of contraction as the energy crisis continued taking a toll on activity in the old continent. Released earlier last week, the latest inflation estimate for the Eurozone showed that inflation in the euro-area stagnated, instead of easing further. In summary, activity is slowing but inflation is not - due to still too high energy prices, and that’s bad for the European Central Bank (ECB). There are now rising voices that the ECB won’t hike rates when it meets this month, although it’s hard to imagine Christine Lagarde announce a pause while weakness in economic activity isn’t yet reflected in price dynamics, and the European jobs market remains relatively strong.
US crude hits $86pb
The barrel of US crude traded past $86pb, as oil bulls continued buying the tight supply narrative from OPEC+. But looking at the crude’s impressive rally since the 24th of August dip, and taking into account that the RSI index now warns that oil has stepped into the overbought market conditions, we shall see a minor correction in oil prices this week, before an eventual push toward the $89/90pb area.
Elsewhere, the European nat gas futures remain highly volatile due to strikes in Australia. Hundreds of Chevron workers will be going on a strike on September 7. Strikes cause decent positive pressure and a lot of volatility in TTF futures. But the European nat gas reserves are full by around 90% and there is no particular urge for the European to rush to nat gas at the current prices. Therefore, the price rallies on strike news remain interesting short-term trade opportunities for top sellers.
Technical Outlook and Review
DXY:
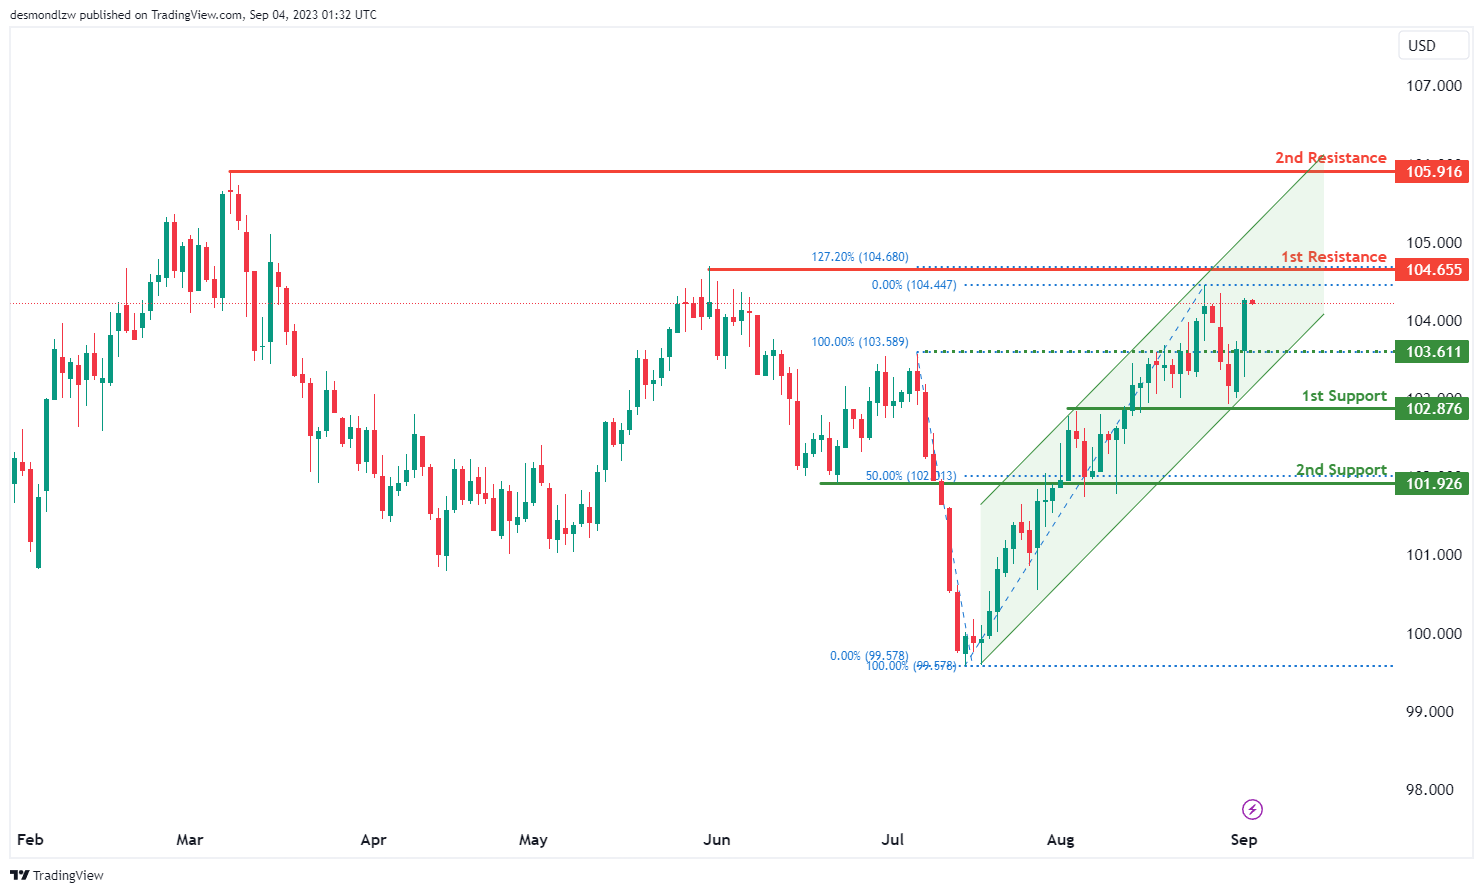
The DXY chart is currently showing a bullish overall momentum, suggesting an upward trend in the price movement. This bullish sentiment is reinforced by the fact that the price is within a bullish ascending channel, indicating a potential continuation of the upward trajectory.
The 1st support level at 102.87 is identified as an overlap support, indicating that historical price action has found support around this level. It serves as a foundation for potential upward movements.
The 2nd support level at 101.92 is also marked as an overlap support and aligns with the 50% Fibonacci Retracement level. This confluence of support factors adds to its significance, potentially strengthening its role as a support zone.
On the resistance side, the 1st resistance level at 104.65 is noted as a swing high resistance, suggesting that historical price action has faced resistance at this level in the past. Traders often pay close attention to these levels for potential reversal or continuation patterns.
The 2nd resistance level at 105.91 is also identified as a swing high resistance, further confirming its potential significance as a barrier for upward price movement.
Additionally, an intermediate support level at 103.61 is recognized as a pullback support, indicating a level where the price could potentially find support during a pullback.
EUR/USD:
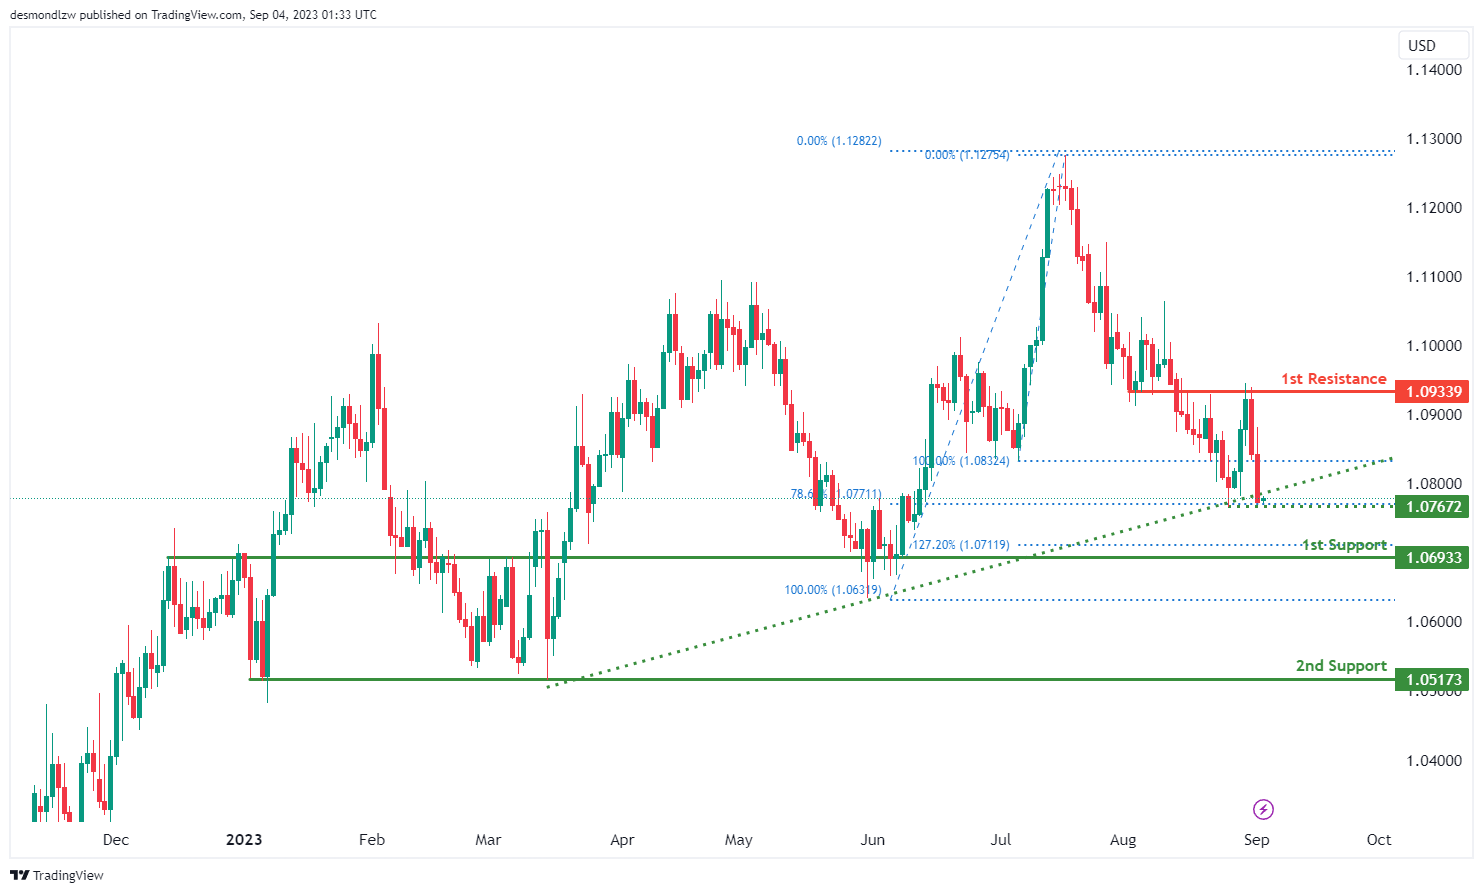
The EUR/USD chart is currently demonstrating a bullish overall momentum, implying an upward trend in price movement. This bullish sentiment is bolstered by the fact that the price is positioned above a major ascending trend line, indicating the potential for further bullish momentum ahead.
In the short term, there’s potential for the price to drop further before initiating a rebound. The 1st support level at 1.0693 is identified as a pullback support, and it aligns with the 127.20% Fibonacci Extension. This confluence of support factors increases its importance as a potential support zone.
The 2nd support level at 1.0517 is noted as a multi-swing low support, indicating that historical price action has found support around this level. This further solidifies its role as a potential area of support.
In the event of a bounce from the support, the price could rise towards the 1st resistance level at 1.0933. This level is marked as an overlap resistance, suggesting that historical price action has faced resistance in this region before.
Additionally, an intermediate support level at 1.0767 is recognized as a swing low support, and it aligns with the 78.60% Fibonacci Retracement level. This level could potentially provide support during pullbacks.
EUR/JPY:
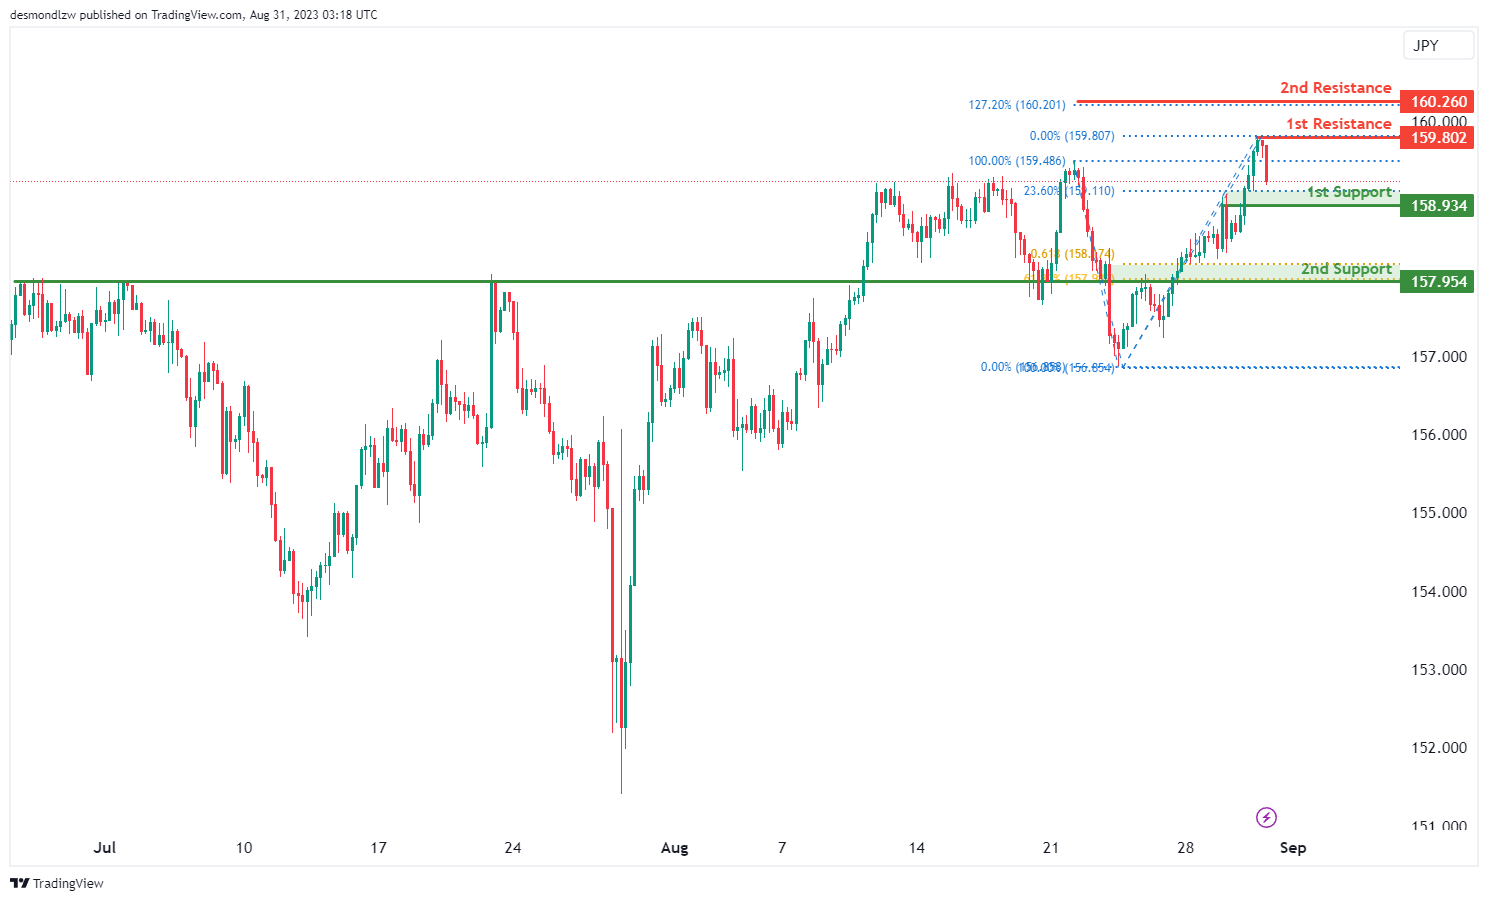
The EUR/JPY pair currently exhibits a bullish momentum. Given this upward trajectory, there’s a notable possibility for the currency pair to take a bullish bounce off its 1st support level, which is positioned at 156.91. This support level stands out mainly due to its classification as a multi-swing low support.
Should the price dip further, the 2nd support level is pegged at 155.48. This support level is recognized as a swing low support and is also reinforced by the 50% Fibonacci Retracement, which adds to its significance as a potential zone of stabilization in the event of a pullback.
On the potential upside, the 1st resistance is identified at 159.32. This resistance level is termed as an overlap resistance. What amplifies its significance is the association with the 127.20% Fibonacci Extension, suggesting that it could serve as a formidable barrier or pivot point in the market, especially for bullish movements.
EUR/GBP:
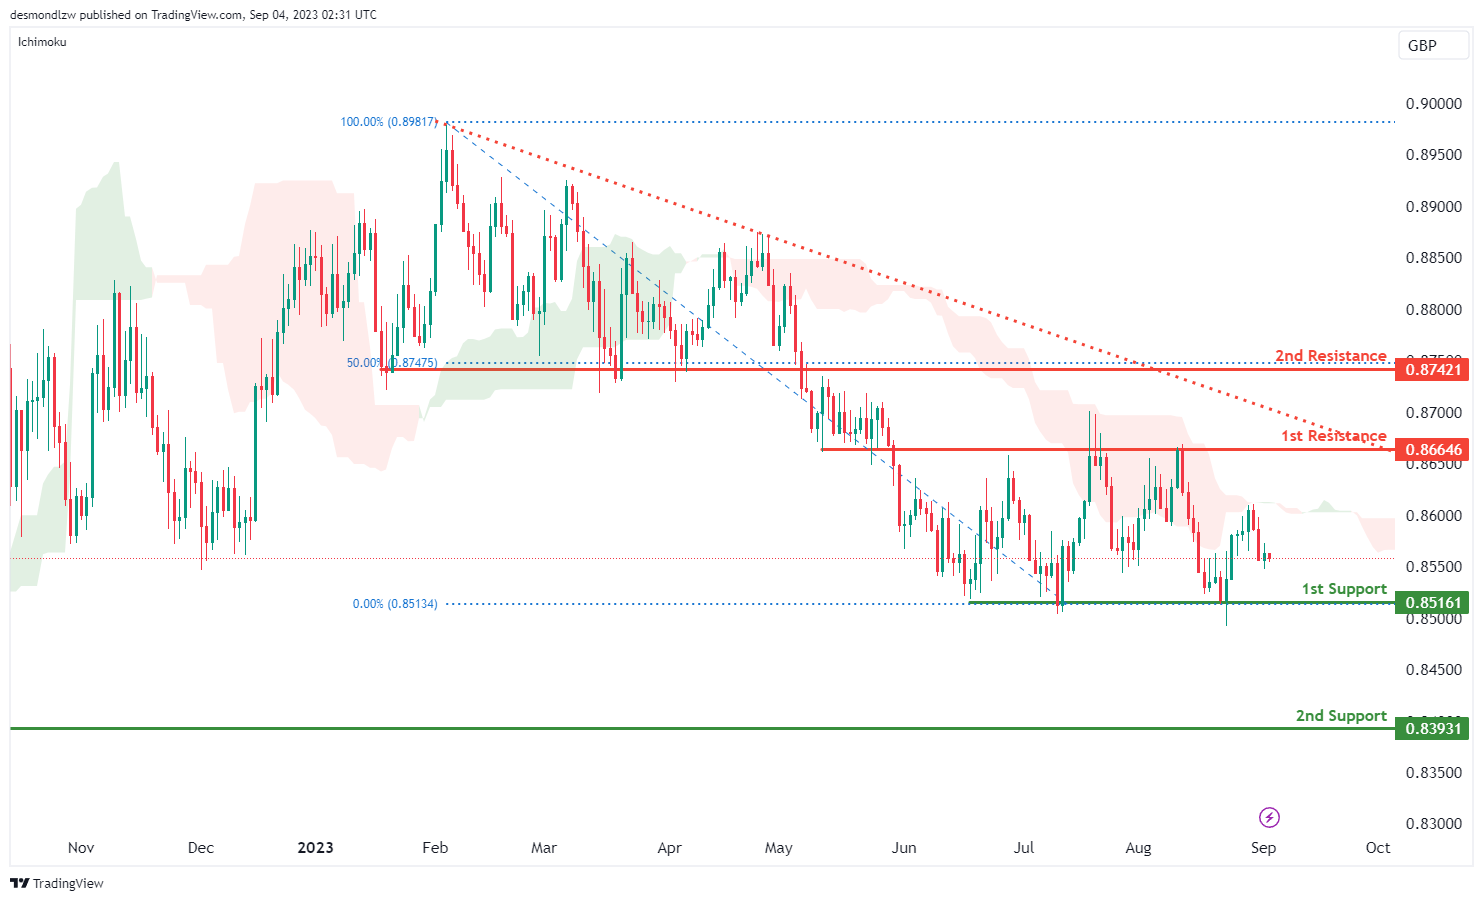
The EUR/GBP pair is currently indicating a bearish momentum. One of the significant factors underscoring this bearish trend is the price’s positioning below a major descending trend line. This pattern suggests that the bearish momentum might persist and continue further.
Given this context, there’s a possibility for the pair to sustain its bearish movement, targeting the 1st support level at 0.8516. This support level is significant due to its characterization as a multi-swing low support, indicating areas where the price has found support in the past.
If the bearish momentum pushes the price even lower, the 2nd support to watch is at 0.8393. This level stands out as an overlap support, representing levels where the price has shown historical interactions.
On the upside, should there be any short-term bullish retractions, the 1st resistance is pegged at 0.8664. This resistance level is noteworthy as an overlap resistance, suggesting zones where past price action might have encountered barriers.
Beyond that, the 2nd resistance is identified at 0.8742. This level serves not only as a pullback resistance but is also aligned with the 50% Fibonacci Retracement, emphasizing its potential importance as a barrier against further bullish movements.
GBP/USD:
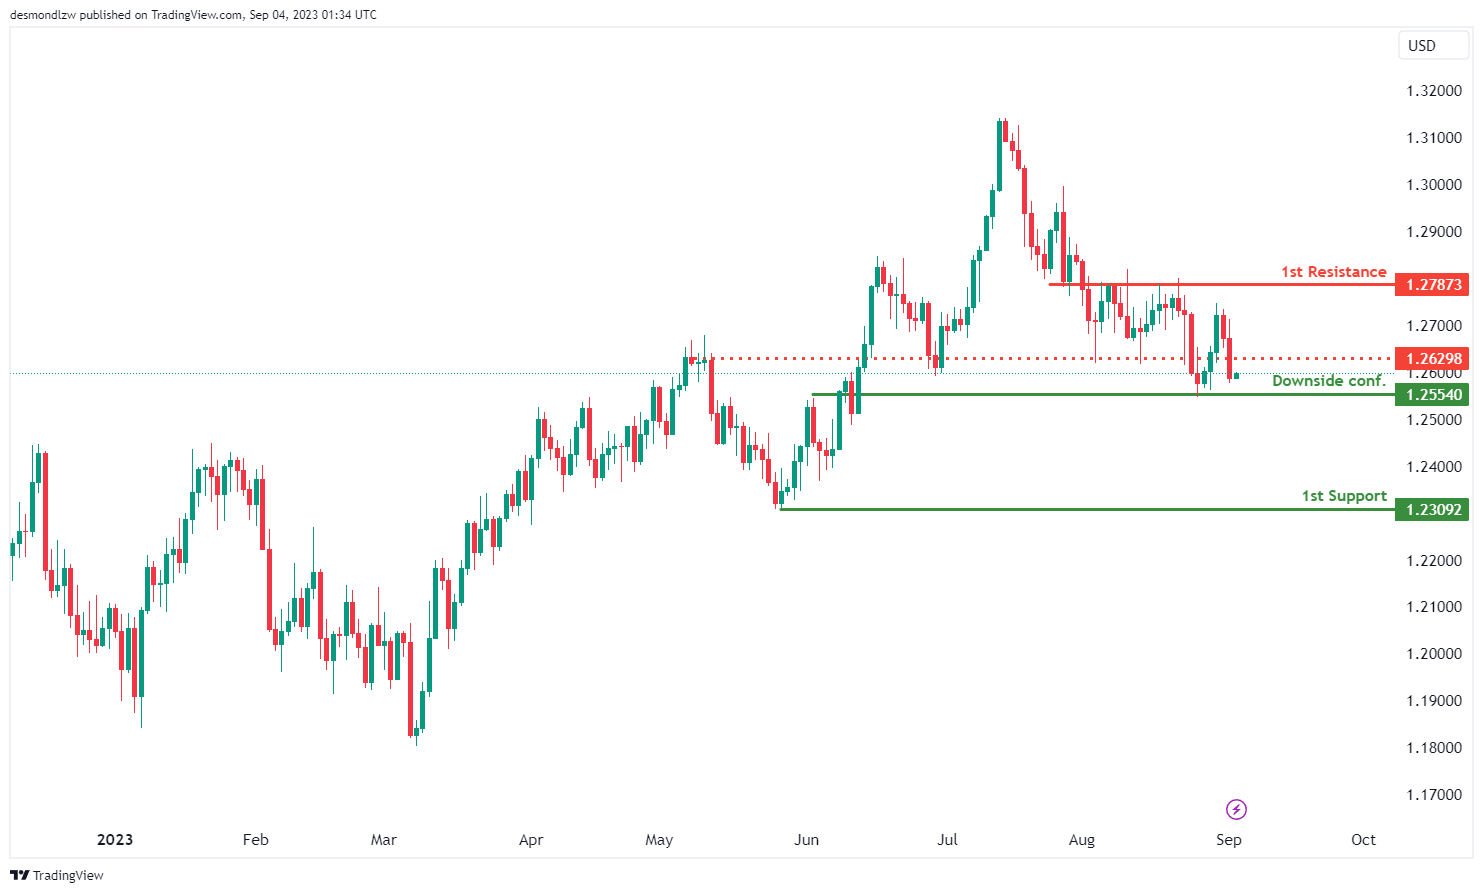
The GBP/USD chart is currently exhibiting a bullish overall momentum, indicating an upward trend in price movement. There’s potential for the price to experience a bullish bounce off the 1st support level and subsequently move towards the 1st resistance level.
Before considering potential bullish movement, it’s advised to wait for downside confirmation at 1.2554. This level is identified as an overlap support, indicating that historical price action has found support around this area. Waiting for confirmation can help ensure a stronger foundation for potential price movements.
The 1st support level at 1.2309 is significant as it’s a swing low support. This suggests that historical price action has previously encountered support at this level, potentially serving as a key reference point for future movements.
Should the price exhibit a bullish rebound, the 1st resistance level at 1.2787 becomes relevant. This level is marked as an overlap resistance, implying that historical price action has faced resistance in this region before.
Additionally, an intermediate resistance at 1.2629 is identified as a pullback resistance. This level could play a role in temporarily halting a bullish movement before further potential advancement.
GBP/JPY:
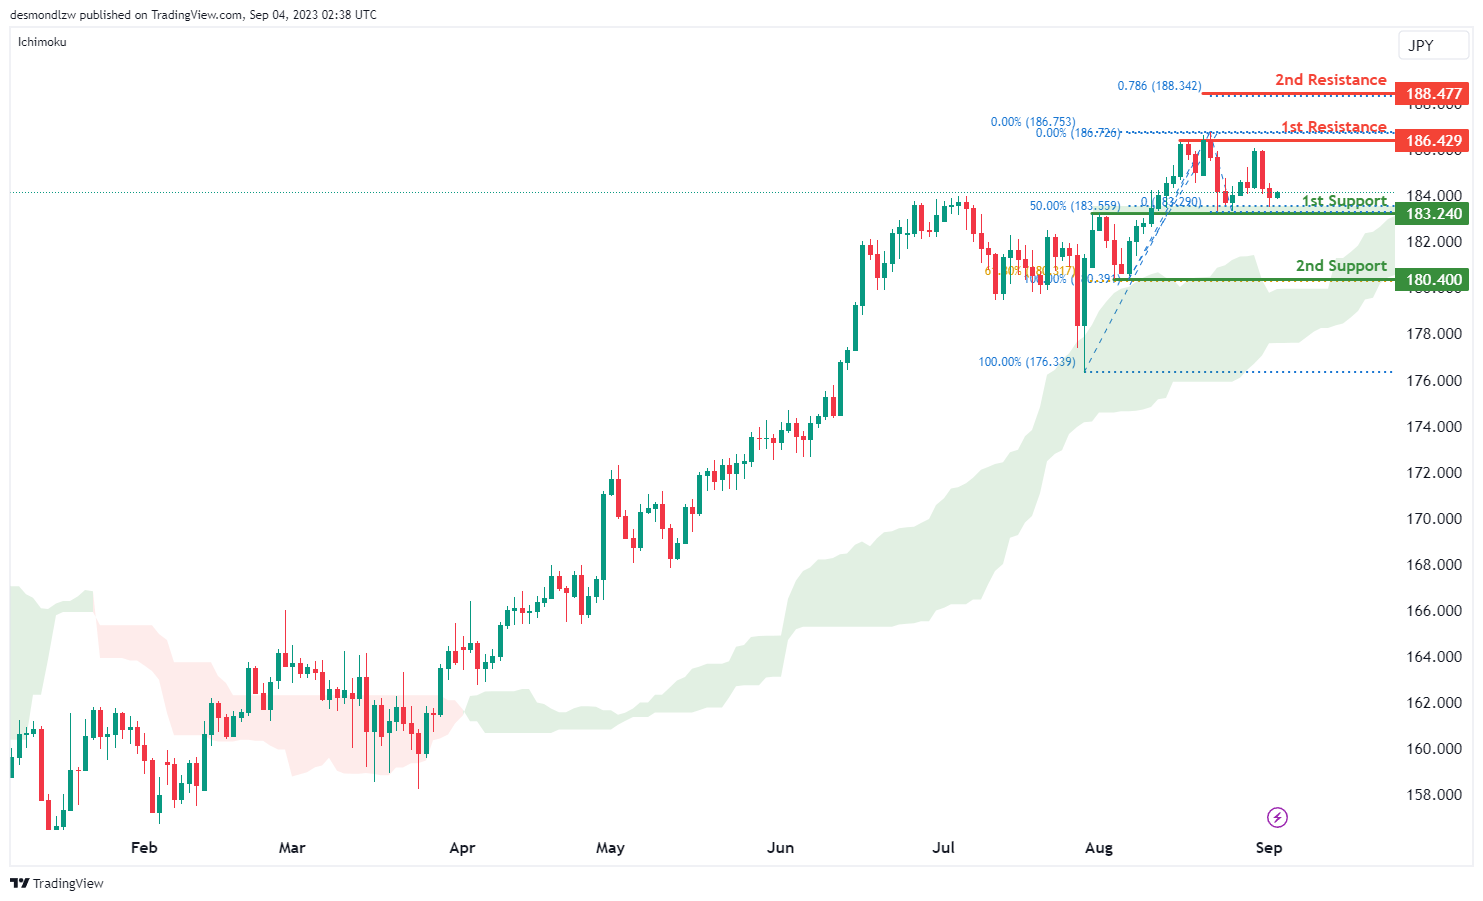
The GBP/JPY chart currently exhibits a bullish trend, primarily because the price is positioned above the bullish Ichimoku cloud.
Given this momentum, there’s a chance for a bullish bounce from the 1st support at 183.24, which is distinguished as an overlap support and aligns with the 50% Fibonacci Retracement. Should the price decline further, the 2nd support to note is at 180.40, a swing low support strengthened by the 61.80% Fibonacci Retracement.
On the bullish front, the 1st resistance is marked at 186.42, identified as a multi-swing high resistance. Beyond that, the 2nd resistance is at 188.47, aligning with the 78.60% Fibonacci Projection.
USD/CHF:
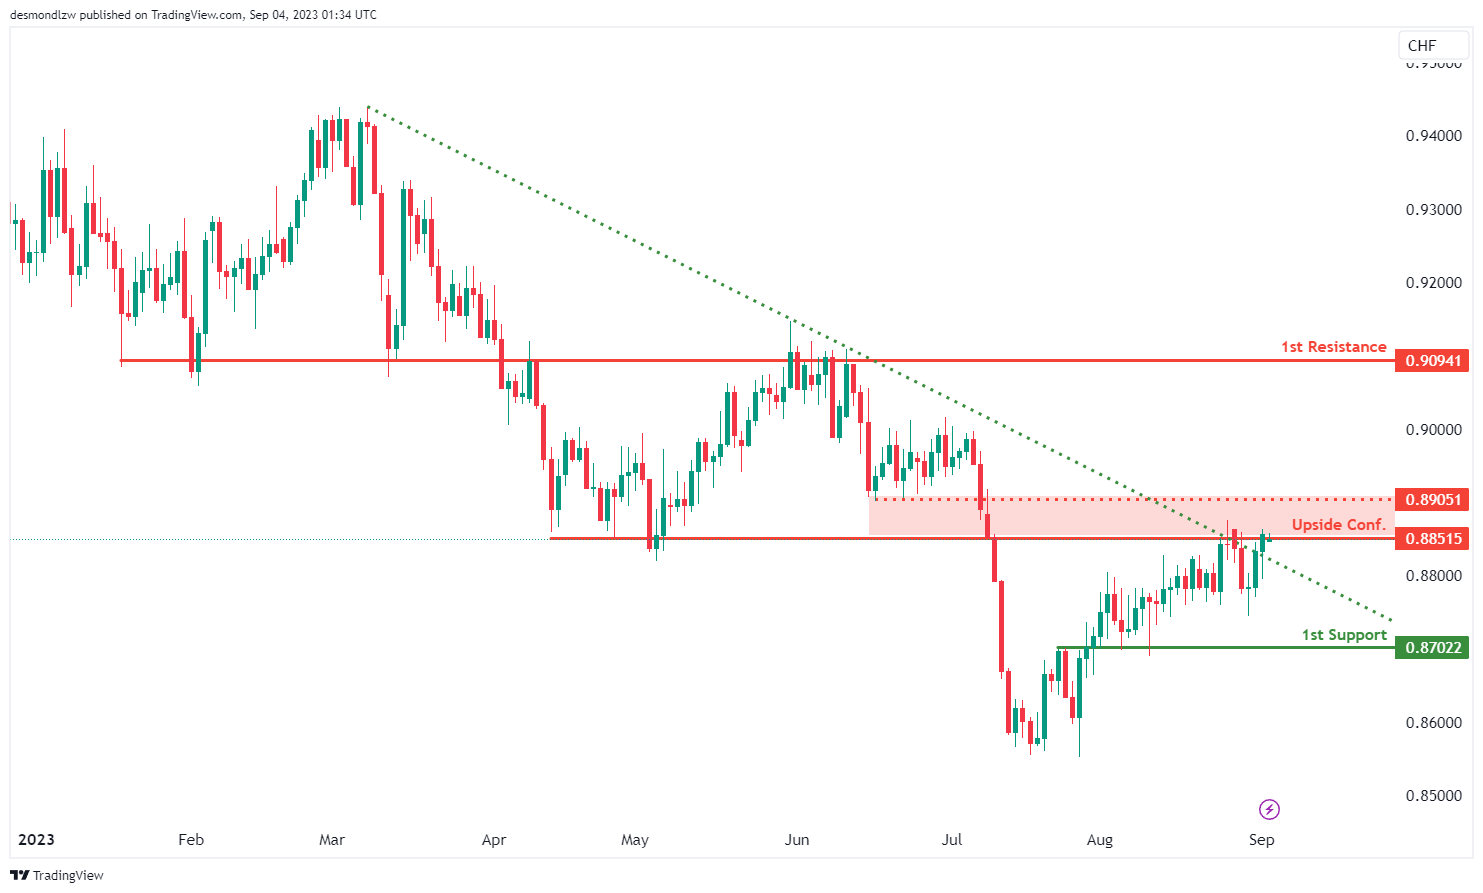
The USD/CHF chart is currently displaying a bullish overall momentum, marked by a breakout above a descending resistance line. This breakout has triggered a potential bullish move in the price.
In the short term, there’s potential for the price to experience a drop towards the 1st support level at 0.8702. This level is identified as an overlap support, indicating that historical price action has found support around this area.
Should the price exhibit a drop and reach the 1st support level, a bounce could be anticipated from there. Following this bounce, a potential upward movement towards the 1st resistance level at 0.9094 could occur. This level is marked as an overlap resistance, implying that historical price action has encountered resistance in this region before.
Before considering the upward move, waiting for upside confirmation at 0.8851 is recommended. This level is identified as a multi-swing high resistance, and waiting for confirmation can provide stronger indications of a potential bullish breakout.
Furthermore, an intermediate resistance at 0.8905 is noted as a pullback resistance. This level might act as a temporary barrier to any bullish movement before further potential advancement.
USD/JPY:
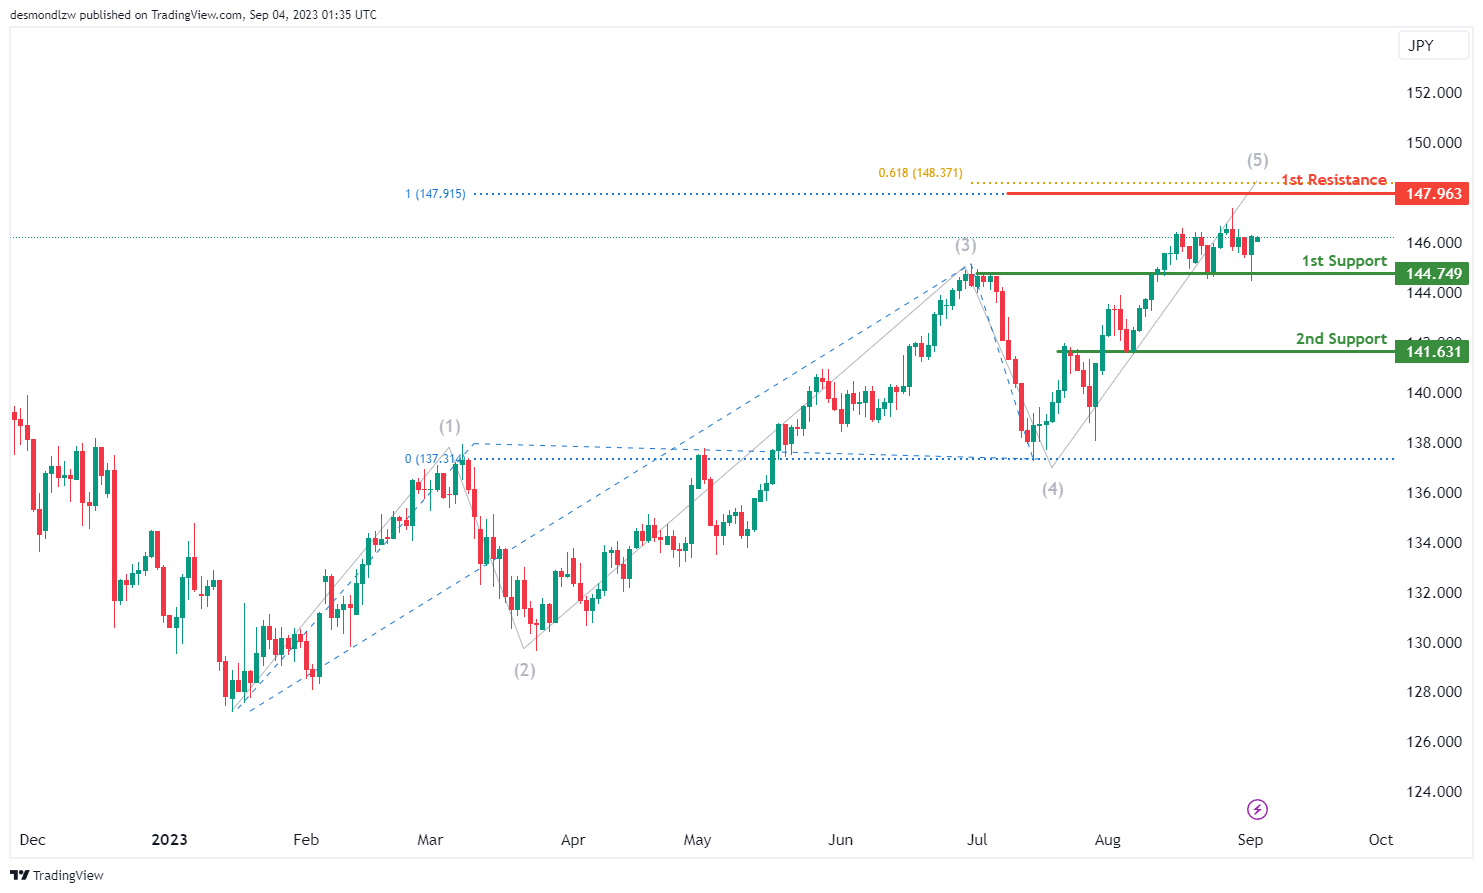
The USD/JPY chart is currently demonstrating a bullish overall momentum, indicating an upward trend in the price movement. There is potential for the price to continue its bullish trajectory and possibly reach the 1st resistance level.
The 1st support level at 144.74 is recognized as an overlap support, highlighting historical price action finding support around this region. This level establishes a foundation for potential upward movements.
Similarly, the 2nd support level at 141.63 is also considered an overlap support, suggesting that previous price action has seen support in this area as well.
Looking towards potential resistance levels, the 1st resistance at 147.96 holds significance due to its alignment with the 100% and 61.80% Fibonacci projections. This confluence of Fibonacci levels adds to the importance of this resistance level, making it a point of interest for potential price reactions.
USD/CAD:
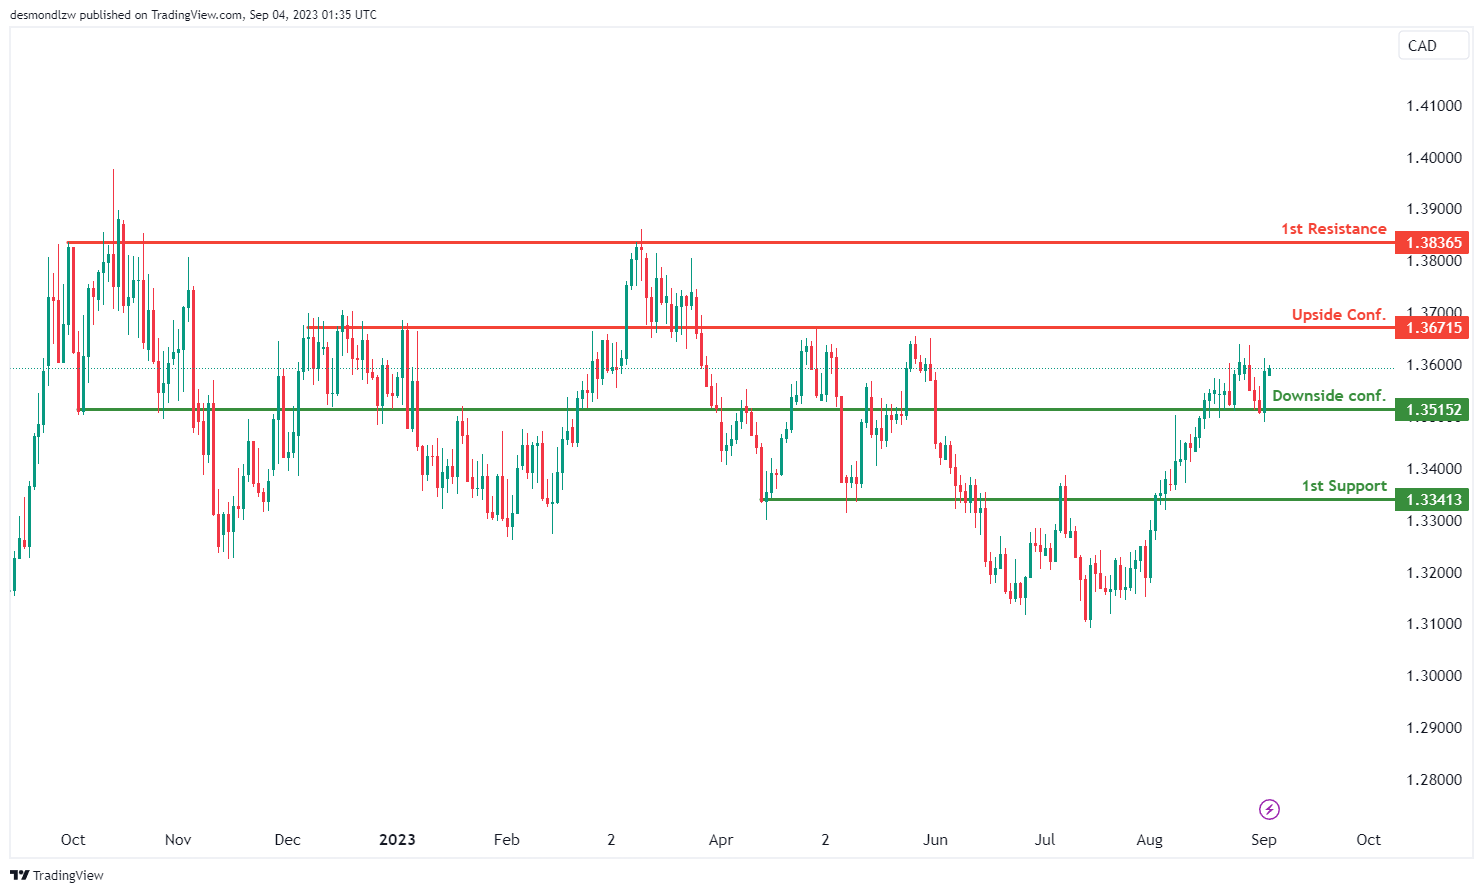
The USD/CAD chart is currently displaying an overall neutral momentum, indicating a lack of a clear trend direction. In this scenario, there’s a possibility that price could fluctuate within the boundaries as defined by the 1st resistance and the 1st support levels.
The 1st support at 1.3341 is identified as an overlap support while the 1st resistance level at 1.3837 is marked as a multi-swing high resistance.
The intermediate support level at 1.3515 is identified as an overlap support and is also marked as a downside confirmation level, indicating that if price breaks under this level, there is potential for further downside movement towards the 1st support.
The intermediate resistance level at 1.3672 is identified as an overlap resistance and is also marked as an upside confirmation level, indicating that if price breaks above this level, there is potential for further upward movement towards the 1st resistance.
AUD/USD:
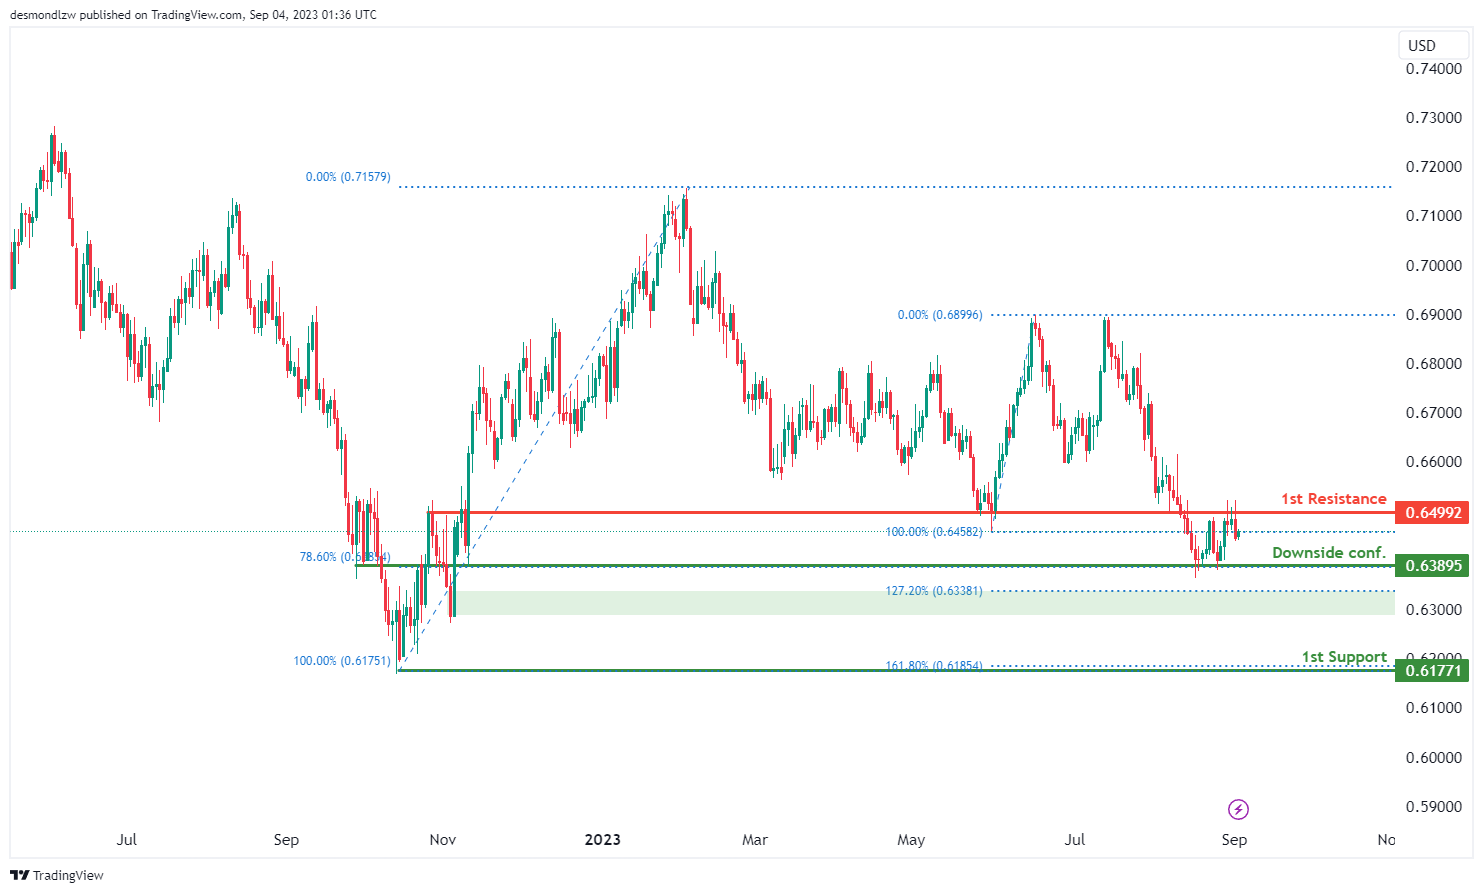
The AUD/USD chart is currently exhibiting an overall neutral momentum, suggesting a lack of a distinct trend direction. Given this scenario, there’s a potential scenario where the price might fluctuate between the 1st resistance and the 1st support levels.
The intermediate support at 0.6390 is noted as pullback support that coincides with the 78.60% Fibonacci retracement level and is also marked as a downside confirmation level, indicating that if price breaks under this level, there is potential for further downside movement towards the 1st support.
The 1st support level at 0.6177 is identified as an overlap support that aligns with the 161.80% Fibonacci extension level, adding to its potential significance as a support zone.
To the upside, the 1st resistance at 0.6499 is identified as an overlap resistance, implying that historical price action has encountered resistance around this level before.
NZD/USD
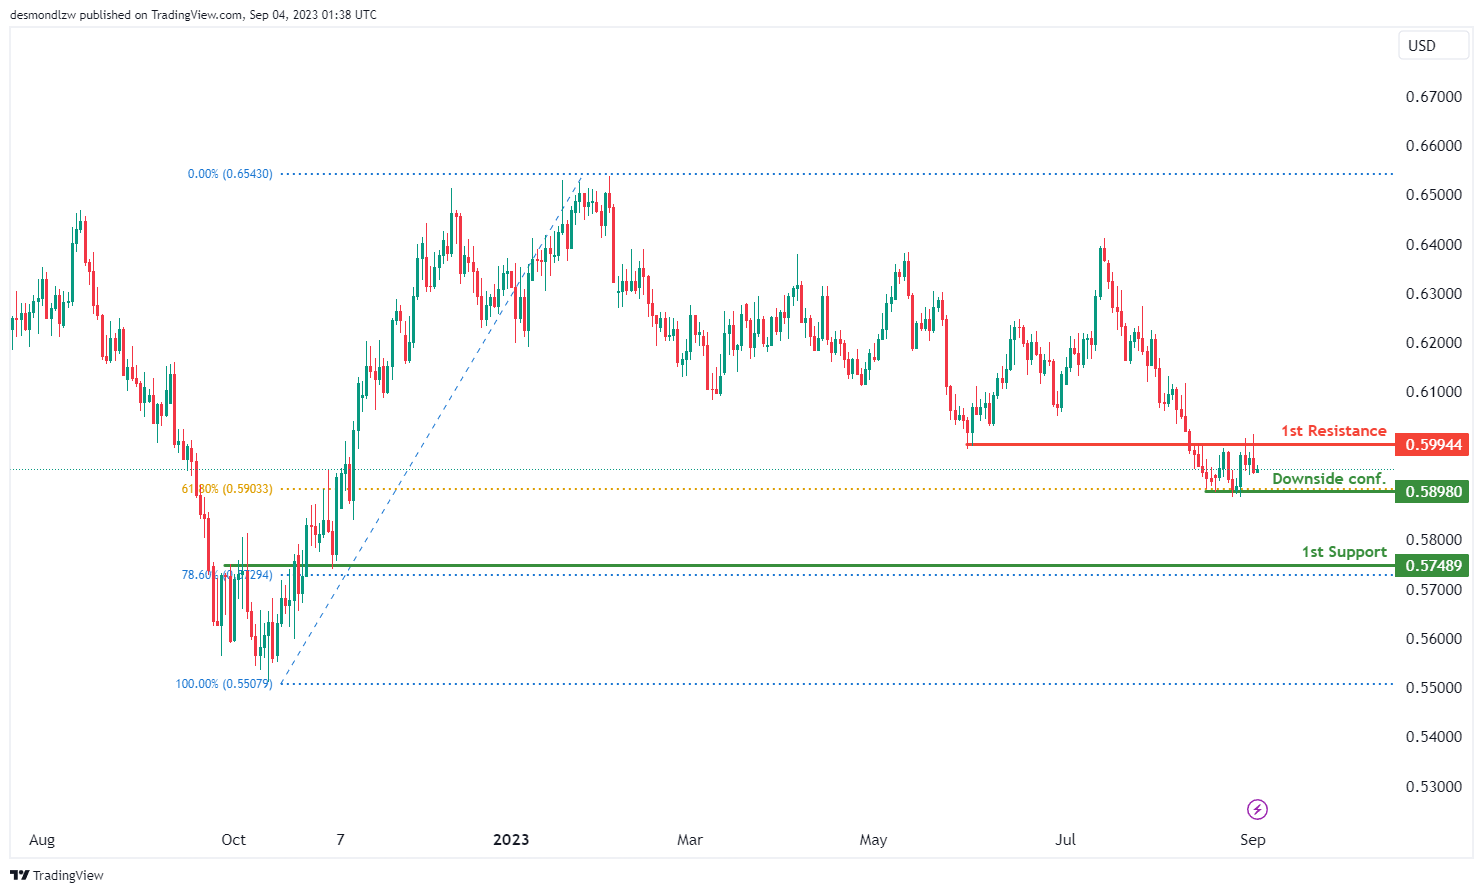
The NZD/USD chart currently presents an overall neutral momentum, suggesting a lack of clear trend direction. In this scenario, there’s a possibility that the price might fluctuate within a range between the 1st resistance and the 1st support levels.
The intermediate support at 0.5898 is identified as pullback support that aligns with the 61.8% Fibonacci retracement level and is also marked as a downside confirmation level, indicating that if price breaks under this level, there is potential for further downside movement towards the 1st support.
The 1st support level at 0.5748 is identified as an overlap support that aligns with the 78.6% Fibonacci retracement level. To the upside, the 1st resistance level at 0.5994 is noted as an overlap resistance, suggesting that historical price action has encountered resistance around this level before.
DJ30:
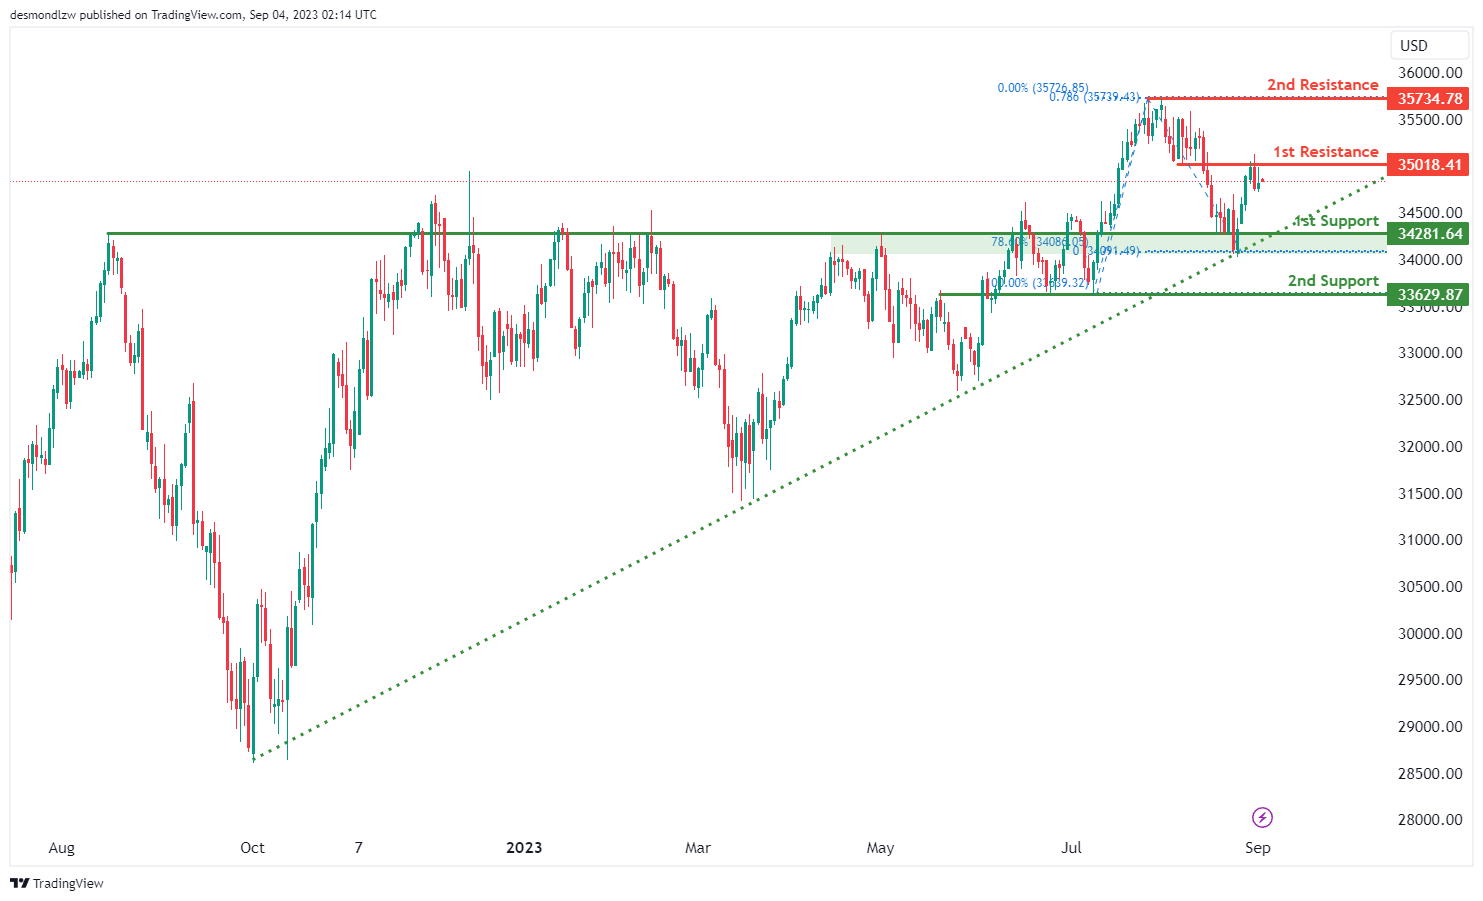
For DJ30, the chart indicates a bearish overall momentum.
The 1st support level at 34281.60 aligns with an overlap support and coincides with the 78.60% Fibonacci retracement level. This makes it a significant level where price could potentially find support.
The 2nd support level at 33629.80 is also identified as an overlap support, further strengthening its significance as a potential level for price to bounce.
The 1st resistance level at 35018.40 is marked as an overlap resistance, which suggests it could act as a barrier to further upward movement.
The 2nd resistance level at 35734.70 coincides with a swing high resistance and the 78.60% Fibonacci projection. This level could serve as a significant hurdle for any bullish attempts.
GER30:
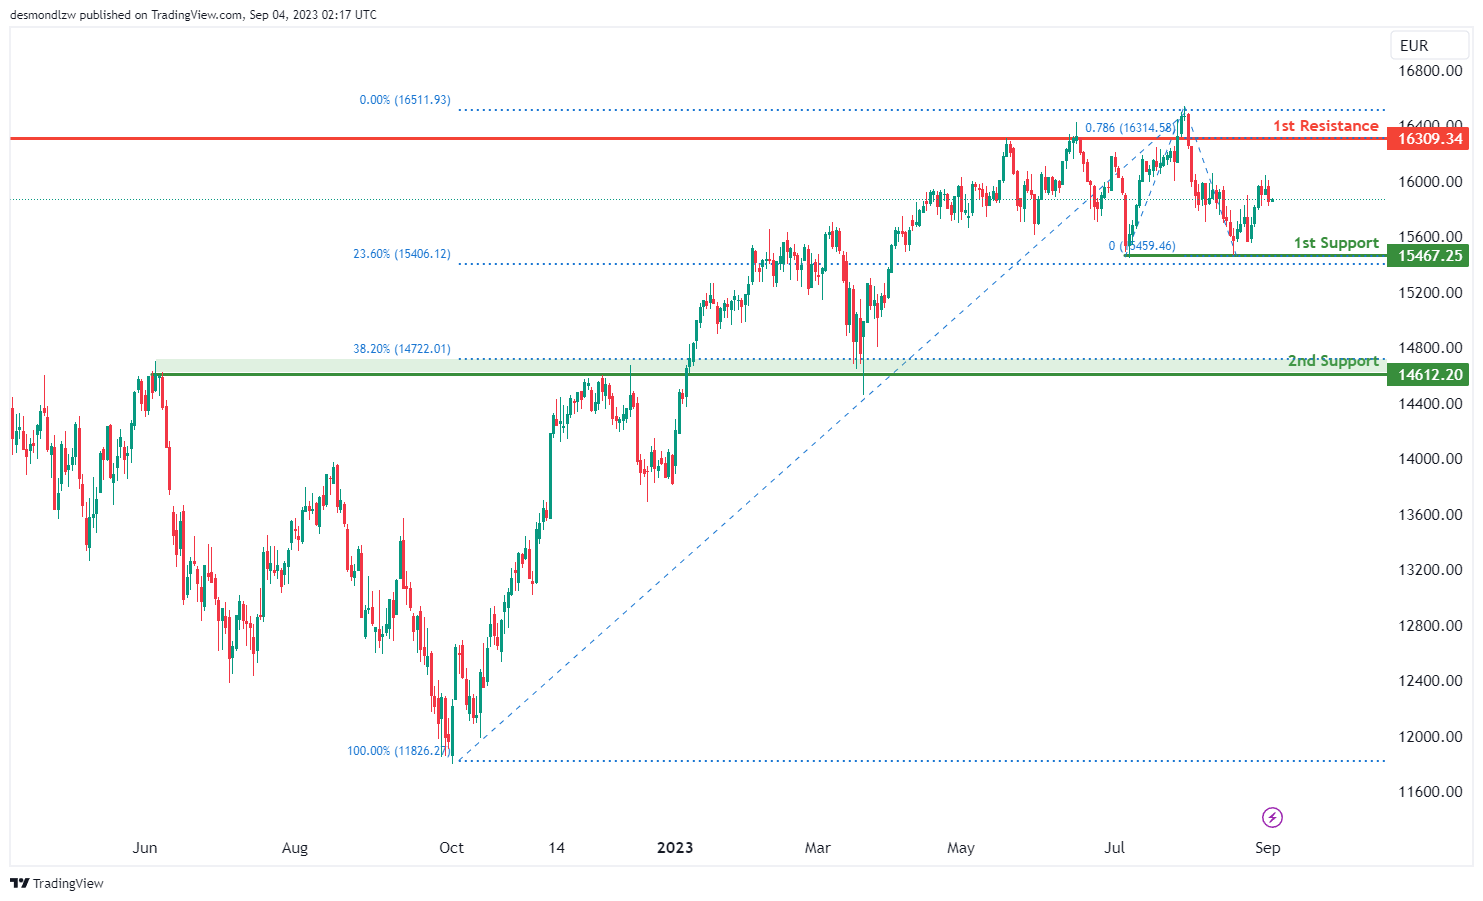
For GER30, the chart suggests a bearish overall momentum.
The 1st support level at 15467.20 is significant as it aligns with a multi-swing low support and coincides with the 23.60% Fibonacci retracement level. This makes it a strong candidate for potential support.
The 2nd support level at 14612.20 is identified as an overlap support and further strengthens its importance as a potential area where the price could find support.
The 1st resistance level at 16309.30 is marked as an overlap resistance, indicating it could act as a barrier to any upward movements.
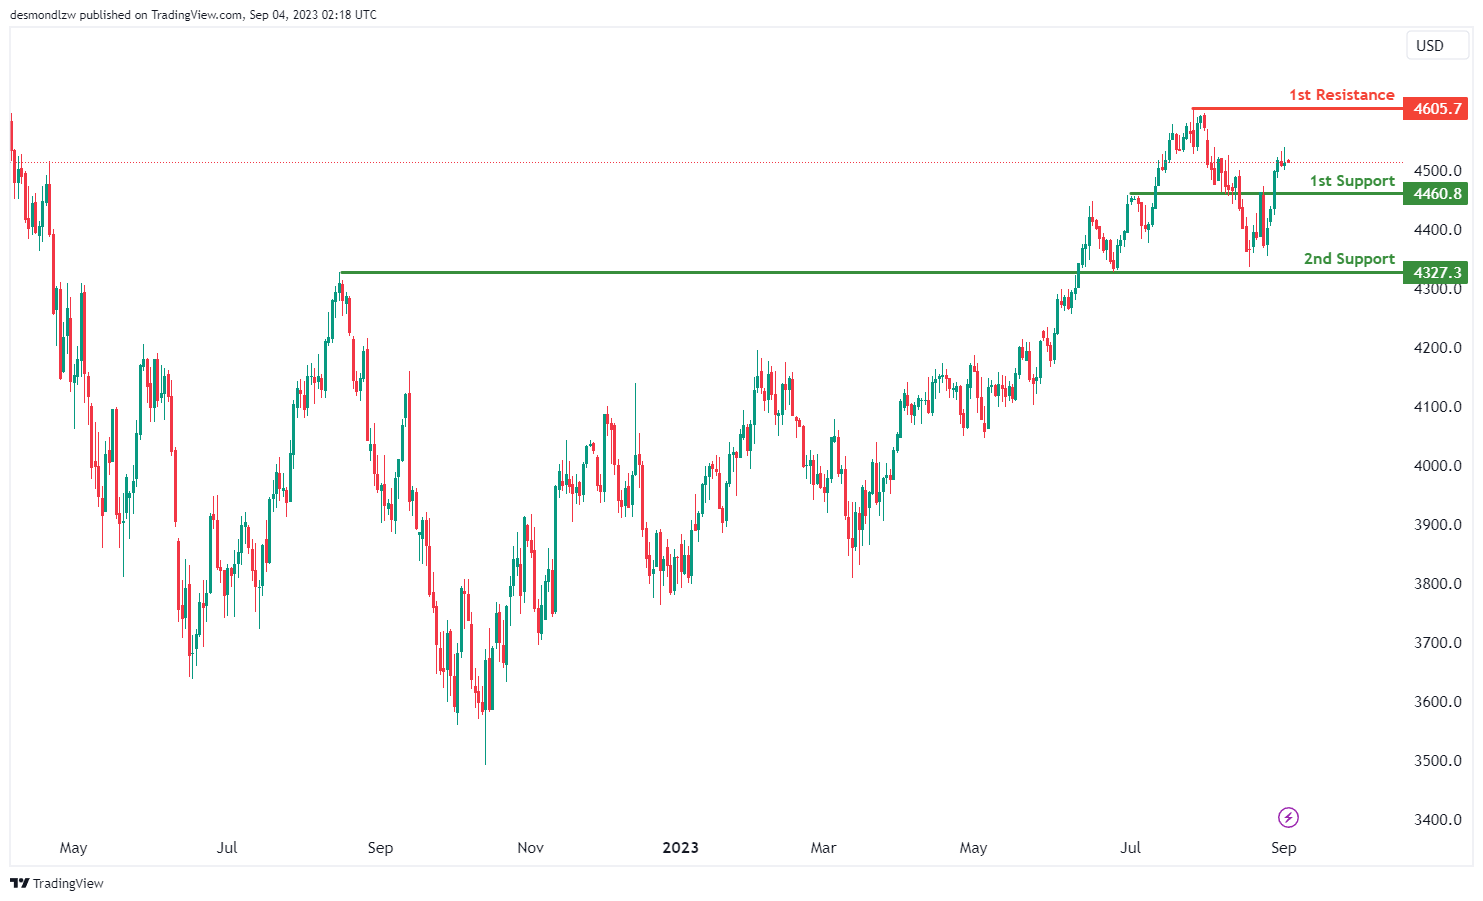
US500
The chart for US500 suggests a bullish momentum, with the price above the bullish Ichimoku cloud.
The 1st support level is at 4460.8, which is considered as a pullback support, and the 2nd support level is at 4327.3, which is an overlap support. These support levels may attract buyers after a short decline.
The 1st resistance is at 4605.7, which is a swing high resistance, often a tough level for price to break past. Given the bullish trend, there could be a brief drop to the 1st support before a potential bounce towards the 1st resistance.
BTC/USD:
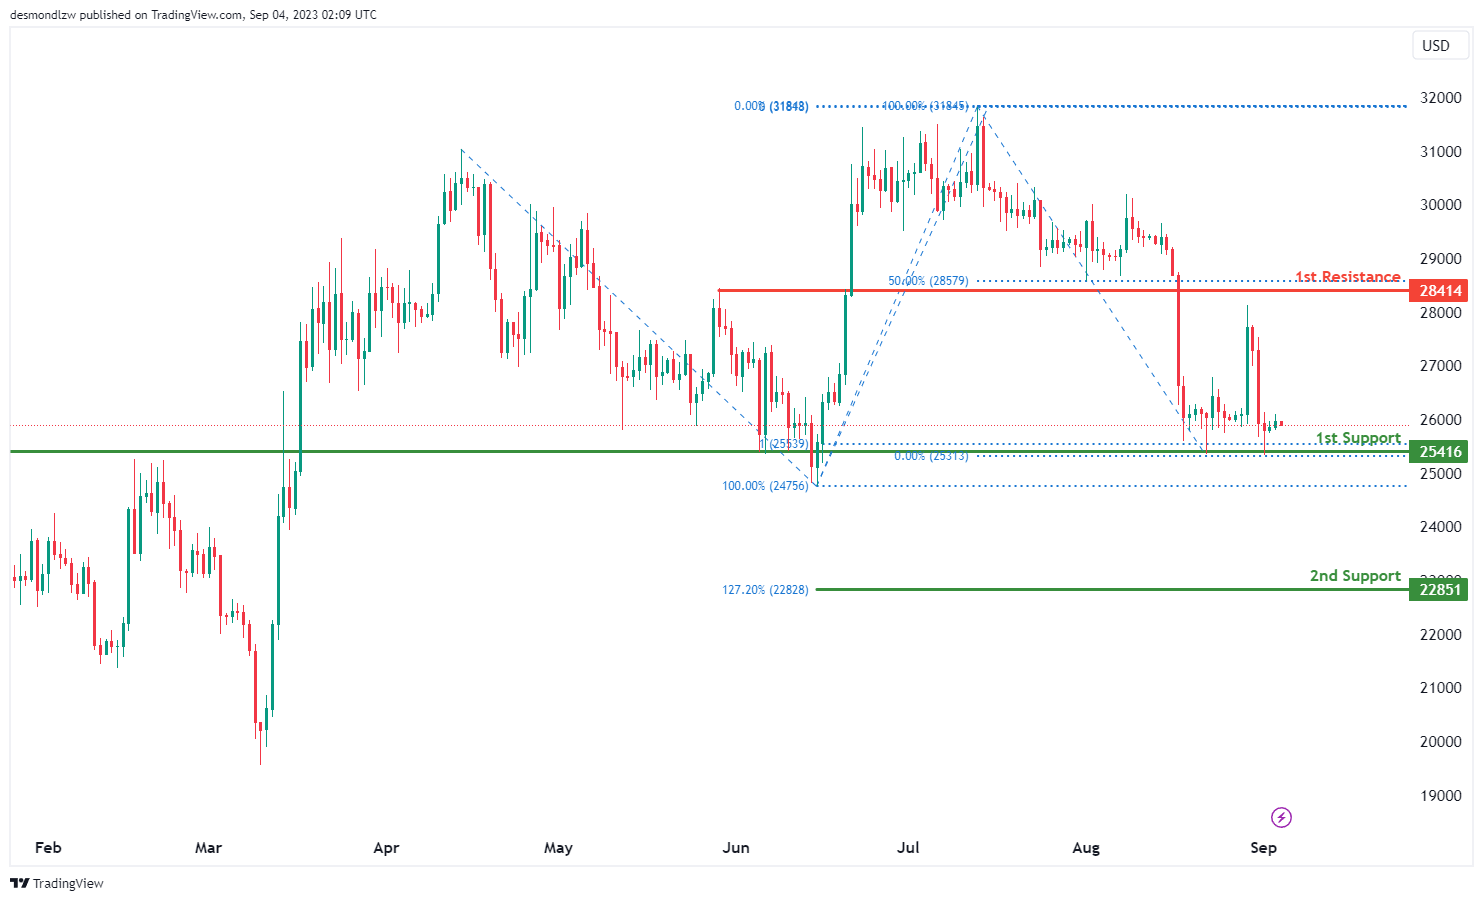
For BTC/USD, the chart suggests a bullish overall momentum.
The 1st support level at 25416 aligns with an overlap support and coincides with the 100% Fibonacci projection. This level could act as a strong support area for the price.
The 2nd support level at 22851 aligns with the 127.20% Fibonacci extension, providing additional support in case of a retracement.
The 1st resistance level at 28414 is identified as a pullback resistance, which could serve as a significant barrier to further upward movement.
ETH/USD:
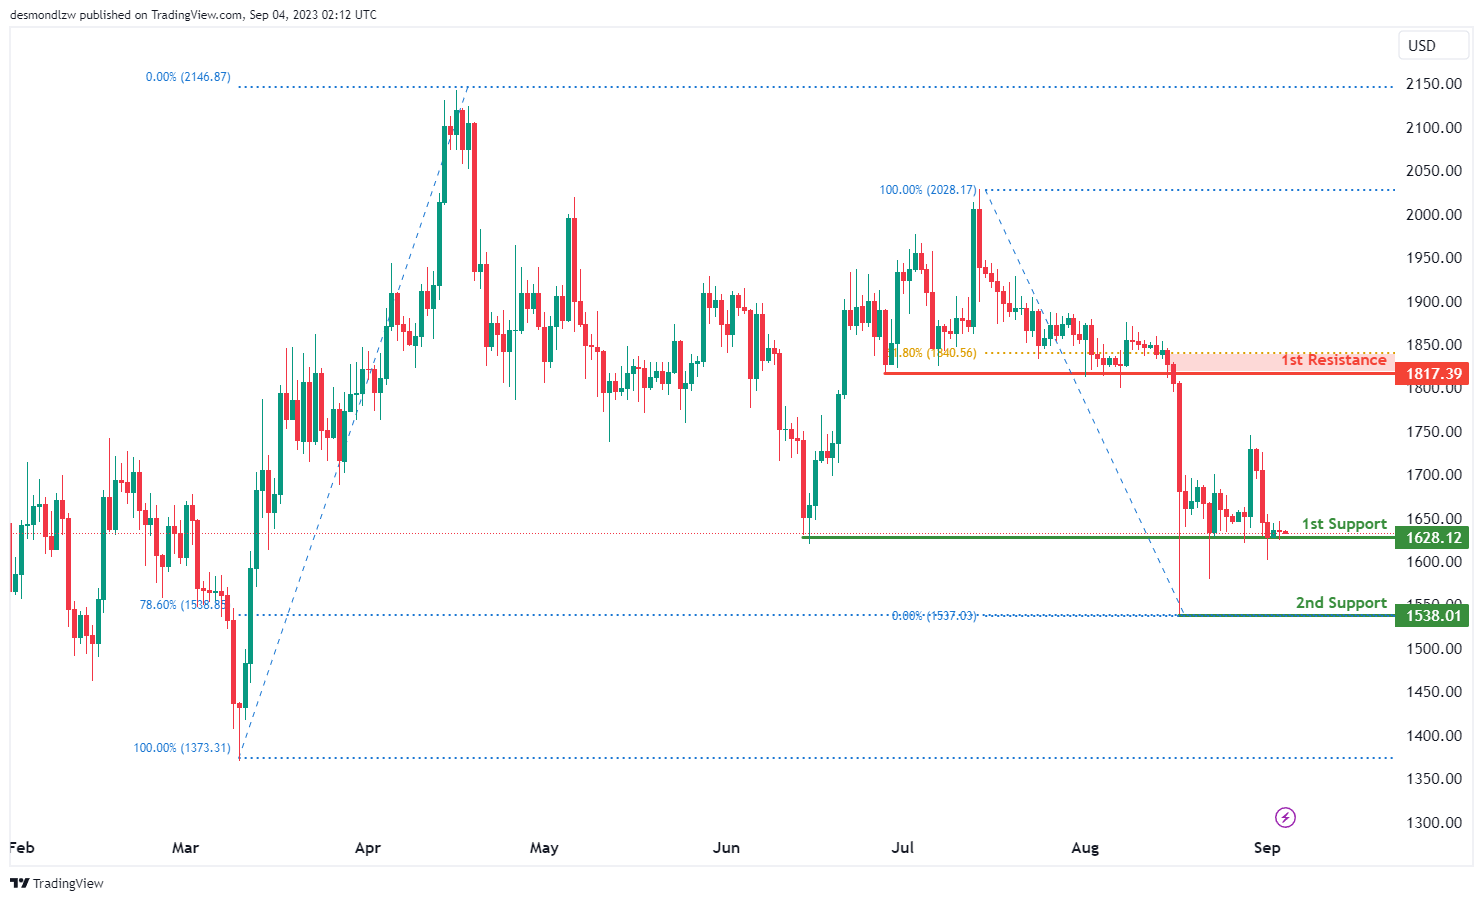
For ETH/USD, the chart indicates a bullish overall momentum.
The 1st support level at 1628.12 is based on multi-swing low support, suggesting it’s a significant level for potential price reversals or bounces.
The 2nd support level at 1538.01 aligns with a swing low support and coincides with the 78.60% Fibonacci retracement level. This adds strength to the support level.
The 1st resistance level at 1817.39 is identified as a pullback resistance, indicating that it could act as a significant barrier to further upward movement.
WTI/USD:
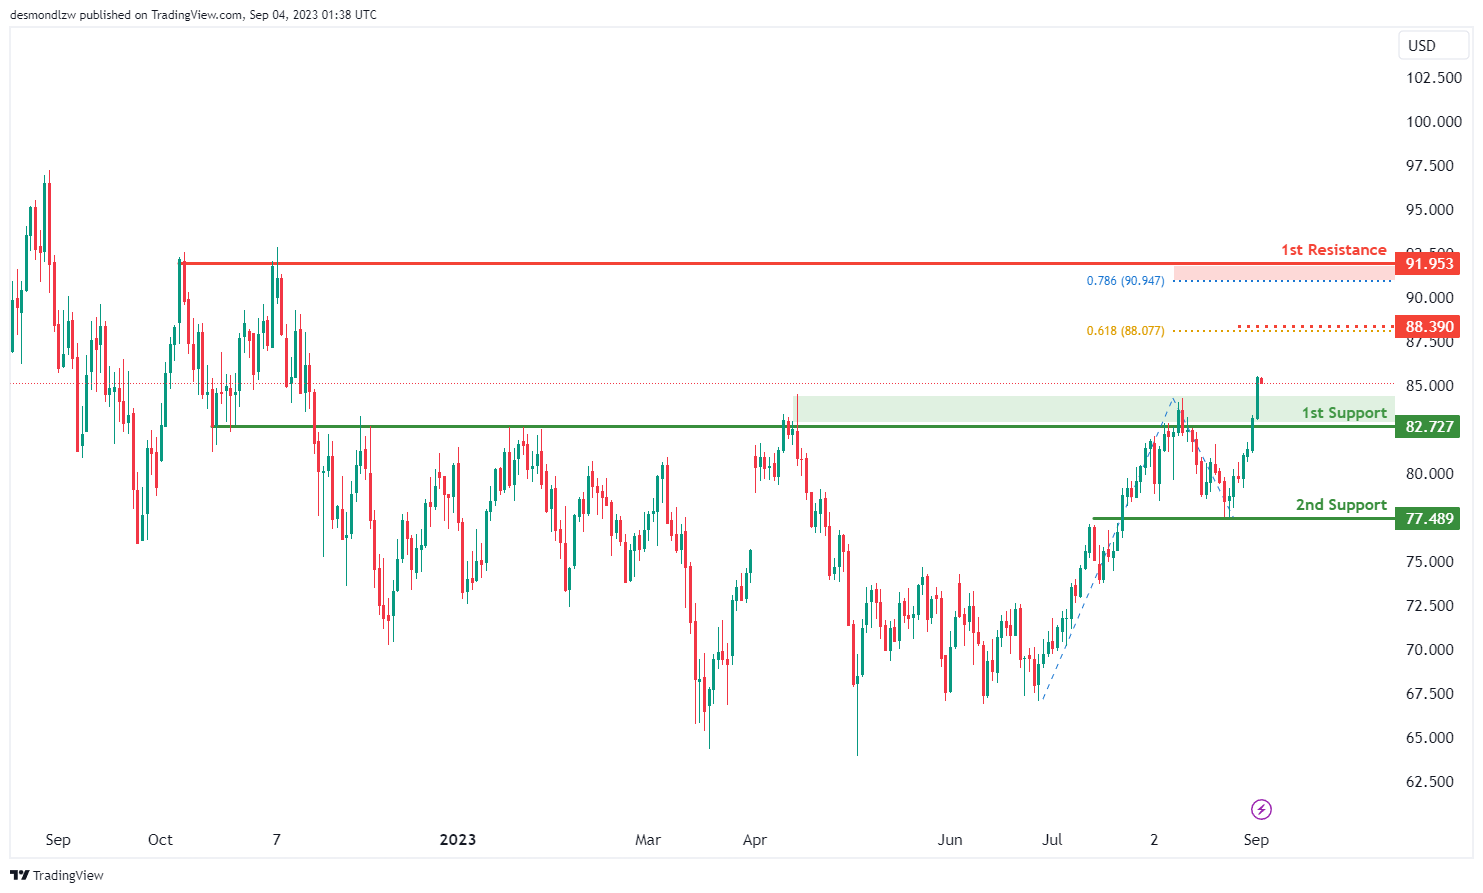
The WTI chart currently displays a bullish overall momentum, indicating an upward trend in the price movement. There’s a potential scenario for the price to continue its bullish trend and potentially reach the 1st resistance level.
The 1st support level at 82.72 is marked as pullback support, suggesting that this level could act as a base for potential upward movements. This level is where price might find support if it experiences a temporary pullback.
The 2nd support level at 77.48 is identified as an overlap support, indicating historical instances of price finding support around this level. It further reinforces the potential significance of this support level.
Looking at resistance levels, the 1st resistance at 91.95 is marked as a multi-swing high resistance. This level holds importance due to its alignment with the 78.60% Fibonacci projection level, adding to its potential significance as a resistance zone.
Additionally, the intermediate resistance at 88.39 is noted for its alignment with the 61.80% Fibonacci projection level. This further reinforces the potential for resistance at this level.
XAU/USD (GOLD):
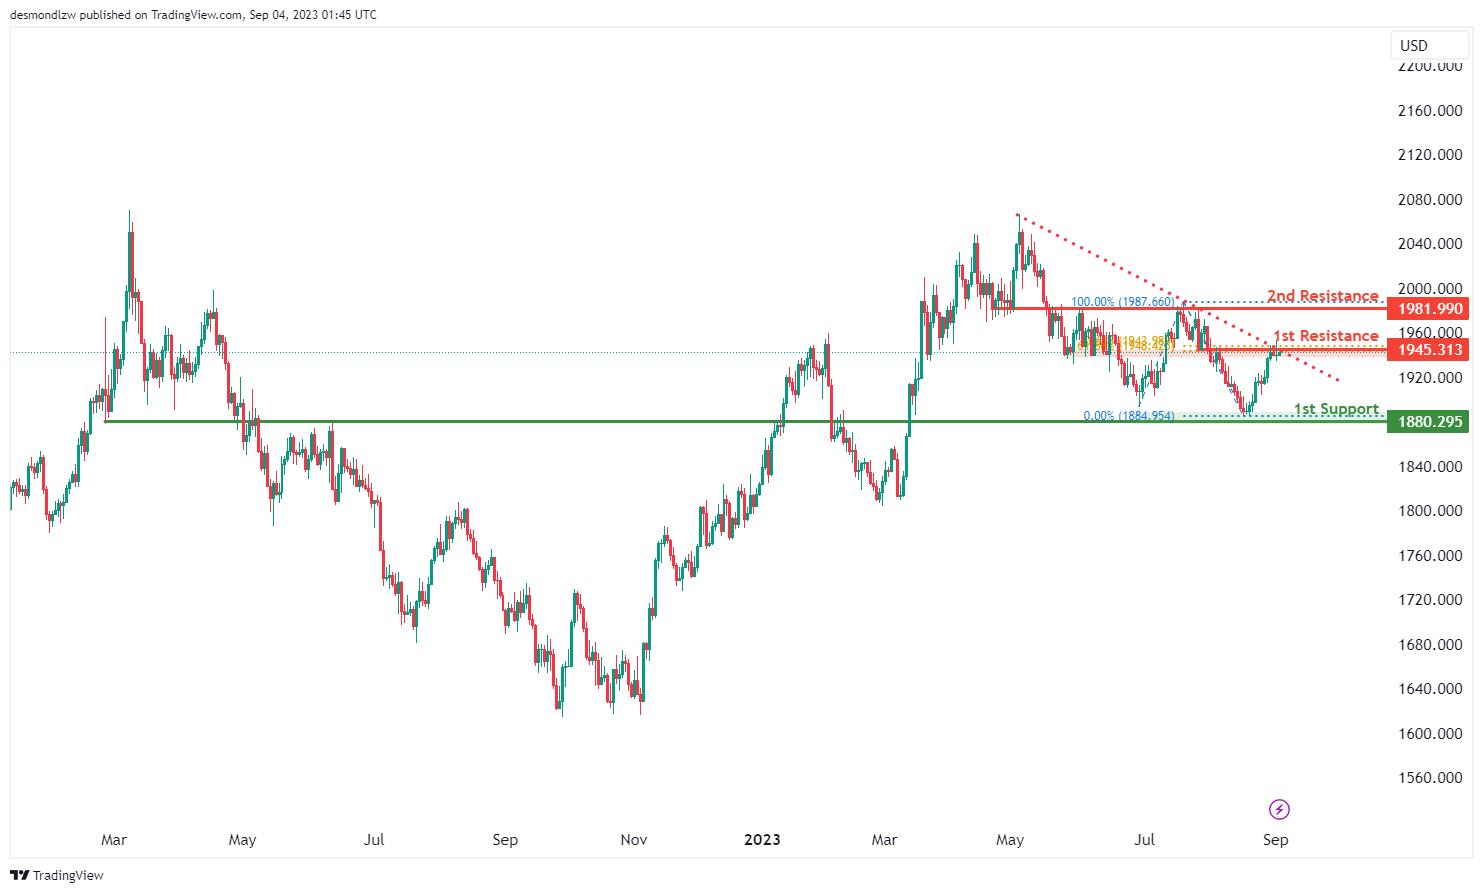
The XAU/USD chart currently exhibits a bearish overall momentum, signaling a downward trend in the price movement. This bearish sentiment is reinforced by the fact that the price is positioned below a significant descending trend line, which suggests a continuation of bearish momentum.
There’s a potential scenario where the price reacts bearishly at the 1st resistance level, leading to a drop towards the 1st support.
The 1st support level at 1880.29 is identified as an overlap support, indicating historical instances of the price finding support around this level. This support level could act as a base for potential downward movements.
Looking at resistance levels, the 1st resistance at 1945.31 holds particular importance due to its alignment with the 61.80% Fibonacci retracement and 61.80% Fibonacci projection. This confluence of Fibonacci levels enhances the significance of this resistance level, making it a noteworthy zone to monitor for potential price reactions.
Additionally, the 2nd resistance at 1981.99 is also marked as an overlap resistance, suggesting that historical price action has encountered resistance in this area before.
New Zealand goods terms of trade rose 0.4% in Q2
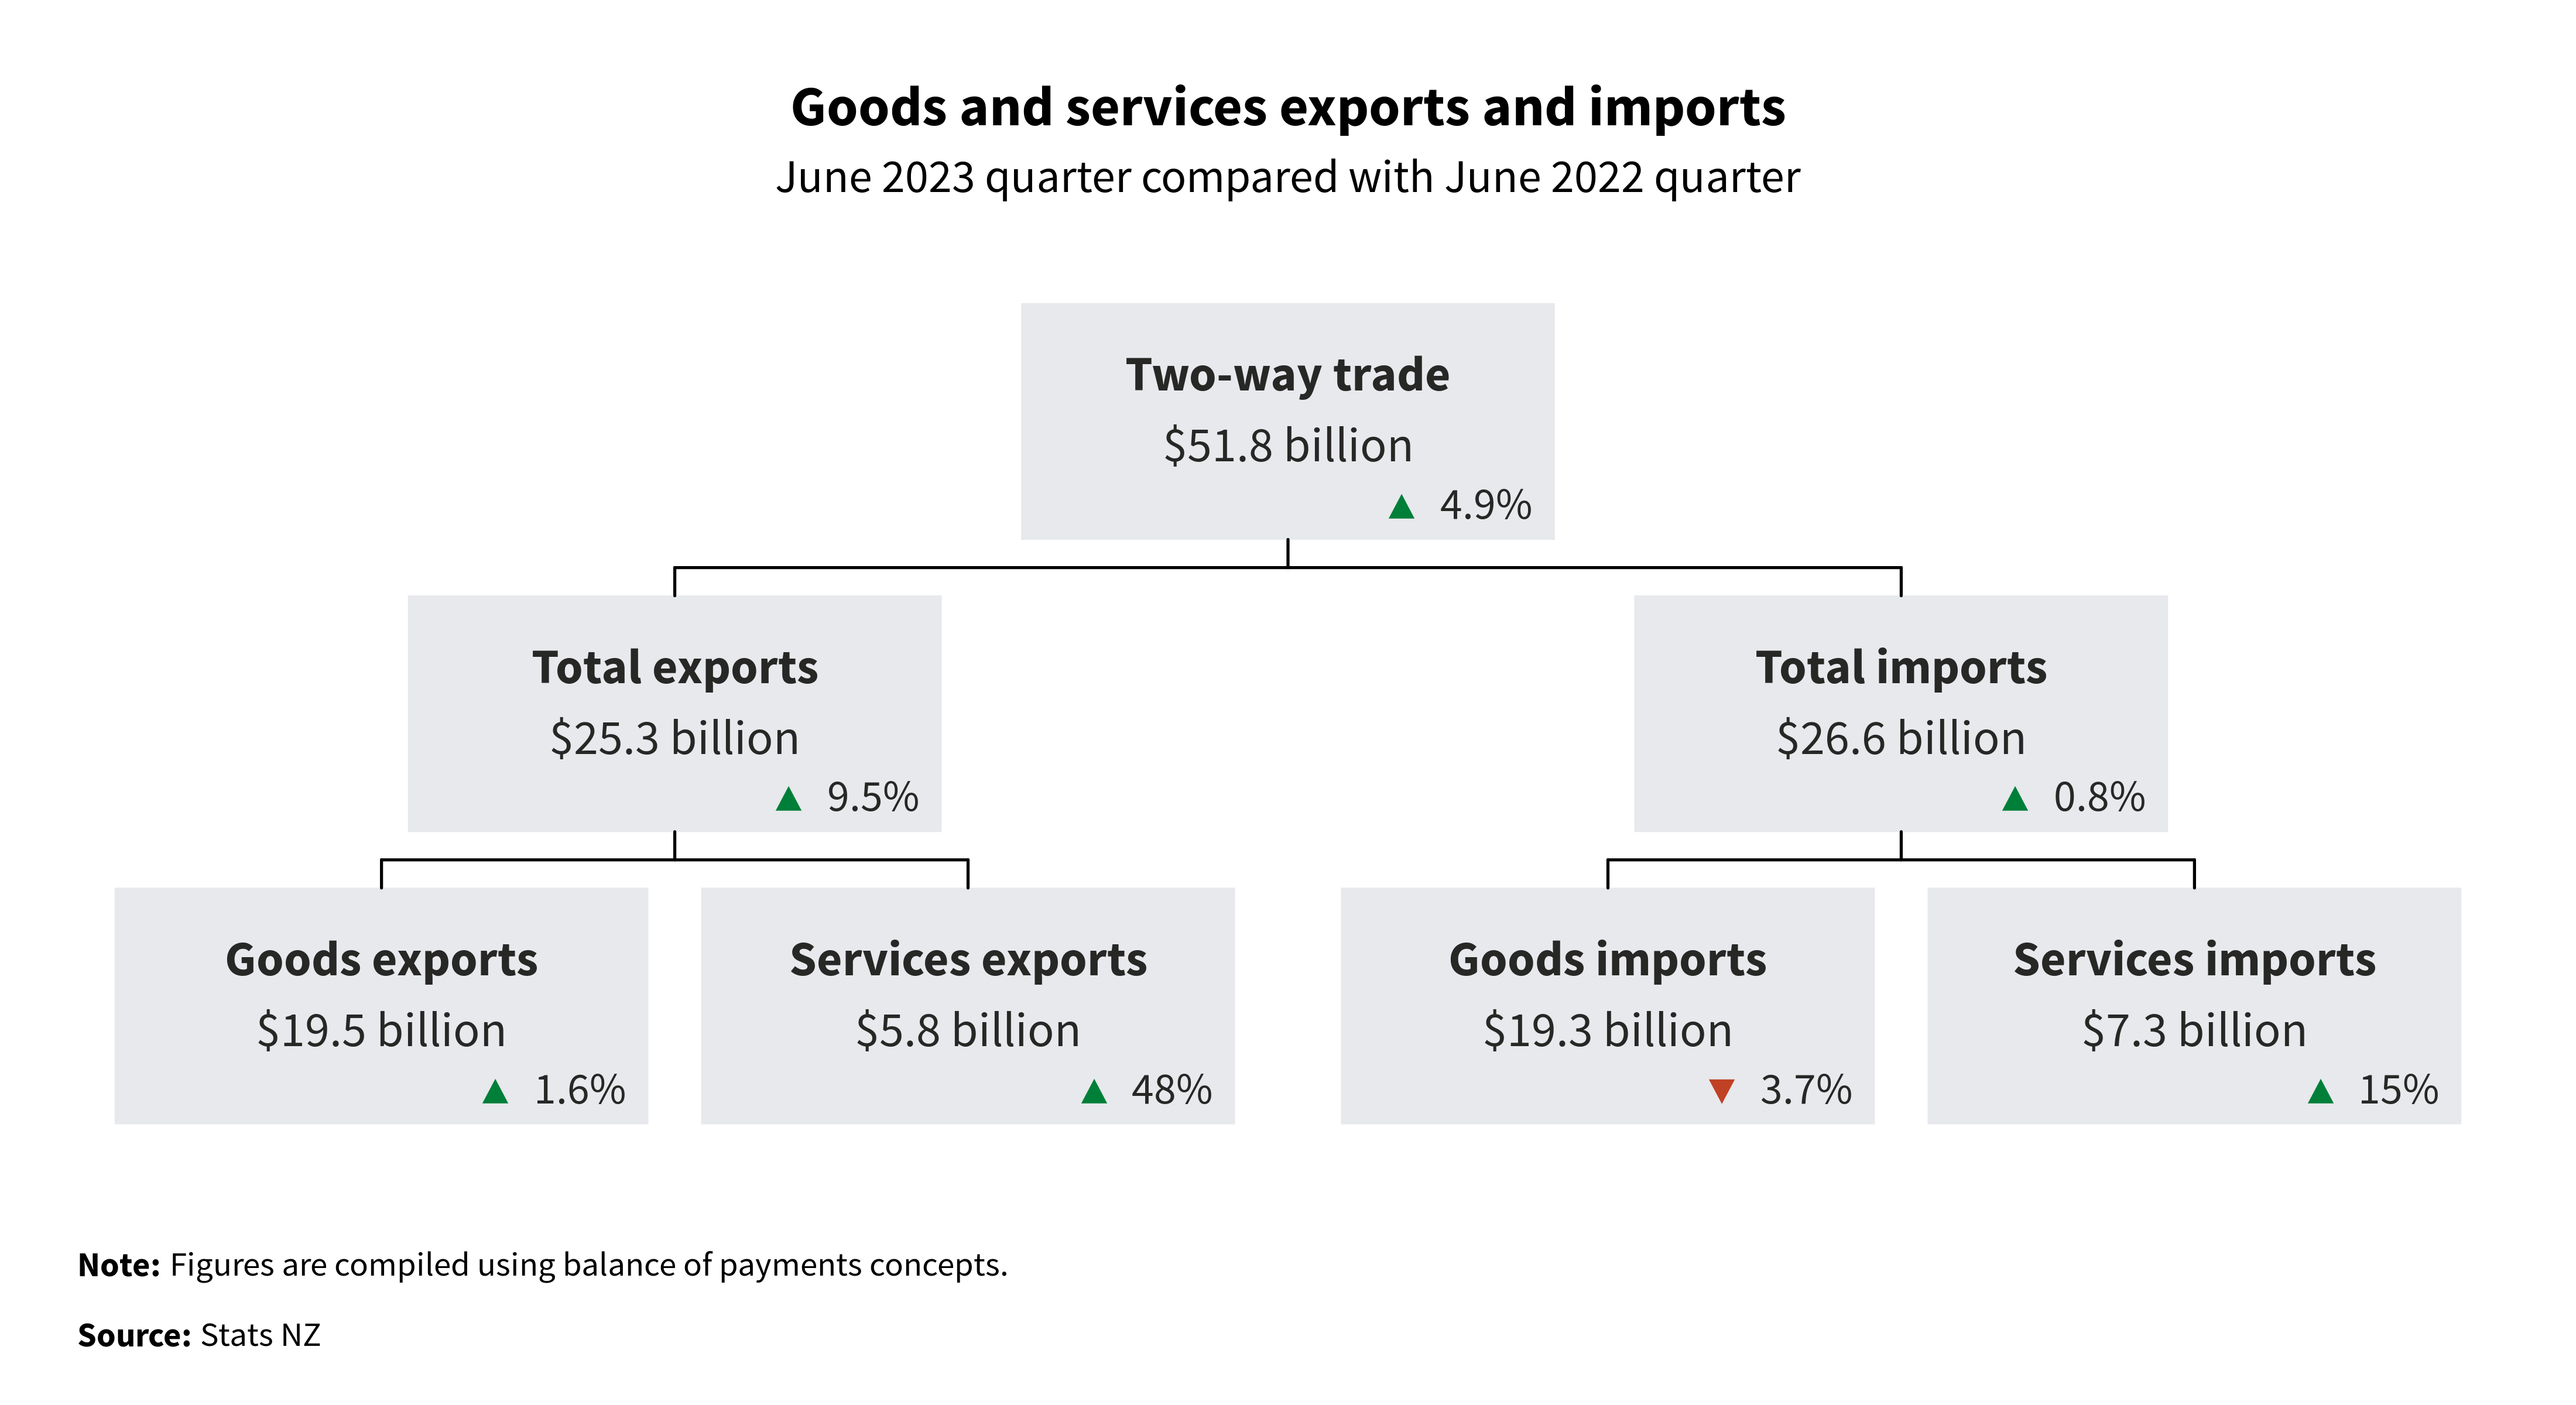
In Q2 2023, New Zealand's goods terms of trade rose by a 0.4%, much better than expectation of -1.3% decline. Both export and import prices for goods witnessed a dip, falling -0.6% and -1.0% respectively. Export volumes surged 6.8%, while import volumes declined by -2.8%, suggesting robust external demand and potentially cautious domestic consumption.
The services sector terms of trade rose significantly by 4.4%, a robust figure indeed. Export prices for services edged up 0.3%, whereas import prices saw a more considerable decline of -3.9%.
Alasdair Allen, international trade manager, highlighted that New Zealand typically enjoys a trade surplus with China, increasingly driven by trade in goods. The trade surplus for Q2 stood at a NZD 2.0B, with total goods and services exports to China valued at NZD 5.8B, and imports at NZD 3.8B. Notably, there have been only three quarterly goods deficits with China over the past five years.
ECB Wunsch inclined to do a little bit more
In a radio interview over the weekend, Pierre Wunsch, a hawkish member of ECB Governing Council, signaled that more action may be needed to address the issue of "very persistent" inflation in Eurozone.
"I'm inclined to say we maybe need to do a little bit more," Wunsch stated on Belgian public radio, leaving the door open for additional monetary policy adjustments.
Wunsch clarified that it's too soon to talk about a complete stop in tightening. He added that he does not expect inflation to come back to ECB's target of 2% before 2025.
EUR/USD Is Still At Risk of More Downsides
Key Highlights
- EUR/USD trimmed gains and retested the 1.0780 support.
- It traded below a bullish trend line with support near 1.0800 on the 4-hour chart.
- GBP/USD is also moving lower below the 1.2650 support.
- USD/JPY is eyeing a fresh increase toward the 147.40 level.
EUR/USD Technical Analysis
The Euro attempted an upside correction above the 1.0820 resistance against the US Dollar. EUR/USD climbed above 1.0880 but struggled to surpass 1.0950.
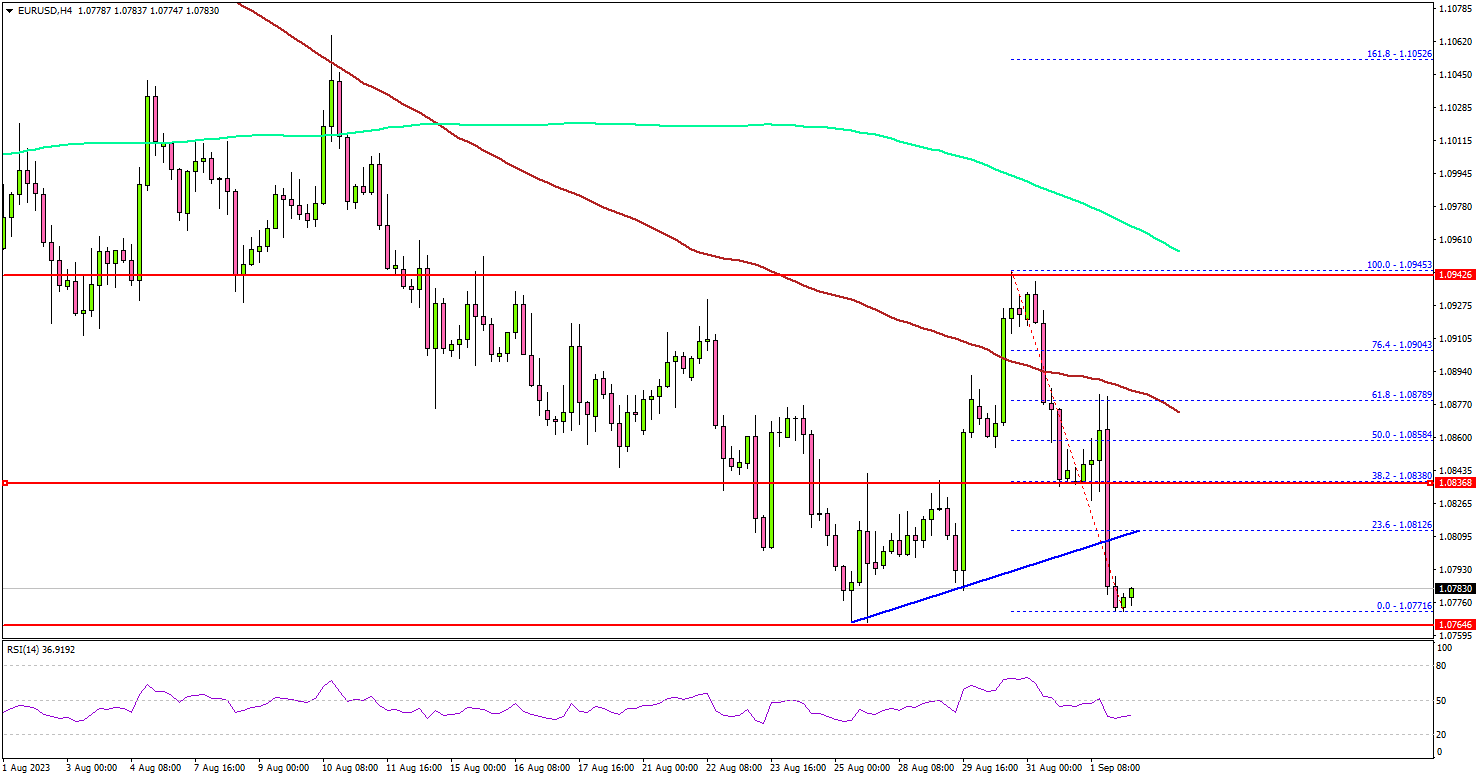
Looking at the 4-hour chart, the pair peaked near 1.0945 and started a fresh decline. It trimmed all gains and traded below the 1.0850 level. Besides, it traded below a bullish trend line with support near 1.0800.
The pair is now retesting the 1.0780 support zone, and trading below the 100 simple moving average (red, 4 hours) and the 200 simple moving average (green, 4 hours).
On the upside, an initial resistance is near the 1.0810 level. The first major resistance is near the 1.0840 level. A close above 1.0840 could start a decent increase. In the stated case, the pair could rise toward the 1.0950 level. Any more gains could send the pair toward the 1.1000 level.
If not, the pair might start a fresh decline below the 1.0780 support. The next key support is seen near the 1.0750 level.
If there is a move below 1.0750, the pair could dive toward 1.0710. Any more losses might send the pair toward the 1.0650 level.
Looking at GBP/USD, the pair declined below the 1.2650 level and there could be more downsides in the near term.
Economic Releases
- ECB's President Lagarde speech.
WTI Oil Technical: Risk of Countertrend Setback After Rallying a Year-to-Date High
- Erased prior two weeks of consecutive losing streaks to trade a current year-to-date closing high of US$86.31 per barrel printed on last Friday, 1 September.
- Price actions are oscillating within short-term and medium-term uptrend phases.
- Hourly technical indicators (RSI & Bollinger Bands Bandwidth) are suggesting the risk of an imminent minor pull-back in price actions after last week’s strong upside reversal.
- Watch the key short-term pivotal resistance at US$87.25 per barrel.
The price actions of West Texas Oil (a proxy of WTI crude oil futures) have managed to snap its prior two weeks of consecutive losing streak and cleared above the US$84.90 resistance as highlighted in our previous report. Also, it recorded a weekly gain of +7.35% for the week ended last Friday, 1 September.
Rallied to a 10-month high
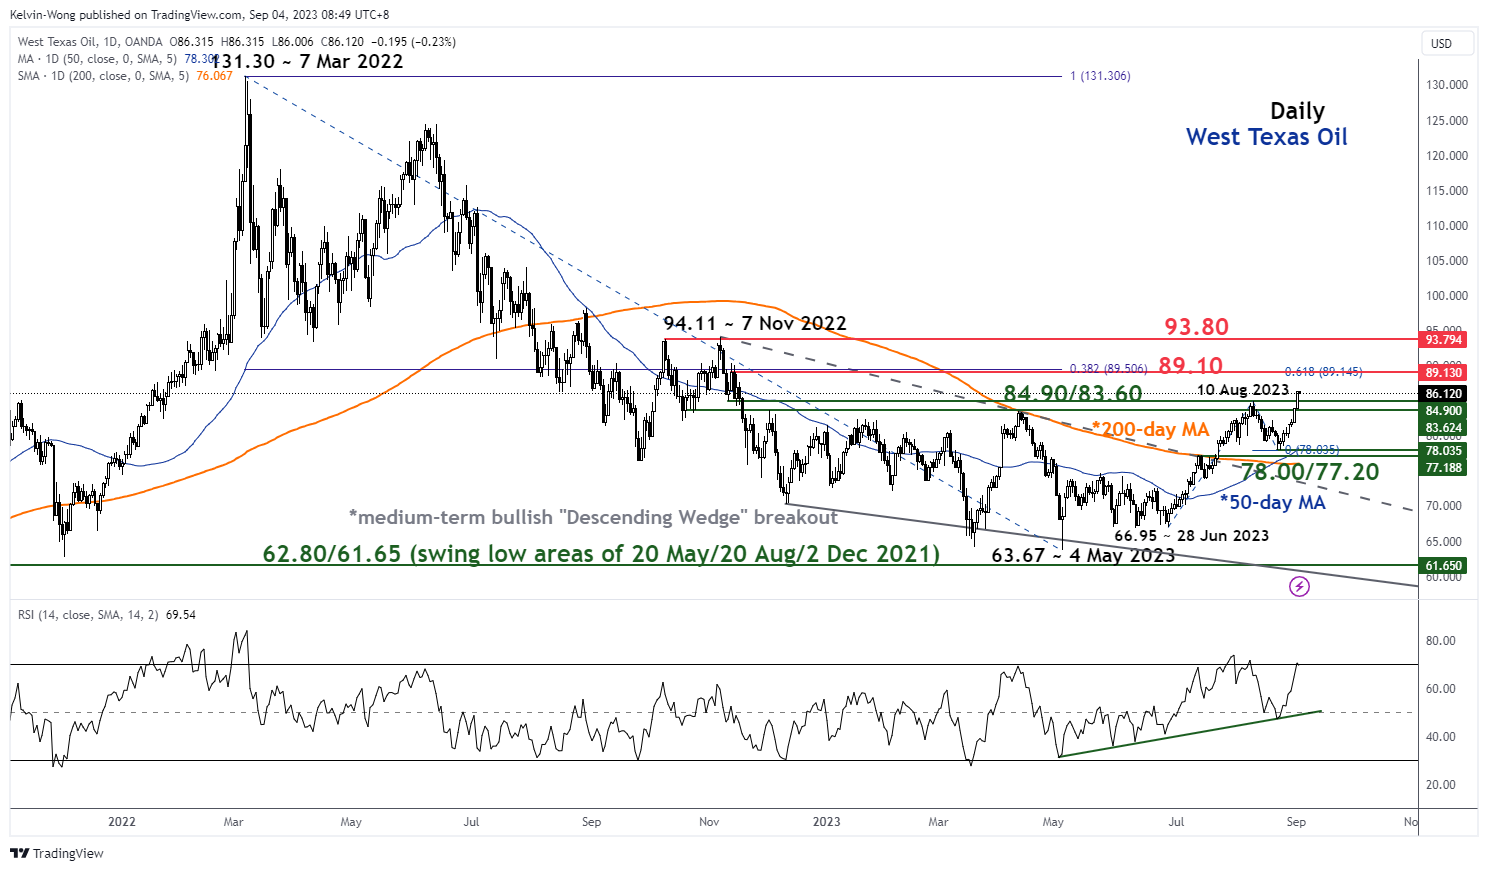
Fig 1: West Texas Oil medium-term trend as of 4 Sep 2023 (Source: TradingView, click to enlarge chart)
In addition, last Friday’s bullish momentum has allowed it to surpass its recent medium-term swing high of US$84.92 per barrel printed on 10 August 2023 and notched a current year-to-date closing high of US$86.31 on last Friday, also its highest level since 15 November 2022.
In addition, current price actions have managed to trade above their respective 20, 50, and 200-day moving averages which indicates that West Texas Oil is oscillating within short-term and medium-term uptrend phases.
Risk of an imminent minor pull-back in price actions
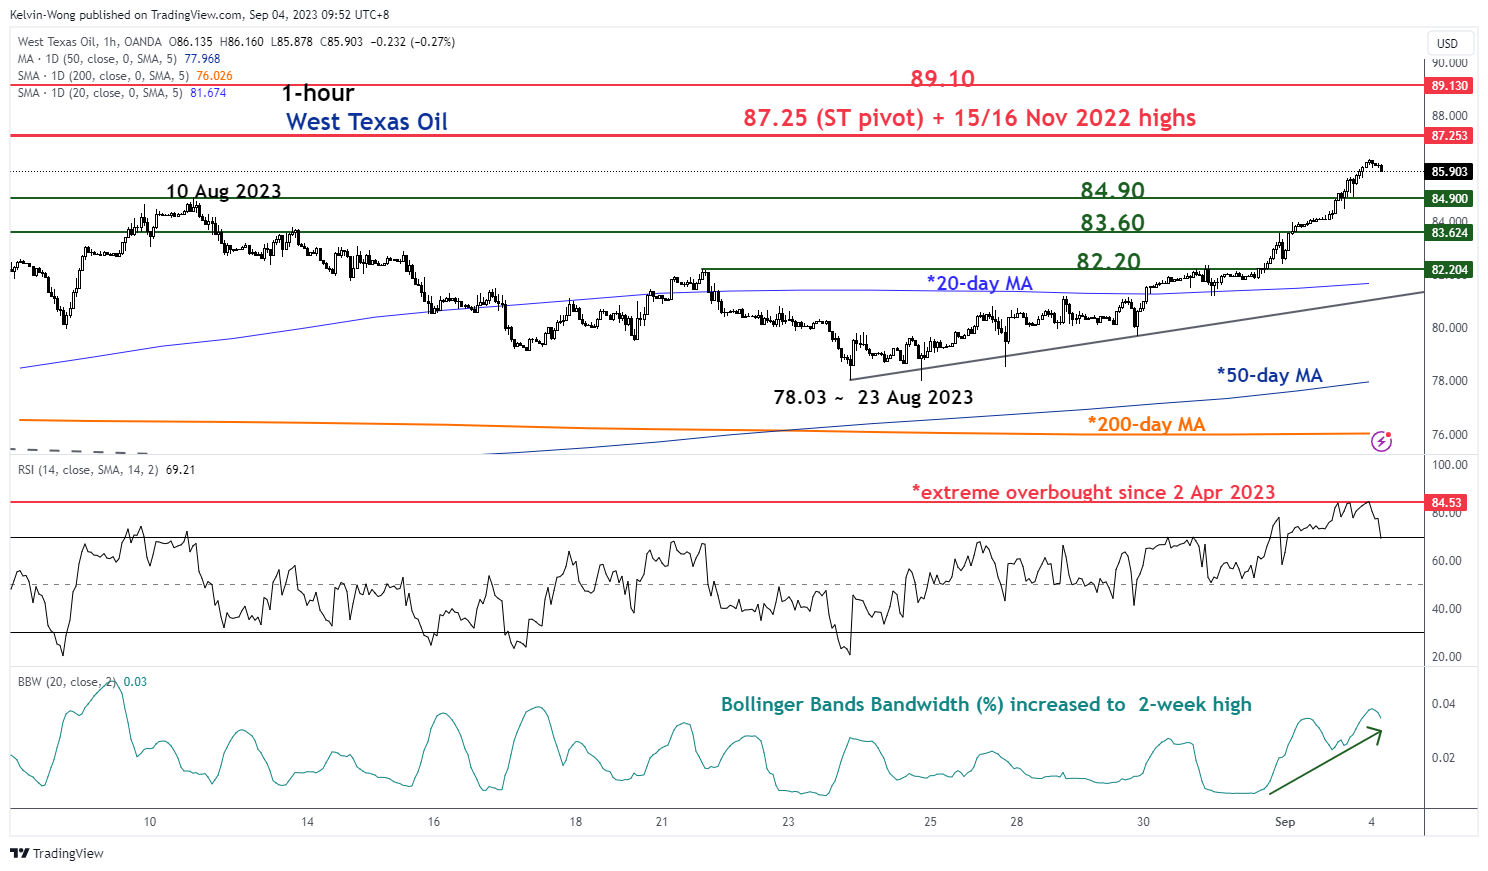
Fig 2: West Texas Oil minor short-term trend as of 4 Sep 2023 (Source: TradingView, click to enlarge chart)
However, the current up move of +10.7% from its 23 August 2023 low of US$78.03 to its 1 September 2023 high of US$86.36 seems overstretched which suggests that the current short-term uptrend phase is due for a potential minor pull-back/setback.
Two key technical conditions are advocating this potential minor pull-back/setback scenario for West Texas Oil within its ongoing short to medium-term uptrend phases.
Firstly, the hourly RSI oscillator has exploded to an extreme overbought condition of 84.53, its highest level since 2 April 2023. Secondly, the hourly Bollinger Bands Bandwidth (%) has increased to a two-week high which indicates a significant expansion in short-term volatility.
An expansion in short-term volatility as indicated by the widening of the hourly Bollinger Bands Bandwidth (%) tends to lead to a normalization of such a heightened level of volatility in the next few trading sessions which supports an imminent potential minor pull-back/setback for price actions.
Watch the US$87.25 key short-term pivotal resistance to maintain the potential minor pull-back/setback scenario for West Texas Oil towards the intermediate supports at US$84.90 and US$83.60.
However, a clearance above US$87.25 invalidates the minor bearish tone for a continuation of the bullish impulsive up move sequence to see the next resistance at US$89.10 (Fibonacci retracement/extension cluster; 38.2% Fibonacci retracement of the major downtrend from 7 March 2022 high to 4 May 2023 low & 0.618 Fibonacci extension of the medium-term uptrend from 28 June 2023 low to 10 August 2023 high projected to 23 August 2023 low).
NZDUSD Wave Analysis
- NZDUSD reversed from resistance level 0.6000
- Likely to fall to support level 0.5900
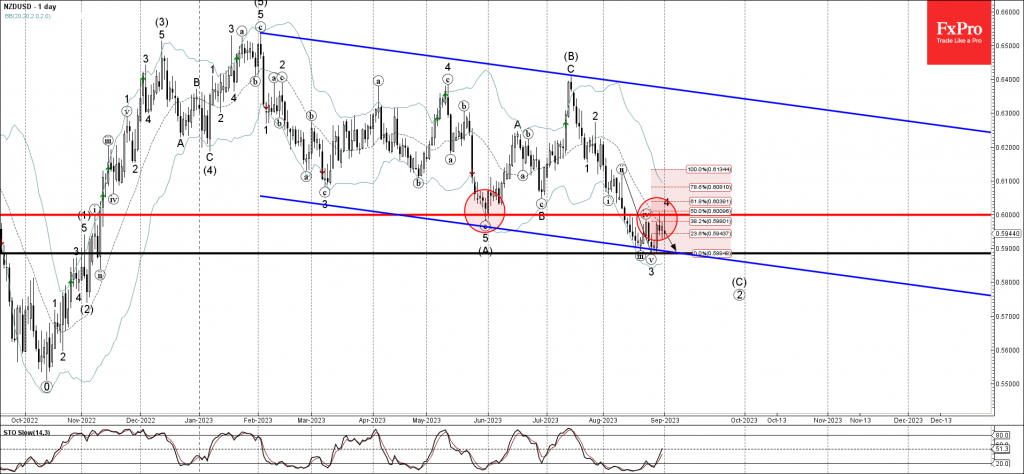
NZDUSD currency pair recently reversed down from the strong round resistance level 0.6000 (former multi-month support from June), coinciding with the 20-day moving average and the 50% Fibonacci correction of the downward impulse from the start of August.
The downward reversal from the resistance level 0.6000 stopped the wave 4 of the active sharp downward impulse wave C from July.
Given the overriding daily downtrend, NZDUSD can be expected to fall further toward the next support level 0.5900 (low of the previous impulse wave 3).
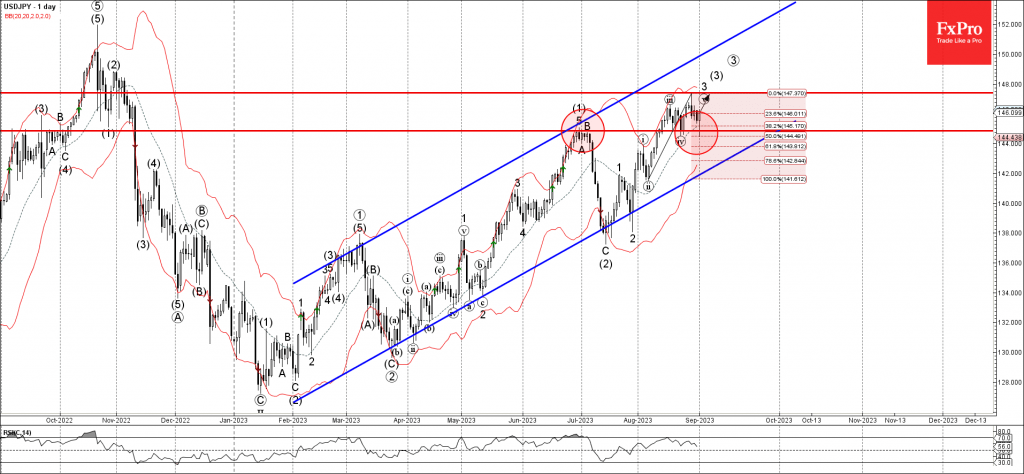
USDJPY Wave Analysis
- USDJPY reversed from support level 144.85
- Likely to test resistance level 147.40
USDJPY currency pair recently reversed up from the support level 144.85 (former resistance from the end of June), intersecting with the 50% Fibonacci correction of the upward impulse from the start of August.
The upward reversal from the support level 144.85 continues the active impulse waves 3 and (3).
Given the strong daily uptrend, USDJPY can be expected to rise further toward the next resistance level 147.40 (previous monthly high from August).