Sample Category Title
USD/CAD Daily Outlook
Daily Pivots: (S1) 1.3504; (P) 1.3538; (R1) 1.3581; More....
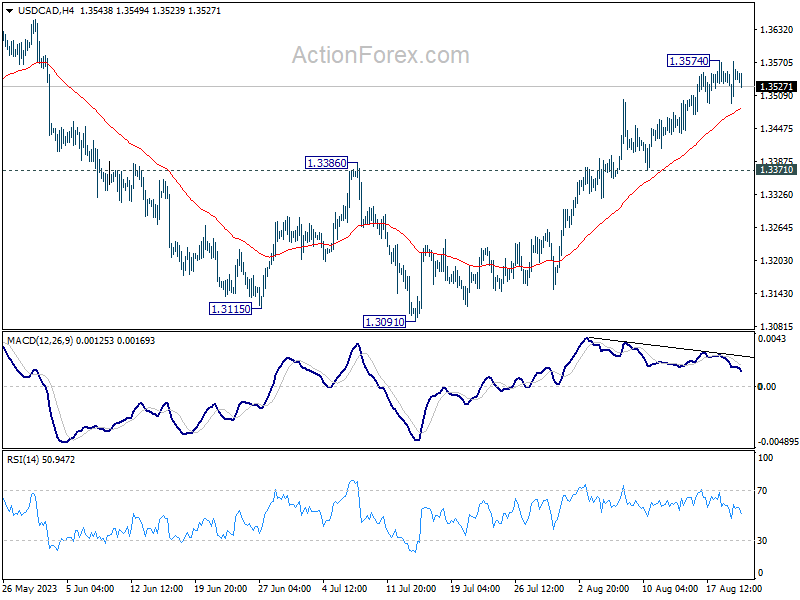
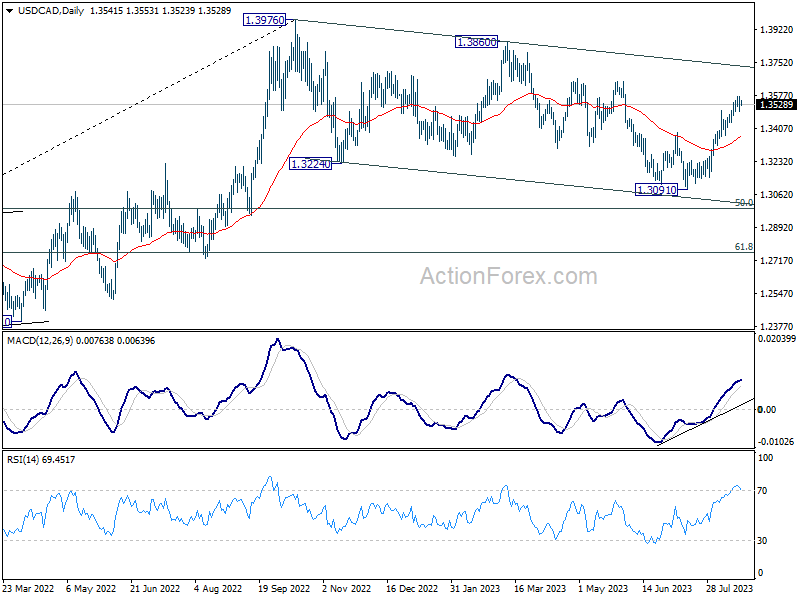
Intraday bias in USD/CAD is turned neutral again as consolidation from 1.3574 is going to extend for a while. But downside of retreat should be contained by 0.3371 to bring another rally. Break of 1.3574 will target 1.3653 resistance first. Decisive break there will confirm that correction from 1.3976 has completed, a target a test on this high.
In the bigger picture, price actions from 1.3976 are viewed as a corrective fall only. Upon completion, rise from 1.2005 (2021 low) would resume through 1.3976. Next target is 61.8% projection of 1.2005 to 1.3976 from 1.3091 at 1.4309. In case of another fall, downside should be contained by 61.8% retracement of 1.2005 to 1.3976 at 1.2758.
EUR/USD Daily Outlook
Daily Pivots: (S1) 1.0873; (P) 1.0893; (R1) 1.0917; More...
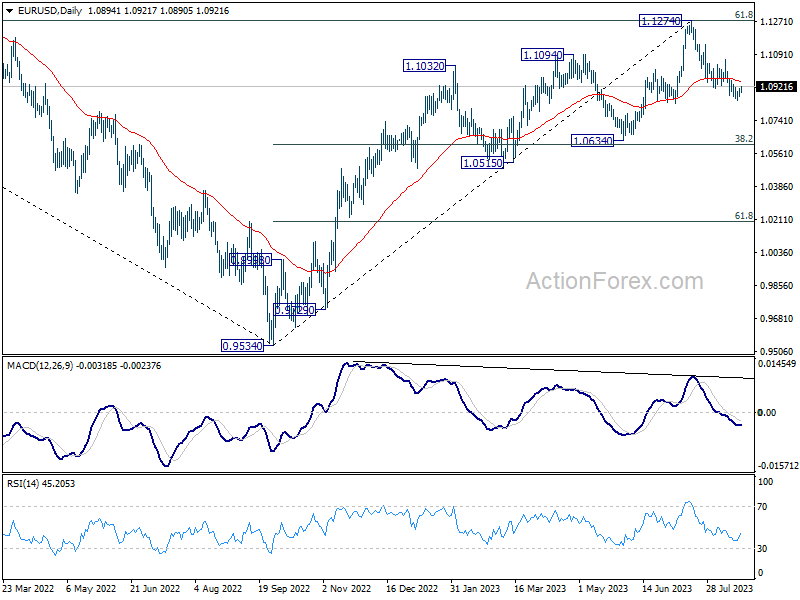
Intraday bias in EUR/USD remains neutral for the moment. On the downside, decisive break of 1.0832 support will resume the fall from 1.1274 and target 1.0609/34 cluster support next. On the upside, above 1.0951 minor resistance will turn intraday bias to the upside for stronger recovery.
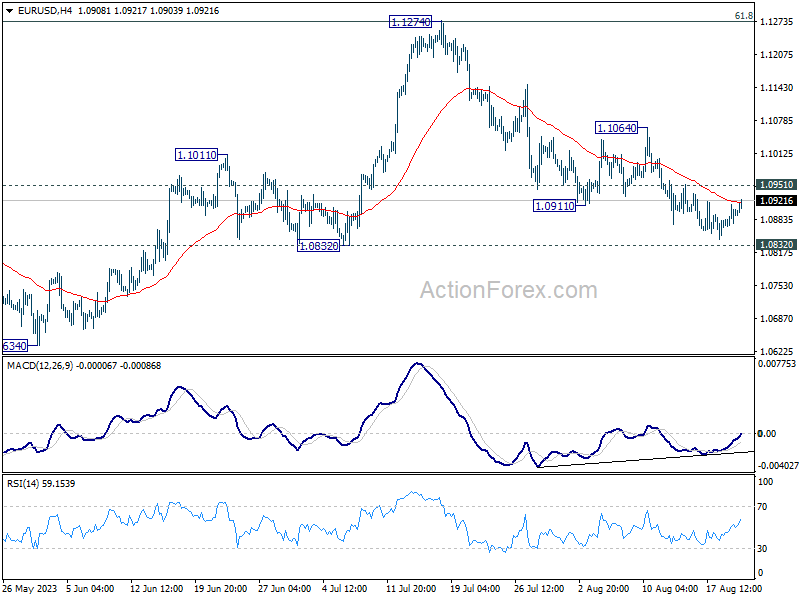
In the bigger picture, a medium term top should be formed at 1.1274, after failing to break through 61.8% retracement of 1.2348 (2021 high) to 0.9534 at 1.1273 decisively, on bearish divergence condition in D MACD. Fall from there is seen as a correction to the uptrend from 0.9534 (2022 low). Deeper decline would be seen to 1.0634 cluster support (38.2% retracement of 0.9534 to 1.1274 at 1.0609). Strong support could be seen there, at least on first attempt, to set the range for consolidation. Yet, medium term outlook will be neutral for now, as long as 1.1274 resistance holds.
GBP/USD Daily Outlook
Daily Pivots: (S1) 1.2723; (P) 1.2745; (R1) 1.2779; More...
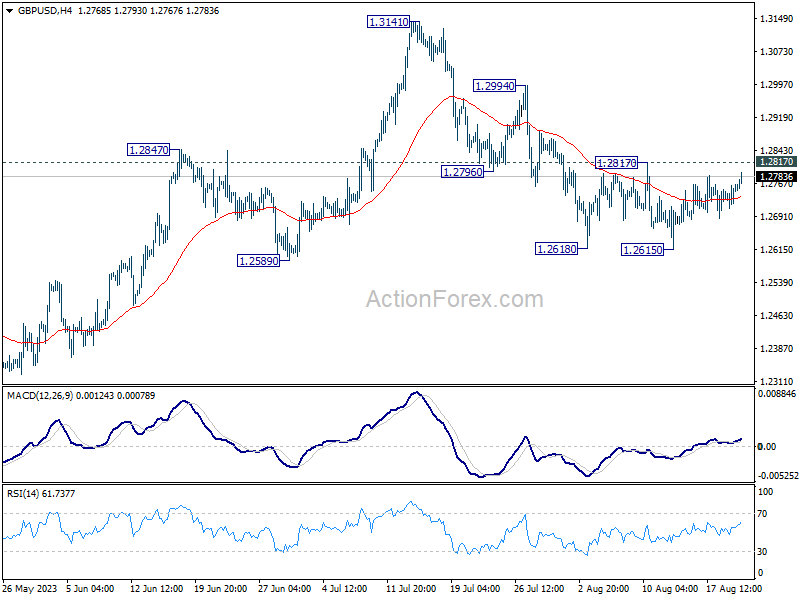
Intraday bias in GBP/USD remains neutral at this point and range trading continues. On the downside, firm break of 1.2615, and sustained trading below 1.2678 resistance turned support will argue that it's already in a larger correction. Deeper decline would then be seen to 1.2306 support next. Nevertheless, break of 1.2817 minor resistance will indicate that the pull back from 1.3141 has completed, and turn bias back to the upside for stronger rebound.
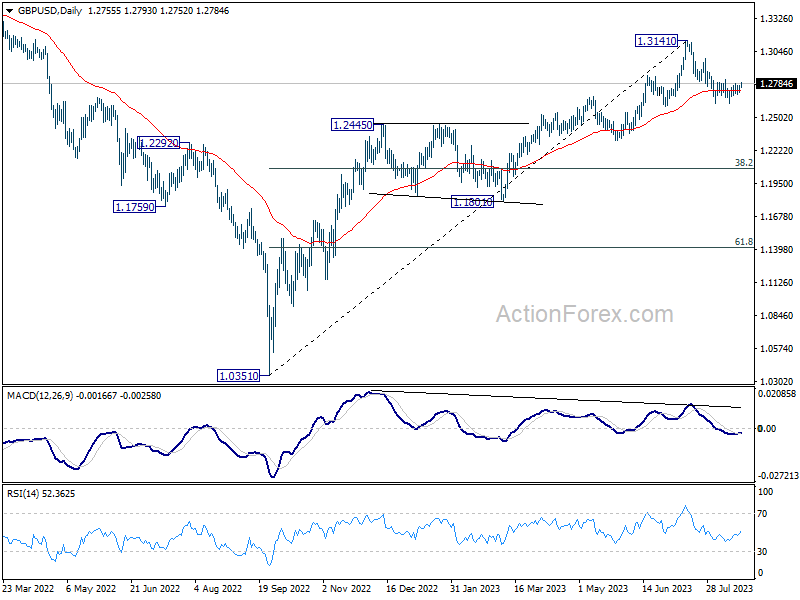
In the bigger picture, a medium term top could be in place at 1.3141 already, on bearish divergence condition in D MACD. Sustained trading below 55 D EMA (now at 1.2723) should confirm this case, and bring deeper fall to 38.2% retracement of 1.0351 to 1.3141 at 1.2075, as a correction to up trend from 1.0351 (2022 low). For now, rise will stay mildly on the downside as long as 1.3141 resistance holds, in case of strong rebound.
USD/CHF Daily Outlook
Daily Pivots: (S1) 0.8767; (P) 0.8797; (R1) 0.8815; More....
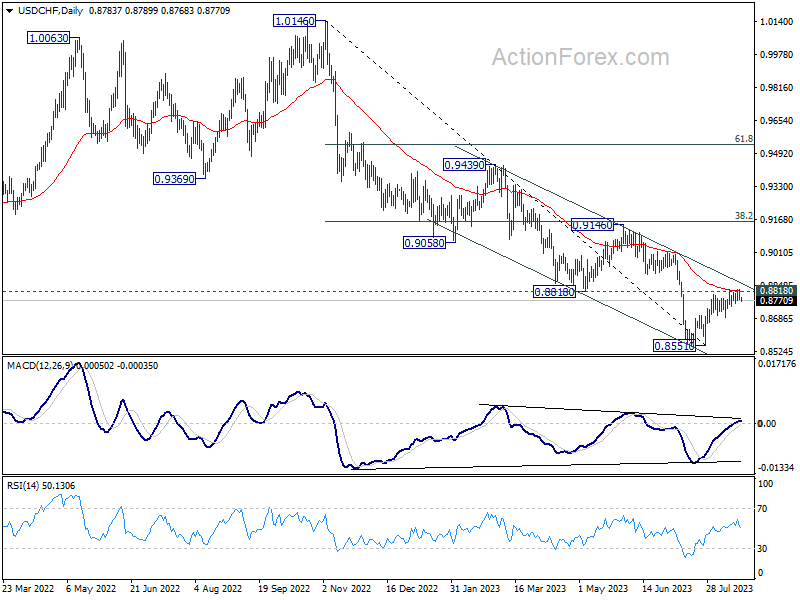
USD/CHF failed to sustain above 0.8818 support turned resistance again and retreated. Intraday bias stays neutral first. On the upside, decisive break of 0.8818 will carry larger bullish implication, and target 0.9146 cluster resistance next. However, break of 0.8688 support will indicate rejection by 0.8818, and turn bias back to the downside for retesting 0.8551 low.
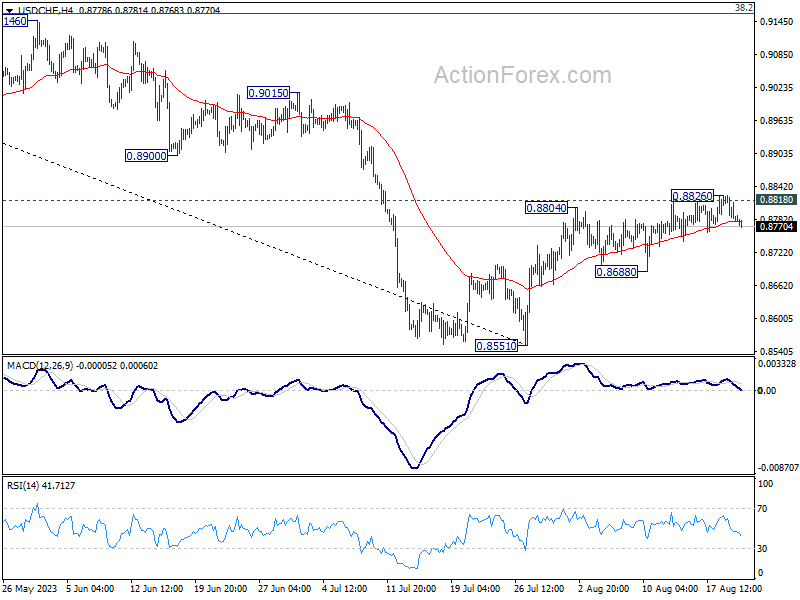
In the bigger picture, a medium term bottom could be in place at 0.8551 already, on bullish convergence condition in D MACD. Sustained trading above 0.8818 support turned resistance will bring further rise to 0.9146 cluster resistance (38.2% retracement of 1.0146 to 0.8551 at 0.9160), even as a correction. Nevertheless, break of 0.8851 will resume the down trend from 1.0146 instead.
BoJ Ueda meets PM Kishida: Exchange-rate volatility not discussed
In a meeting today, BoJ Governor Kazuo Ueda and Prime Minister Fumio Kishida discussed a range of financial topics. However, in a post-meeting address to the media, Ueda clarified that the recent volatility of exchange rates was not a focal point of their conversation. He stated, "There wasn't anything in particular discussed today," in response to inquiries regarding the topic.
The backdrop to this meeting was Dollar's significant surge over 145 Yen mark. To provide some historical context, when the currency reached this level in September 2022, it prompted Japan's inaugural Yen-buying intervention operation in nearly a quarter of a century, since 1998.
During their dialogue, Ueda shed light on BoJ's recent decision to ease its hold on long-term interest rates, lifting the cap on 10-year JGB yield from 0.50% to 1.00%. Prime Minister Kishida expressed understanding and agreement with the central bank's decision, Ueda remarked.
Highlighting the periodic nature of such high-level meetings, Ueda noted that the recent gathering was in line with the tradition maintained by his predecessor, Haruhiko Kuroda. Such consultations, held once every few months, aim to facilitate discussions on prevailing economic and financial landscapes.
Gas in Accumulation Phase. When Does Acceleration Start?
New York traded Natural gas is up 3% on Monday, having managed to break away from support again. Gas has formed an uptrend from the April lows but has not yet switched to an acceleration phase.
Gas prices formed a low in April just above $2 before starting an uptrend, and prices are now 34% above those lows at $2.75. This is a smooth rise, given that US gas prices peaked at almost $10 a year ago, nearly four times higher.
This price action looks like a textbook accumulation phase after a capitulation. However, optimists should be aware that such inattention to the rise in gas prices can last long.
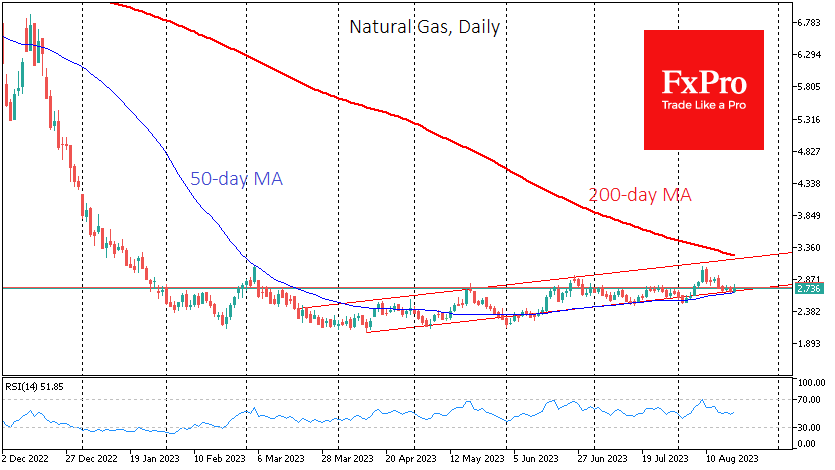
The uptrend channel originated from the April lows and, since July, has repeatedly acted as a support from which gas buying has intensified. There were attempts to break this trend on Friday and earlier in August, but gas confidently returned to the corridor.
This lower boundary of the channel almost coincided with the 50-day moving average, which has also repeatedly tested its strength since June. It has been pointing up since the beginning of the summer, giving the bulls an additional argument.
Having managed to hold the channel’s lower boundary, Natural Gas appears to be heading for its upper boundary, above $3.16. The 200-day moving average is slightly higher at $3.23.
The ability of gas to consolidate above its 200-day moving average will attract our attention, as it could herald a more active bullish phase in the market, potentially opening a quick path to $4.0 or even $5.5.
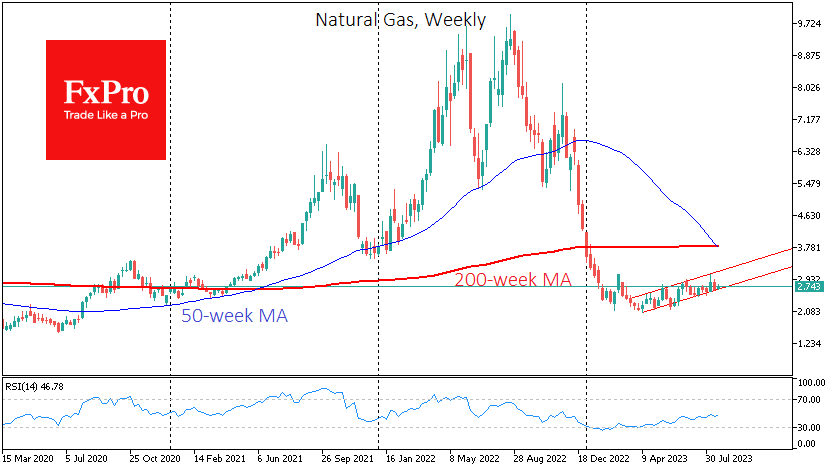
Locally, a “strategy” works against this scenario on the higher – weekly – timeframes where the 50-week moving average has dropped below the 200-week moving average. This formation is called a “death cross” and gives clear signals in the commodity markets at the current timeframes. However, we believe that the gas capitulation has already occurred between November last year and February this year.
USD/CHF Technical: Potential Continuation of Medium-Term Downtrend
- The CHF is the second-best performing major currency against the USD based on a one-month rolling basis.
- The recent four weeks of up move of USD/CHF has flashed out bullish exhaustion conditions that advocate the potential continuation of its medium-term impulsive down move.
- 0.8800/8830 is the key resistance zone to watch on the USD/CHF.
In the past four weeks, the Swiss Franc (CHF) is the second best-performing major currency against the USD where the CHF just depreciated by -1.40% with the GBP that has come in the first place (-0.67% against the USD) based on a one-month rolling calculation as of 22 August 2023 at this time of the writing.
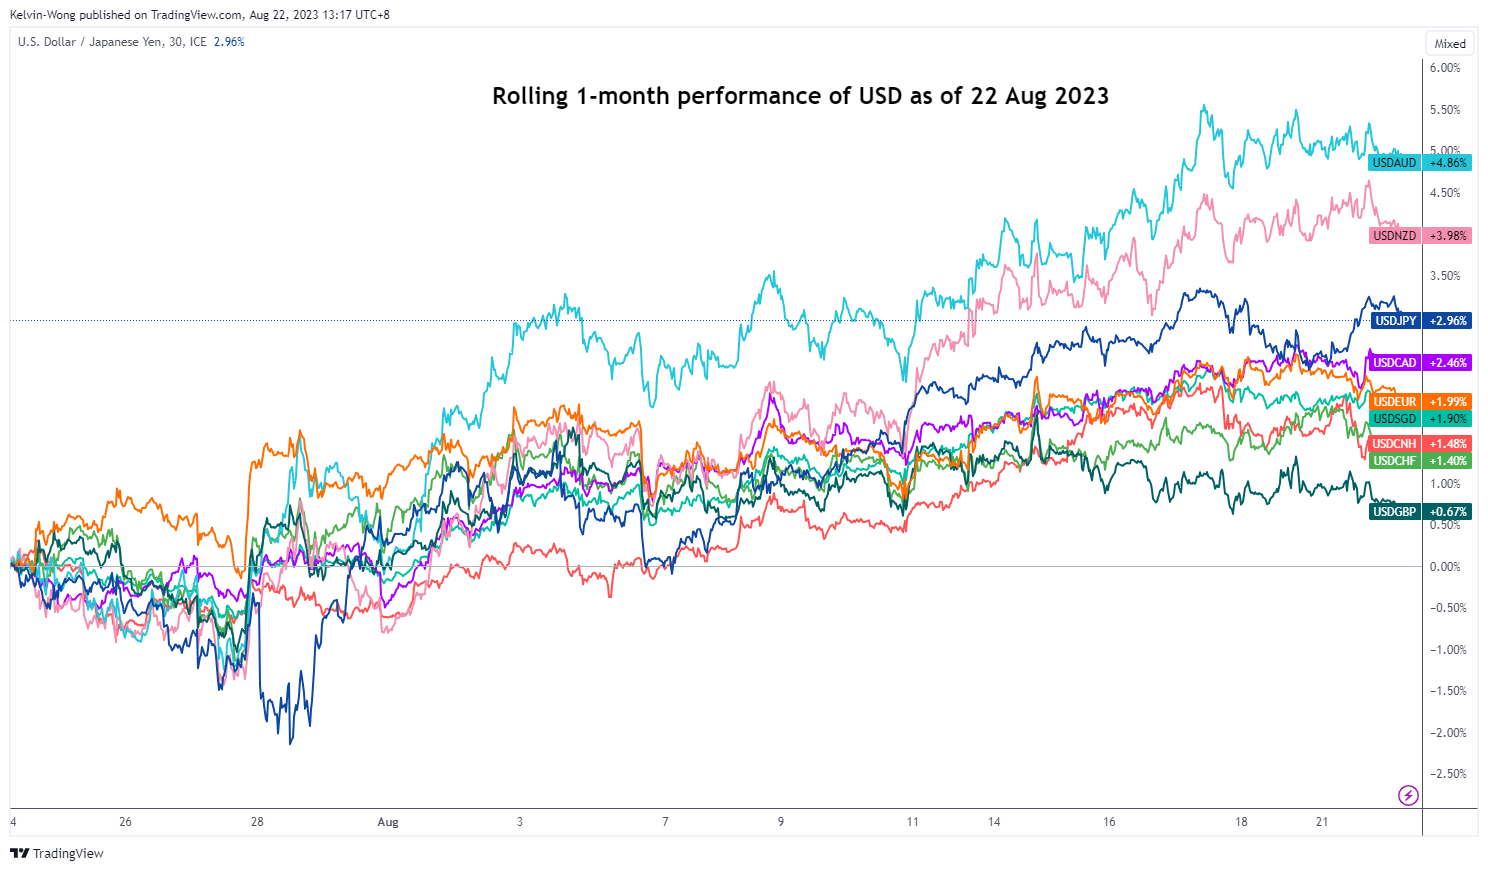
Fig 1: Rolling 1-month performance of USD against major currencies as of 22 August 2023 (Source: TradingView, click to enlarge chart)
In the lens of technical analysis, the rally of +269 pips that was seen on the USD/CHF from its 27 July 2023 low of 0.8553 to the recent 21 August 2023 high of 0.8828 is likely to be a corrective rebound within a medium-term downtrend that is still intact since its 8 March 2023 due to the emergence of several bullish exhaustion elements.
Daily bearish candlestick emerged right at descending channel resistance
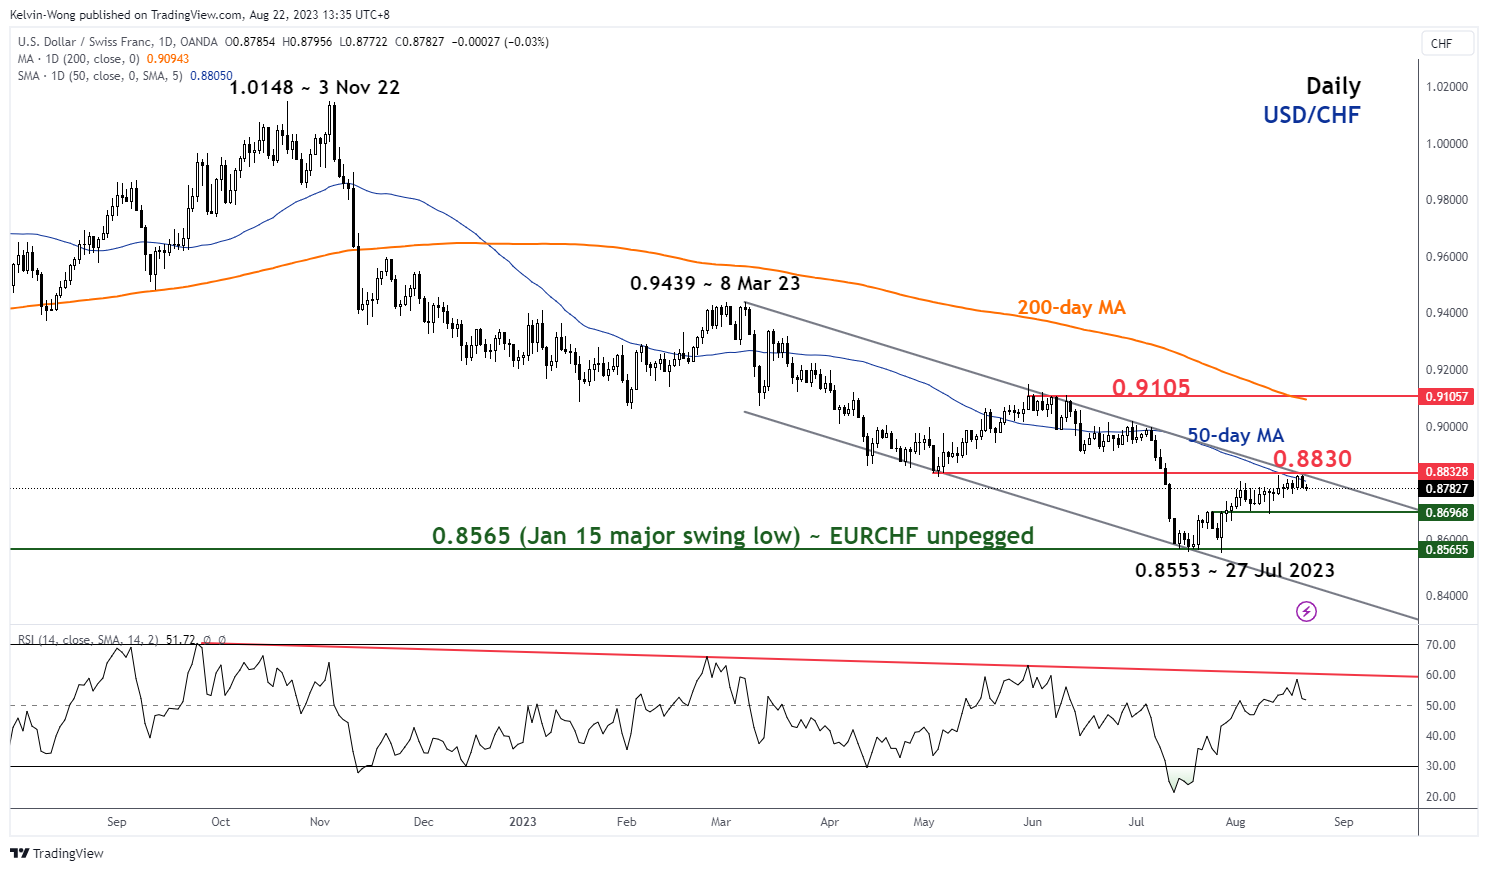
Fig 2: USD/CHF medium-term trend as of 22 Aug 2023 (Source: TradingView, click to enlarge chart)
Yesterday’s price action of USD/CHF has staged a bearish reaction right at the upper boundary of the medium-term descending channel that coincides with the downward-sloping 50-day moving average with both acting as a confluence of resistance at 0.8830.
Started to evolve into a minor downtrend
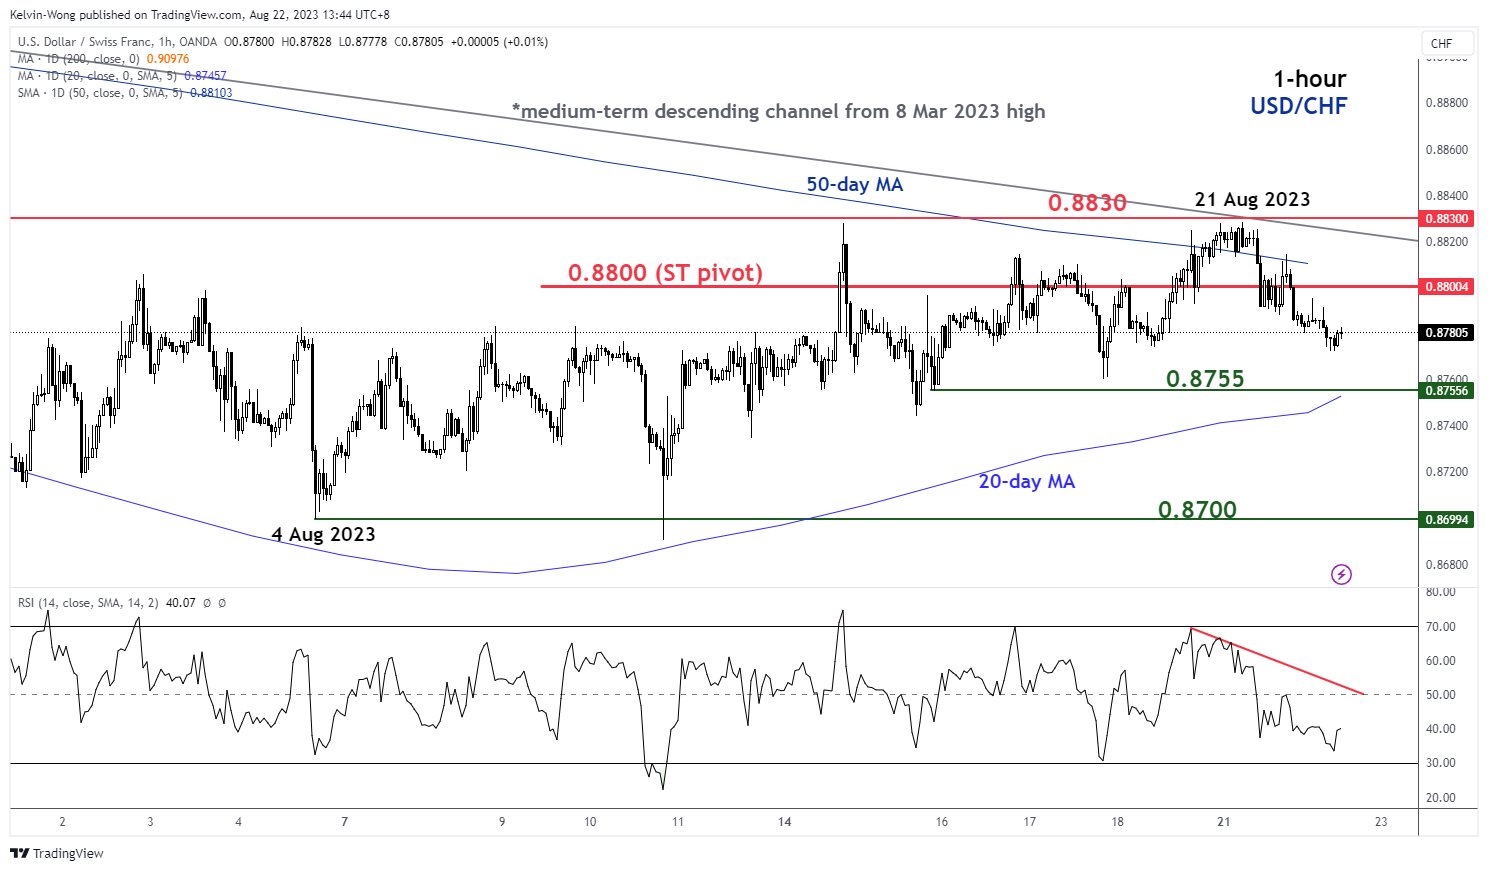
Fig 3: USD/CHF minor short-term trend as of 22 Aug 2023 (Source: TradingView, click to enlarge chart)
Since its 21 August 2023 high of 0.8828, the price actions of USD/CHF have started to oscillate into a minor downtrend in a series of “lower highs and lower lows”.
Watch the 0.8800 key short-term pivotal resistance a break below 0.8755 near-term support (also the 20-day moving average) exposing the next support at 0.8700 (minor swing lows of 4/10 August 2023) in the first step.
On the flip side, a clearance above 0.8800 negates the bearish tone to set sight again on the 0.8830 medium-term resistance.
Overnight Risk Sentiment Generally Positive With China Exception
Markets
Following a warming-up lap during European dealings, US investors went at it again. An empty eco/event calendar didn’t stop them from going for the cycle highs in yields. US yields added 5.8 bps (2-yr) to 8.5 bps (10-yr) with the 2-yr yield closing marginally above the psychological 5% mark, the 5-yr yield testing the cycle high at 4.5%, the 10-yr yield ending at the highest level (4.34%) since 2007 and the 30-yr yield (4.45%) finishing at its best level since 2011. The underlying force? You guessed it… higher real rates! The US 10-yr real rate traded north of 2% intraday for the first time since March 2009. European, UK and even Japanese bond yields join the journey higher. German yields rose by 6.8 bps to 8.2 bps yesterday with he belly of the curve underperforming the wings. Unlike most previous sessions, higher real rates didn’t translate into heavy stock markets and a firmer dollar. On the contrary, a tech rally resulted in a 1.5% gain for the Nasdaq. The Dow Jones ended flat with the S&P winning around 0.7%. The outcome in Europe was more mixed with key 4200 support in the EuroStoxx 50 fighting to live another day. The trade-weighted dollar’s rise is blocked by first resistance at 103.57 while EUR/USD still didn’t test 1.0834 support. The pair ended at 1.0896 yesterday from an open at 1.0877. EUR/GBP ended broadly flat at 0.8545 with the low 0.85-support area remaining untested as well.
Overnight risk sentiment is generally positive with China exception to the rule. The PBOC’s CNY fixing deviated again big time compared to expectations as the central bank tries to slow the currency’s descent. USD/CNY has been toying with the 7.30 2022 high for the past couple of sessions. Core bonds tread water with the dollar slightly in the defensive. Today’s eco calendar is again razor thin with second tier US existing home sales (July) and the Richmond Fed Manufacturing Index (August). We don’t expect them to interact with trading. The path of least resistance remains south for core bonds despite resistance levels in yield terms. For more fundamental trading drivers, we wait for tomorrow’s PMI’s and Friday’s Jackson Hole Symposium by the Kansas City Fed. Both Fed Chair Powell and ECB President Lagarde are scheduled to deliver high profile speeches, setting the tone for policy rate decisions in September. Our preferred scenario (25 bps rate hikes by both) isn’t discounted in money markets.
News and views
The Federal Reserve Bank of New York’s SCE labour market survey showed that the average wage received by American workers for a full time job was sharply higher in July 2023 ($69,475), compared with July of last year ($60,764). The average reservation wage (the lowest wage respondents would be willing to accept for a new job) reached its highest reading of $78,645. However, at the same time there were also signs of an easing in the job market. The expected likelihood of moving to a new employer declined somewhat to 10.6% from 11.0% in July 2022, while the average expected likelihood of becoming unemployed increased to 3.9% from 2.3% in July 2022, the highest reading since March 2020. The average expected likelihood of working beyond age 62 declined to 47.7% from 48.8% in July 2022, the lowest reading since the start of the series in March 2014. The series has largely been on a downward trend since November 2020.
According to long-term economic forecasts to be published by the Australian government on Thursday (seen before by Reuters), the country’s economic growth over the next 40 years is expected to structurally decline due an aging of the population and a decline in population growth. Real gross domestic product (GDP) is forecast to grow 2.2% annually over the 40 years to fiscal 2063, a full 0.9 percentage point slower than the previous four decades. The economy is expected to be around 2.5 times larger in real terms 40 years hence.
Stocks Rebound, But Volatility Rises
Stocks rebounded on Monday, in a move that looked more like a correction than a reaction to fresh news, as there was no fresh news that went against the slowing China rhetoric, nor against the fear that we will hear something sufficiently hawkish this Friday from Jerome Powell’s Jackson Hole speech. At this point, the hawkish Federal Reserve (Fed) expectations are mostly priced in, leaving room for some up and down moves. So yesterday’s session was not only marked by a rebound in the S&P500 from the October to July ascending baseline, but also by a visible rise in volatility. Nasdaq 100 jumped 1.65% as well, but the US 2-year yield returned well above 5%, and the 10-year yield pushed to a fresh high since 2007.
One interesting thing is, in 2007, when the US 10-year yield was at these levels, the positioning in the market was deeply negative – meaning that investors expected the yields to rebound, while today the positioning is deeply positive, meaning that investors expect the yields to bounce lower. And that’s understandable: the US 10-year yield was on a steady falling path in 2007, so there was a reason for investors to expect a rebound – which did not happen. In a similar way, today, we are just coming out of a long period of near zero rates, so for our eyes, the actual levels seem very high. That explains why many asset managers expect the yields to fall. There is also a growing interest in US 10-year TIPS – which are protected against inflation, and which hit the 2% mark for the first time since the GFC as well. But there is not much reason other than our low comparison levels that gives reason to an imminent reversal in market direction. The US data is strong, the labour market is tight, and inflation is slowing but ‘significant upside risks’ prevail. A recent study warned that unless the monthly CPI stays below the 0.2%, inflation is headed higher in 2024. So there is a chance that we won’t see a downside correction in the US 10-year yield, and if that’s not the case, the selloff could extend until the 10-year yield settles somewhere between 5-5.50%.
Anyway, the market mood got significantly better yesterday. Tech stocks fueled the rally in the US, as Nvidia jumped 8.5% yesterday, a day before the release of its Q2 results. Nvidia’d better meet its $11bn sales forecast for last quarter, otherwise, there is a chance that we will see a sizeable downside correction.
In Europe, oil stocks shouldered yesterday’s rally, as the barrel of US crude made an attempt above the $82pb, on lower OPEC+ exports and on the back of a golden cross formation on a daily chart where the 50-DMA crossed above the 200-DMA. But yesterday, that wasn’t the case. Oil’s positive attempt remained short-lived, on the contrary, and the barrel of crude is preparing to test the $80pb support to the downside again this morning. The market is driven by two major forces: the supply tightness and the Chinese demand expectations. These days, the Chinese demand expectations are very much in focus, which could help the oil bears take advantage for selling the recent rally in oil prices. But tighter OPEC rhetoric will remain a major support into the 200-DMA, near $76pb.
Expect the US Dollar rally to extend
The US dollar broadly weakened across the board, helping majors to take some breather. The dollar index fell back towards its 200-DMA, the EURUSD settles above the 1.09 mark this morning, while Cable bulls eye a further rise toward the 50-DMA, which stands a touch below the 1.28 level. But looking at the US dollar and the real yields, the end of last year’s dollar really coincides with a peak in 10-year real yield. Both started retreating in Q3 of last year. The dollar retreated relatively faster. And now that the real yields are on the rise again, there is little reason to keep the USD on a bearish trend for the months ahead. The dollar rally which started by mid-July should further develop, and there is significant room for further correction before we could technically call the end of the dollar’s bearish trend. In numbers, the dollar index will still be in a bearish trend below the 105.40 mark. Until that level is reached, investors don’t have much to lose for jumping on the back of a bull.
USD/JPY Daily Outlook
Daily Pivots: (S1) 144.92; (P) 145.40; (R1) 145.87; More...
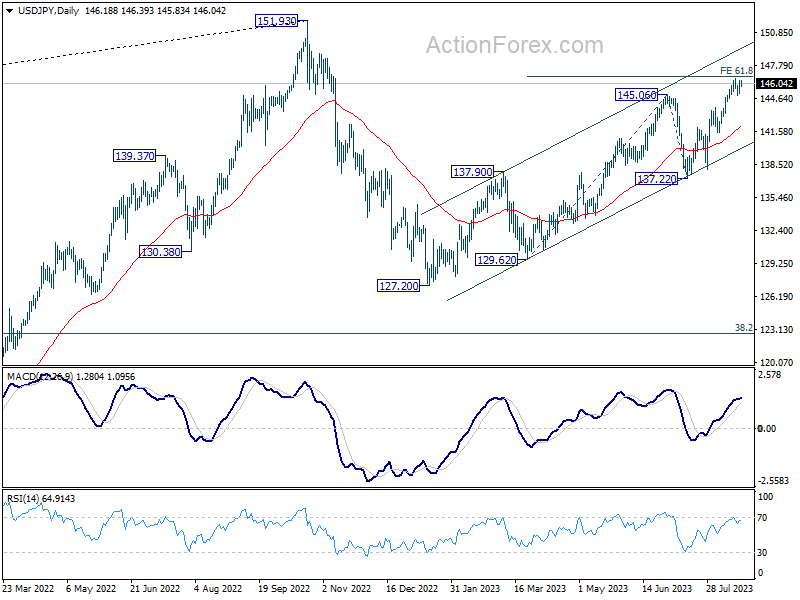
USD/JPY is still bounded in range below 146.55 and intraday bias remains neutral at this point. On the upside, sustained break of 61.8% projection of 129.62 to 145.06 from 137.22 at 146.76 will pave the way to retest 151.93 high. However, considering bearish divergence condition in 4H MACD, firm break of 44.92 support will be a sign of reversal, and turn bias back to the downside for 55 D EMA (now at 141.95).
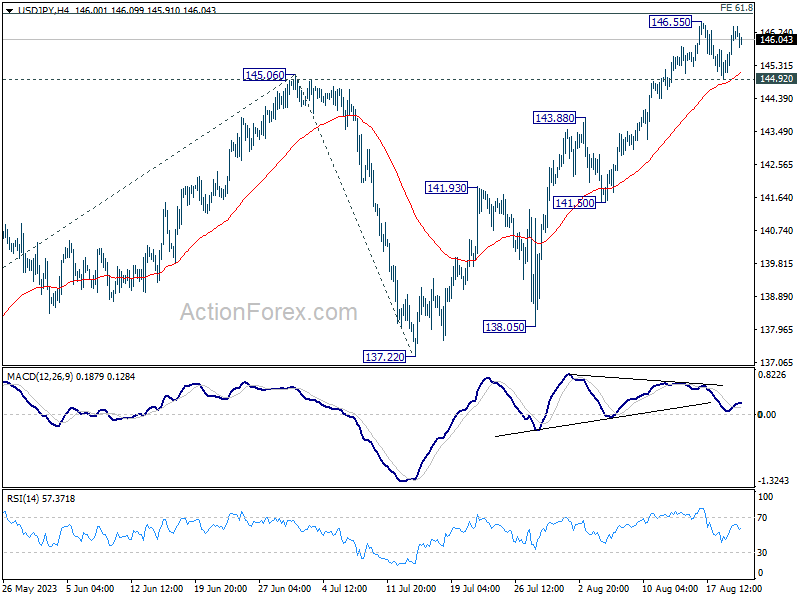
In the bigger picture, overall price actions from 151.93 (2022 high) are views as a corrective pattern. Rise from 127.20 is seen as the second leg of the pattern and could still be in progress. But even in case of extended rise, strong resistance should be seen from 151.93 to limit upside. Meanwhile, break of 137.22 support should confirm the start of the third leg to 127.20 (2023 low) and below.