Sample Category Title
Japanese Yen Rises as Inflation Higher than Expected
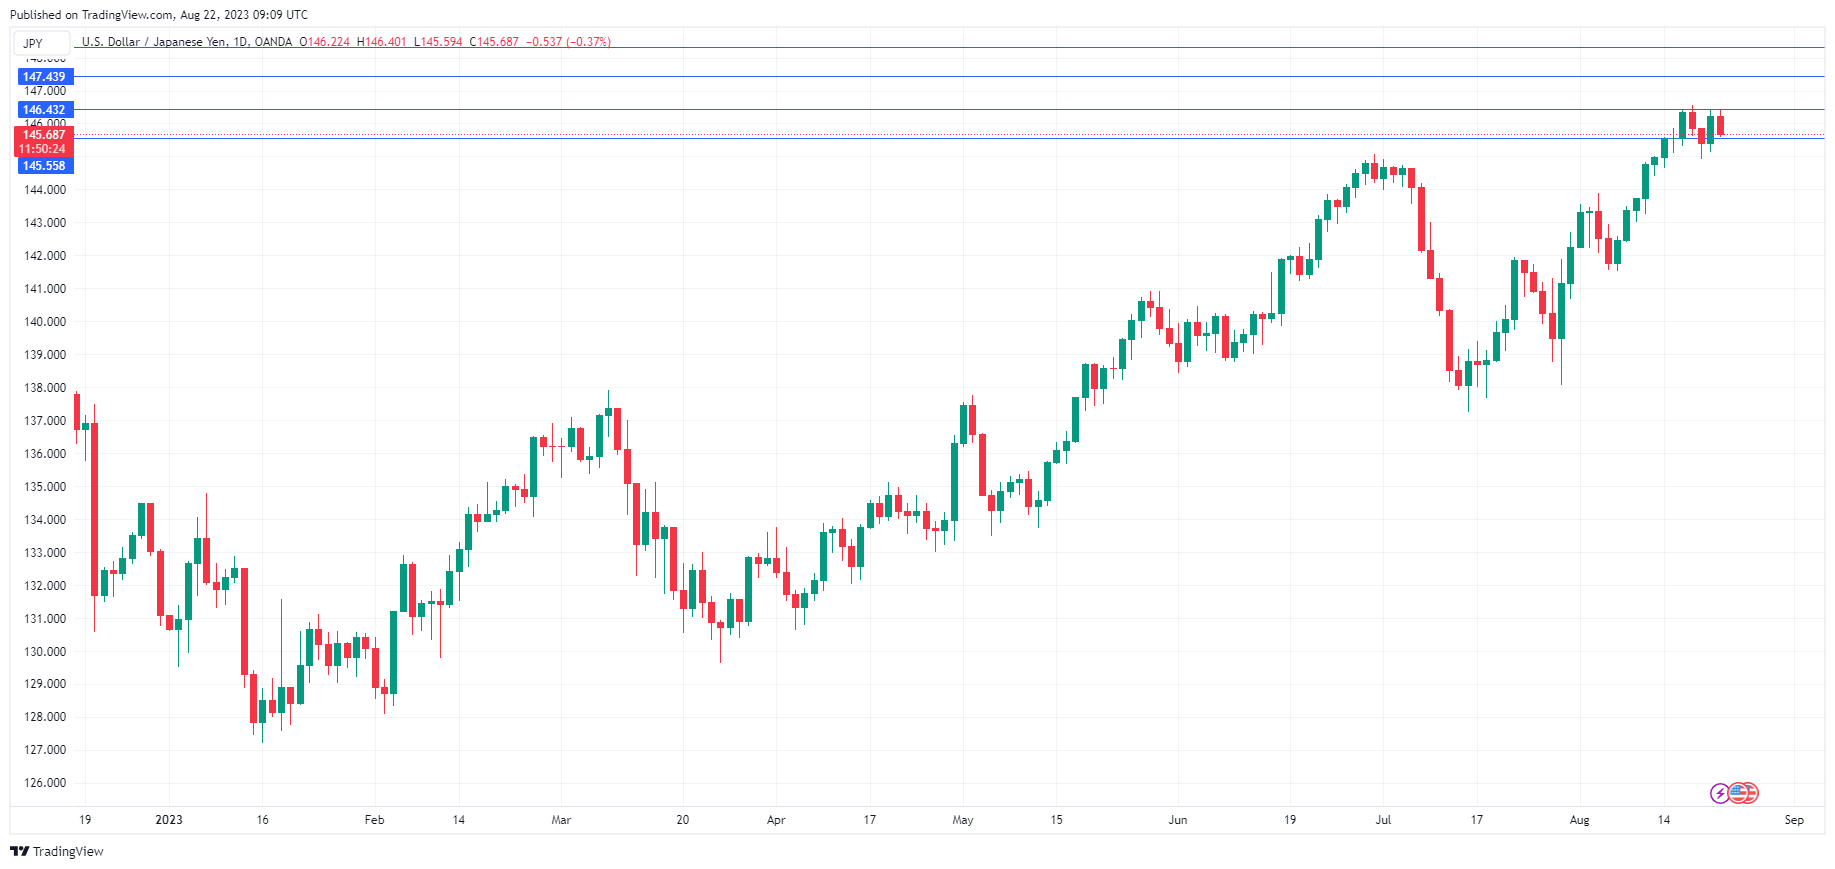
The Japanese yen has bounced back on Tuesday after starting the week with losses. In the European session, USD/JPY is trading at 145.67, down 0.37%.
BoJ core inflation rises to 3.3%
Earlier today, Japan released BoJ core inflation, one of the central bank’s preferred inflation indicators. Inflation reports used to be rather dull events when Japan experienced deflation. That has all changed now in the era of high inflation across the globe. Japan’s inflation is relatively low at 3% to 3.5%, but it has persistently been above the Bank of Japan’s 2% target and has raised expectations that the BoJ might have to tighten policy.
BoJ core inflation surprised on the upside in July, with a gain of 3.3% y/y. This was above the June reading of 3.0% and the consensus estimate of 2.9%. Last week, National Core CPI eased to 3.1% in July, down from 3.3% in June. We may have to wait for further inflation releases to get a handle on which way inflation is moving. In any event, the BoJ core inflation release was higher than expected and has given a boost to the Japanese yen.
Markets eye Jackson Hole
If it’s late August, there must be a lot of central bankers enjoying the Wyoming scenery. Fed Chair Powell hosts the annual Jackson Hole Symposium which begins on Thursday. Powell delivers a highly-anticipated speech on Friday, as investors will be looking for clues about the Fed’s future rate policy.
The Fed is expected to raise interest rates next month, but traders are divided on whether the Fed will raise rates or pause at the November meeting. Powell’s remarks could provide clues on what the Fed has planned in November. Inflation has been moving in the right direction but the Fed doesn’t want the markets to become too complacent, as the battle to wrestle inflation down to 2% is not over. I would expect Powell to send a cautious, perhaps hawkish message in his Jackson Hole speech.
USD/JPY Technical
- USD/JPY is testing support at 146.41. The next support line is 145.54
- There is resistance at 147.44 and 148.31
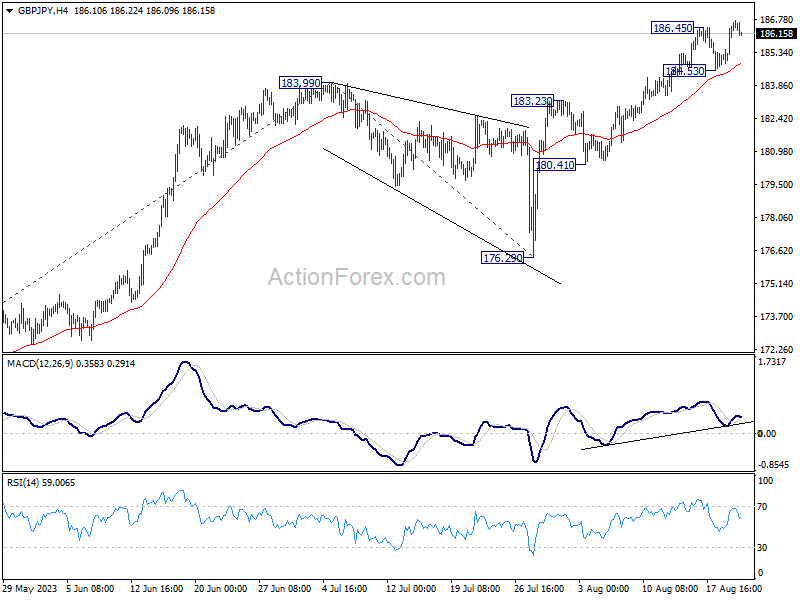
GBP/JPY Daily Outlook
Daily Pivots: (S1) 185.41; (P) 186.04; (R1) 187.18; More...
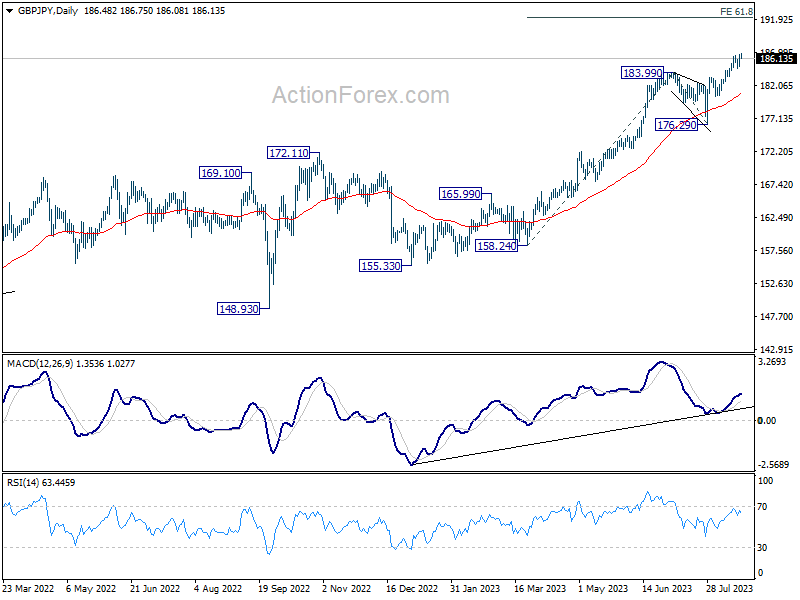
Prior breach of 186.45 indicates that GBP/JPY is resuming the larger up trend. Intraday bias is back on the upside. Next target is 61.8% projection of 158.24 to 183.99 from 176.29 at 192.20. On the downside, however, break of 184.53 support should now indicate short term topping, and turn bias back to the downside for deeper correction.
In the bigger picture, up trend from 123.94 (2020 low) is in progress. Next target is 195.86 (2015 high). This will now remain the favored case as long as 176.29 support holds, even in case of deeper pull back.
EUR/JPY Daily Outlook
Daily Pivots: (S1) 158.29; (P) 158.85; (R1) 159.89; More....
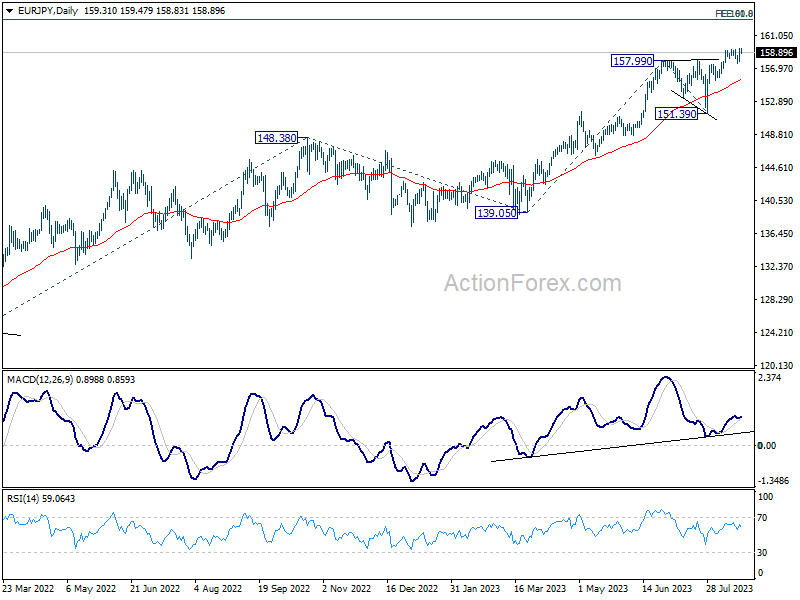
Prior breach of 159.32 suggests that EUR/JPY's up trend is resuming. Further rally is now expected as long as 157.64 support holds. Next target is 61.8% projection of 139.05 to 157.99 from 151.39 at 163.09. Nevertheless, break of 157.64 will now indicate short term topping, and turn bias to the downside for deeper correction.
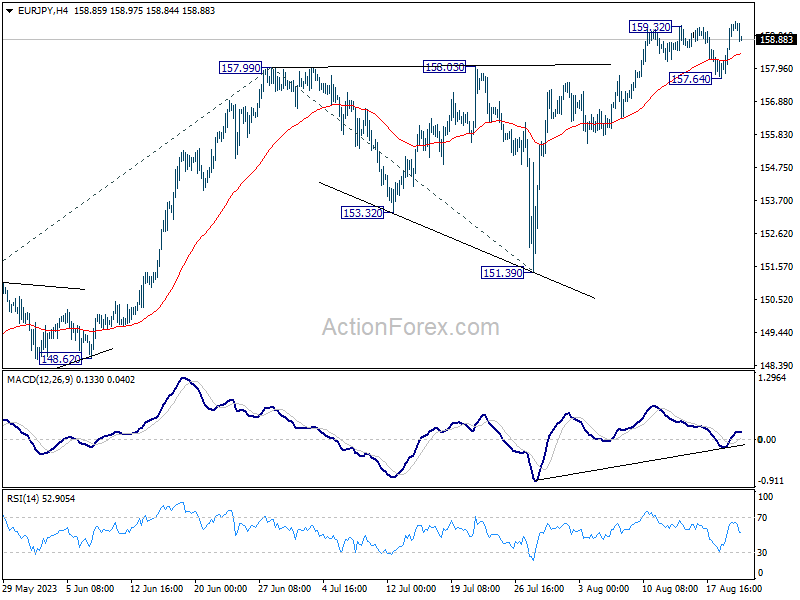
In the bigger picture, rise from 114.42 (2020 low) is in progress. Next target is 100% projection of 124.37 to 148.38 from 139.05 at 163.06. Sustained break there will pave the way to retest long term resistance at 169.96. This will now remain the favored case as long as 151.39 support holds, even in case of deep pull back.
EUR/GBP Daily Outlook
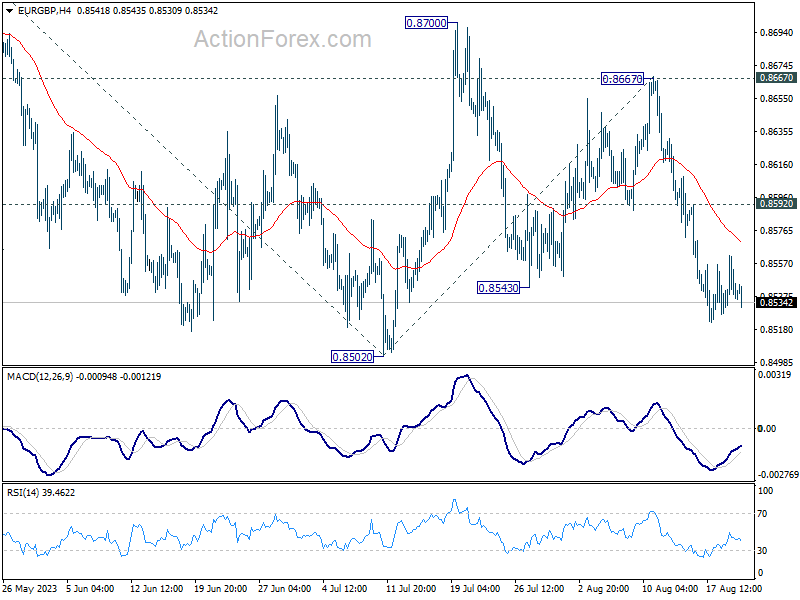
Daily Pivots: (S1) 0.8528; (P) 0.8546; (R1) 0.8558; More...
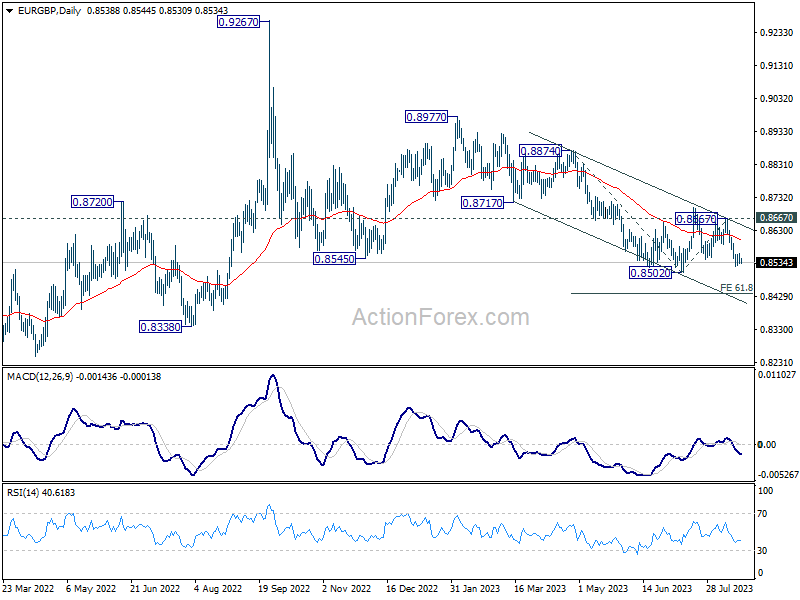
Intraday bias in EUR/GBP stays neutral for the moment, and further decline is expected with 0.8592 resistance holds. Decisive break of 0.8502 will resume larger down trend. Next target is 61.8% projection of 0.8874 to 0.8502 from 0.8667 at 0.8437. On the upside, above 0.8592 minor resistance will mix up the outlook and extend sideway trading from 0.8502.
In the bigger picture, the down trend from 0.9267 (2022 high) is seen as part of the long term range pattern from 0.9499 (2020 high). Further decline is in favor as long as 0.8667 resistance holds. Break of 0.8502 will resume the fall towards 0.8201 (2022 low).
EUR/AUD Daily Outlook
Daily Pivots: (S1) 1.6947; (P) 1.6993; (R1) 1.7034; More...
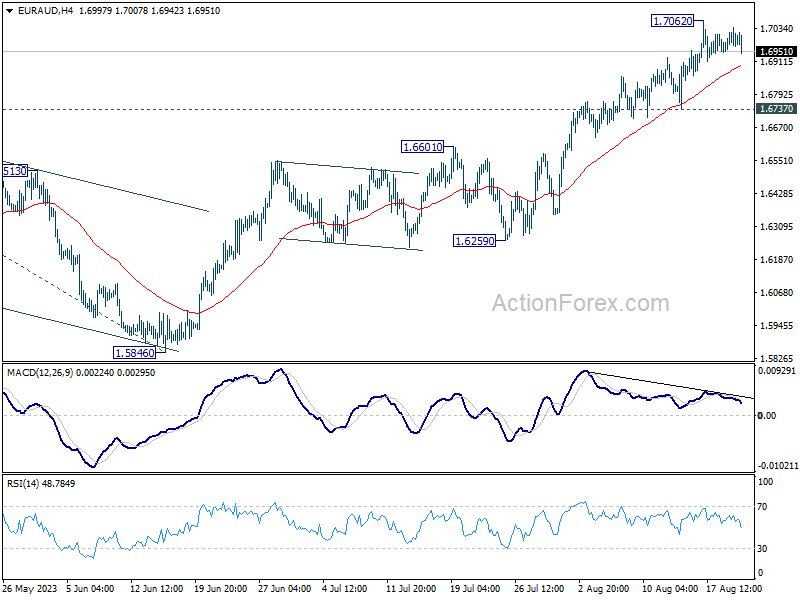
Intraday bias in EUR/AUD remains neutral for consolidation below 1.7062. While deeper retreat could be seen, outlook will stay mildly bullish as long as 1.6737 support holds. On the upside, firm break 1.7062 will resume larger up trend from 1.4281 to 1.7377 projection level.
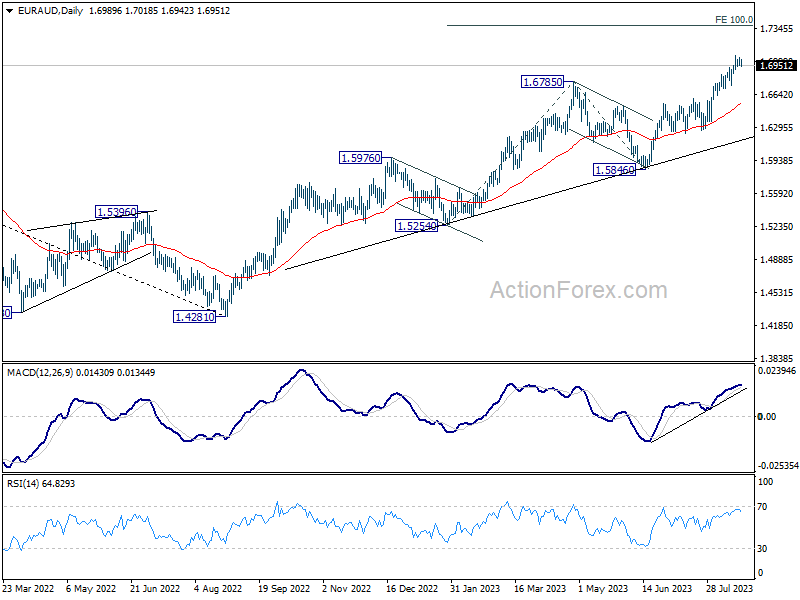
In the bigger picture, the rise from 1.4281 (2022 low) is in progress. Next target is 100% projection of 1.5254 to 1.6785 from 1.5846 at 1.7377. For now, outlook will stay bullish as long as 1.5846 support holds, even in case of another pull back.
EUR/CHF Daily Outlook
Daily Pivots: (S1) 0.9560; (P) 0.9581; (R1) 0.9593; More...
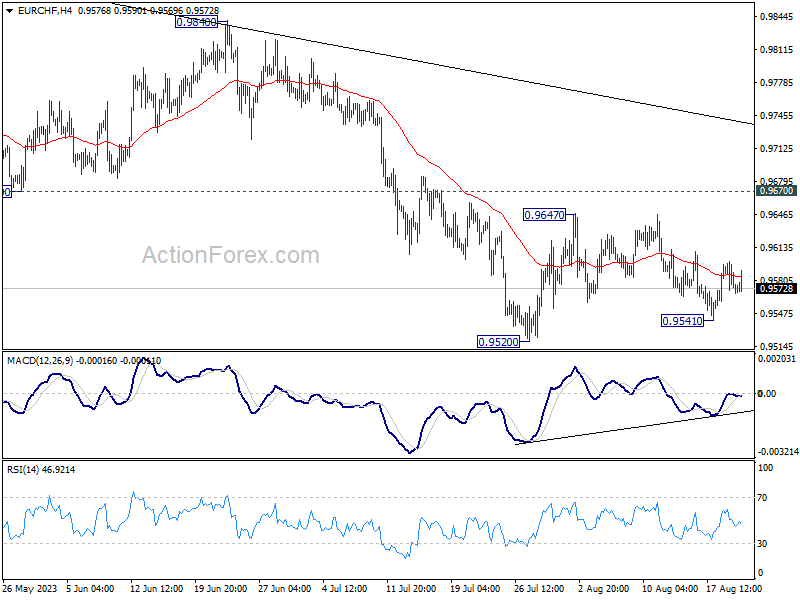
No change in EUR/CHF's outlook is it's bounded inside established range. Intraday bias remains neutral. On the upside, break of 0.9647 will resume the rebound from 0.9520. Further sustained break of 0.9670 will be the first sign of bullish reversal and target 0.9840 resistance for confirmation. On the downside, break of 0.9520 will resume the whole fall from 1.0095 towards 0.9407 low.
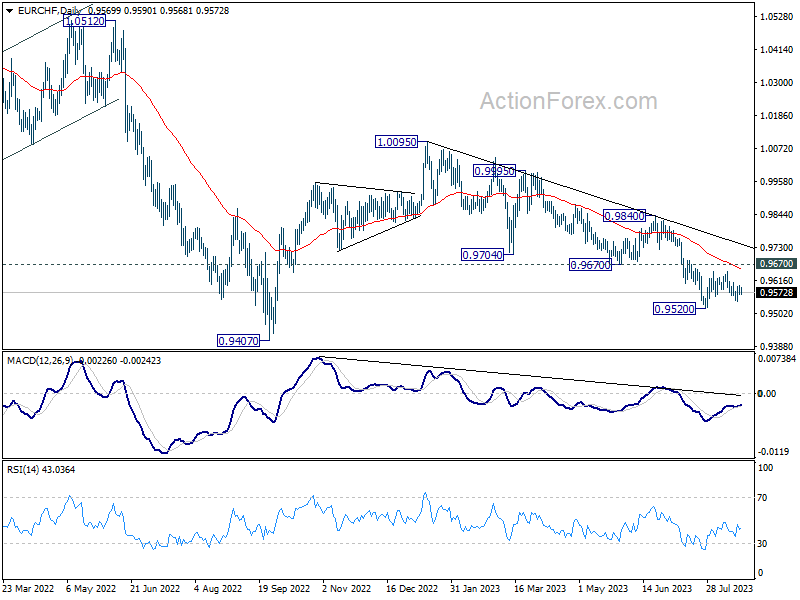
In the bigger picture, medium term outlook is staying bearish as the pair is capped well below falling 55 W EMA (now at 0.9849). Down trend from 1.2004 (2018 high) is in favor to continue. Sustained break of 0.9407 will target 61.8% projection of 1.1149 to 0.9407 from 1.0095 at 0.9018. For now, this will remain the favored case as long as 0.9840 resistance holds, in case of strong rebound.
EURJPY Consolidates as Bulls Fear Intervention
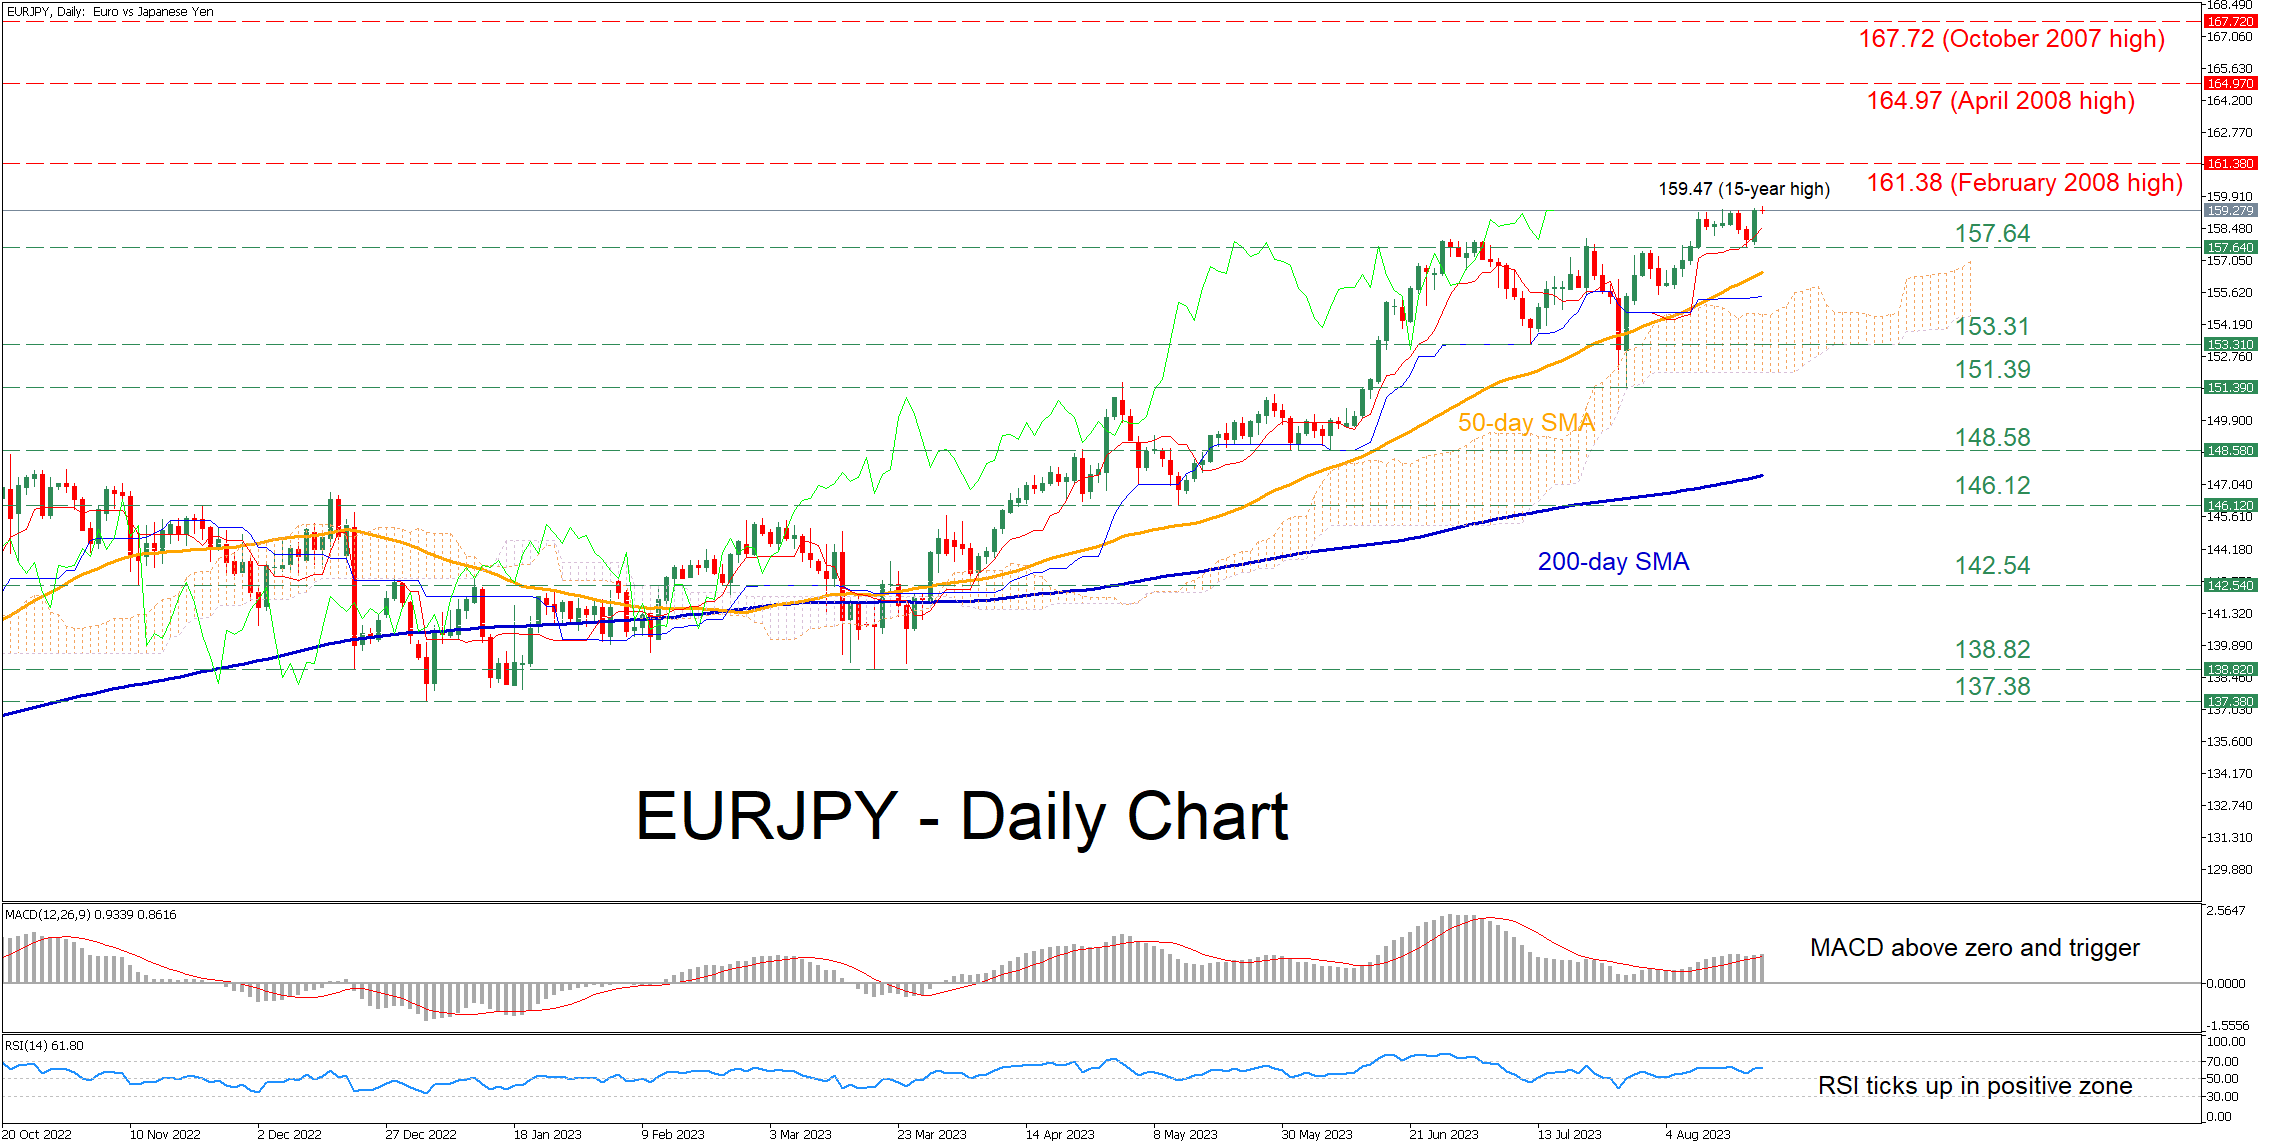
EURJPY has been in a prolonged uptrend since the beginning of the year, posting consecutive multi-year highs. However, in the last week, the pair has been flat near 15-year peaks, with buyers struggling to push the price higher on fears of an impending intervention by Japanese authorities.
The momentum indicators currently suggest that bullish forces are reigning supreme. Specifically, the MACD is strengthening above zero and its red signal line, while the RSI is ticking up deep within its positive territory.
Should the recent range break to the upside, the price could advance towards fresh multi-year highs, where the February 2008 peak of 161.38 could act as immediate resistance. Piercing through that zone, the price may challenge the April 2008 high of 164.97. A violation of that region could open the door for the October 2007 resistance of 167.72.
On the flipside, bearish actions could send the price to test the recent support of 157.64. If that floor collapses, the spotlight could turn to 153.31 ahead of the July low of 151.39. Failing to halt there, the price may decline towards the June bottom of 148.58.
In brief, EURJPY has been rangebound for the past few days, but the broader technical picture remains bullish. Nevertheless, traders should be cautious as a decisive spike above the latest range could trigger an intervention by Japanese authorities.
GBPUSD Shows Bullish Attitude
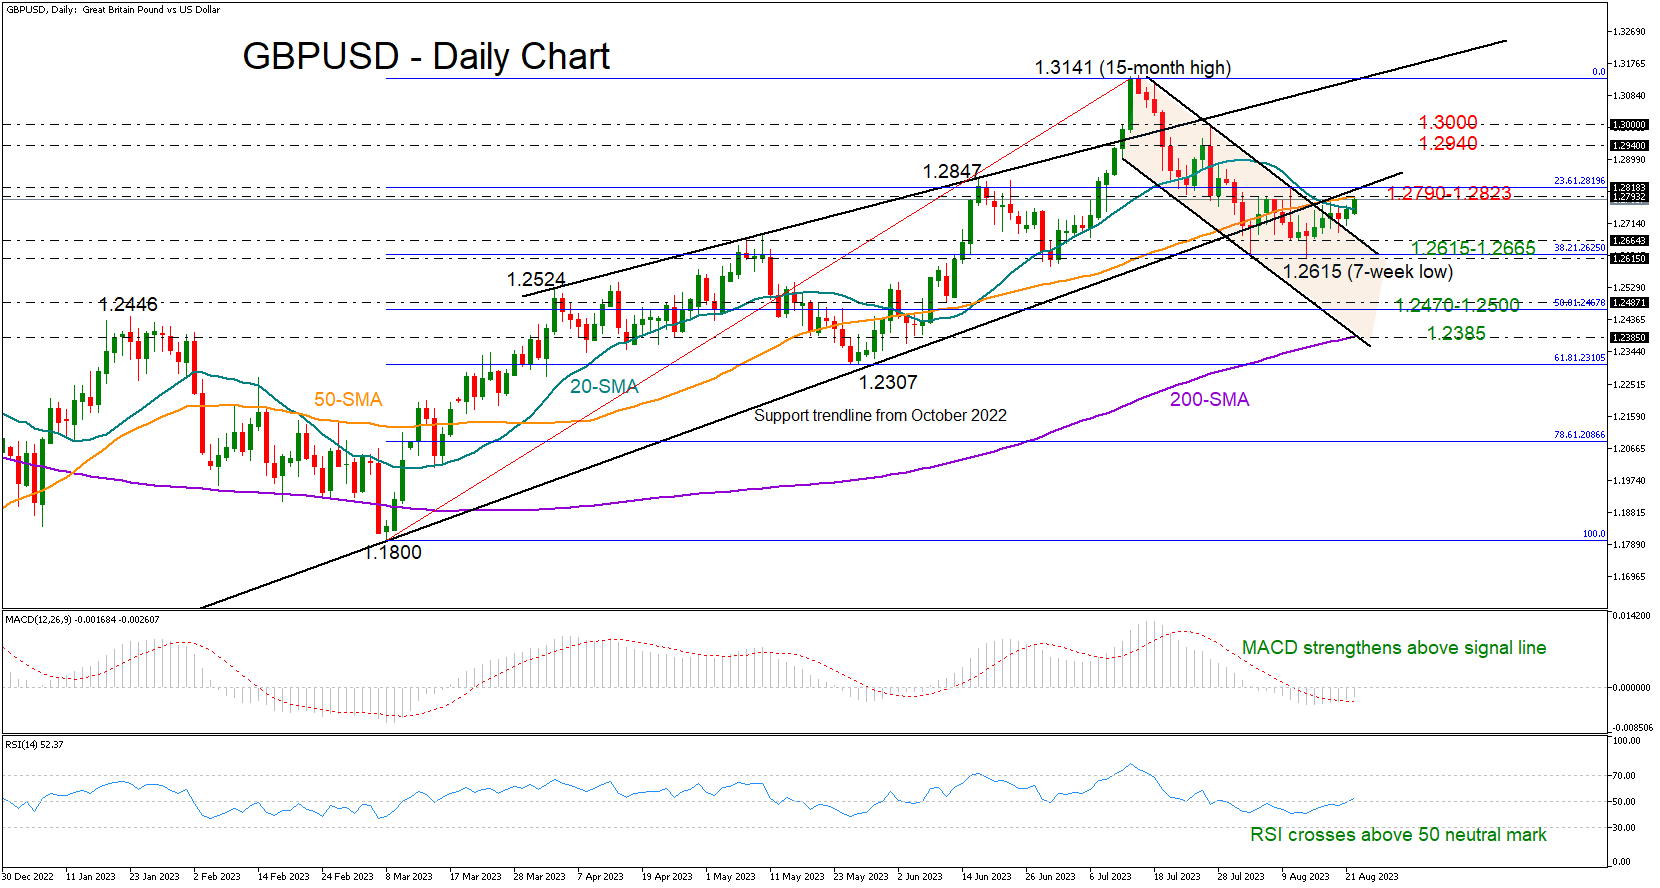
GBPUSD has been gradually rising since posting a double bounce near the 1.2615 area, exiting the one-month-old bearish channel recently.
The pair opened above the constraining 20-day simple moving average (SMA) on Tuesday and is currently trying to extend its upleg above the 50-day SMA at 1.2790. This area provided strong resistance earlier this month, while the broken support trendline from October 2022 could add another potential threat within a short distance. Note that the 23.6% Fibonacci retracement of the 1.1800-1.3141 upleg is positioned in the same location at 1.2823. Strikingly, the 50-period SMA in the weekly chart is capping bullish actions for the third consecutive week in the same neighborhood.
Technically, the bulls seem to have more bullish fuel in the tank as the RSI is crossing back above its 50 neutral mark and the MACD is deviating above its red signal line. Yet only a clear close above 1.2823 could motivate a quick rally towards the 1.2940-1.3000 constraining zone. Should buying interest persist, the focus will immediately turn to the 15-month high of 1.3141.
If the pair gets a rejection near 1.2790, pulling back below its 20-day SMA at 1.2750, support could initially develop within the 1.2615-1.2665 territory. Failure to pivot there could generate an aggressive decline towards the 1.2500 round level and the 50% Fibonacci mark of 1.2470. A continuation lower would bring the 200-day SMA at 1.2385 and the lower band of the broken bearish channel on the radar.
Summing up, GBPUSD is showing a bullish attitude in the very short-term picture. Buying confidence could further improve above 1.2823.
US 30 Cash Index Correction at Tipping Point
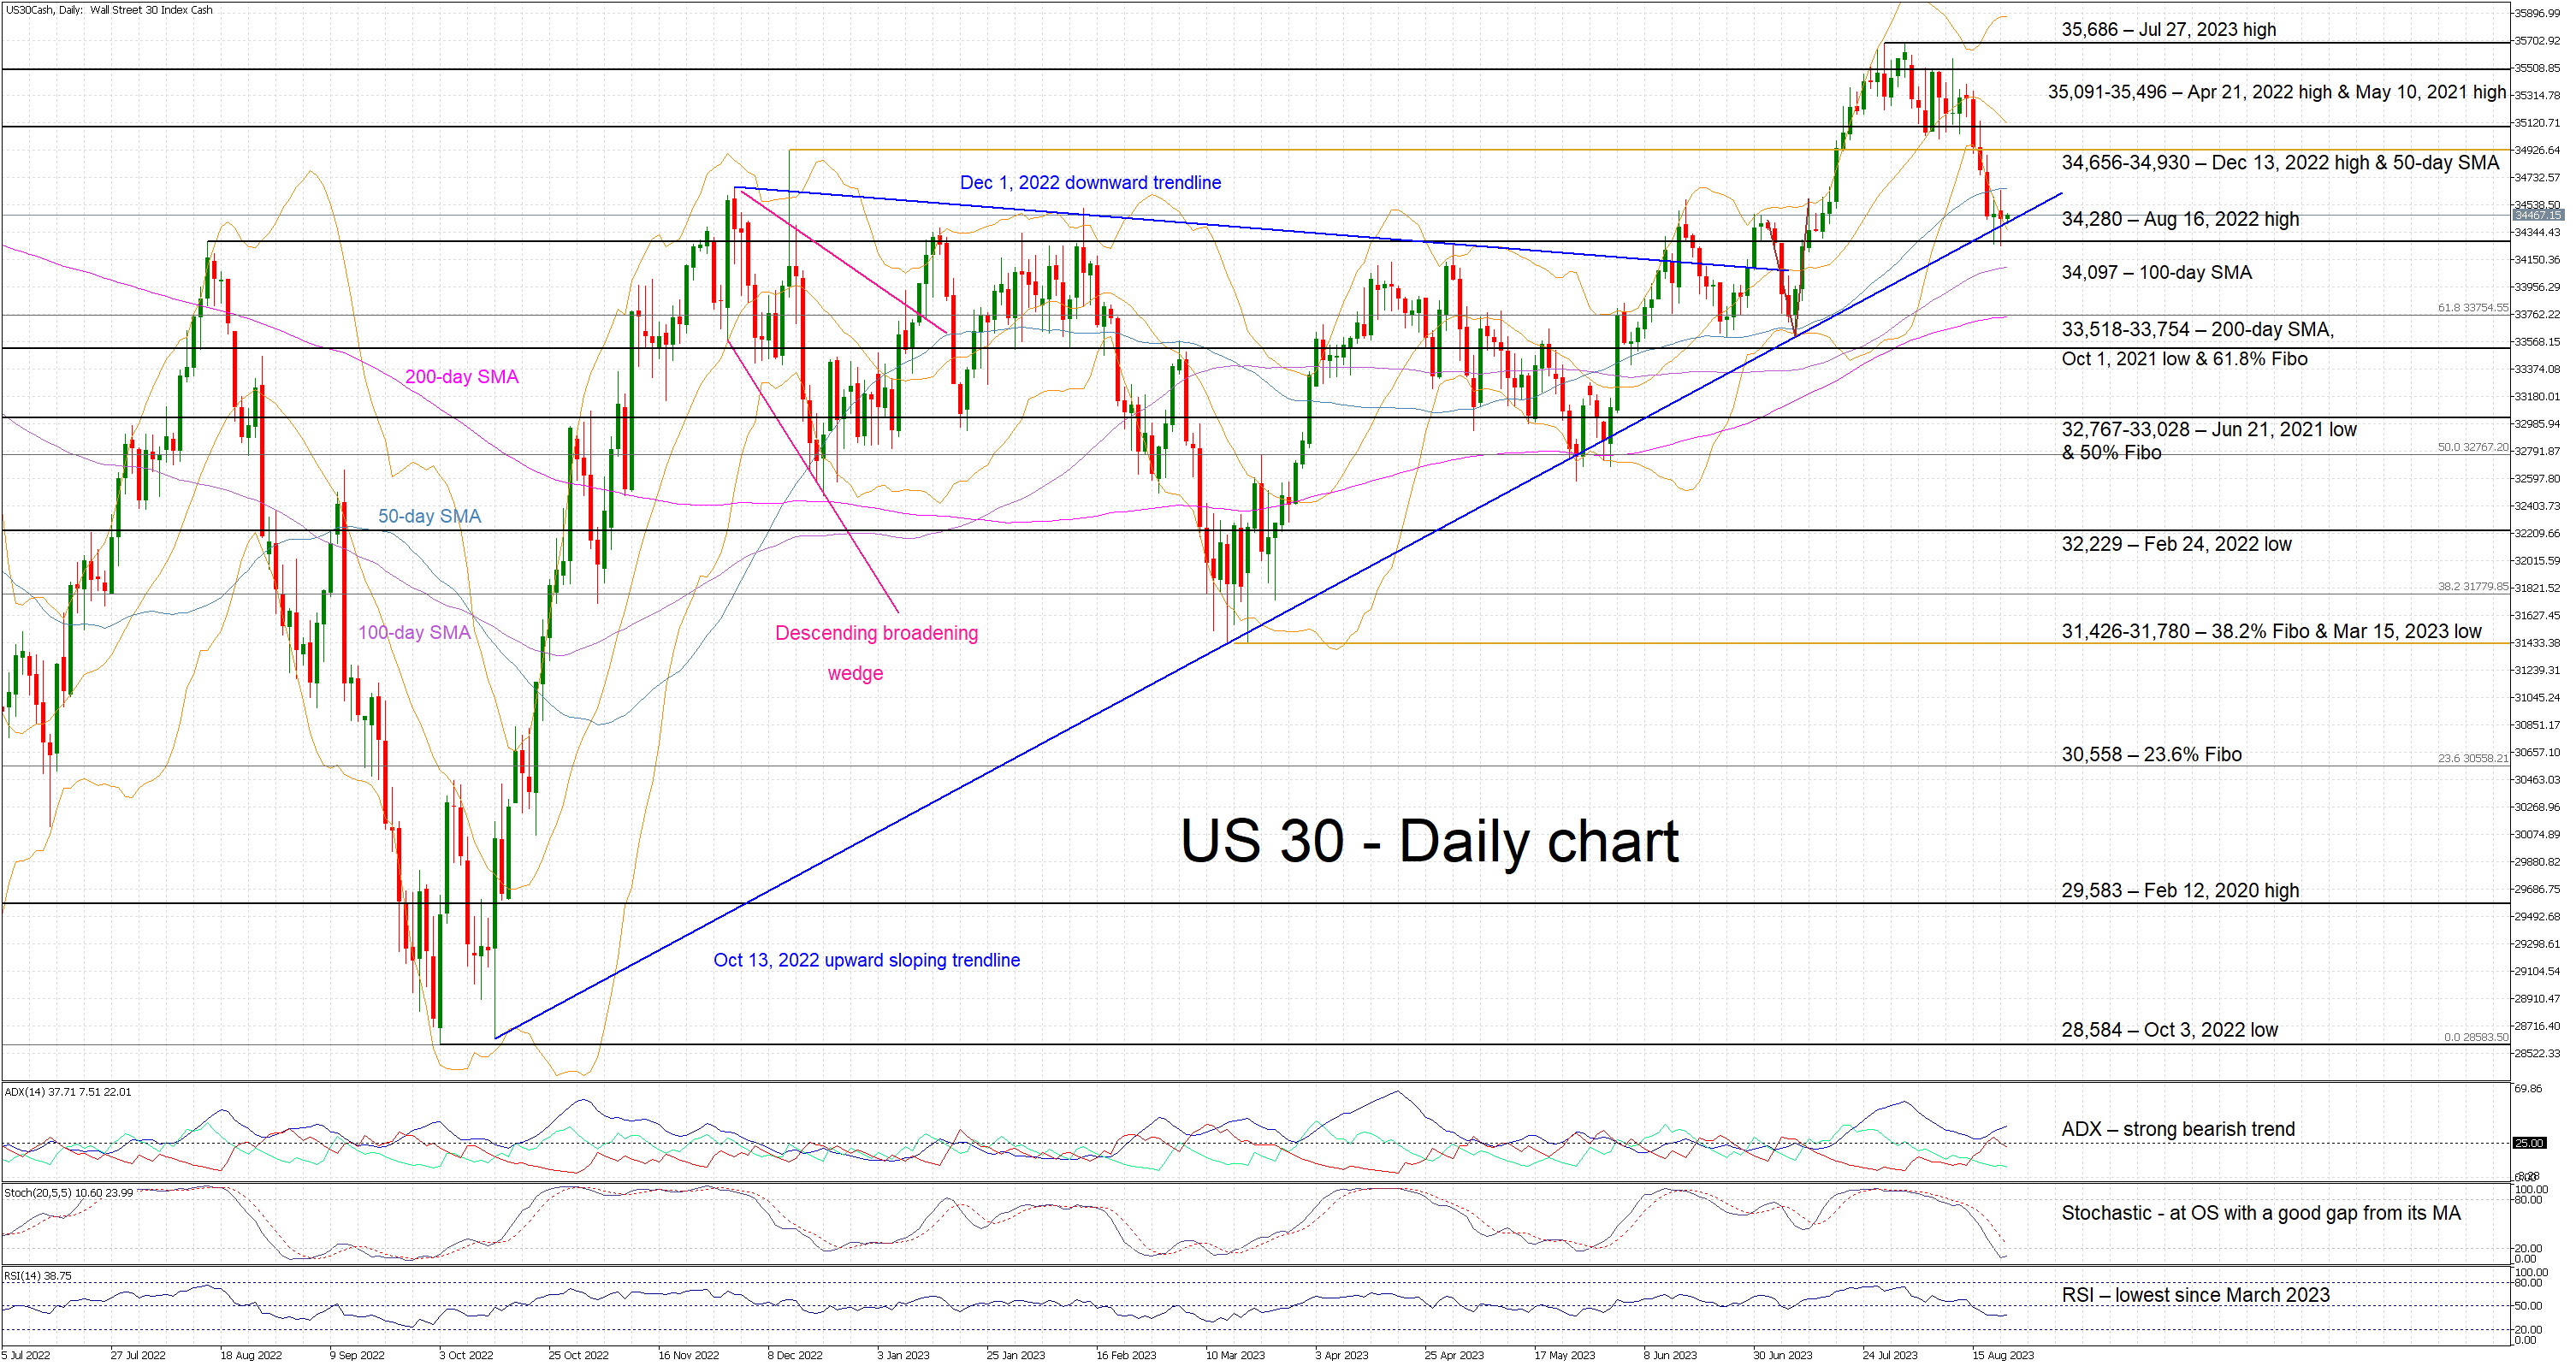
The US 30 cash index has been under bearish pressure after registering a new 2023 high and its highest print since April 2022. It is trading sideways today, testing the support set by the October 13, 2022 upward sloping trendline. The previous three times this trendline was tested, the bears failed to record a decisive sell-off, geometrically increasing its importance.
The momentum indicators remain mostly supportive of the current downleg. More specifically, the RSI has reached its lowest point since the March 2023 correction. Similarly, the Average Directional Movement Index (ADX) is edging higher and thus signals the presence of a bearish trend in the market. Interestingly, the stochastic oscillator remains in its oversold territory (OS) and still holds a good gap from its moving average. It can hover in its OS for a considerable amount of time before signaling a reversal.
The bears’ determination will probably be put to the real test by the October 13, 2022 trendline. If successfully broken, the 100-day simple moving average (SMA) at 34,097 is unlikely to trouble the bears much. However, the same cannot be said for the next support area at the 33,518-33,754 range that is populated by the 200-day SMA, the October 1, 2021 low and the 61.8% Fibonacci retracement of the January 5, 2022 – October 3, 2022 downtrend respectively.
On the flip side, the bulls’ first target would probably be to defend the October 13, 2022 trendline. They could then have a go at the busier 34,656-34,930 range, which is defined by the December 13, 2022 high and the 50-day SMA. Even higher, the 35,091-35,496 area would then stand in bulls’ way.
To sum up, the fate of the current pullback depends on the US 30 index bears clearing the support set by the October 13, 2022 trendline.
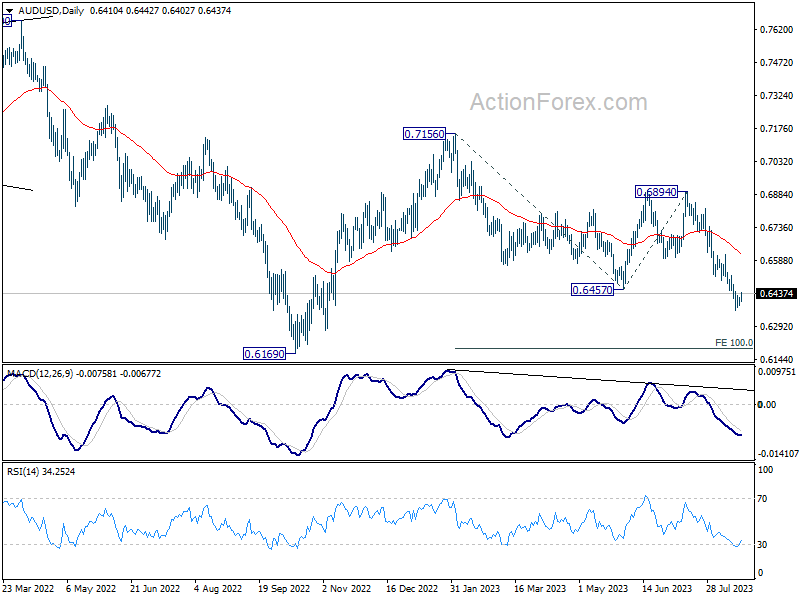
AUD/USD Daily Report
Daily Pivots: (S1) 0.6394; (P) 0.6408; (R1) 0.6429; More...
Intraday bias in AUD/USD is turned neutral as consolidation from 0.6363 is going to extend further. While stronger recovery cannot be ruled out, upside should be limited by 0.6615 resistance. Break of 0.6363 will resume larger fall from 0.7156 to 100% projection of 0.7156 to 0.6457 from 0.6894 at 0.6195.
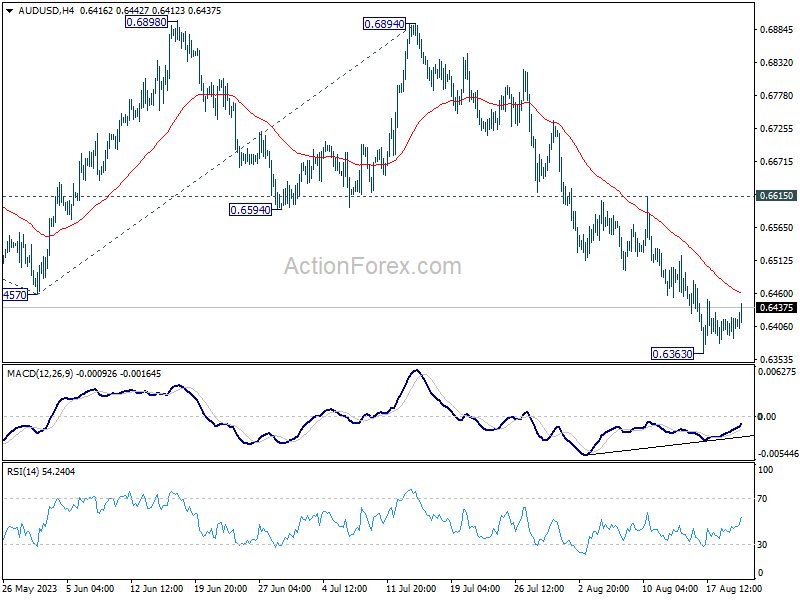
In the bigger picture, current development argues that the down trend from 0.8006 (2021 high) is still in progress. Decisive break of 0.6169 will target 61.8% projection of 0.8006 to 0.6169 to 0.7156 at 0.6021. This will now remain the favored case as long as 0.6894, in case of strong rebound.