Sample Category Title
Gold Drops to Fresh 5-Month Low
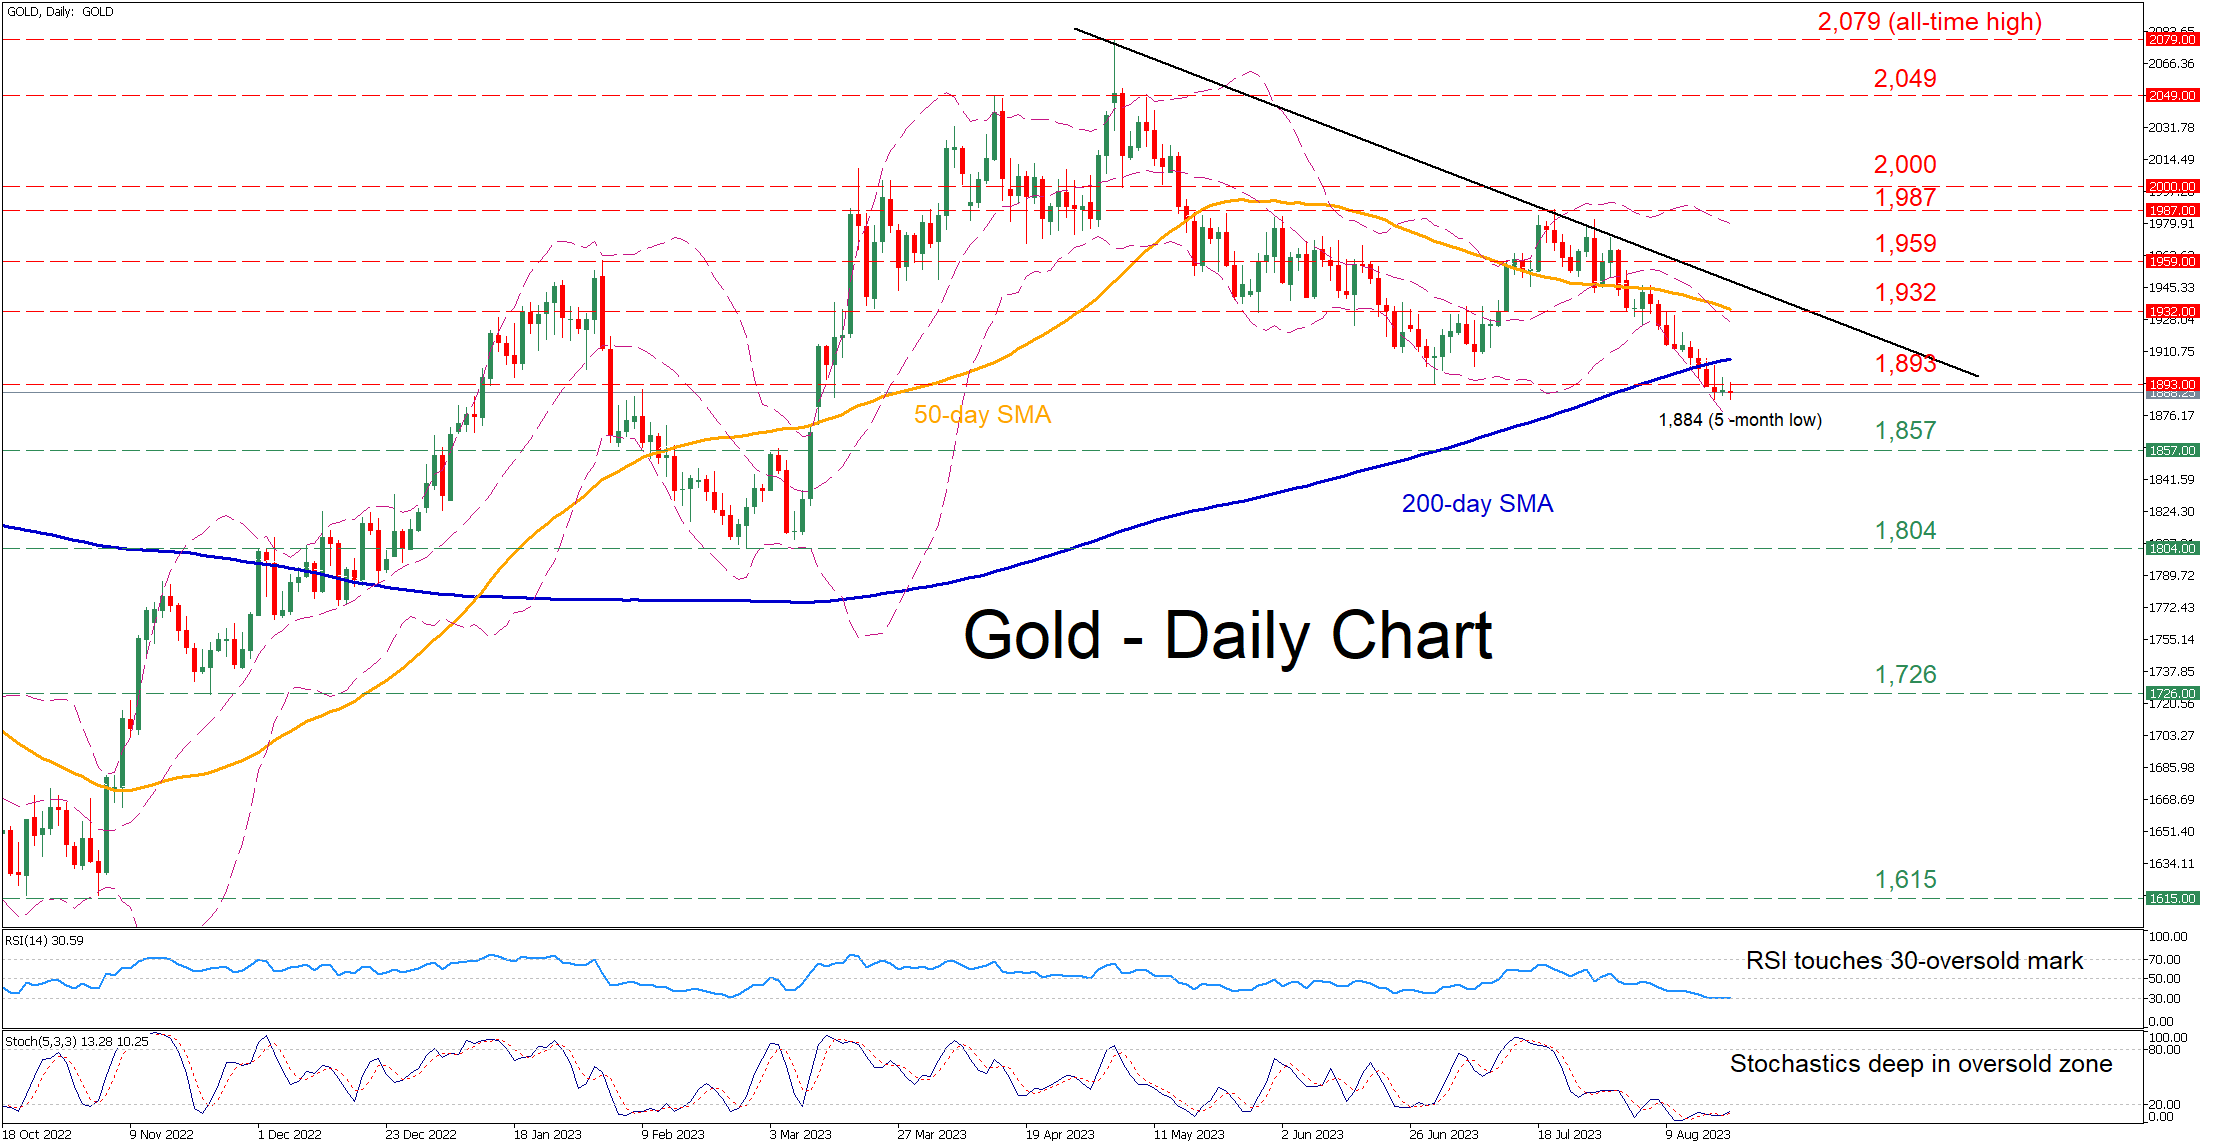
Gold had been experiencing a strong pullback following its recent peak at 1,987, with the price slicing through both its 50- and 200-day simple moving averages (SMAs). Moreover, in today’s session, bullion fell to a fresh five-month bottom as the bulls seem to be staying on the sidelines.
The momentum indicators suggest that the recent decline might be overstretched. Specifically, the RSI is battling with its 30-oversold mark, while the stochastic oscillator has been hovering within its oversold territory for the last 13 days.
If the price manages to stage a comeback, the bulls could initially target the June low of 1,893 ahead of the 1,932 support, which overlaps with the 50-day SMA. Surpassing the latter, gold may ascend to challenge the February high of 1,959. Even higher, the July peak of 1,987 might curb further advances.
On the flipside, should the retreat extend, the March resistance of 1,857 could act as the first line of defense. A violation of that zone could open the door for the 2023 bottom of 1,804. Should that barricade also fail, the spotlight could turn to the November 2022 support of 1,726.
In brief, gold has been undergoing a downside correction, failing to recover some ground despite reaching oversold conditions. Looking forward, bullion’s failure to reclaim the 200-day SMA could induce more downside pressures.
GBP/USD Consolidates While EUR/GBP Takes Hit
GBP/USD is attempting a recovery wave above the 1.2700 resistance. EUR/GBP declined heavily below the 0.8600 and 0.8565 support levels.
Important Takeaways for GBP/USD and EUR/GBP Analysis Today
- The British Pound is attempting a fresh increase above 1.2700.
- There is a key contracting triangle forming with resistance near 1.2740 on the hourly chart of GBP/USD at FXOpen.
- EUR/GBP is trading in a bearish zone below the 0.8565 pivot level.
- There is a major bearish trend line forming with resistance near 0.8545 on the hourly chart at FXOpen.
GBP/USD Technical Analysis
On the hourly chart of GBP/USD at FXOpen, the pair settled below the 1.2800 zone. As mentioned in the previous analysis, the British Pound turned red and extended losses below the 1.2700 pivot level against the US Dollar.
Finally, the pair tested the 1.2620 zone and recently started a recovery wave. There was a decent increase above the 1.2700 pivot level. The pair is now consolidating near the 50-hour simple moving average at 1.2740.
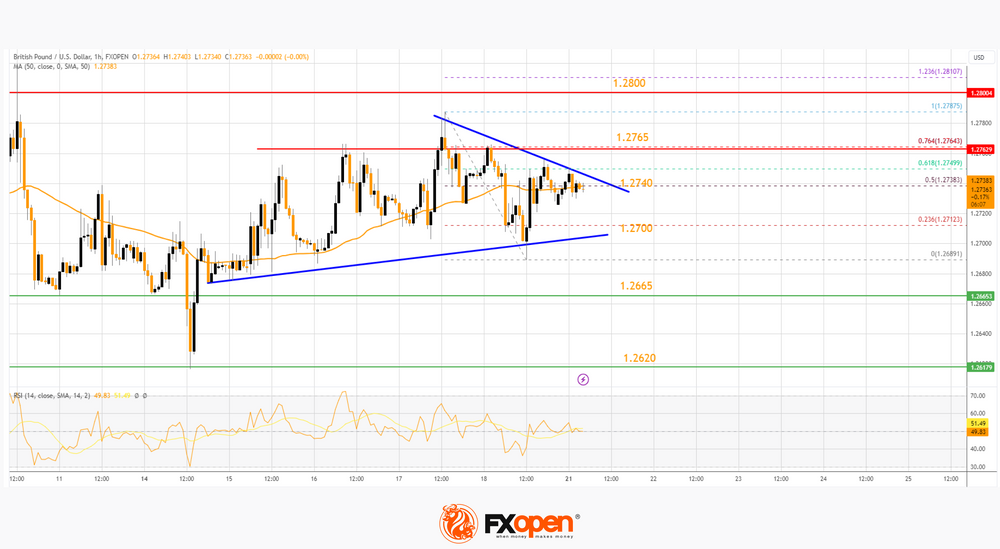
There is also a key contracting triangle forming with resistance near 1.2740. The triangle resistance coincides with the 50% Fib retracement level of the downward move from the 1.2787 swing high to the 1.2689 low.
On the upside, the GBP/USD chart indicates that the pair is facing resistance near 1.2740. The next major resistance is near the 76.4% Fib retracement level of the downward move from the 1.2787 swing high to the 1.2689 low at 1.2765.
A close above the 1.2765 resistance zone could open the doors for a move toward 1.2800. Any more gains might send GBP/USD toward 1.2880.
On the downside, there is a key support forming near 1.2700. If there is a downside break below 1.2700, the pair could accelerate lower. The next major support is near the 1.2665 zone, below which the pair could test 1.2620. Any more losses could lead the pair toward the 1.2550 support.
EUR/GBP Technical Analysis
On the hourly chart of EUR/GBP at FXOpen, the pair started a major decline from well above 0.8630. The Euro traded below the 0.8600 and 0.8565 support levels against the British Pound.
The EUR/GBP chart suggests that the pair even declined below the 0.8545 level and tested 0.8525. It is now consolidating losses and correcting higher above the 50-hour simple moving average and 0.8625.
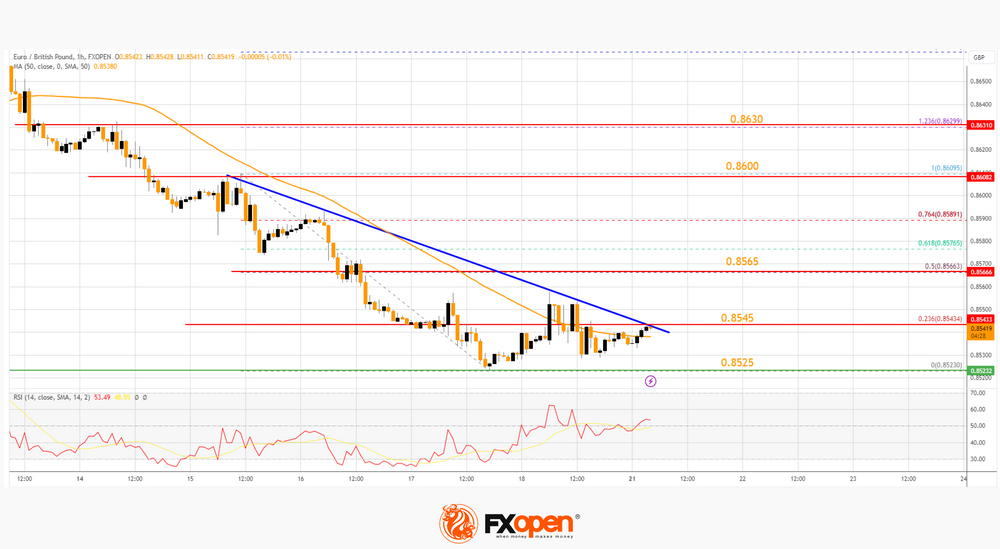
The pair is now facing resistance near a major bearish trend line at 0.8545. It is close to the 23.6% Fib retracement level of the main drop from the 0.8609 swing high to the 0.8523 low. The next major resistance could be 0.8565.
The 50% Fib retracement level of the main drop from the 0.8609 swing high to the 0.8523 low is also at 0.8565. A close above the 0.8565 level might accelerate gains. In the stated case, the bulls may perhaps aim for a test of 0.8600. Any more gains might send the pair toward the 0.8630 level.
Immediate support sits near 0.8525. The next major support is near 0.8500. A downside break below the 0.8500 support might call for more downsides. In the stated case, the pair could drop toward the 0.8440 support level.
Trade global forex with the Innovative Broker of 2022*. Choose from 50+ forex markets 24/5. Open your FXOpen account now or learn more about trading forex with FXOpen.
* FXOpen International, Innovative Broker of 2022, according to the IAFT
This article represents the opinion of the Companies operating under the FXOpen brand only. It is not to be construed as an offer, solicitation, or recommendation with respect to products and services provided by the Companies operating under the FXOpen brand, nor is it to be considered financial advice.
EUR/USD Daily Outlook
Daily Pivots: (S1) 1.0847; (P) 1.0871; (R1) 1.0896; More...
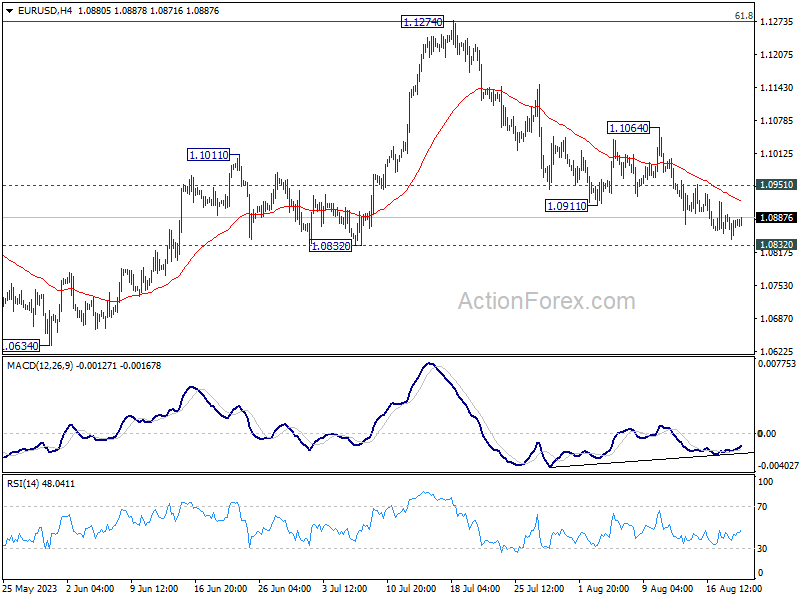
Intraday bias in EUR/USD is turned neutral as it continued to lose downside momentum ahead of 1.0832 support. On the downside, decisive break of 1.0832 support will target 1.0609/34 cluster support next. On the upside, above 1.0951 minor resistance will turn intraday bias neutral to the upside for stronger recovery.
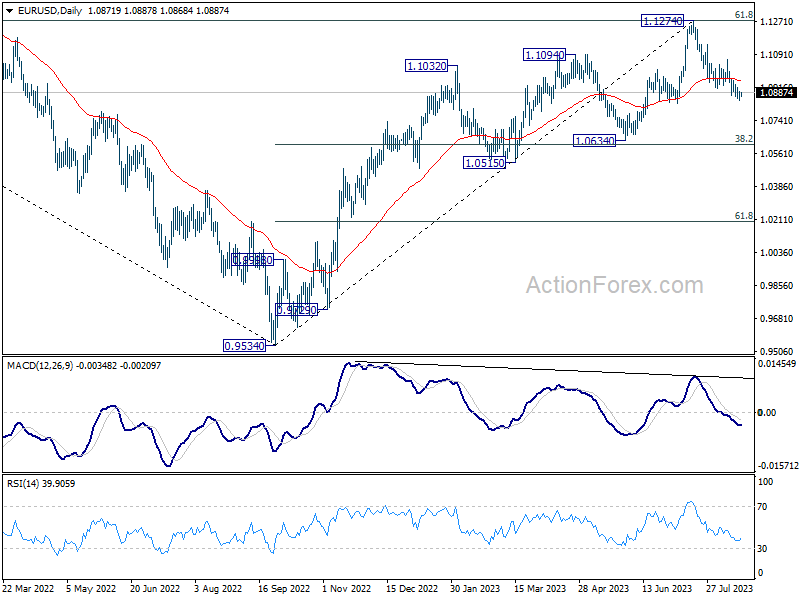
In the bigger picture, a medium term top should be formed at 1.1274, after failing to break through 61.8% retracement of 1.2348 (2021 high) to 0.9534 at 1.1273 decisively, on bearish divergence condition in D MACD. Fall from there is seen as a correction to the uptrend from 0.9534 (2022 low). Deeper decline would be seen to 1.0634 cluster support (38.2% retracement of 0.9534 to 1.1274 at 1.0609). Strong support could be seen there, at least on first attempt, to set the range for consolidation. Yet, medium term outlook will be neutral for now, as long as 1.1274 resistance holds.
GBP/USD Daily Outlook
Daily Pivots: (S1) 1.2696; (P) 1.2731; (R1) 1.2773; More...
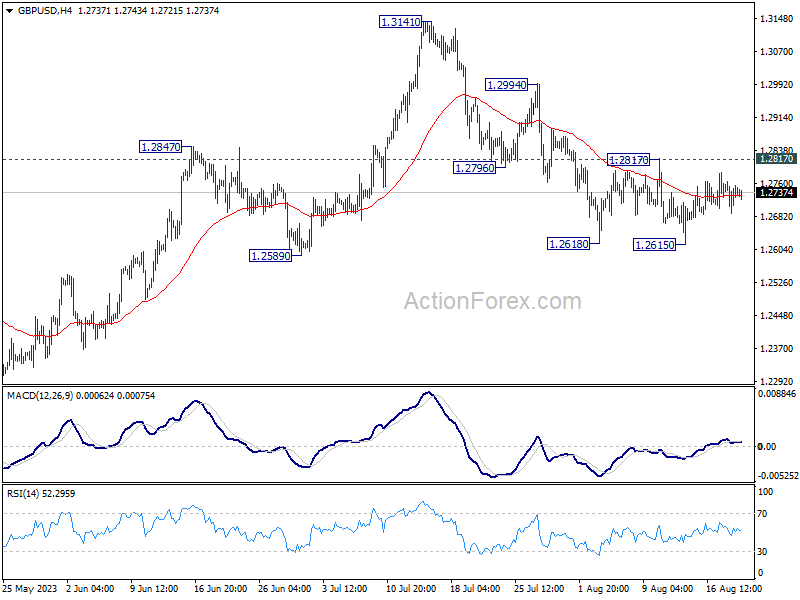
Intraday bias in GBP/USD stays neutral at this point. On the downside, firm break of 1.2615, and sustained trading below 1.2678 resistance turned support will argue that it's already in a larger correction. Deeper decline would then be seen to 1.2306 support next. Nevertheless, break of 1.2817 minor resistance will indicate that the pull back from 1.3141 has completed, and turn bias back to the upside for stronger rebound.
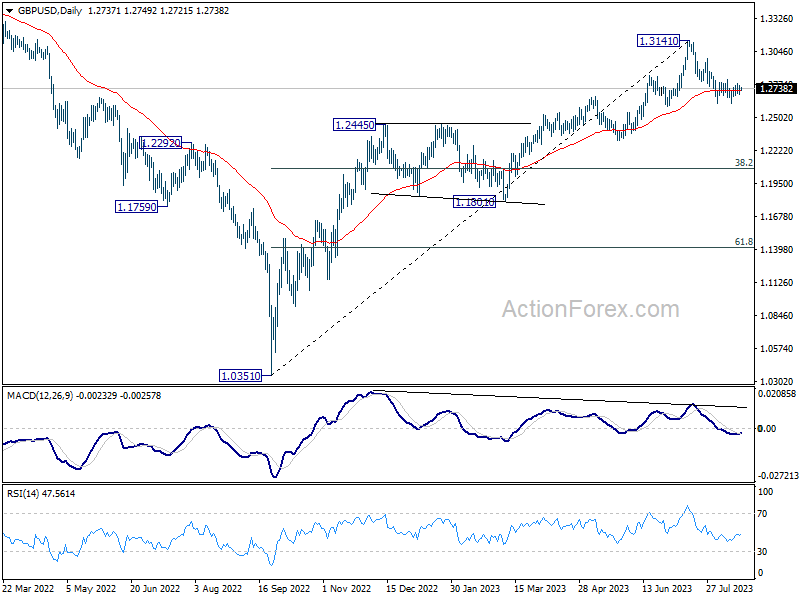
In the bigger picture, a medium term top could be in place at 1.3141 already, on bearish divergence condition in D MACD. Sustained trading below 55 D EMA (now at 1.2723) should confirm this case, and bring deeper fall to 38.2% retracement of 1.0351 to 1.3141 at 1.2075, as a correction to up trend from 1.0351 (2022 low). For now, rise will stay mildly on the downside as long as 1.3141 resistance holds, in case of strong rebound.
USD/CHF Daily Outlook
Daily Pivots: (S1) 0.8783; (P) 0.8806; (R1) 0.8846; More....
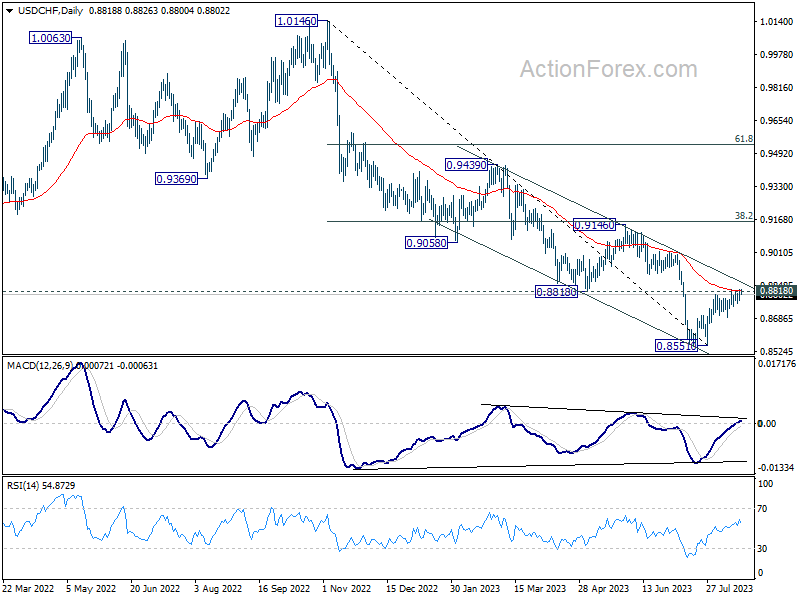
Intraday bias in USD/CHF remains neutral for the moment. Decisive break of 0.8818/26 resistance zone will carry larger bullish implication, and target 0.9146 cluster resistance next. However, break of 0.8688 support will indicate rejection by 0.8818, and turn bias back to the downside for retesting 0.8551 low.
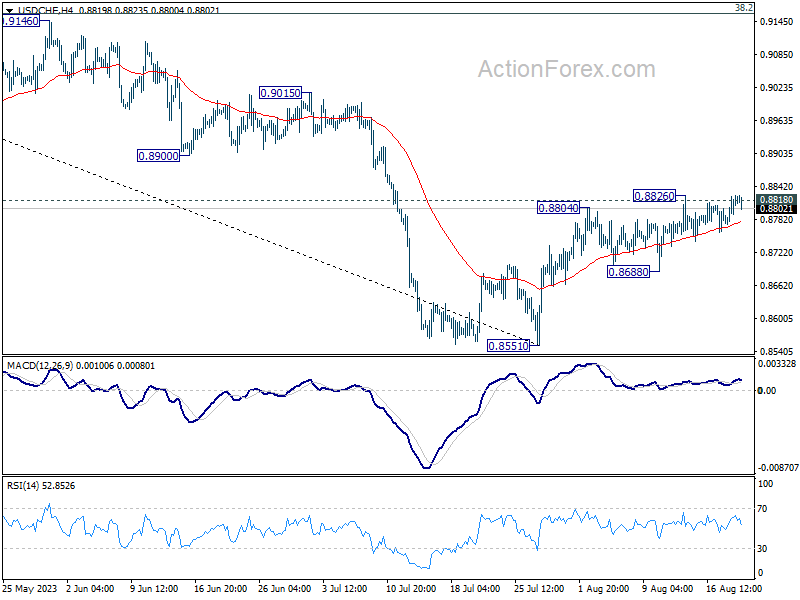
In the bigger picture, a medium term bottom could be in place at 0.8551 already, on bullish convergence condition in D MACD. Sustained trading above 0.8818 support turned resistance will bring further rise to 0.9146 cluster resistance (38.2% retracement of 1.0146 to 0.8551 at 0.9160), even as a correction. Nevertheless, break of 0.8851 will resume the down trend from 1.0146 instead.
USD/JPY Daily Outlook
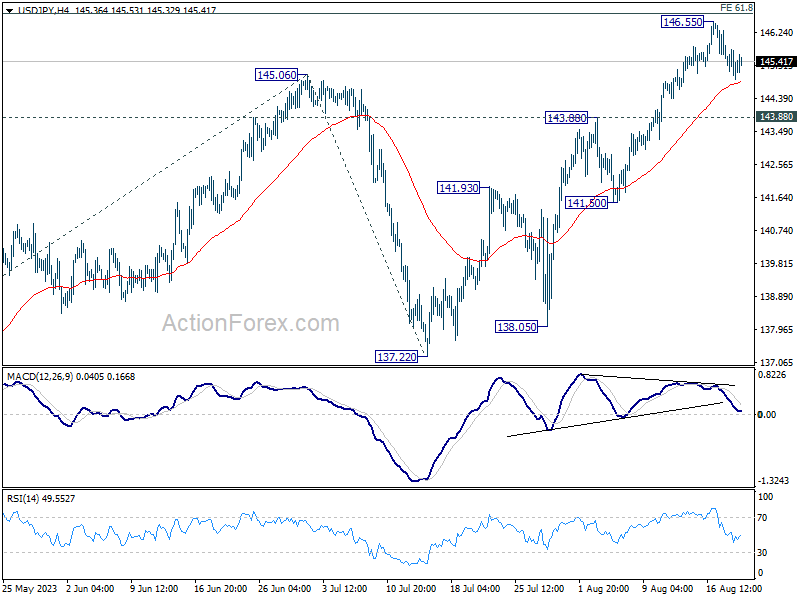
Daily Pivots: (S1) 144.92; (P) 145.40; (R1) 145.87; More...
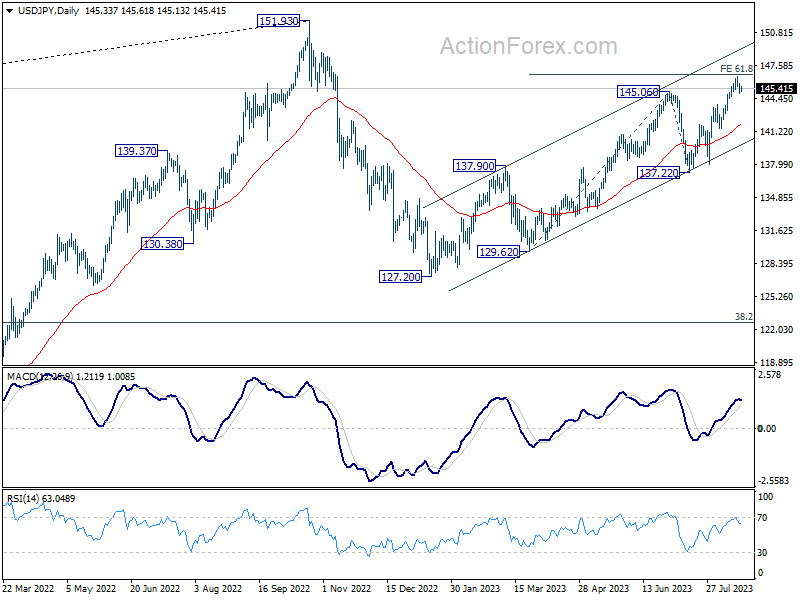
Intraday bias in USD/JPY remains neutral for consolidation below 146.55. On the upside, sustained break of 61.8% projection of 129.62 to 145.06 from 137.22 at 146.76 will pave the way to retest 151.93 high. However, considering bearish divergence condition in 4H MACD, firm break of 143.88 resistance turned support will be a sign of reversal, and turn bias back to the downside for 55 D EMA (now at 141.92).
In the bigger picture, overall price actions from 151.93 (2022 high) are views as a corrective pattern. Rise from 127.20 is seen as the second leg of the pattern and could still be in progress. But even in case of extended rise, strong resistance should be seen from 151.93 to limit upside. Meanwhile, break of 137.22 support should confirm the start of the third leg to 127.20 (2023 low) and below.
AUD/JPY Technical: Watch 92.80 Key Downside Trigger Level
- Weak medium-term momentum may kickstart a medium-term downtrend phase for AUD/JPY.
- Key short-term resistance stands at 93.70 with a potential downside trigger at 92.80.
Since its 19 June 2023 high of 97.67, the price actions of the AUD/JPY have continued to shape lower highs despite a retest and rebound on its key 200-day moving average after it printed an intraday low of 91.79 on 28 July 2023 ex-post Bank of Japan (BoJ)’s flexible yield curve control announcement on the 10-year Japanese Government Bond.
Technical analysis suggests that the AUD/JPY is now at heightened risk to evolve into a medium-term downtrend phase.
Challenging the 92.80 key downside trigger level
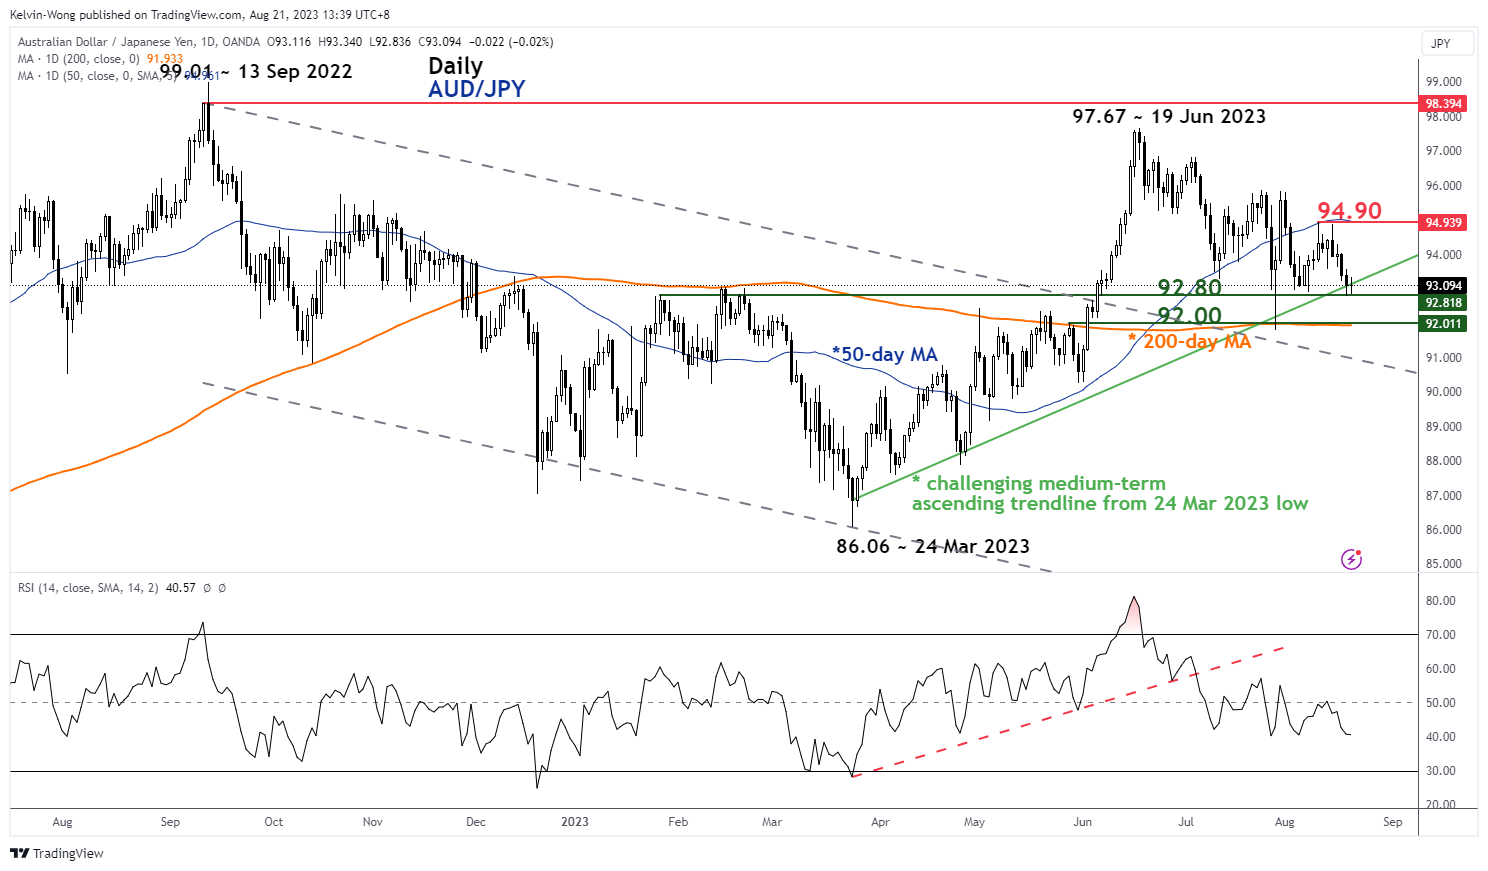
Fig 1: AUD/JPY medium-term trend as of 21 Aug 2023 (Source: TradingView, click to enlarge chart)
Last Friday, 18 August, AUD/JPY managed to stall its prior three days of decline at a key support/inflection level of 92.80 which is being defined by a confluence of elements; the former swing high areas of 26 January/14 February/21 February 2023, and medium-term ascending trendline from 24 March 2023 low of 86.06.
However, elements are not showing signs of any bullish reversal at this juncture with bearish momentum reading seen in the daily RSI oscillator as it inched lower from the 50 level and has not reached oversold condition.
Price actions oscillate within a minor descending channel
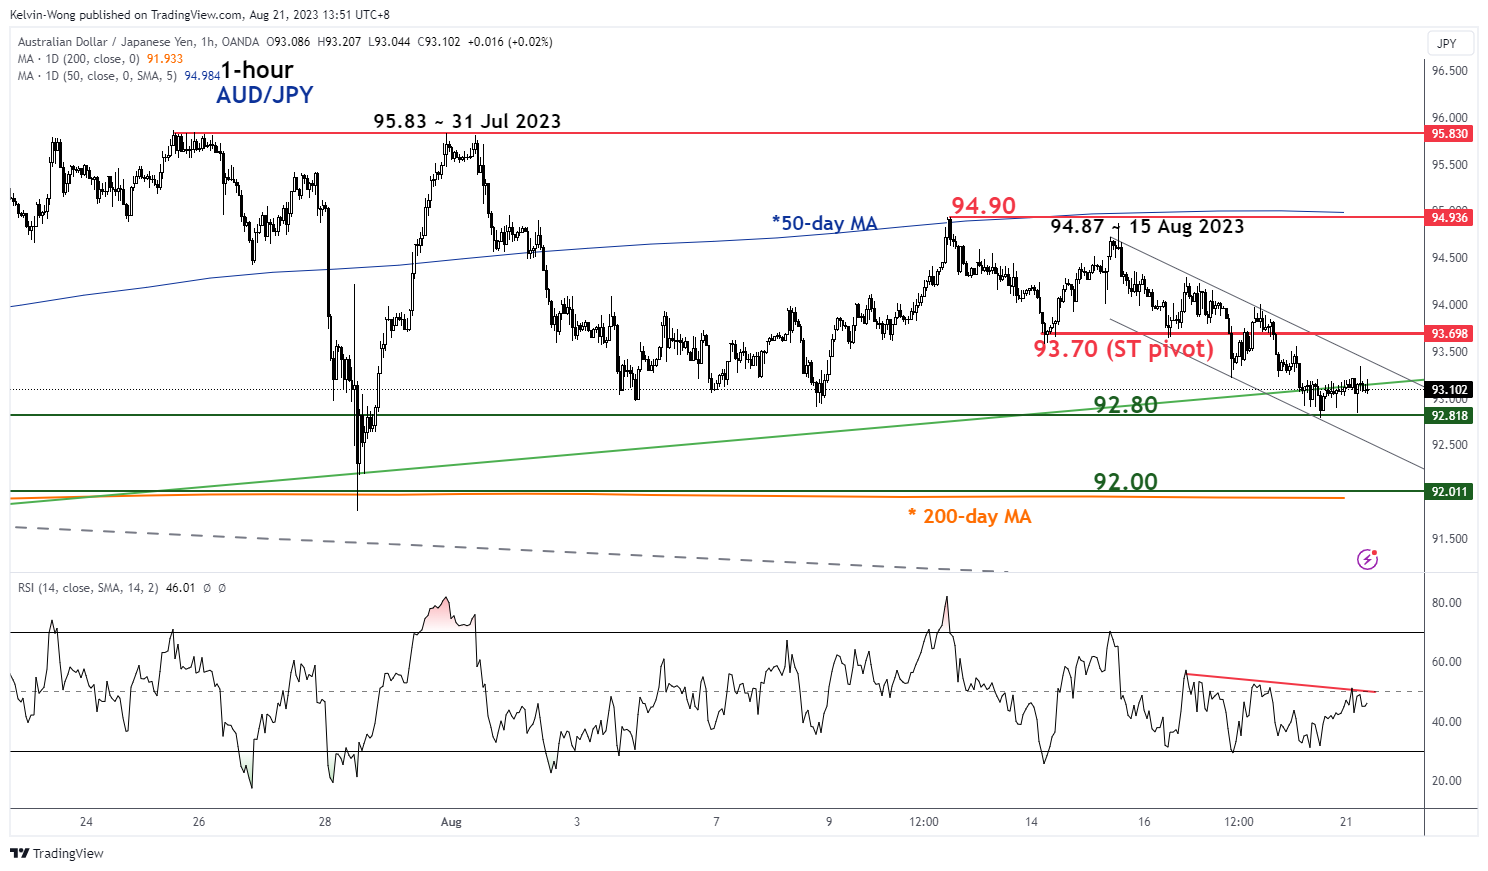
Fig 2: AUD/JPY minor short-term trend as of 21 Aug 2023 (Source: TradingView, click to enlarge chart)
The price actions of AUD/JPY have oscillated within a minor descending channel in place since 15 August 2023 minor swing high of 94.87 which suggested that further potential downside may materialize at least in the short-term horizon.
Watch the 93.70 key short-term pivotal resistance and a break below 92.80 near-term support exposes the next support at 92.00 (also the 200-day moving average) in the first step.
On the other hand, a clearance above 93.70 invalidates the bearish bias to see the next intermediate resistance at 94.90 (also the 50-day moving average).
Uncertainty on Policy Mix Keeps Yuan in Defensive
Markets
High profile technical levels eventually prevailed last Friday in a session absent of eco data, central bank speak or any other high-profile event. Core bonds ended off worst levels YTD after a surge higher in (US) real yields dominated most of August trading. It resulted in tests of cycle tops at the very long end (10y-30y) of US, but also German and UK yields. At 1.94%, the US 10-yr real yield had its highest weekly close since March 2009. A return of term premia (higher for even longer), credit risk (Fitch downgrade & public finances) and improved growth prospects (soft landing vs recession) all contributed. The lack of conviction of Friday’s core bond rebound suggests that the test of (yield) resistance levels remains ongoing. Higher real rates hurt risk sentiment. European stock markets lost around 0.5% again on Friday, but important support survived just for now. The picture remains fragile though, with EuroStoxx50 ending only just above 4200 and Asian risk sentiment this morning sluggish after Chinese data (see below). Main US stock indices ended around flat Friday, but the likes of the S&P 500 are clearly showing a topping out pattern, admittedly still withing the long term rising trend channel. First support kicks in at 4329. The dollar failed to really bank on the rater support with the trade weighted greenback testing, but for now not breaking, first resistance at 103.57. A real test of EUR/USD 1.0834 support didn’t occur yet. USD/JPY rallied from 138 mid-July to 146 currently. The Japanese ministry of Finance started its first FX interventions in almost 15 years around those levels last September. They later stepped it up around 150. The global context and unwillingness by the BoJ to really start normalizing monetary policy mean that JPY remains vulnerable.
Today’s eco calendar is empty apart from a Belgian OLO auction. The debt agency offers OLO 89 (0.1% Jun2030) and OLO 97 (3% Jun2033) for a combined €2.4-2.8bn. YTD, the debt agency already realized over 76% (€34.3bn) of its total OLO financing plan (€45bn). The bulk of this amount (€16bn) came from three syndicated deals. August global PMI’s (Wednesday) serve as distraction later this week going into Friday’s big event when Fed Chair Powell’s discusses the economic outlook at the US central bank’s high profile Jackson Hole symposium organized by the Kansas City Fed. Apart from guidance for the September meeting (no rate hike discounted), we look for clues on the neutral rate, the economic resilience and the disinflationary process. FOMC Minutes showed that for the majority of Fed members, the bar to hike rates another time is low given upside inflation risks.
News and Views
Chinese Banks announced to reduce the 1-year Loan Prime rate to 3.45% from 3.55%. The 5-year Loan Prime rate was kept unchanged at 4.20%. In both cases, the market expected a 15 bps reduction after the PBOC last week reduced the 1-year Medium-Term Lending Facility rate by a similar amount from 2.65% to 2.50%. The smaller than expected reduction in the bank rates leave markets in doubt on the degree of monetary support that Chinese authorities are prepared/able to put in place to revive economic activity in general and the ailing property sector in particular with deflationary tendencies also dampening activity. Uncertainty on the policy mix keeps the yuan in the defensive this morning with USD/CNY again jumping north 7.30 (7.3065) even as the PBOC set its daily fixing stronger than expected by market participants.
In a forecast published on Friday, the Czech Ministry of Finance downwardly revised growth for this and next year respectively to -0.2% (from 0.1%) and 2.3% (from 3.0%). Average inflation for this year was seen unchanged at 10.9%. The average predicted price rise for 2024 was slightly upwardly revised from 2.4% to 2.8%. At the same time, the Finance ministry forecasts a substantial improvement in the current account deficit. For this year, the Ministry sees a deficit of 1.7% and for next year of 0.6%. This compares to deficit forecasts of 3.5% and 1.9% respectively released in its April projections.
USD/CAD Daily Outlook
Daily Pivots: (S1) 1.3527; (P) 1.3551; (R1) 1.3577; More....
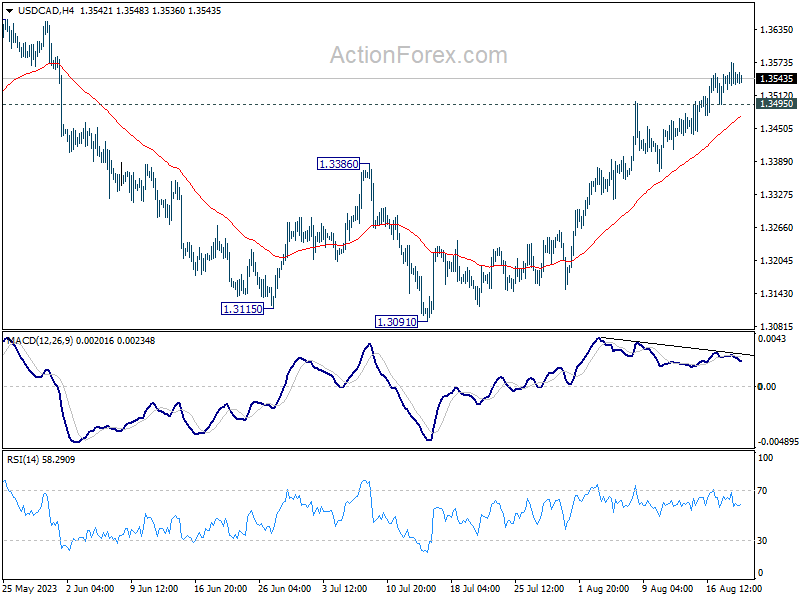
Intraday bias in USD/CAD stays on the upside despite loss of upside momentum. Current rally would target 1.3653 resistance first. Decisive break there will confirm that correction from 1.3976 has completed, a target a test on this high. On the downside, below 1.3495 minor support will turn intraday bias neutral and bring consolidations first, before staging another rise.
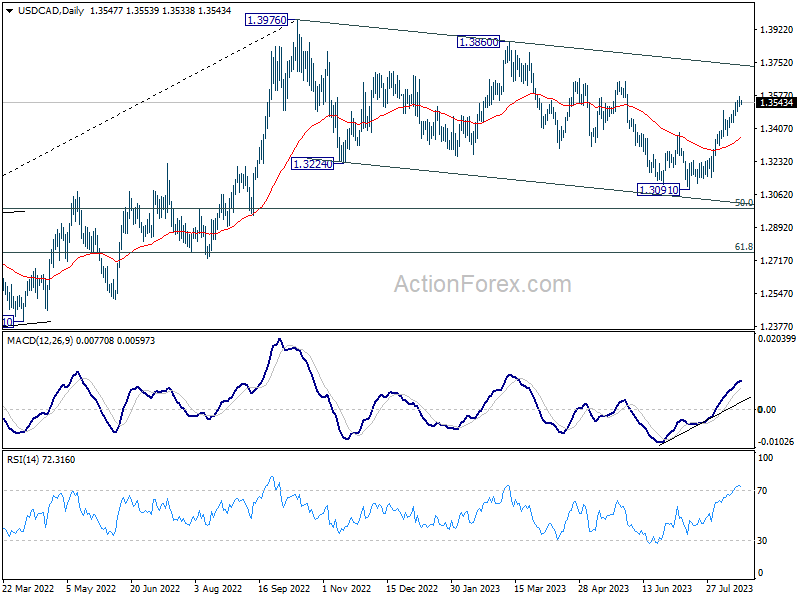
In the bigger picture, price actions from 1.3976 are viewed as a corrective fall only. Upon completion, rise from 1.2005 (2021 low) would resume through 1.3976. Next target is 61.8% projection of 1.2005 to 1.3976 from 1.3091 at 1.4309. In case of another fall, downside should be contained by 61.8% retracement of 1.2005 to 1.3976 at 1.2758.
AUD/USD Daily Report
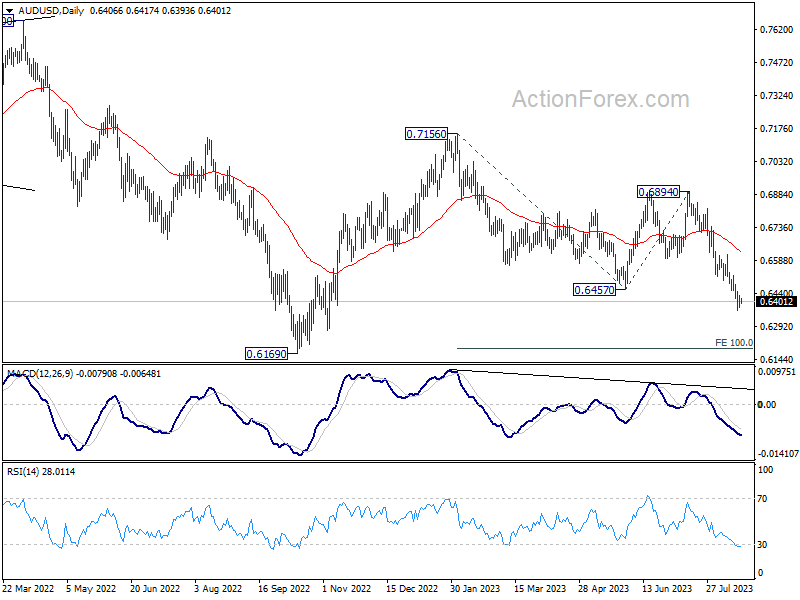
Daily Pivots: (S1) 0.6380; (P) 0.6404; (R1) 0.6430; More...
Intraday bias in AUD/USD remains on the downside despite loss of downside momentum. Current fall should target 100% projection of 0.7156 to 0.6457 from 0.6894 at 0.6195. On the upside, above 0.6479 minor resistance will turn intraday bias neutral and bring consolidations first, before staging another fall.
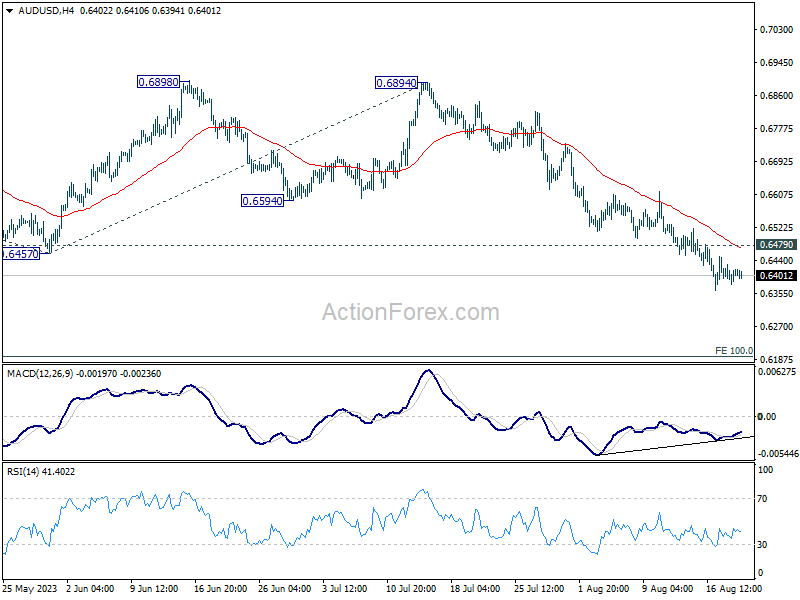
In the bigger picture, current development argues that the down trend from 0.8006 (2021 high) is still in progress. Decisive break of 0.6169 will target 61.8% projection of 0.8006 to 0.6169 to 0.7156 at 0.6021. This will now remain the favored case as long as 0.6894, in case of strong rebound.