

Sample Category Title
EUR/CHF Daily Outlook
Daily Pivots: (S1) 0.9554; (P) 0.9576; (R1) 0.9616; More...
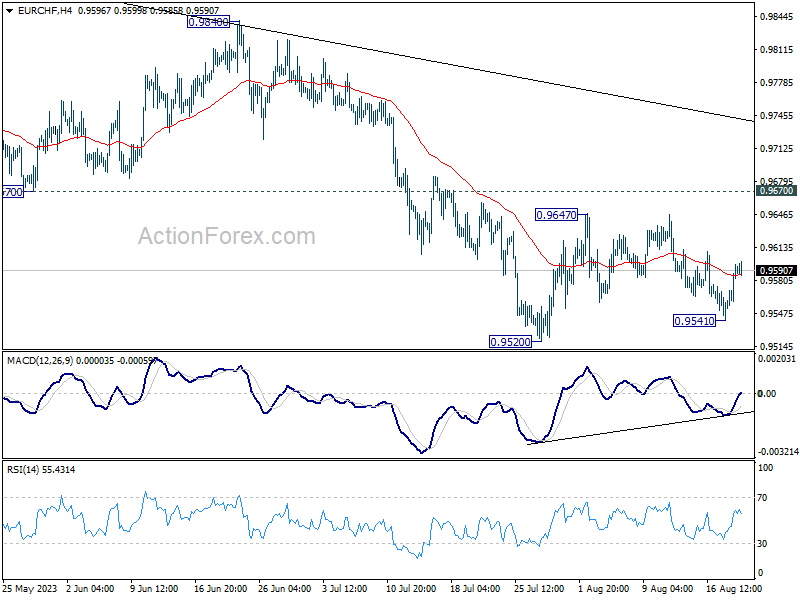
Intraday bias in EUR/CHF remains neutral as sideway trading continues. On the upside, break of 0.9647 will resume the rebound from 0.9520. Further sustained break of 0.9670 will be the first sign of bullish reversal and target 0.9840 resistance for confirmation. On the downside, break of 0.9520 will resume the whole fall from 1.0095 towards 0.9407 low.
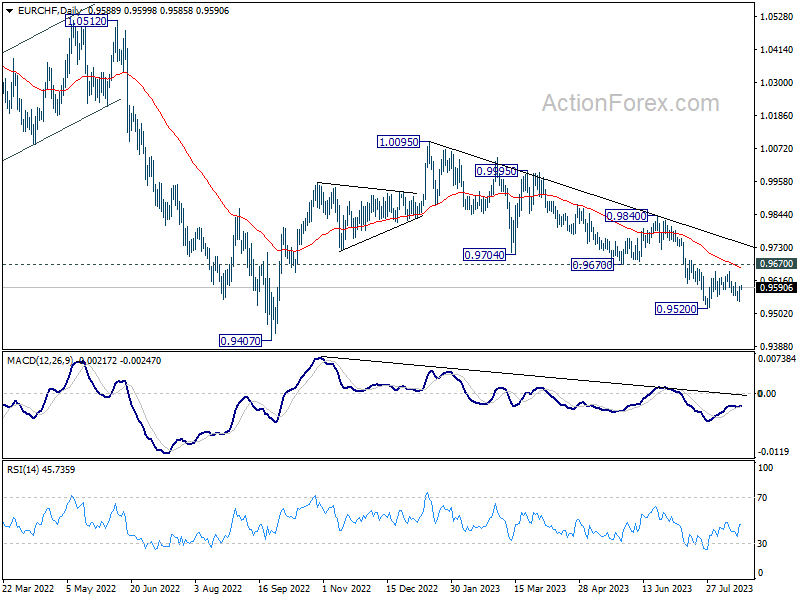
In the bigger picture, medium term outlook is staying bearish as the pair is capped well below falling 55 W EMA (now at 0.9849). Down trend from 1.2004 (2018 high) is in favor to continue. Sustained break of 0.9407 will target 61.8% projection of 1.1149 to 0.9407 from 1.0095 at 0.9018. For now, this will remain the favored case as long as 0.9840 resistance holds, in case of strong rebound.
GBP/JPY Daily Outlook
Daily Pivots: (S1) 184.50; (P) 185.22; (R1) 185.89; More...
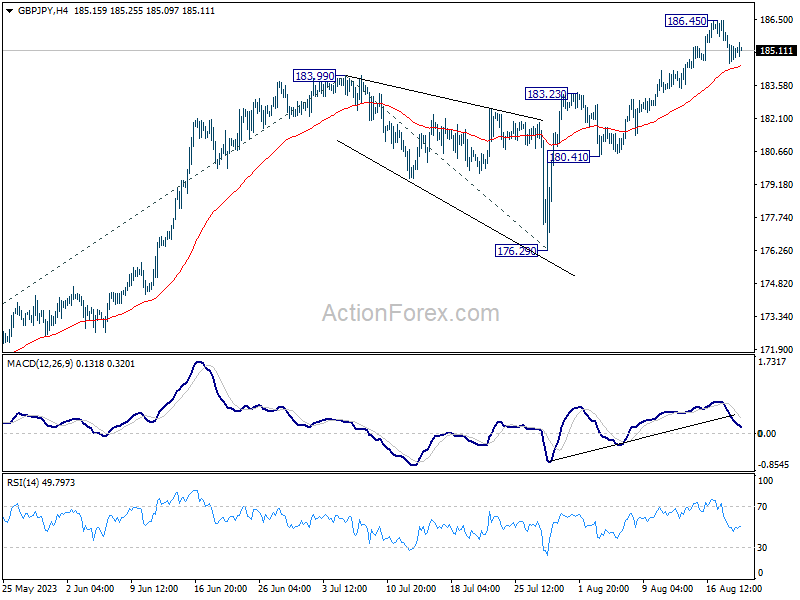
Intraday bias in GBP/JPY stays mildly on the downside at this point. Pull back from 186.45 would target 183.23 resistance turned support. Nevertheless, on the upside, break 186.45 will resume larger up trend to 61.8% projection of 158.24 to 183.99 from 176.29 at 192.20.
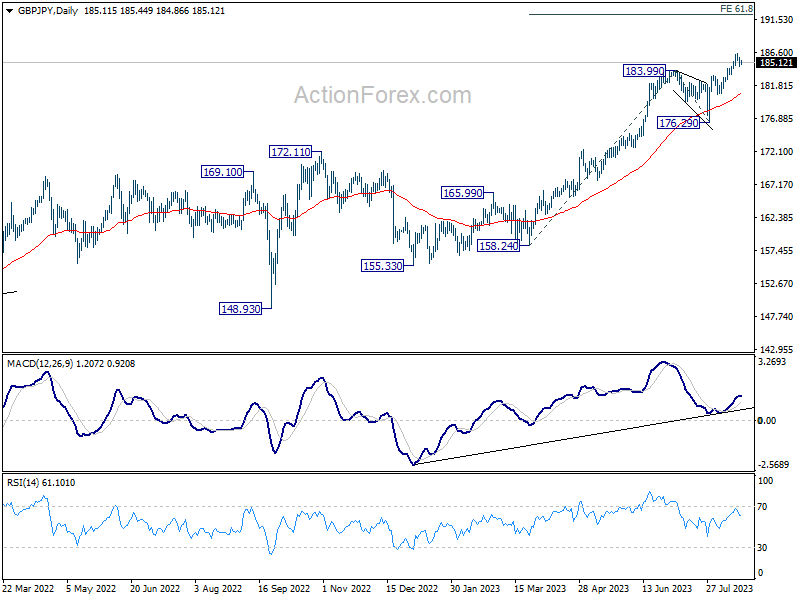
In the bigger picture, up trend from 123.94 (2020 low) is in progress. Next target is 195.86 (2015 high). This will now remain the favored case as long as 176.29 support holds, even in case of deeper pull back.
EUR/JPY Daily Outlook
Daily Pivots: (S1) 157.66; (P) 158.12 (R1) 158.59; More....
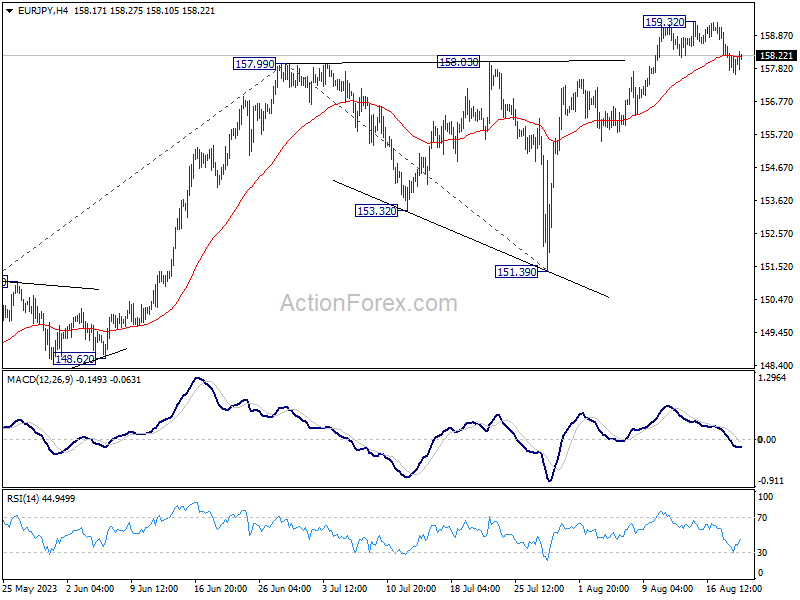
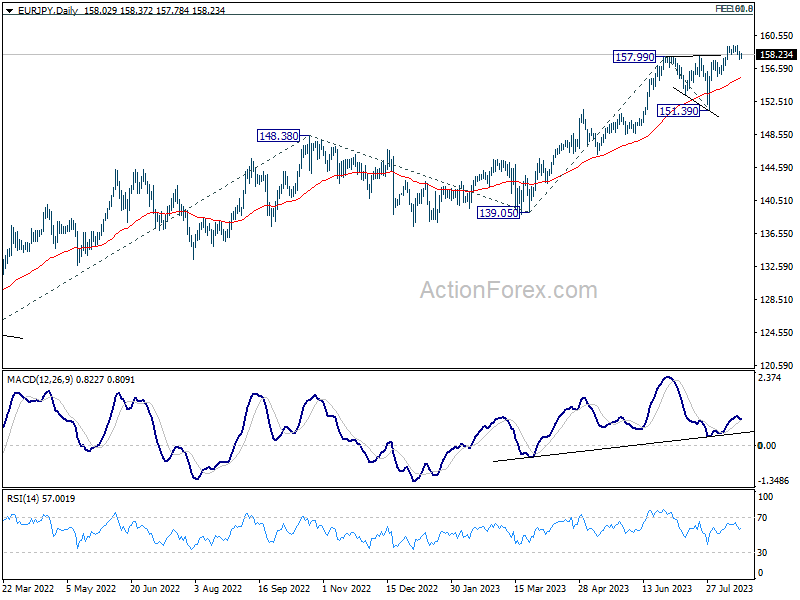
Intraday bias in EUR/JPY stays mildly on the upside at this point. Pull back from 159.32 could extend to 55 D EMA (now at 155.42). On the upside, though, break of 159.32 will resume larger up trend to 61.8% projection of 139.05 to 157.99 from 151.39 at 163.09 next.
In the bigger picture, rise from 114.42 (2020 low) is in progress. Next target is 100% projection of 124.37 to 148.38 from 139.05 at 163.06. Sustained break there will pave the way to retest long term resistance at 169.96. This will now remain the favored case as long as 151.39 support holds, even in case of deep pull back.
EUR/GBP Daily Outlook
Daily Pivots: (S1) 0.8523; (P) 0.8540; (R1) 0.8555; More...
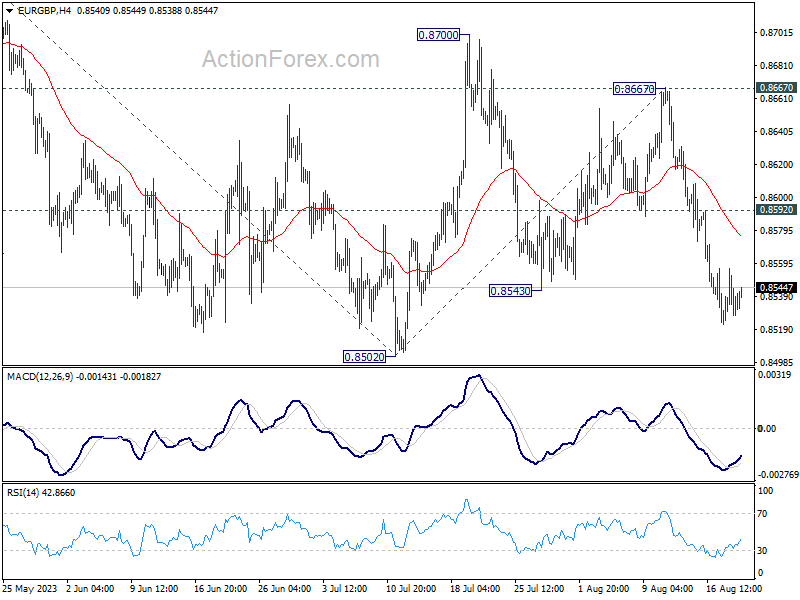
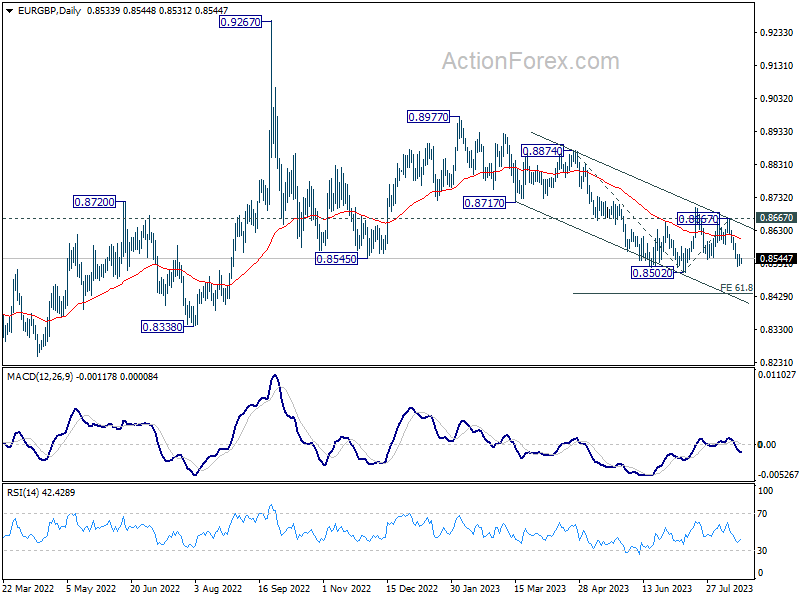
Intraday in EUR/GBP is turned neutral with current recovery, but further decline is expected with 0.8592 resistance holds. Decisive break of 0.8502 will resume larger down trend. Next target is 61.8% projection of 0.8874 to 0.8502 from 0.8667 at 0.8437. On the upside, above 0.8592 minor resistance will mix up the outlook and extend sideway trading from 0.8502.
In the bigger picture, the down trend from 0.9267 (2022 high) is seen as part of the long term range pattern from 0.9499 (2020 high). Further decline is in favor as long as 0.8667 resistance holds. Break of 0.8502 will resume the fall towards 0.8201 (2022 low).
China Rate Cuts Remain Short of Expectations, Focus on Jackson Hole, BRICS
The week starts with weak appetite as Chinese banks cut loan rates less than expected; the 1-year LPR was cut by 10bp to a record low versus 15bp cut expected by analysts, while the 5-year LPR was left unchanged despite pressure from Beijing. Chinese banks’ decision to keep the 5-year rate steady is confusing for investors, in the middle of a property crisis. The Hang Seng index sank further into bear market, and the global risk sentiment is less than ideal as healthy economic data from the US, and darker clouds over China cast shadow on both stock and bond markets.
The US 10-year yield approached the highest levels since 2007, as the US 30-year yield hit the highest levels advanced towards levels last seen in 2011. The rising yields weigh on major stock indices. The S&P500 closed last week around 2% lower, and Nasdaq 100 lost 2.6% last week. Interestingly, the S&P500 has been down by around 3% since the beginning of this earnings season – while the earnings season was not that bad. Nearly 80% of the companies announced better-than-expected results and Refinitiv highlighted that the Q2 of 2023 had the highest rate of companies beating expectations since Q3 2021, and the earnings expectations rebounded to the highest levels since last October, when the major US indices bottomed out. This picture simply means that the fear of a further Fed tightening, prospects of higher interest rates, combined to the set of bad news from China simply didn’t let investors enjoy the better-than-expected earnings.
Jackson Hole and BRICS
This week, investors will have their eyes and ears on Federal Reserve (Fed) Chair Jerome Powell’s Jackson Hole speech due Friday. The chances are that he will keep his hawkish stance despite falling inflation. The minutes from the latest FOMC meeting highlighted ‘significant upside risks’ on inflation. This being said, the fear of decidedly hawkish Fed is already priced in, and if there is no more hawkish surprise from this week’s Jackson Hole meeting, tensions among investors could ease by next week, and give markets some breathing room.
Elsewhere, BRICS summit will take place this week between 22nd and 24rd of August. What’s interesting with this summit is 1. A month ago, South Africa said that 40 more nations wanted to join BRICS, and 23 of them formally applied to become members including Saudi Arabia, Iran, and UAE. 2. They would like to drop US dollar and eventually start using member-state currencies to settle their trade terms between them, and 3. There are rumours that the BRICS countries could even issue a gold-based currency to replace the US dollar, as many nations are willing to free themselves from the risks of holding and using US dollars. Note that the rumours of a gold-based BRICS currency didn’t necessarily boost appetite in gold lately. The price of an ounce is, on the contrary, mainly driven by US yields. The rising US yields weigh on gold appetite by increasing the opportunity cost of holding the non-interest-bearing gold. The yellow metal slipped below its 200-DMA last week for the first time since December. A downside correction in the US yields could slow the selloff and encourage a minor positive correction but given the Fed’s undoubtful hawkish stance on its rate policy, gold bulls may need BRICS to say something about their currency plans. But I am afraid the latter might not be on the agenda of this week’s summit.
Modest Chinese Rate Cut
Market movers today
The week is off to a quiet start in terms of data releases with nothing significant in the calendar.
The big data event this week will be on Wednesday when flash PMIs are released for the Euro Area and the US (among others). This release may well set the tone ahead of the September rate meetings in the ECB and the Fed. Risks to growth are a large part of the case for those arguing against an ECB hike even though inflation remains high, following disappointing PMIs in July. For the US, hard data for July has been strong but soft indicators for August have been very mixed, with strong Philly Fed and weak Empire Manufacturing Index. Also a highlight for this week is the Fed's Jackson Hole Symposium Thursday to Saturday with Powell speaking on the economic outlook Friday.
The 60 second overview
Modest Chinese stimulus: The Peoples Bank of China (PBoC) cut the one-year loan prime rate (LPR) by 10 basis points to 3.45% this morning. Most new and outstanding loans are based on the one-year LPR. This comes after the PBoC unexpectedly cut its medium-term policy rate last week. The cut today was no surprise, although smaller than the 15bps expectation. It was a surprise however, that the five-year LPR, which affects mortgage prices, was left at 4.20%. This probably reflects concerns about a weaker yuan, which has had a tough year. USD/CNY increased somewhat when markets opened.
Euro area inflation: On Friday, the final HICP data looked to confirm what country figures already implied. There seems to be no temporary holiday factors, like tourism, that can explain the continued high core price pressures in July. Hotel prices or package holidays have not been off the charts. It looks like a broad based service price pressure, which supports our call for another ECB hike in September.
Japan: On Friday, we also got Japanese inflation data for July. Core inflation (excluding food and energy) increased to 2.7% from 2.6% in June highlighting some inflation stickiness. Price momentum has been weaker for a few months now though, as food and energy prices have been the key inflation drivers this far. Coupled with a disappointing wage print in June and weak domestic demand in the national account data, the pressure on the BoJ to begin tightening has eased somewhat since the July policy tweak. Overall we see good chances of another tweak to the yield curve control in one of the three remaining meetings for this year. The September meeting, however, is starting to look like a non-event.
Equities: Global equities lower again Friday, though with some more optimism in the US cash session. The turn towards defensive and energy continued without any macro drivers or news out of China to change the recent narrative. In US on Friday, Dow +0.1%, S&P 500 -0.01%, Nasdaq -0.2% and Russell 2000 +0.5%. This week starting basically as the previous one with huge focus on China's property sector, some small policy adjustments and falling equities. Outside China, a more upbeat tone with most indices being higher. US and European futures are close to unchanged this morning.
FI: Concerns on China sent global yields lower on Friday from the open by 8-9bp in the 10y area. The 5 to 10y area outperformed the short end and the long end of the curve. After the market open reaction, the rest of the day was mostly side-ways trading. This week, focus turns towards PMIs and the Fed's annual conference in Jackson Hole with Powell and Lagarde both speaking on Friday.
FX: Friday, and last week in general, saw NOK and SEK underperforming other G10 currencies and they have now lost 8% and 7%, respectively vs USD since the troughs in mid-July. EUR/USD has been on a downward trajectory the past month and is currently trading below 1.09. Focus this week is on Jackson Hole speeches including Jerome Powell's on Friday.
Credit: Last Friday completed a full week of daily widening in credit spreads. Itraxx Main widened 1.6bp to 78.1bp while Xover widened 5.9bp to 430.2bp. The weak tone throughout last week was carried by increased anxiety around the Chinese economy and hawkish signals from central banks. A theme that also drove equities wider. In spite of the bearish backdrop, we saw several primary issues during the week, indicating that the markets are not, by any means, in panic mode.
EUR/AUD Daily Outlook
Daily Pivots: (S1) 1.6944; (P) 1.6980; (R1) 1.7015; More...
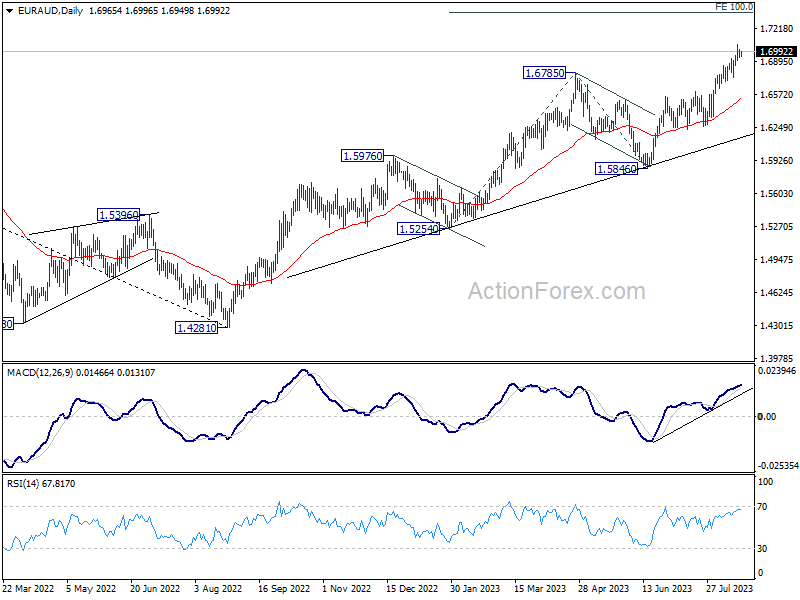
Intraday bias in EUR/AUD is turned neutral first as consolidation from 1.7062 temporary top is extending. Further rally is expected as long as 1.6737 support holds. Break of 1.7062 will resume larger up trend from 1.4281 to 1.7377 projection level.
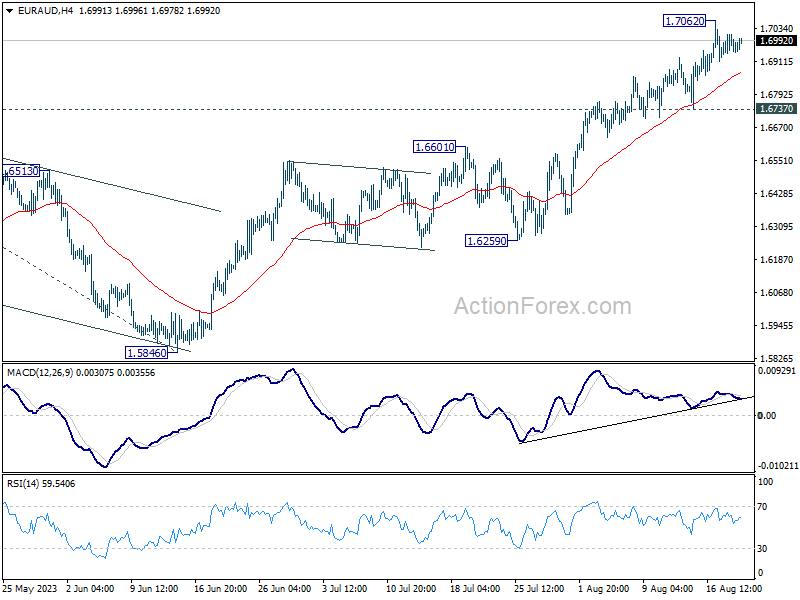
In the bigger picture, the rise from 1.4281 (2022 low) is in progress. Next target is 100% projection of 1.5254 to 1.6785 from 1.5846 at 1.7377. For now, outlook will stay bullish as long as 1.5846 support holds, even in case of another pull back.
Markets Treading Cautiously, as PMIs and Jackson Hole Awaited
As a fresh week unfolds, global markets seem to tread cautiously, keeping a close watch on the recent undertakings in Asian economies. PBoC's modest rate cut decision has catalyzed a minor pullback in stocks across China and Hong Kong. In contrast, Japan's Nikkei shows modest gains, reflecting a divergence in Asian market sentiment. The offshore Chinese Yuan wavers but stays above last week's low against Dollar.
In the currency sphere, Australian and New Zealand dollars are registering mild declines alongside the greenback. On the flip side, Canadian dollar, Euro, and Swiss Franc exhibit a modest uptick. However, any drastic movement in major currency pairs are yet to be seen, with almost all major pairs and crosses stuck inside Friday's range.
Investors should gear up for a potentially subdued trading ambiance in the next couple of days, given the sparse economic calendar. Nevertheless, Wednesday promises some action with release of PMIs from pivotal economies and Canadian retail sales data. Undoubtedly, the week's crescendo will be the eagerly awaited annual Jackson Hole symposium, culminating in Fed Chair Jerome Powell's address.
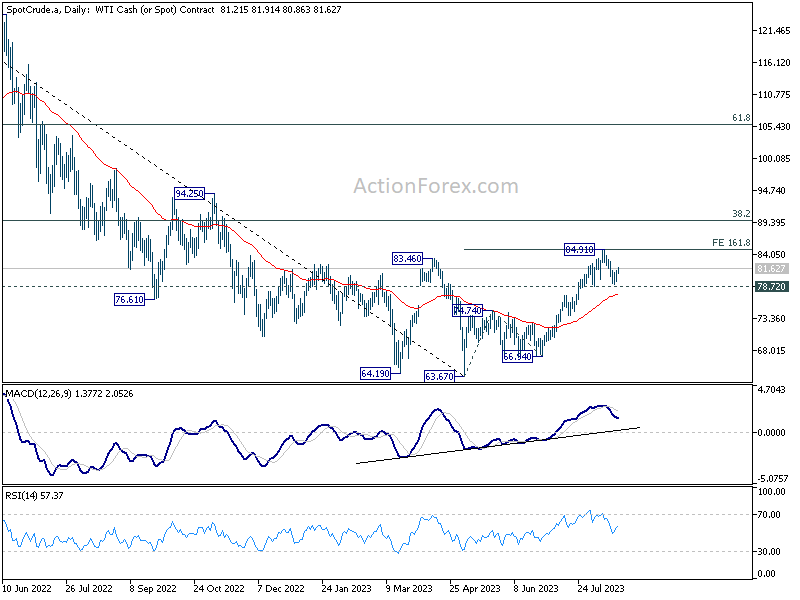
Technically, WTI crude oil recovers notably today and appears to have defended 78.72 near term support well on first attempt. The development keeps near term outlook neutral at worst, with prospect of resuming the larger rise from 63.67 through 84.91 resistance towards 90 handle at a later stage. However, firm break of 78.72 support, will argue that this rebound has completed, and bring deeper fall back to 74.74 resistance turned support, probably together with deterioration in risk sentiment elsewhere.
In Asia, at the time o writing, Nikkei is up 0.61%. Hong Kong HSI is down -1.38%. China Shanghai SSE is down -0.38%. Singapore Strait Times is down -0.45%. Japan 10-year JGB yield is up 0.012 at 0.643.
NZ exports down -14% yoy in Jul, imports down -16% yoy, China leads the falls
July 2023 has been a challenging month for New Zealand's trade scenario, as the island nation witnessed a steep fall in both goods exports and imports. Data released depicted a substantial decline, with exports plunging by NZD -890m or -14% yoy, concluding at NZD 5.5B. Concurrently, imports saw a -16% yoy decline, falling NZD -1.2B to settle at NZD 6.6B for the month. This decrease in trade volumes culminated in a monthly trade deficit of NZD -1.1B. This significantly overshadows market expectations of NZD -0.05B.
Zooming in on the country-by-country trade details, China conspicuously led the downturn in both exports and imports. New Zealand's exports to the Asian giant dipped by -24% yoy, translating to a decline of NZD -407m while imports reduced by a staggering NZD -427m, down -25% yoy.
However, not all trade relations showed a contraction. Australia the US emerged as silver linings, with their exports experiencing an upward trajectory. Exports to Australia saw an 8.9% yoy growth, adding NZD 59m to the tally, and US followed suit with a 16% yoy rise, upping the figure by NZD 105m.
Yet, as New Zealand engaged with its other major trade partners, the news wasn't all positive. European Union and Japan both registered a decrease in exports, declining by -16% yoy (NZD -73m) and -21% yoy (NZD -84m) respectively. On the import front, while USA and South Korea posted a rise of 24% (NZD 166m) and 18% (NZD 71m), both European Union (up 1.9% yoy) and Australia (down -2.7% yoy) experienced mixed results.
China cuts 1-yr LPR moderately, keeps 5-yr LPR unchanged
In a somewhat anticipated move, China's PBoC made a cut to its one-year loan prime rate by 10bps, settling it at 3.45%. This is a slight deviation from the 15bps reduction that the majority of economists had forecasted. What stands out is that this marks the second reduction in this rate in just a span of three months.
However, eyebrows were raised when PBOC decided to keep its five-year LPR — the benchmark for most mortgages in the country — steady at 4.2%. This move defied expectations of a 15 bps cut by many market watchers. The unaltered five-year LPR is being read by many as a signal of Chinese banks' hesitancy to compromise their rate differential margin. Such reluctance throws into sharp relief potential concerns about the effective transmission of PBOC's policy decisions into the broader market landscape.
Furthermore, it stirs up conversations about the central bank's capability to invigorate the property sector and the broader economy through monetary easing strategies. This narrative is all the more potent given that this decision on the one-year LPR came on the heels of an unexpected reduction in PBOC's medium-term policy rate just a week earlier. To give specifics, PBOC had reduced the one-year medium-term lending facility rate by 15 basis points, bringing it down to 2.50% from its previous 2.65%.
Considering these rate adjustments, many financial experts are now projecting more proactive measures from the PBOC in the forthcoming months. This may encompass further rate trims as well as potential reductions in the reserve requirement ratio for banks.
Fed Powell's balancing act at Jackson Hole in focus
As the financial world turns its gaze towards the Annual Jackson Hole Symposium from August 24-26, expectations are mounting on the discussions surrounding "Structural Shifts in the Global Economy." This renowned gathering, drawing in elite central bankers from across the globe, stands as a barometer for gauging the future trajectory of monetary policies.
The spotlight is set to shine brightest on Fed Chair Jerome Powell's speech this Friday. The backdrop is intriguing. On one hand, post-July FOMC meeting data reveals easing pressures on prices and wages in the US, tilting the scales towards concluding the ongoing tightening phase. On the other, the undeniable vitality in labor markets coupled with robust consumer spending suggests that price pressure isn't backing down anytime soon. Market stakeholders will be keen to dissect how Powell balances these contrasting narratives in his address.
Yet, for those expecting a seismic shift in Fed's stance, disappointment might be on the horizon. The overarching narrative is likely to remain consistent – a commitment to combating inflation, while leaving the door ajar for a potential September rate hike. It's also prudent to remember that decision-makers at Fed will have another round of CPI and non-farm payroll data at their disposal before the crucial FOMC verdict on September 20. As for hints on the timing of inaugural rate cut, Powell is anticipated to toe the line, emphasizing the need for interest rates to remain restrictive for as long as the situation demands.
While Powell's speech will be the main event, it's the off-stage whispers that could provide invaluable insights. Observers should attune their ears to the informal comments from other Fed officials. Their words might just offer a glimpse into the hawkish vs. dovish balance within the committee.
Amidst the Jackson Hole fervor, the broader economic calendar for the week seems relatively subdued, characteristic of the last full week of August. Yet, there are some metrics worth the watch. PMI figures from the heavyweights – Australia, Japan, Eurozone, UK, and US – are poised to dominate headlines. With the services sector being the bulwark of major economies, even as manufacturing grapples with recessionary winds, any signs of fading momentum here could spark concerns. The looming question: How soon before the manufacturing downturn spills over to services?
Beyond PMIs, analysts will also be tracking US durable goods orders, Germany's Ifo business climate index, Canada's retail sales, and New Zealand's trade balance and retail metrics. All in all, an eventful week beckons for financial market aficionados.
Here are some highlights for the week:
- Monday: New Zealand trade balance; Germany PPI; Canada new housing price index.
- Tuesday: Swiss trade balance; UK public sector net borrowing; Eurozone current account; US existing home sales.
- Wednesday: New Zealand retail sales; Australia PMIs; Japan PMIs; Eurozone PMIs; UK PMIs; Canada retail sales; US PMIs, news home sales.
- Thursday: US jobless claims, durable goods orders.
- Friday: Japan Tokyo CPI, corporate services prices; Germany GDP final, Ifo business climate; US U of Michigan consumer sentiment final.
EUR/AUD Daily Outlook
Daily Pivots: (S1) 1.6944; (P) 1.6980; (R1) 1.7015; More...
Intraday bias in EUR/AUD is turned neutral first as consolidation from 1.7062 temporary top is extending. Further rally is expected as long as 1.6737 support holds. Break of 1.7062 will resume larger up trend from 1.4281 to 1.7377 projection level.
In the bigger picture, the rise from 1.4281 (2022 low) is in progress. Next target is 100% projection of 1.5254 to 1.6785 from 1.5846 at 1.7377. For now, outlook will stay bullish as long as 1.5846 support holds, even in case of another pull back.
Economic Indicators Update
| GMT | Ccy | Events | Actual | Forecast | Previous | Revised |
|---|---|---|---|---|---|---|
| 22:45 | NZD | Trade Balance (NZD) Jul | -1107M | -50M | 9M | -111M |
| 23:01 | GBP | Rightmove House Price Index M/M Aug | -1.90% | -0.20% | ||
| 06:00 | EUR | Germany PPI M/M Jul | -0.20% | -0.30% | ||
| 06:00 | EUR | Germany PPI Y/Y Jul | -5.10% | 0.10% | ||
| 12:30 | CAD | New Housing Price Index M/M Jul | 0.00% | 0.10% |
Technical Outlook and Review
DXY:
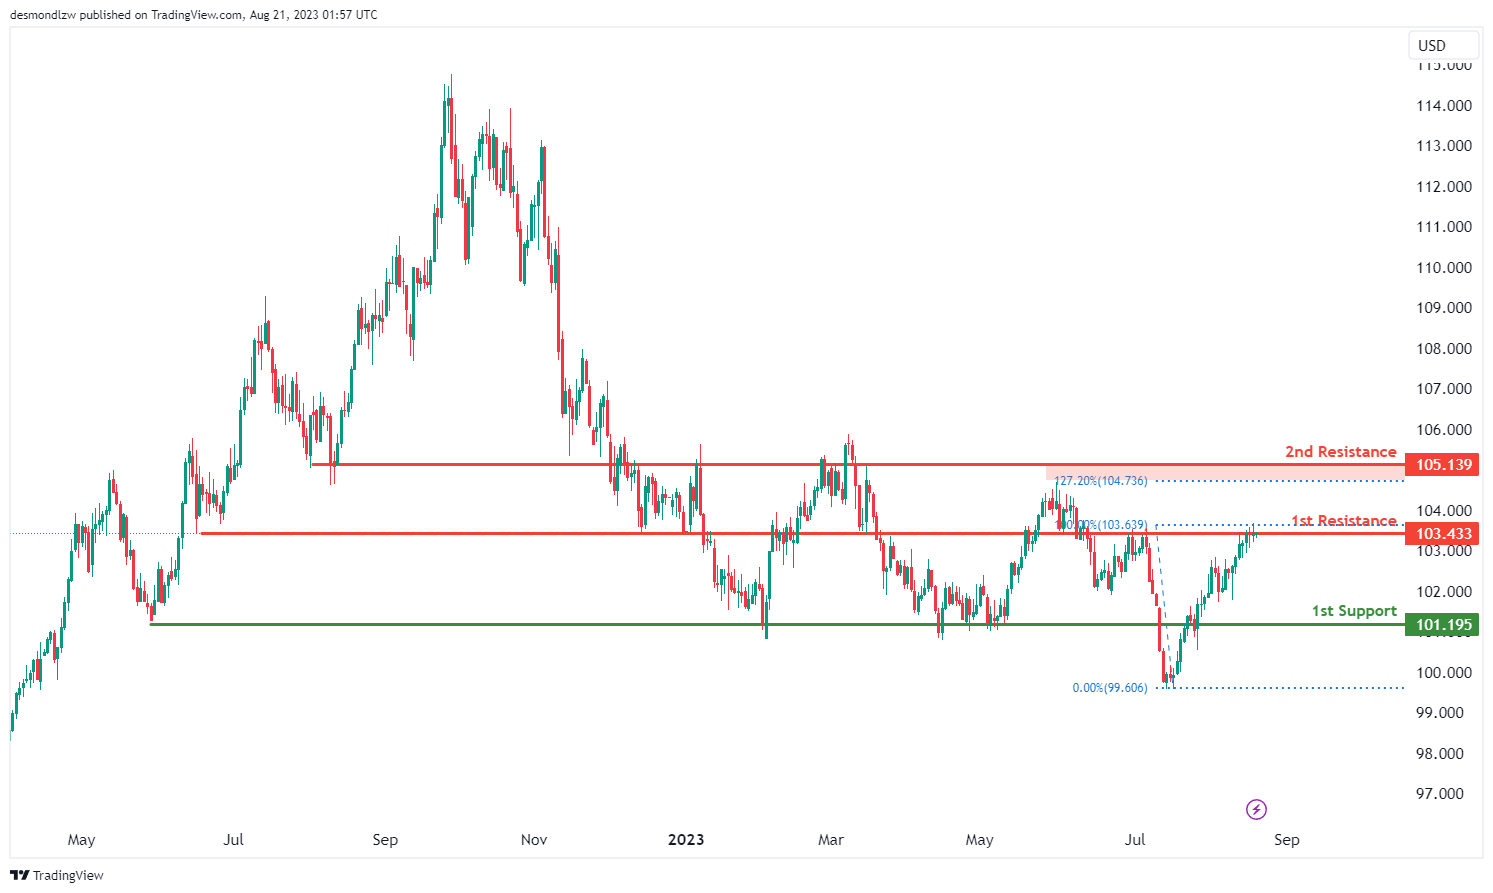
The DXY chart currently displays a bearish momentum, suggesting a prevailing downward trend.
Within this context, there’s a potential scenario where the price could experience a bearish reaction upon reaching the 1st resistance level at 103.43. This level is significant as an overlap resistance, potentially causing a downward movement.
On the support side, the 1st support at 101.19 gains importance due to its classification as an overlap support. It could potentially provide a floor for any potential price decline.
Moreover, the 2nd resistance level at 105.13 is noted as an overlap resistance and is further reinforced by its alignment with a 127.20% Fibonacci Extension, adding to its potential as a resistance level.
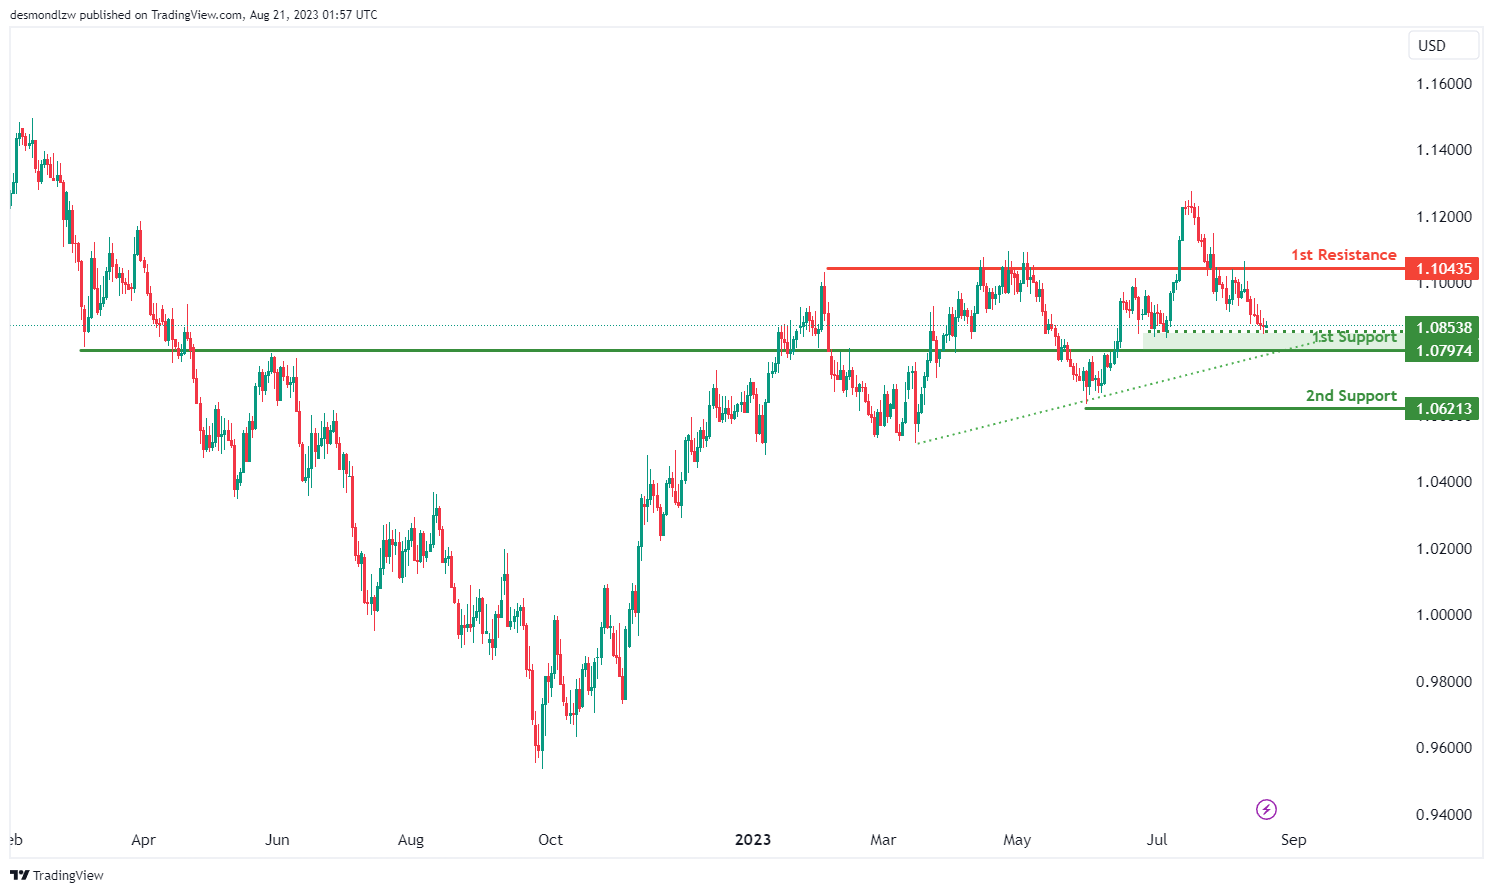
EUR/USD:
The EUR/USD chart is currently exhibiting a bullish momentum, with the presence of a major ascending trend line suggesting the potential for further upward movement.
Within this momentum context, there’s a potential scenario where the price could experience a bullish rebound upon reaching the 1st support level at 1.0797, possibly driving it towards the 1st resistance at 1.1043. The significance of the 1st support at 1.0797 lies in its role as a pullback support, potentially serving as a foundation for a potential price increase. Similarly, the identification of the 2nd support at 1.0621 as a swing low support adds to its significance.
Additionally, the intermediate support level at 1.0853 gains importance due to its classification as a multi-swing low support. This collective analysis contributes to the overall bullish outlook.
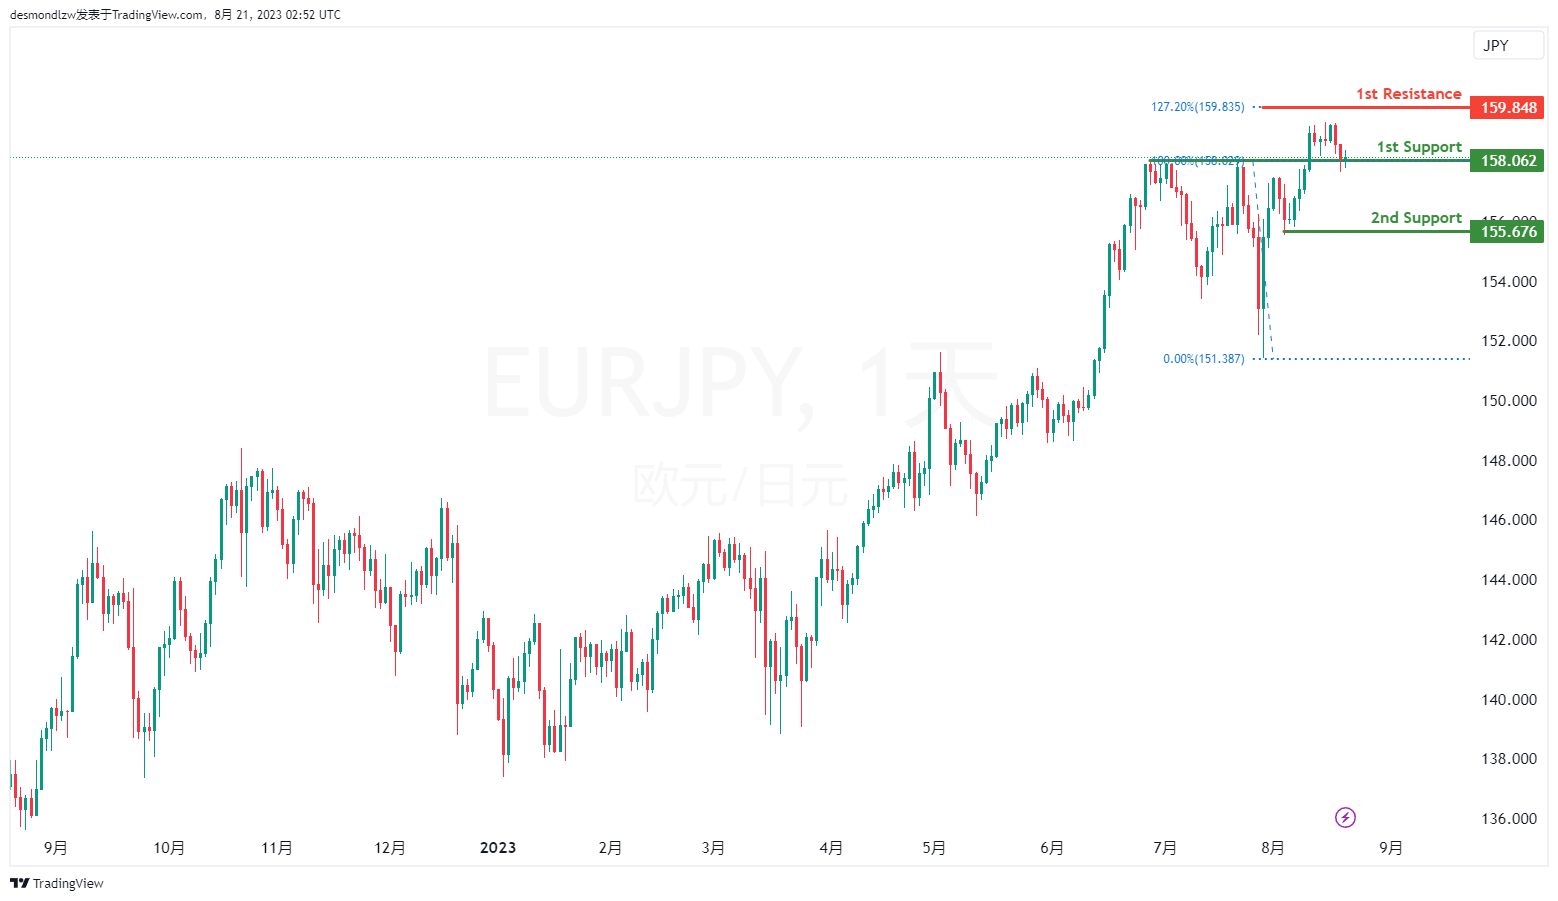
EUR/JPY:
The EUR/JPY chart indicates a bullish overall momentum. There is a potential for a bullish bounce off the 1st support level, leading the price towards the 1st resistance.
The 1st support is located at 158.06 and is considered advantageous due to its pullback support characteristics. Additionally, the 2nd support at 155.67 is seen as valuable because it represents a swing low support.
On the resistance side, the 1st resistance level at 159.84 is significant due to its association with the 127.20% Fibonacci Extension.
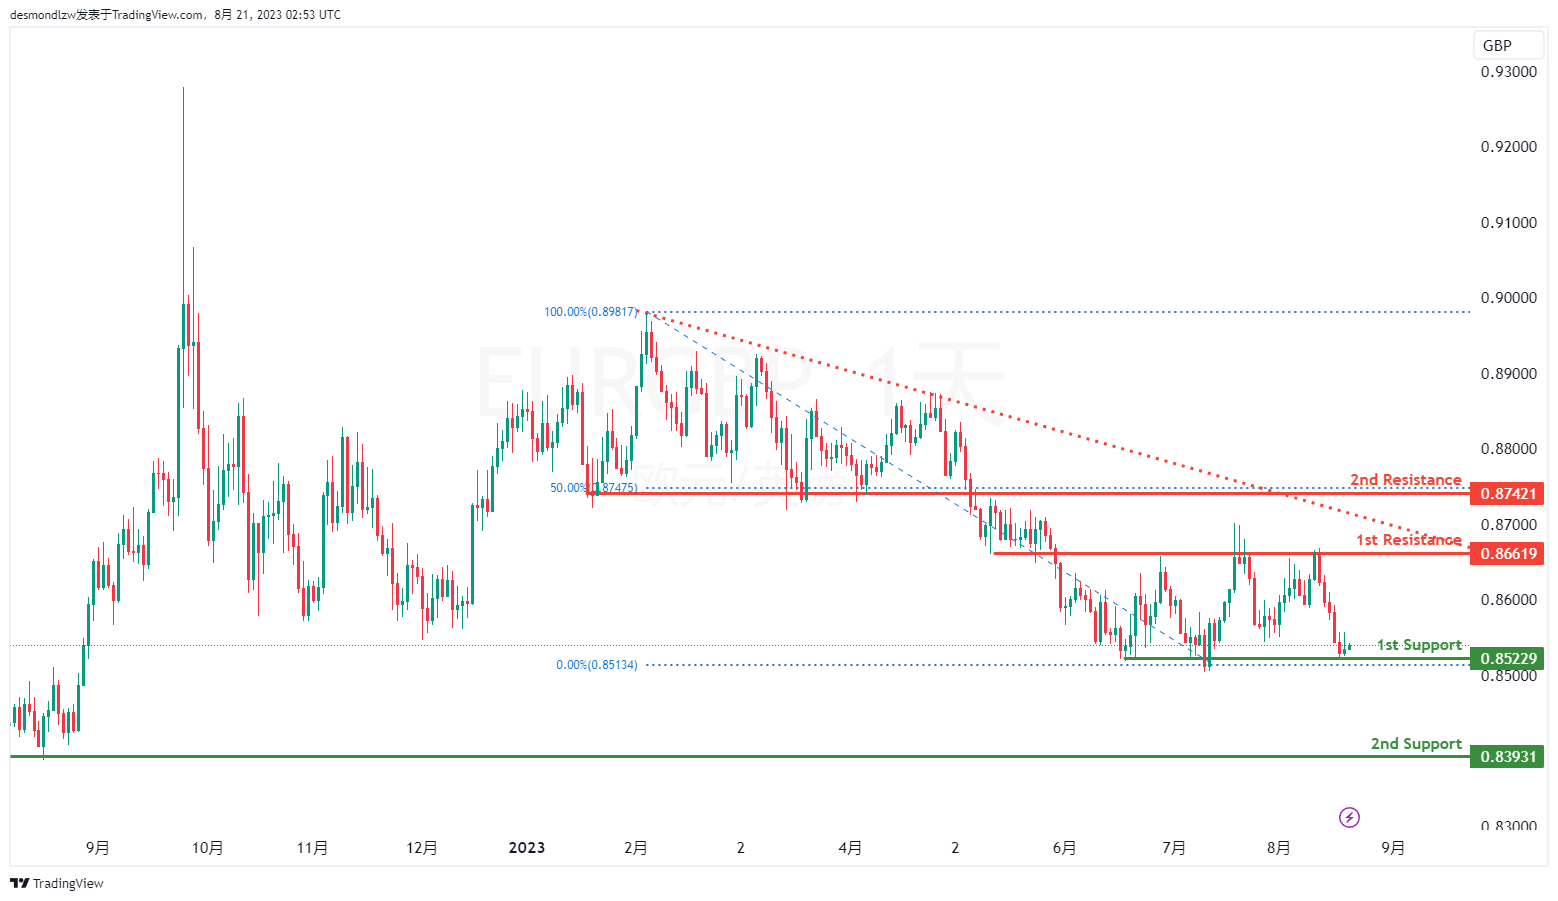
EUR/GBP:
The EUR/GBP chart indicates a bullish overall momentum. There is a potential for a bullish bounce off the 1st support level, leading the price towards the 1st resistance.
The 1st support is positioned at 0.8522 and is considered advantageous due to its multi-swing low support characteristics. Additionally, the 2nd support at 0.8393 is valuable as it represents an overlap support.
On the resistance side, the 1st resistance level at 0.8661 is noteworthy as it represents a pullback resistance. Furthermore, the 2nd resistance at 0.8742 is also significant due to its pullback resistance characteristics, along with its association with the 50% Fibonacci Retracement.
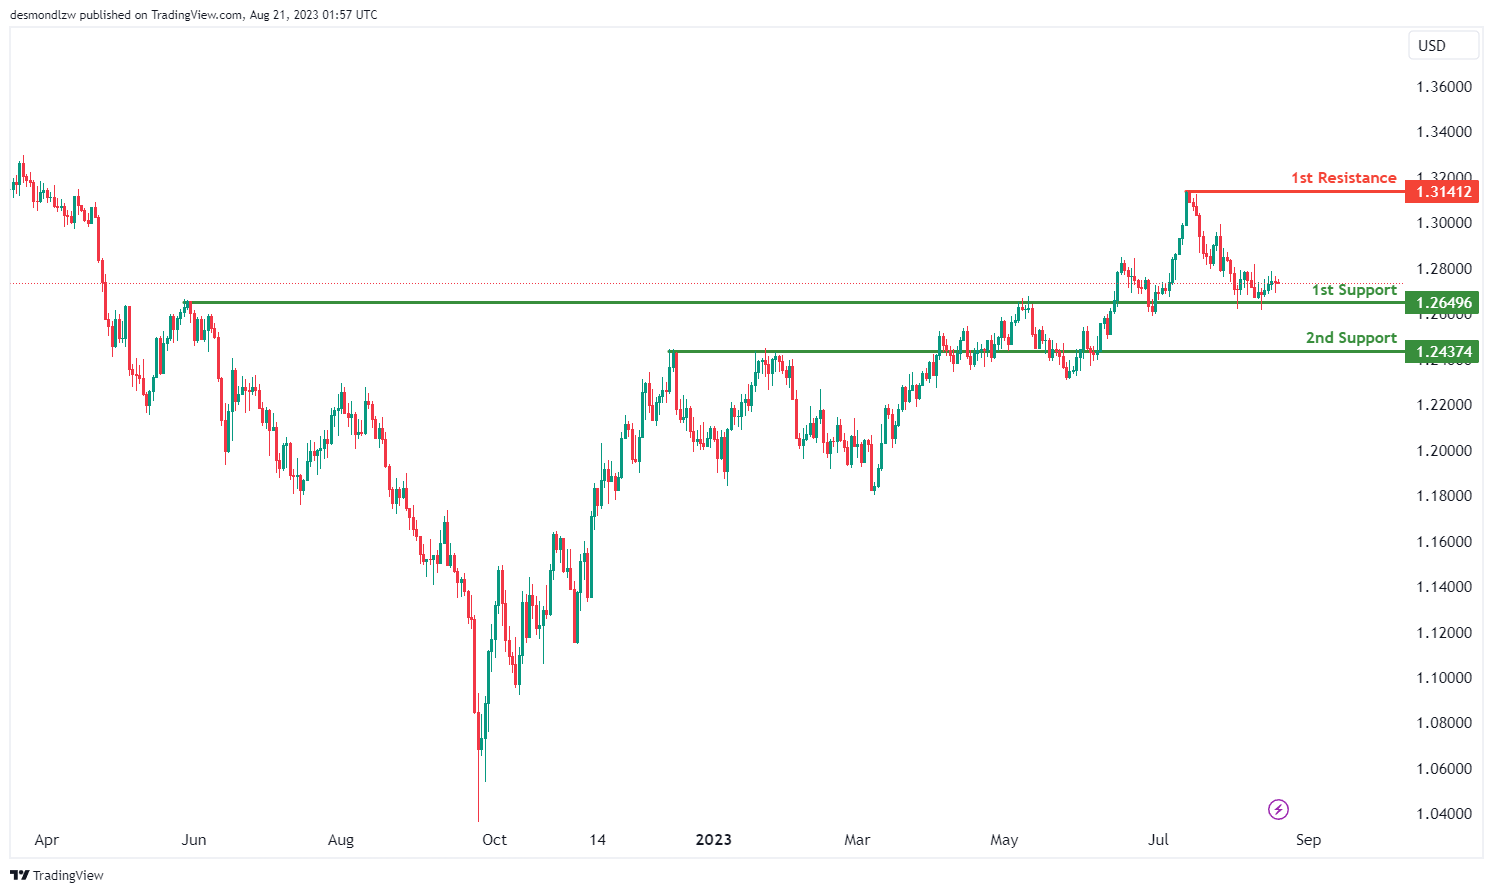
GBP/USD:
The GBP/USD chart currently displays a bullish momentum, indicating a prevalent upward trend.
Within this context, there’s a potential scenario in which the price could experience a bullish rebound upon reaching the 1st support level at 1.2649, potentially leading to an upward movement towards the 1st resistance level at 1.3141. The 1st support at 1.2649 holds significance as an overlap support, possibly providing a foundation for a potential upward price reversal. Similarly, the 2nd support at 1.2437 is noted as an overlap support, reinforcing its role in supporting the price.
On the other hand, the 1st resistance level at 1.3141 is considered a swing high resistance, which could pose a potential obstacle to upward price movement.
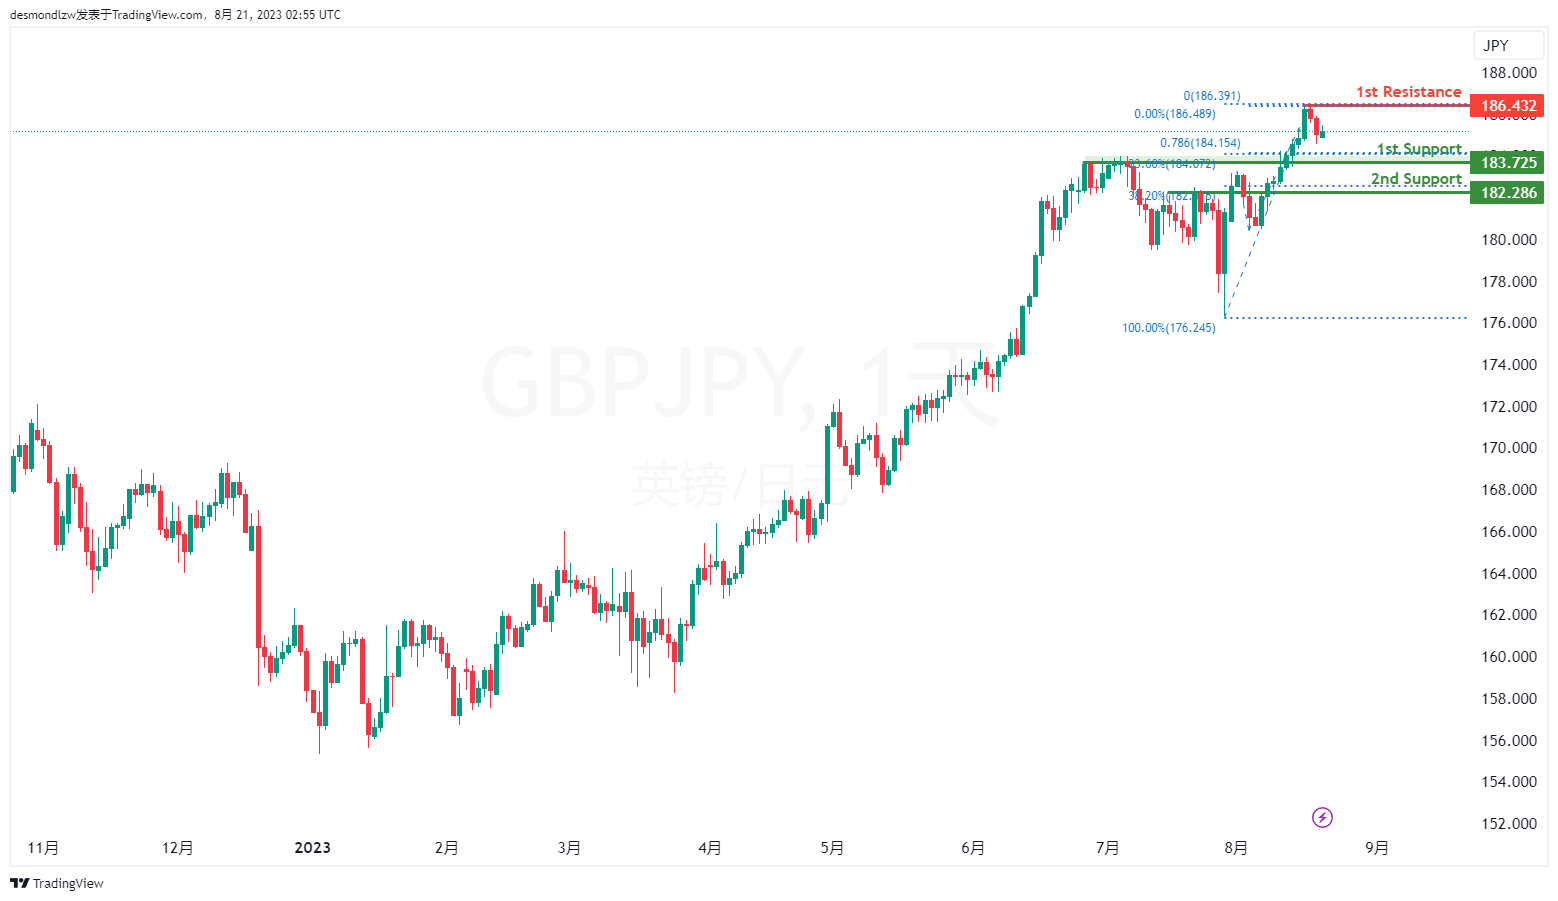
GBP/JPY:
The GBP/JPY chart indicates a bearish overall momentum. There is a potential for a bearish continuation towards the 1st support level.
The 1st support is located at 183.72 and is considered advantageous due to its pullback support characteristics. Additionally, the 1st support exhibits a Fibonacci confluence with a 78.60% Fibonacci Projection and a 23.60% Fibonacci Retracement.
Furthermore, the 2nd support at 182.28 is seen as valuable because it represents an overlap support, along with a 38.20% Fibonacci Retracement.
On the resistance side, the 1st resistance level at 186.43 is noteworthy as it represents a swing high resistance.
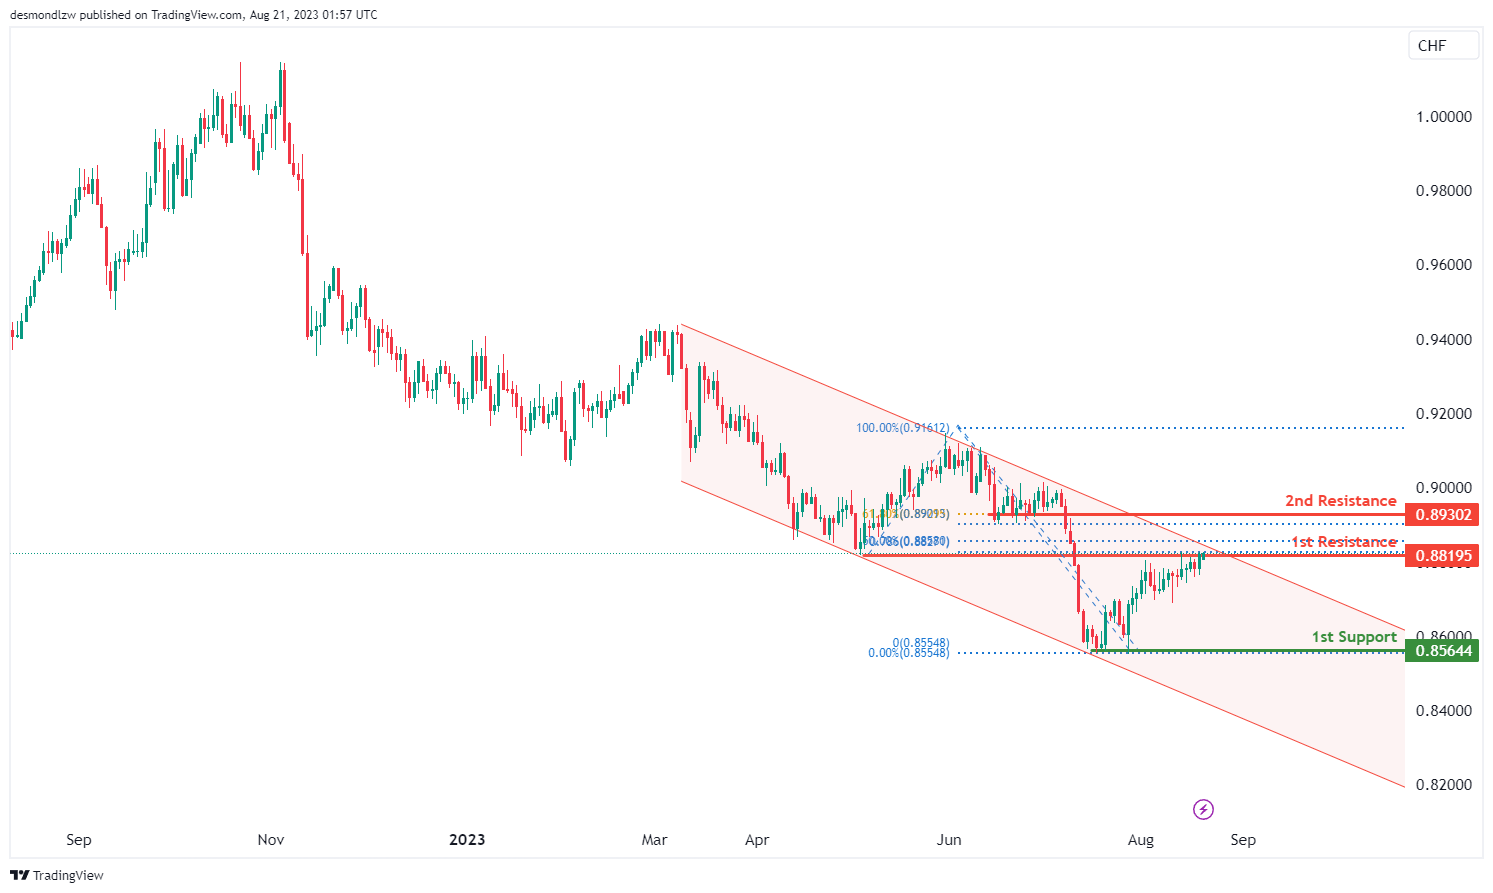
USD/CHF:
The USD/CHF chart’s overall momentum reflects a bearish trend, which is supported by the fact that the price is confined within a descending channel, indicating a persistent downward movement.
Within this context, there is a potential scenario in which the price reacts bearishly upon reaching the 1st resistance level at 0.8819, possibly resulting in a drop towards the 1st support level at 0.8564. The significance of the 1st support lies in its identification as a multi-swing low support, suggesting a potential area where the price might find temporary stability.
Conversely, the 1st resistance level at 0.8819 holds importance as an overlap resistance, potentially acting as a barrier to upward price movement. Further reinforcing potential resistance, the 2nd resistance at 0.8930 is noted as a pullback resistance and aligns with a 61.80% Fibonacci retracement level, which adds to its significance.
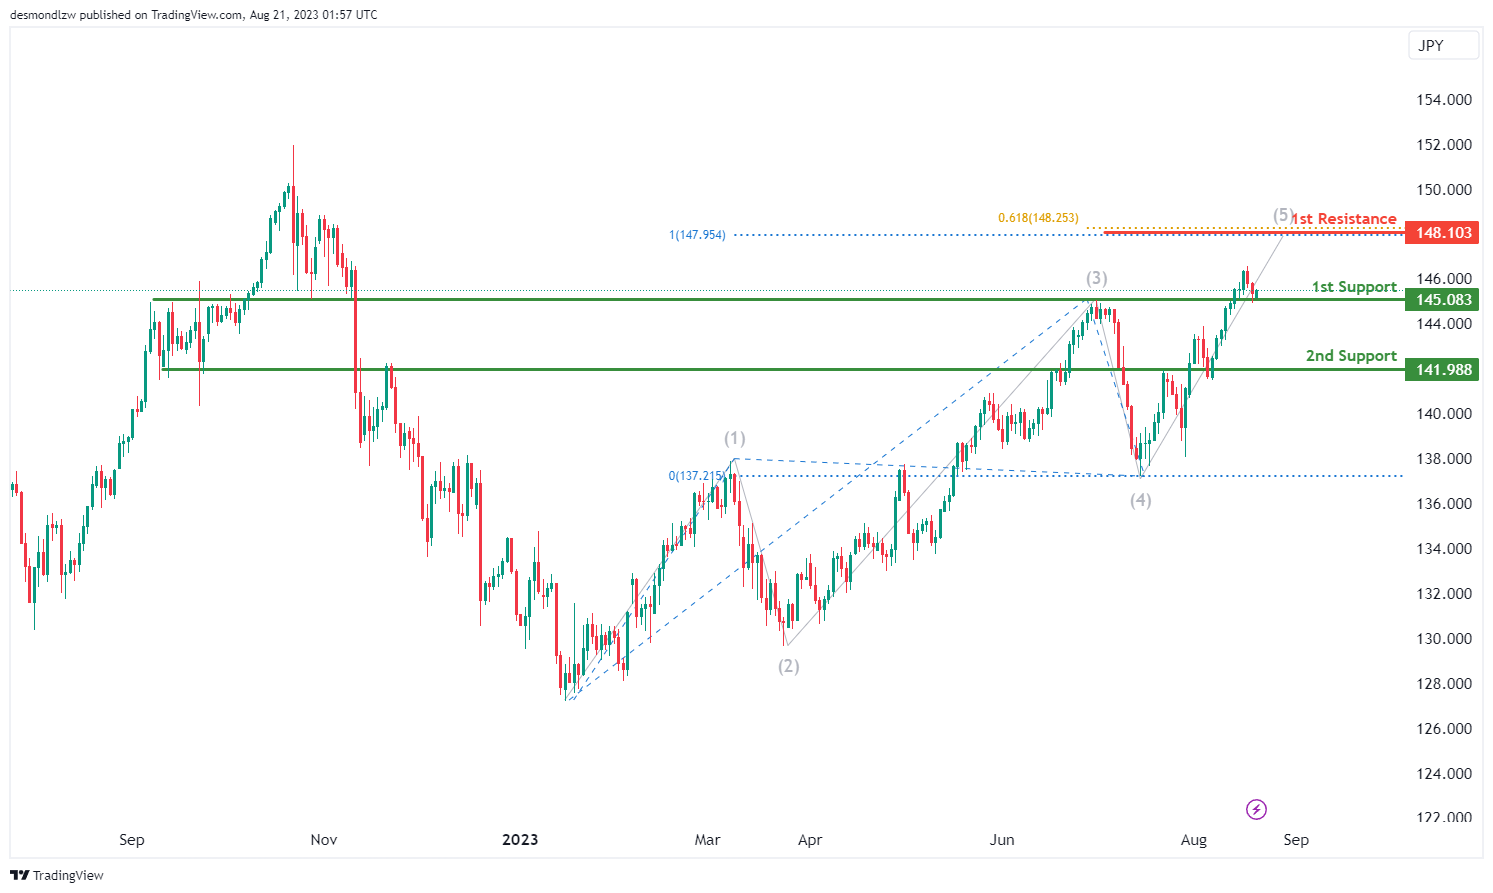
USD/JPY:
The USD/JPY chart currently exhibits a bullish momentum, suggesting a prevailing upward trend.
In light of this momentum, a potential scenario arises in which the price experiences a bullish rebound upon reaching the 1st support level at 145.08, possibly leading to an upward movement towards the 1st resistance at 148.10.
The significance of the 1st support at 145.08 is attributed to its identification as an overlap support, indicating a potential area where buyers might step in to drive the price higher. Additionally, the 2nd support level at 141.98 reinforces the support structure as a pullback support, potentially offering a stronger foundation for the price.
On the other side, the 1st resistance at 148.10 gains importance due to its alignment with both a 61.80% Fibonacci Projection and a 100% Fibonacci Projection. This confluence of Fibonacci levels enhances its potential as a significant resistance level where selling pressure might increase.
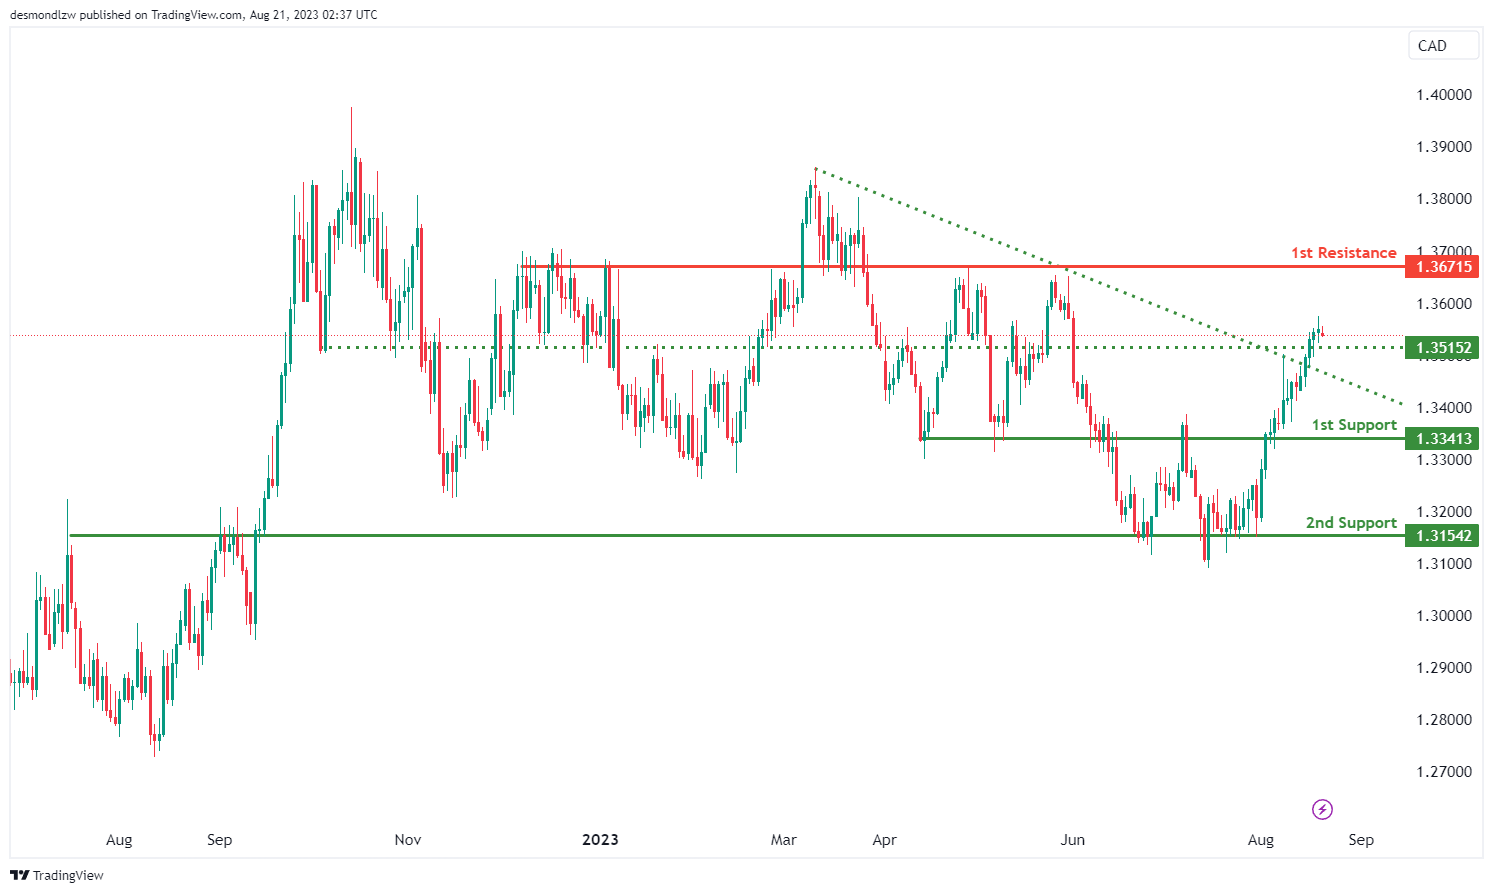
USD/CAD:
The USD/CAD chart currently shows a bullish momentum, indicating a potential upward trend.
Contributing to this momentum is the fact that the price has broken above a descending resistance line, suggesting the potential for a bullish move.
In the context of this bullish momentum, there’s a possibility that the price could continue its upward movement towards the 1st resistance level at 1.3671.
The importance of the 1st support level at 1.3341 is due to its designation as an overlap support. Similarly, the 2nd support at 1.3154 reinforces the support structure as another overlap support.
Additionally, the intermediate support at 1.3515 strengthens the pullback support zone, potentially providing a significant area for price to find support.
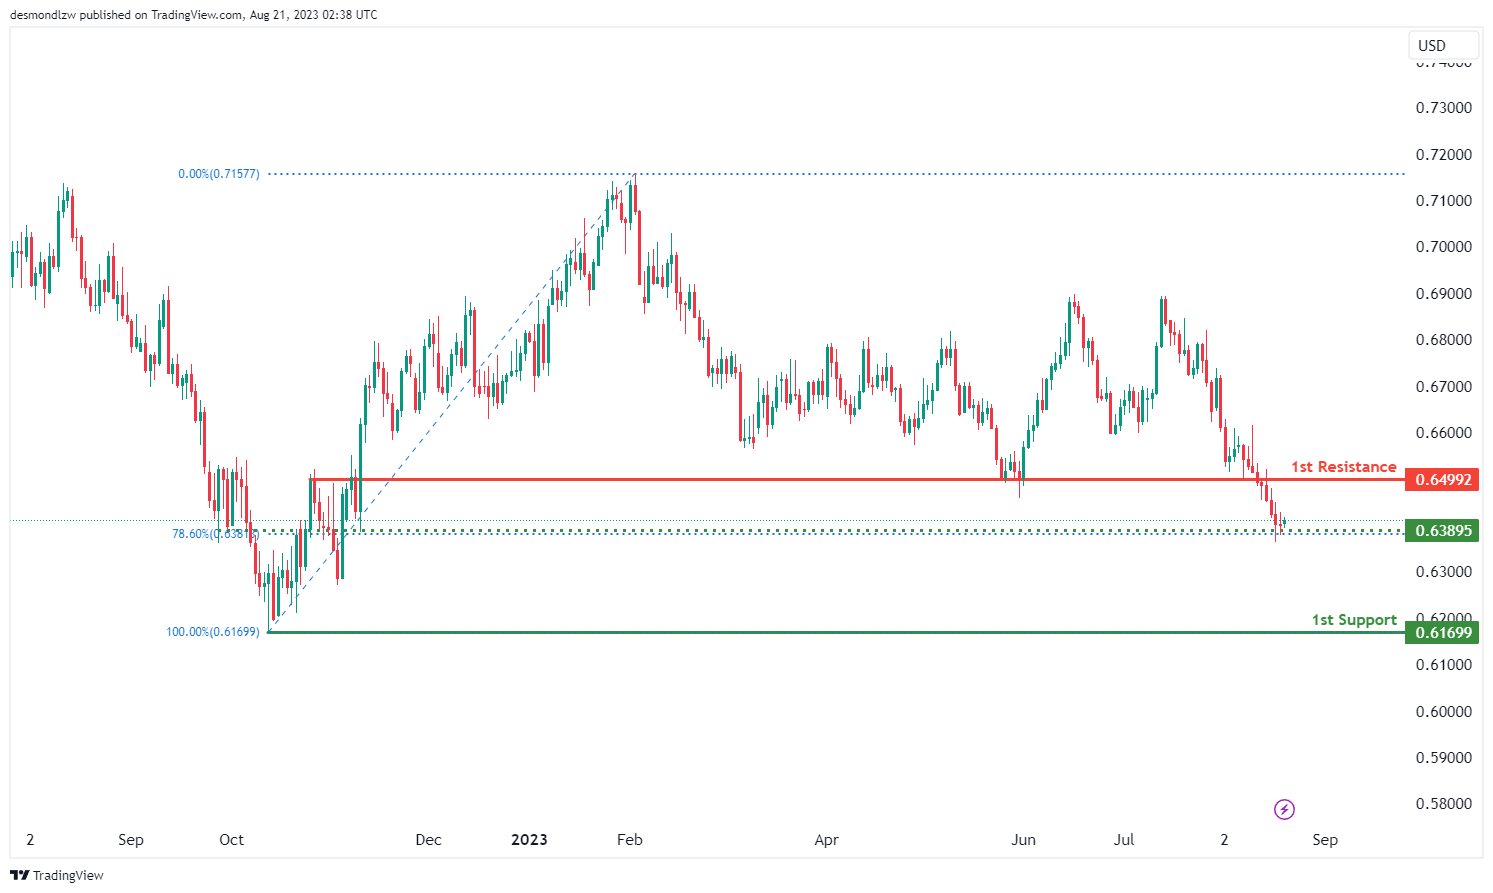
AUD/USD:
The AUD/USD chart is currently displaying a bearish momentum, indicating a potential downward trend.
Considering this bearish momentum, there’s a possibility that the price might continue its downward movement towards the 1st support level at 0.6169, which is bolstered by its role as a swing low support.
Furthermore, the intermediate support at 0.6389 adds to the support structure, as it aligns with a pullback support level and the 78.60% Fibonacci Retracement.
On the resistance side, the 1st resistance level at 0.6499 is significant due to its categorization as a pullback resistance.
These technical aspects help to provide insight into the potential price movement dynamics of the AUD/USD chart, highlighting key support and resistance levels.
NZD/USD
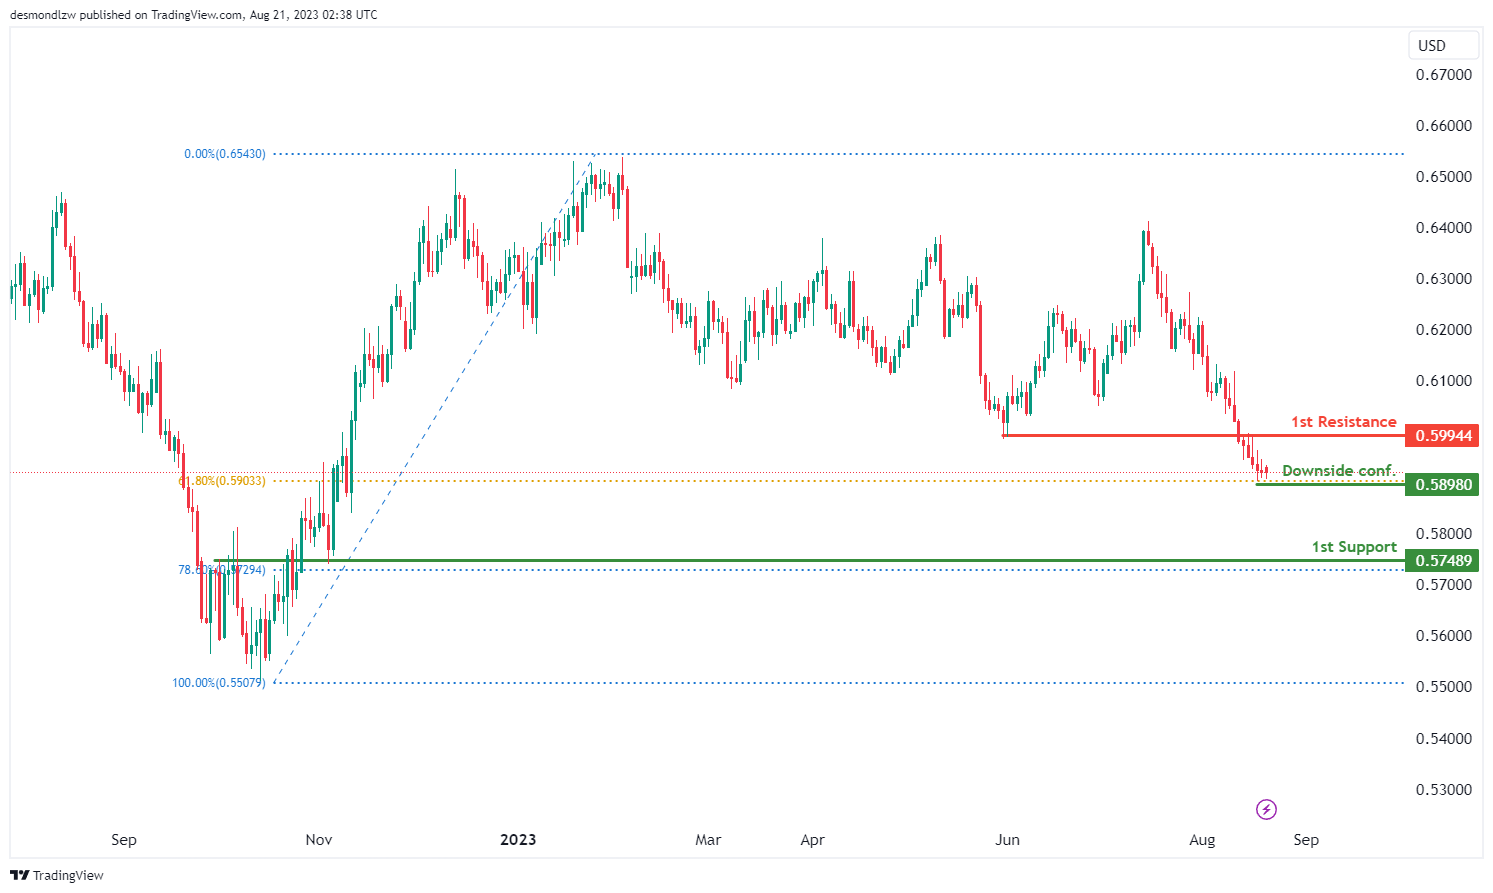
The NZD/USD chart currently displays a bearish momentum, indicating a prevailing downward trend in the market.
Considering this bearish momentum, there’s a potential scenario in which the price continues its downward movement towards the 1st support level at 0.5748. This level gains significance as a swing low support, indicating a possible area of price consolidation or reversal.
Additionally, the intermediate support at 0.5898 that aligns with the 61.8% Fibonacci retracement reinforces the potential support structure by aligning with a swing low support as well. Waiting for downside confirmation if the body closes below this level could provide further insight.
On the resistance side, the 1st resistance level at 0.5994 is notable due to its classification as an overlap resistance.
DJ30:
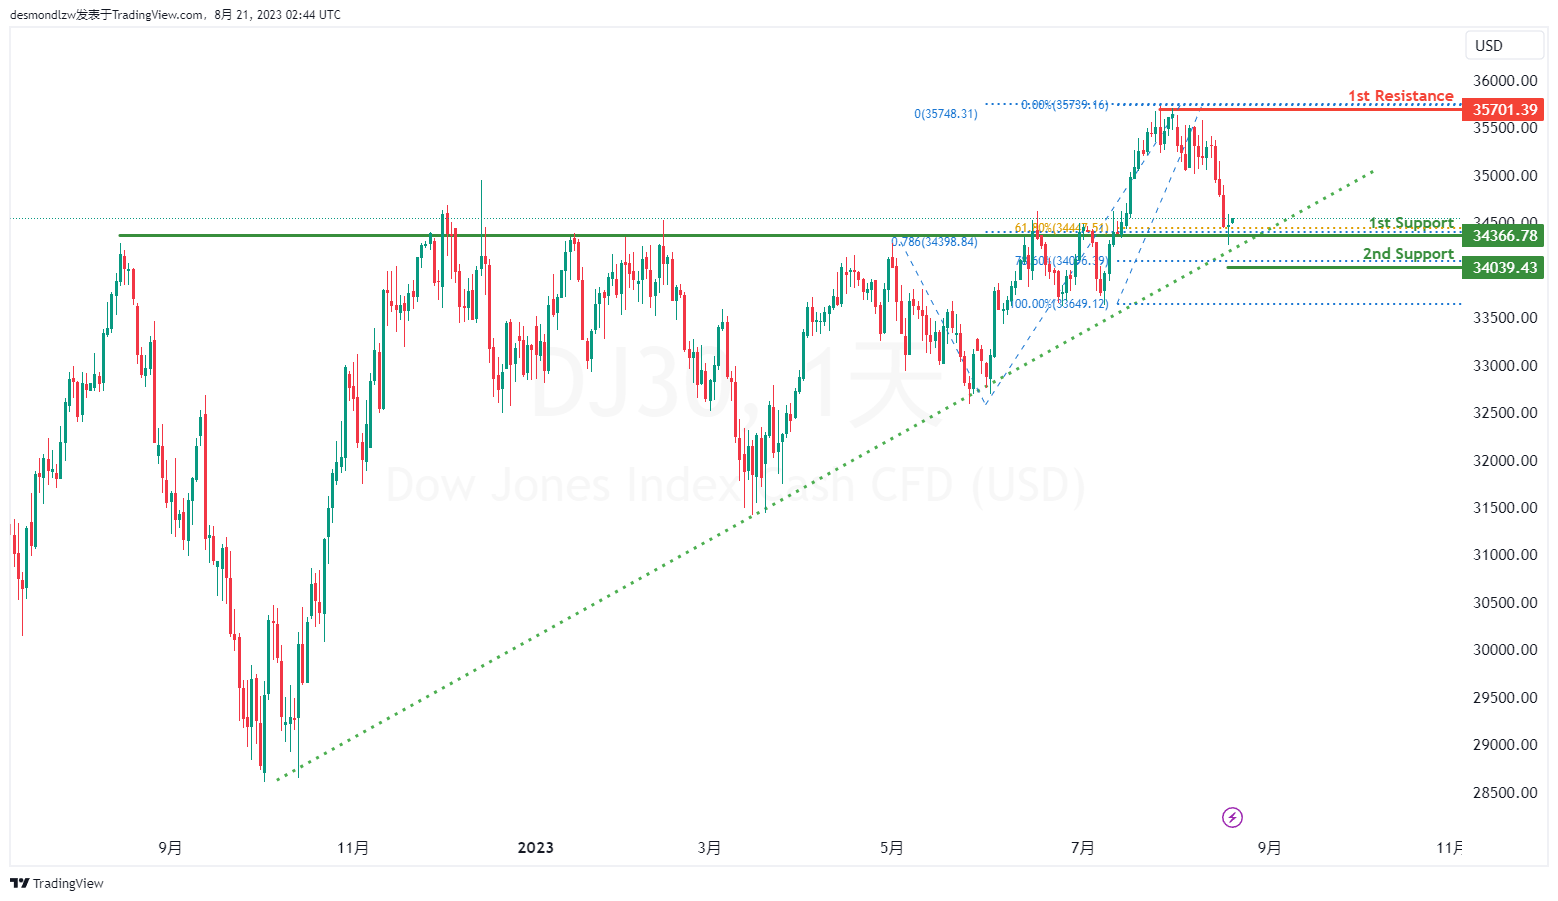
The DJ30 chart indicates a bullish overall momentum, and this is further supported by the fact that the price is above a major ascending trend line, which suggests the potential for further bullish momentum. There is a possibility for a bullish bounce off the 1st support level, leading the price towards the 1st resistance.
The 1st support is located at 34366.78 and is considered advantageous due to its overlap support characteristics, along with a Fibonacci confluence of a 61.80% Fibonacci Retracement and a 78.60% Fibonacci Projection. Additionally, the 2nd support at 34039.43 is also seen as valuable due to its association with a 78.60% Fibonacci Retracement.
On the resistance side, the 1st resistance level at 35701.39 is noteworthy as it represents a swing high resistance.
GER30:
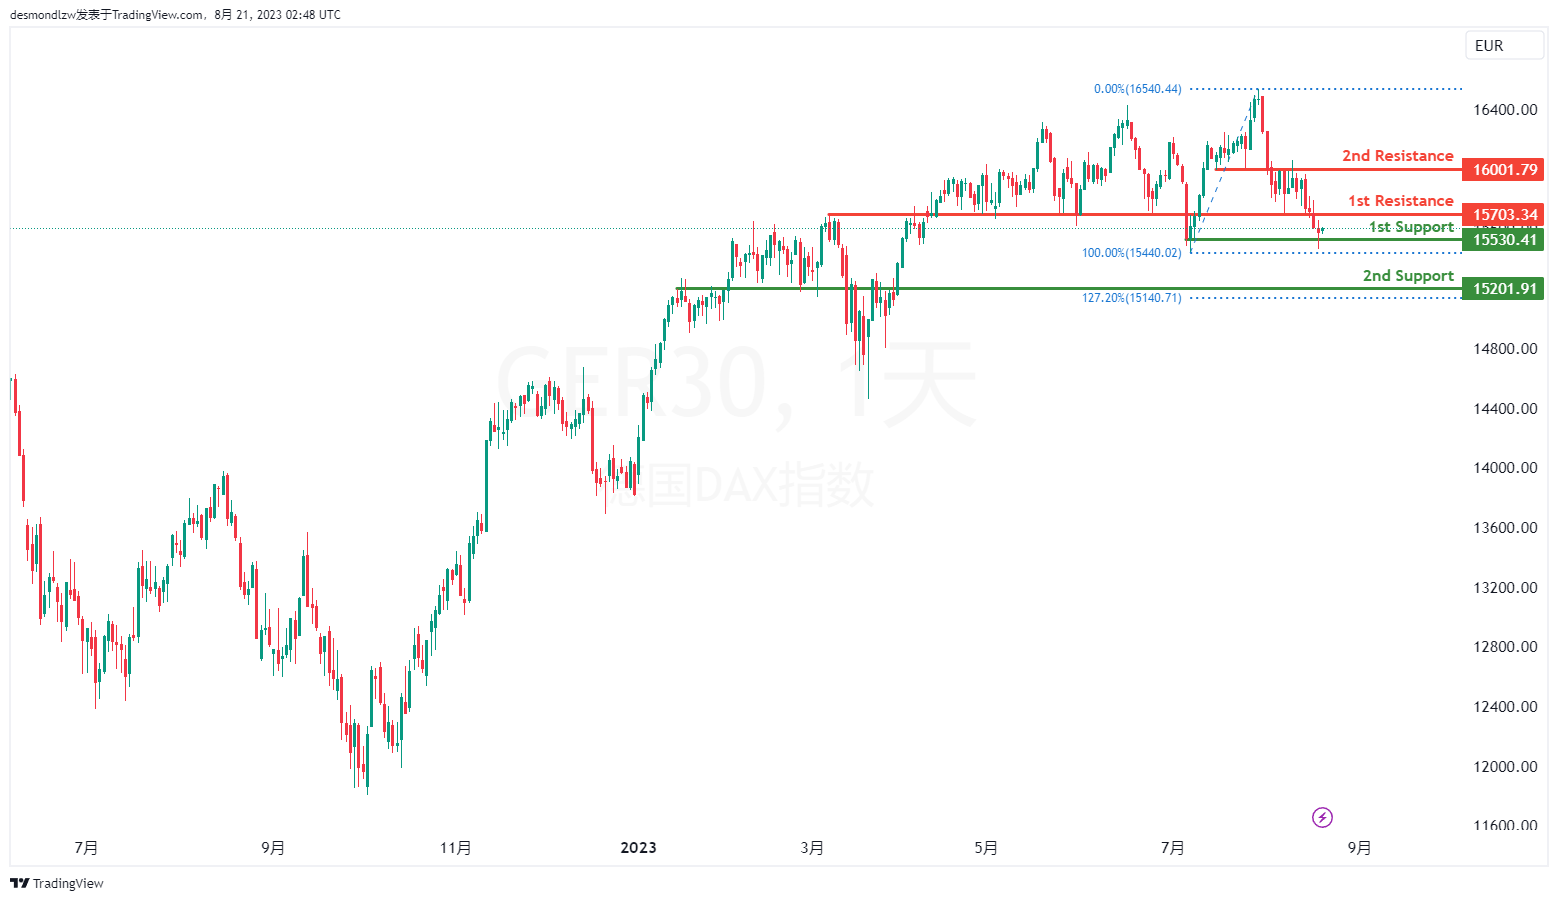
The GER30 chart indicates a bullish overall momentum. There is a potential for a bullish bounce off the 1st support level, leading the price towards the 1st resistance.
The 1st support is situated at 15530.41 and is considered advantageous due to its swing low support characteristics. Furthermore, the 2nd support at 15201.91 is also seen as valuable because it represents an overlap support.
On the resistance side, the 1st resistance level at 15703.34 is noteworthy as it represents an overlap resistance. Additionally, the 2nd resistance at 16001.79 is also significant due to its pullback resistance characteristics.
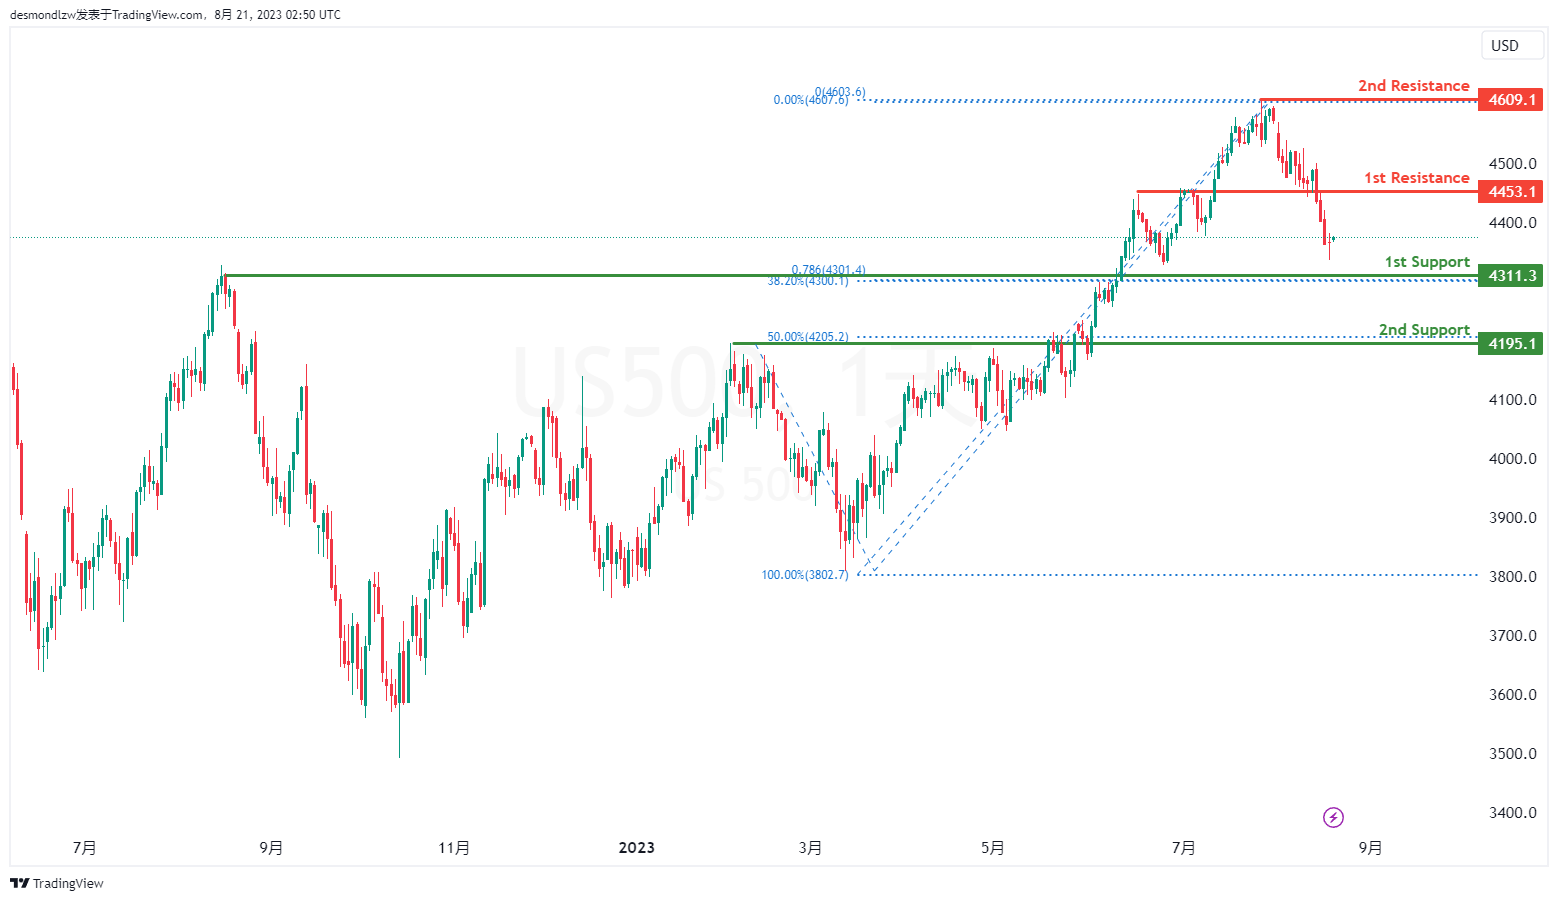
US500
The US500 chart indicates a bearish overall momentum. There is a potential for a bearish continuation towards the 1st support level.
The 1st support is positioned at 4311.30 and is considered advantageous due to its pullback support characteristics. Furthermore, the 1st support exhibits a Fibonacci confluence with a 78.60% Fibonacci Projection and a 38.20% Fibonacci Retracement.
Additionally, the 2nd support at 4195.10 is also seen as valuable due to its pullback support attributes, as well as its association with a 50% Fibonacci Retracement.
On the resistance side, the 1st resistance level at 4453.10 is noteworthy as it represents an overlap resistance. Furthermore, the 2nd resistance at 4609.10 is significant due to its swing high resistance characteristics.
BTC/USD:
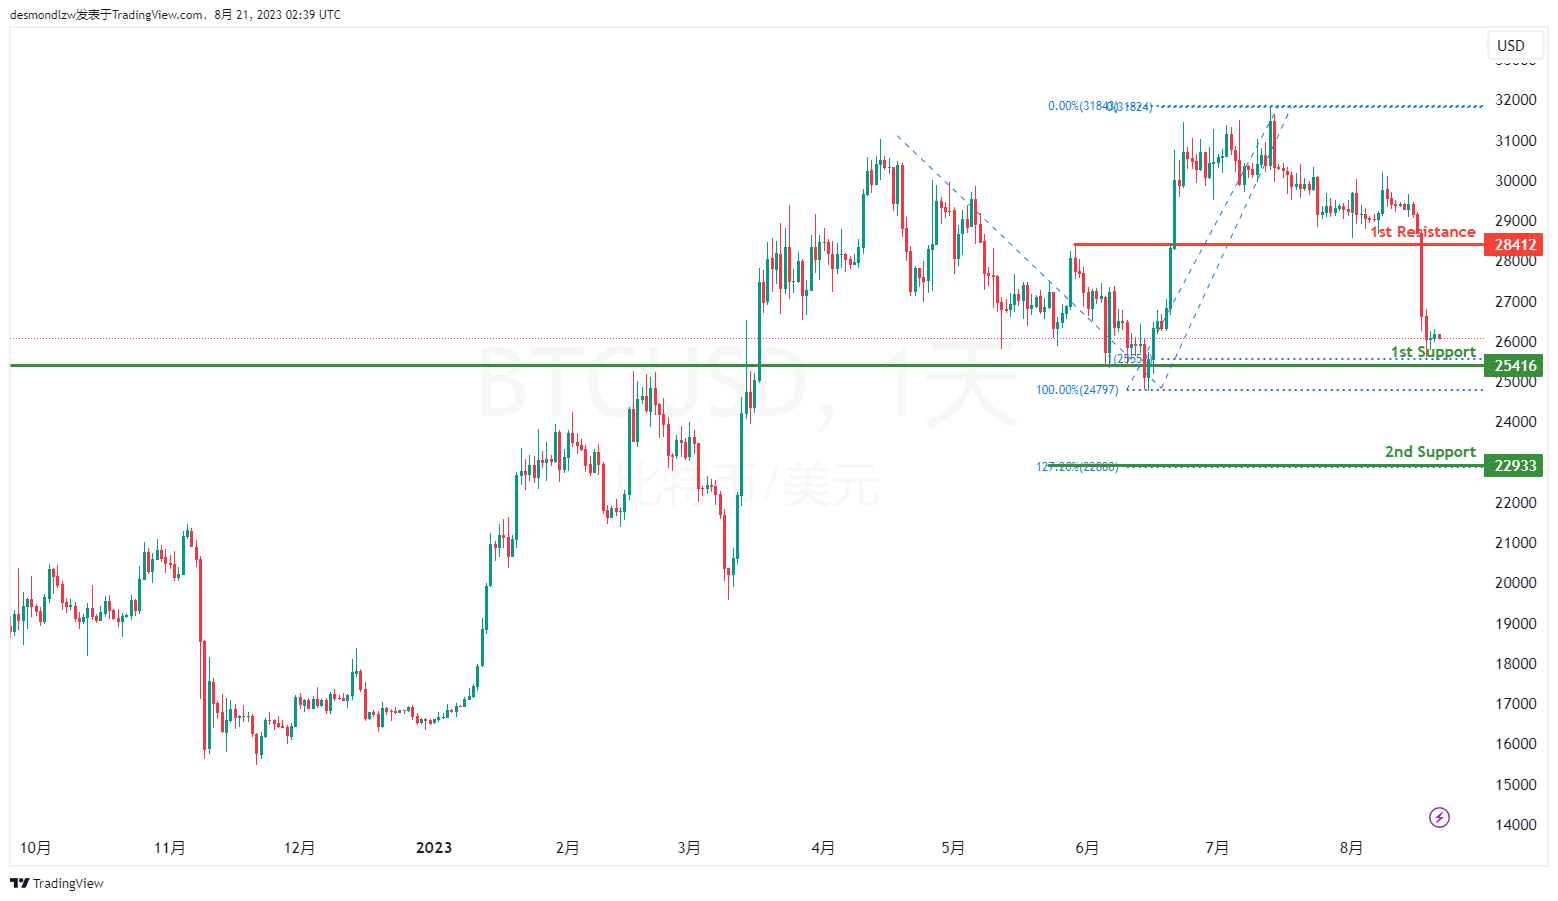
The BTC/USD chart indicates a bearish overall momentum. There is a potential for a bearish continuation towards the 1st support level.
The 1st support is located at 25416 and is considered advantageous due to its overlap support characteristics along with a 100% Fibonacci Projection. Furthermore, the 2nd support at 22933 is also seen as significant due to its association with the 127.20% Fibonacci Extension.
On the resistance side, the 1st resistance level at 28412 is noteworthy as it represents an overlap resistance.
ETH/USD:
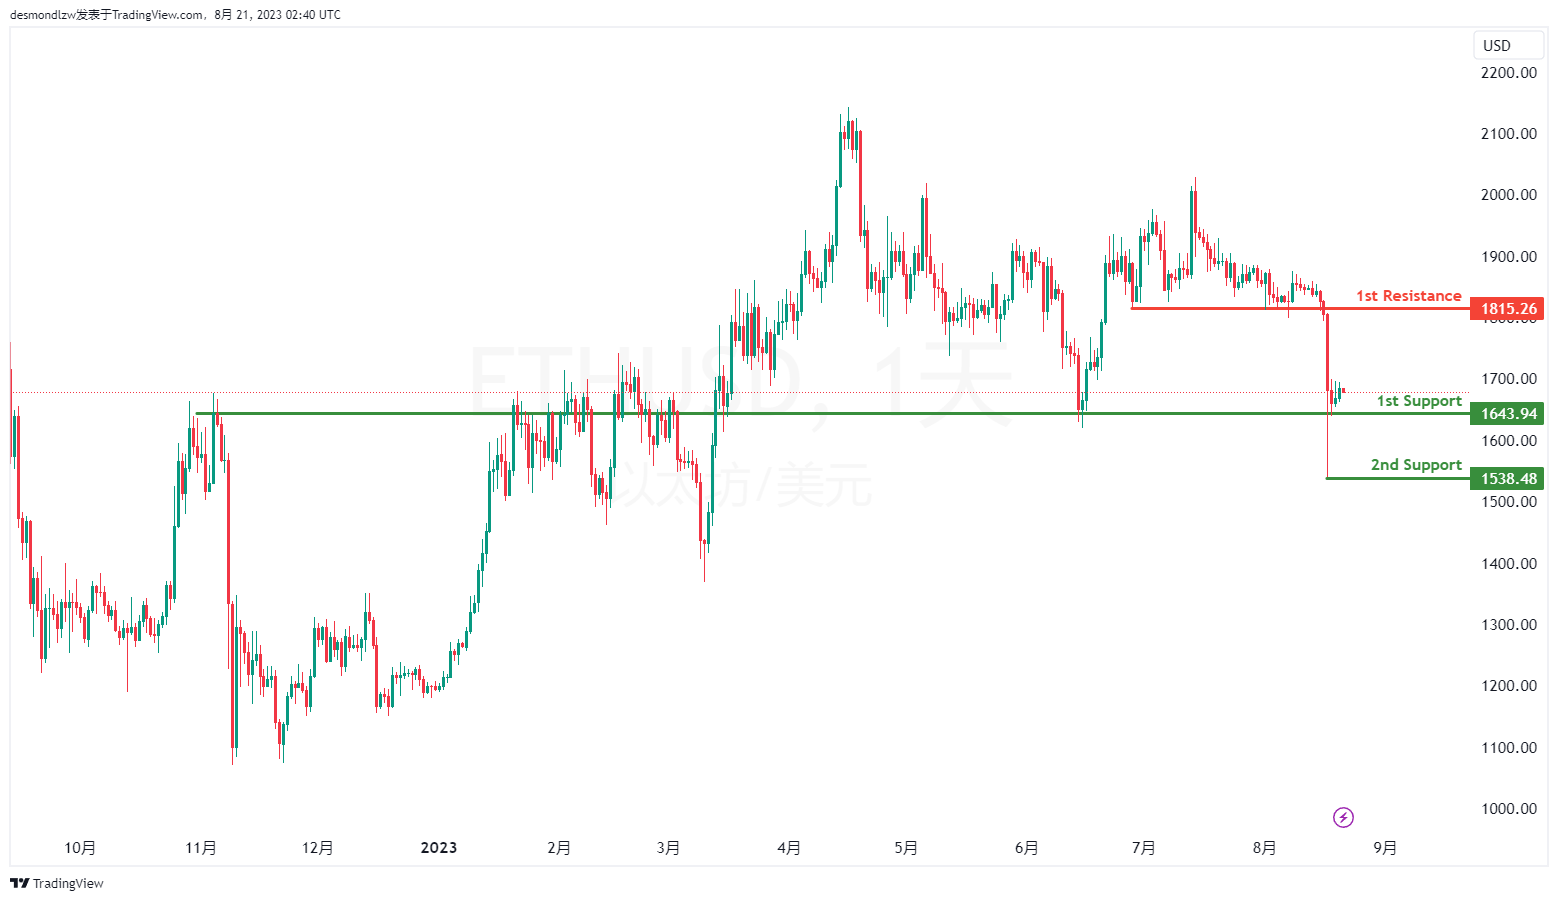
The ETH/USD chart indicates a bearish overall momentum. There is a potential for a bearish continuation towards the 1st support level.
The 1st support is positioned at 1643.94 and is considered advantageous due to its overlap support characteristics. Additionally, the 2nd support at 1538.48 is viewed as valuable because it represents a swing low support.
On the resistance side, the 1st resistance level at 1822.21 is noteworthy as it represents a pullback resistance, along with a 61.80% Fibonacci Retracement.
WTI/USD:
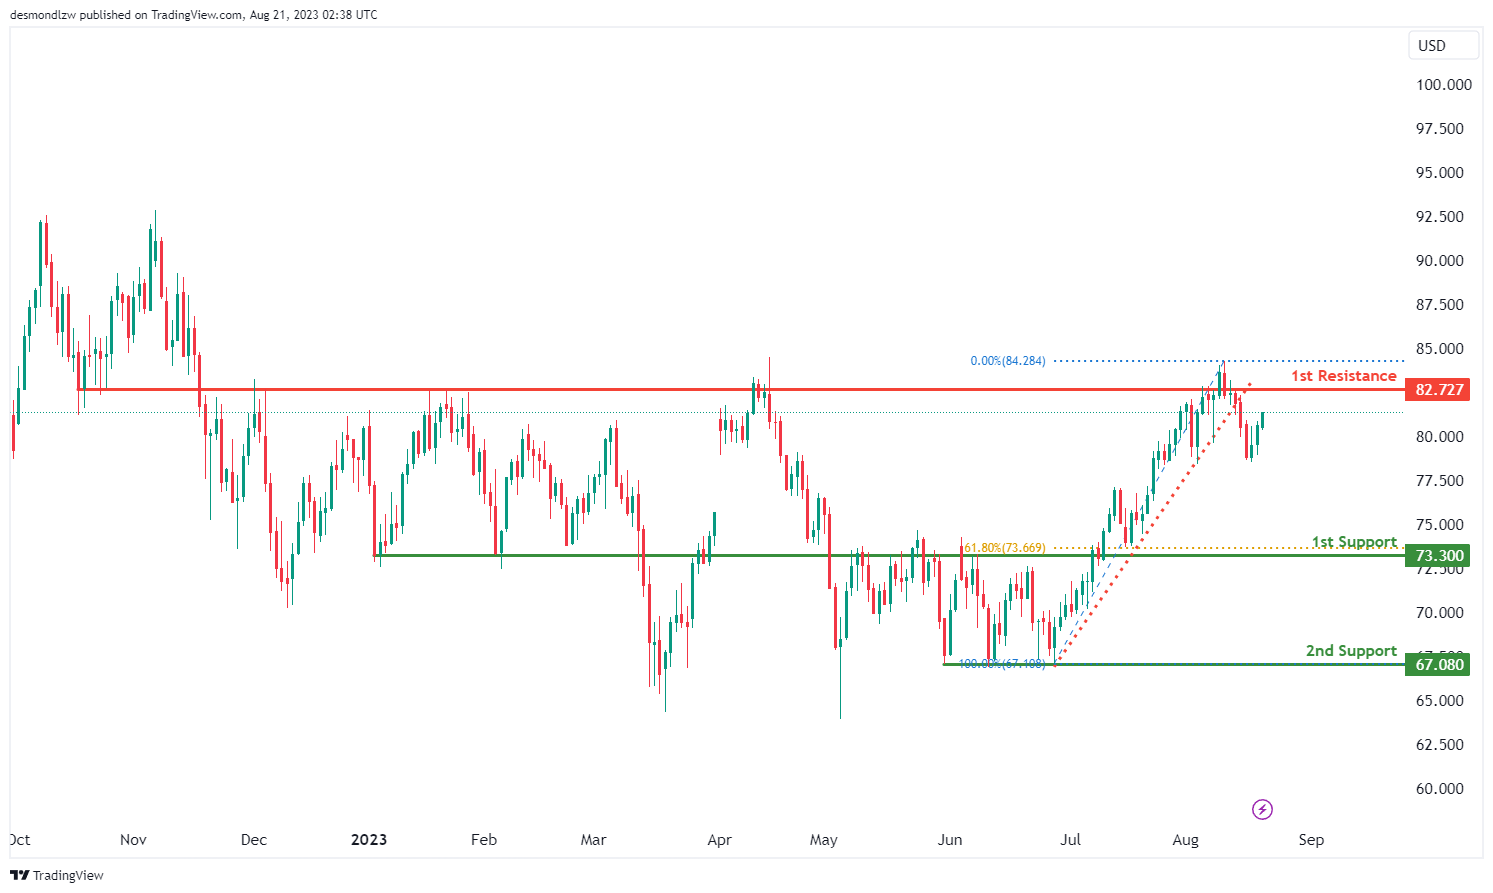
The WTI/USD chart currently exhibits a bullish momentum, indicating a prevailing upward trend in the market.
Considering this bullish momentum, there’s a possibility that the price might experience a continuation of its upward movement towards the 1st resistance level at 82.73. This level gains significance as an overlap resistance, suggesting a potential area where the price could face resistance.
On the support side, the 1st support level at 73.30 is notable due to its identification as an overlap support that aligns with the 61.80% Fibonacci retracement level. Additionally, the 2nd support level at 67.08 is reinforced by its association with multiple swing-lows, enhancing its support potential.
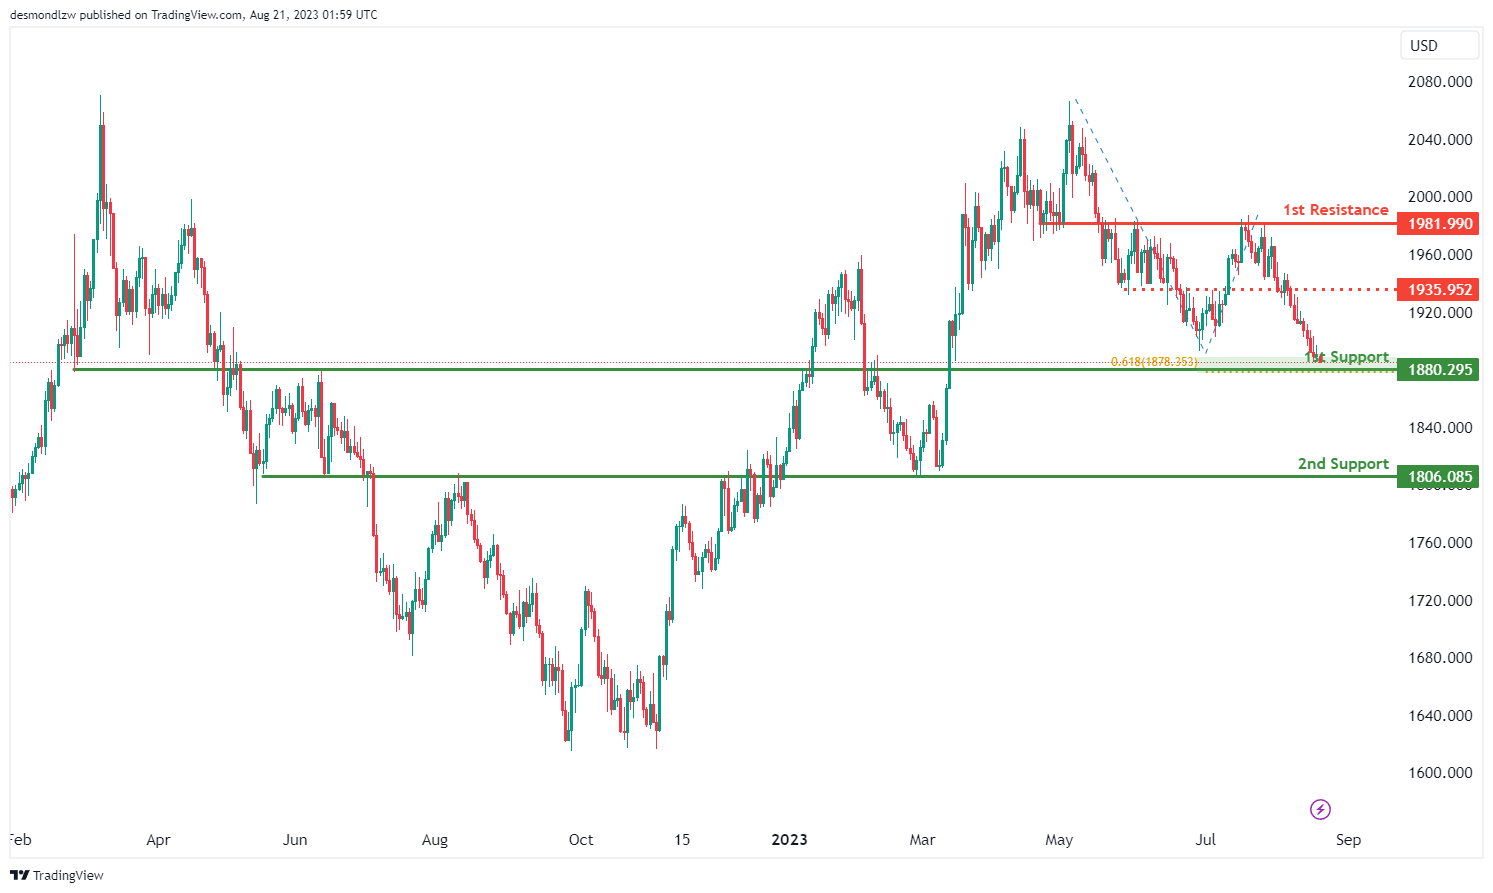
XAU/USD (GOLD):
The XAU/USD chart currently indicates a bullish momentum, signifying a prevailing upward trend.
Within this momentum context, there’s a potential scenario where the price undergoes a bullish rebound upon reaching the 1st support level at 1880.29. This rebound might drive the price towards the 1st resistance at 1981.99.
The significance of the 1st support at 1880.29 lies in its identification as a pullback support, further reinforced by its alignment with a 61.80% Fibonacci Projection. Additionally, the 2nd support level at 1806.08 adds to the support structure as an overlap support, potentially providing a strong base for price movements.
Conversely, the 1st resistance level at 1981.99 is notable due to its designation as an overlap resistance, suggesting a potential area where selling interest might arise. Similarly, the 2nd resistance at 1935.95 strengthens the resistance zone as another overlap resistance.
China cuts 1-yr LPR moderately, keeps 5 yr LPR unchanged
In a somewhat anticipated move, China's PBoC made a cut to its one-year loan prime rate by 10bps, settling it at 3.45%. This is a slight deviation from the 15bps reduction that the majority of economists had forecasted. What stands out is that this marks the second reduction in this rate in just a span of three months.
However, eyebrows were raised when PBOC decided to keep its five-year LPR — the benchmark for most mortgages in the country — steady at 4.2%. This move defied expectations of a 15 bps cut by many market watchers. The unaltered five-year LPR is being read by many as a signal of Chinese banks' hesitancy to compromise their rate differential margin. Such reluctance throws into sharp relief potential concerns about the effective transmission of PBOC's policy decisions into the broader market landscape.
Furthermore, it stirs up conversations about the central bank's capability to invigorate the property sector and the broader economy through monetary easing strategies. This narrative is all the more potent given that this decision on the one-year LPR came on the heels of an unexpected reduction in PBOC's medium-term policy rate just a week earlier. To give specifics, PBOC had reduced the one-year medium-term lending facility rate by 15 basis points, bringing it down to 2.50% from its previous 2.65%.
Considering these rate adjustments, many financial experts are now projecting more proactive measures from the PBOC in the forthcoming months. This may encompass further rate trims as well as potential reductions in the reserve requirement ratio for banks.