

Sample Category Title
EUR/JPY Weekly Outlook
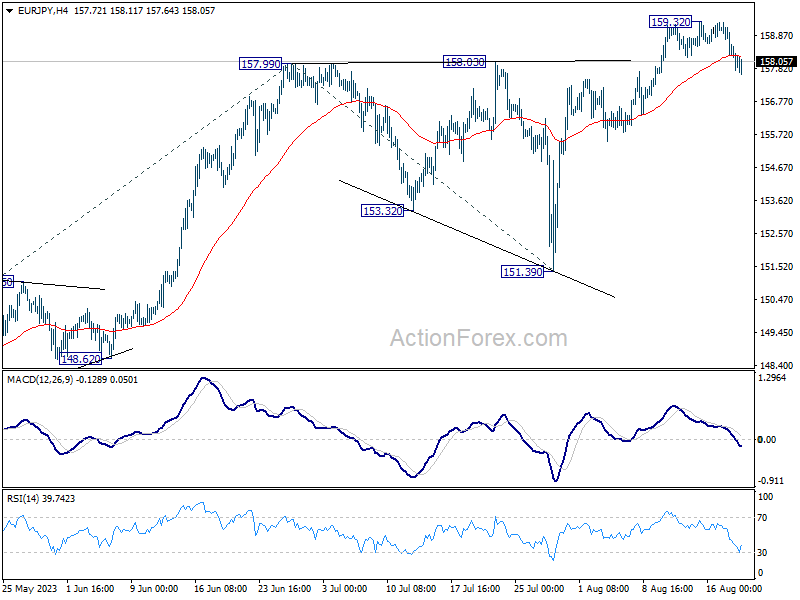
EUR/JPY edged higher to 159.32 last week but retreated since then. Initial bias is mildly on the downside this week for pull back towards 55 D EMA (now at 155.31). On the upside, though, break of 159.32 will resume larger up trend to 61.8% projection of 139.05 to 157.99 from 151.39 at 163.09 next.
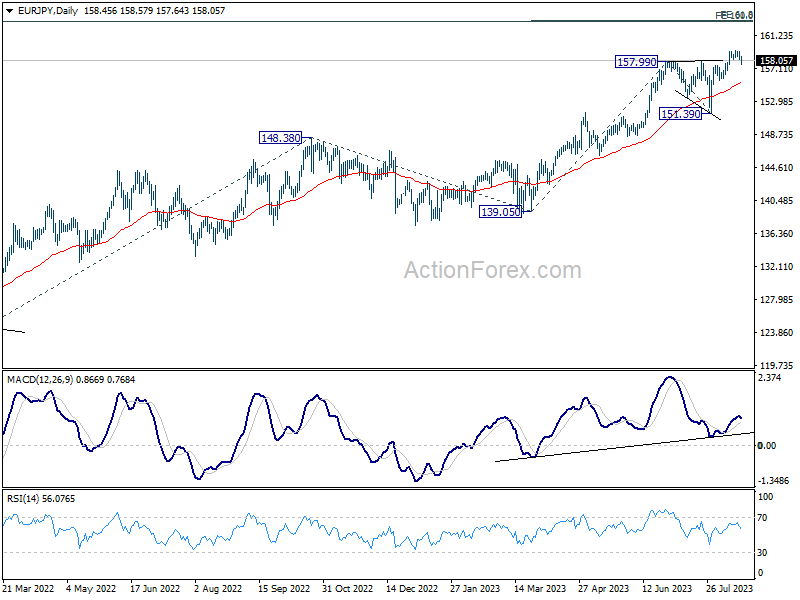
In the bigger picture, rise from 114.42 (2020 low) is in progress. Next target is 100% projection of 124.37 to 148.38 from 139.05 at 163.06. Sustained break there will pave the way to retest long term resistance at 169.96. This will now remain the favored case as long as 151.39 support holds, even in case of deep pull back.
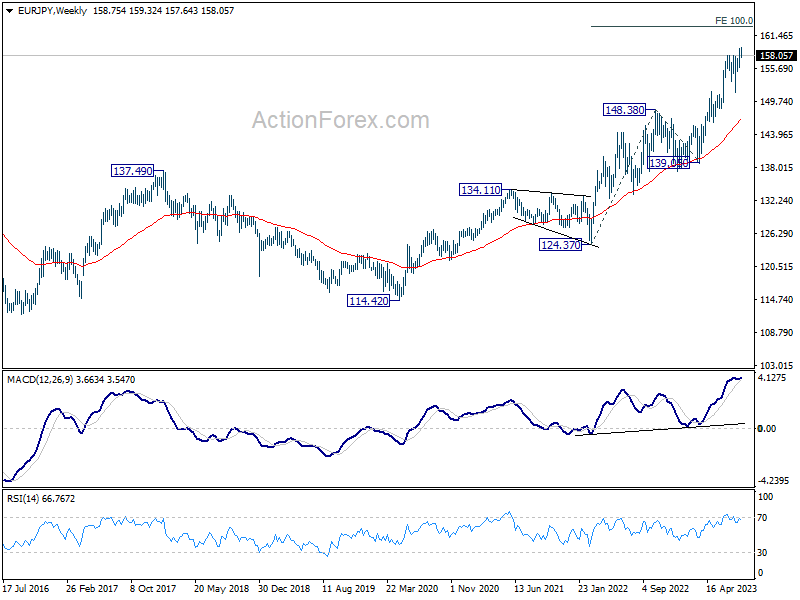
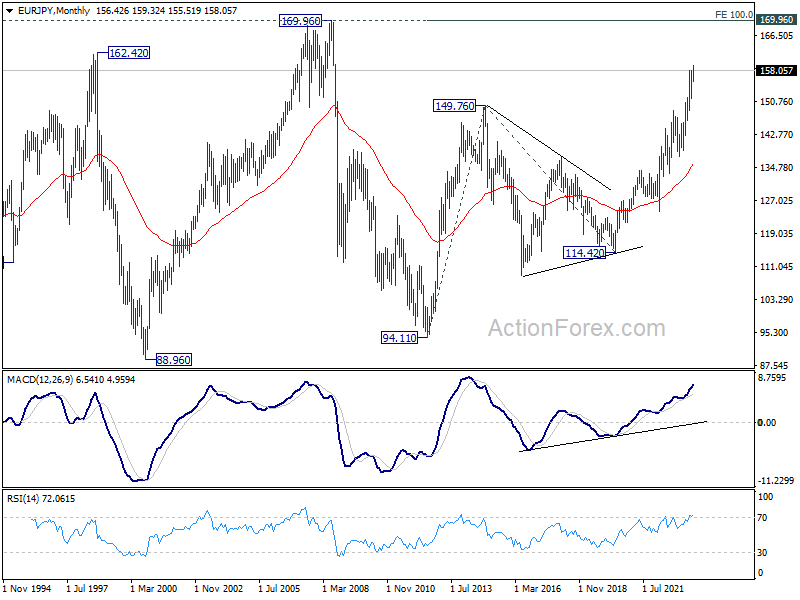
In the long term picture, rise from 109.03 (2016 low) is seen as the third leg of the whole up trend from 94.11 (2012 low). Next target is 100% projection of 94.11 to 149.76 from 114.42 at 170.07 which is close to 169.96 (2008 high).
EUR/GBP Weekly Outlook
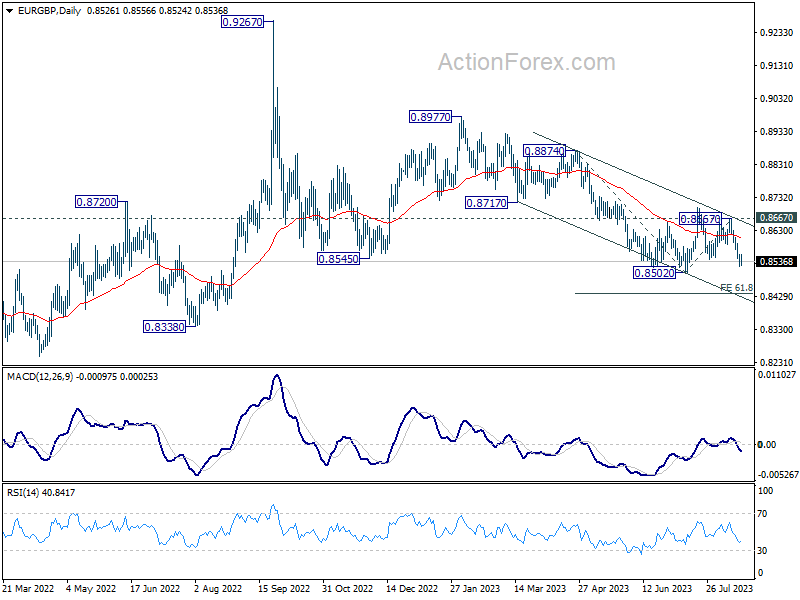
EUR/GBP's break of 0.8543 support argues that larger down trend is ready to resume. Further decline is expected this week for 0.8502 first. Firm break there will confirm this bearish case and target 61.8% projection of 0.8874 to 0.8502 from 0.8667 at 0.8437. On the upside, above 0.8592 minor resistance will mix up the outlook and extend sideway trading.
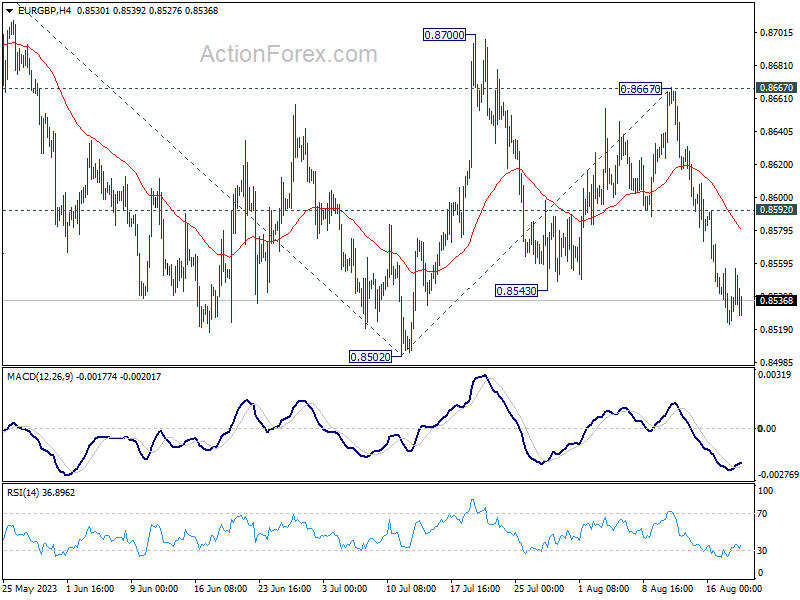
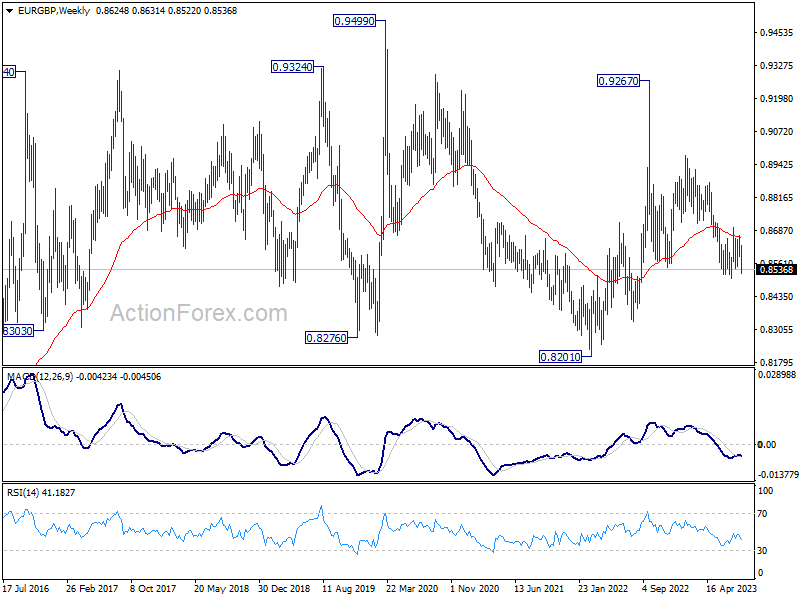
In the bigger picture, the down trend from 0.9267 (2022 high) is seen as part of the long term range pattern from 0.9499 (2020 high). Further decline is in favor as long as 0.8667 resistance holds. Break of 0.8502 will resume the fall towards 0.8201 (2022 low).
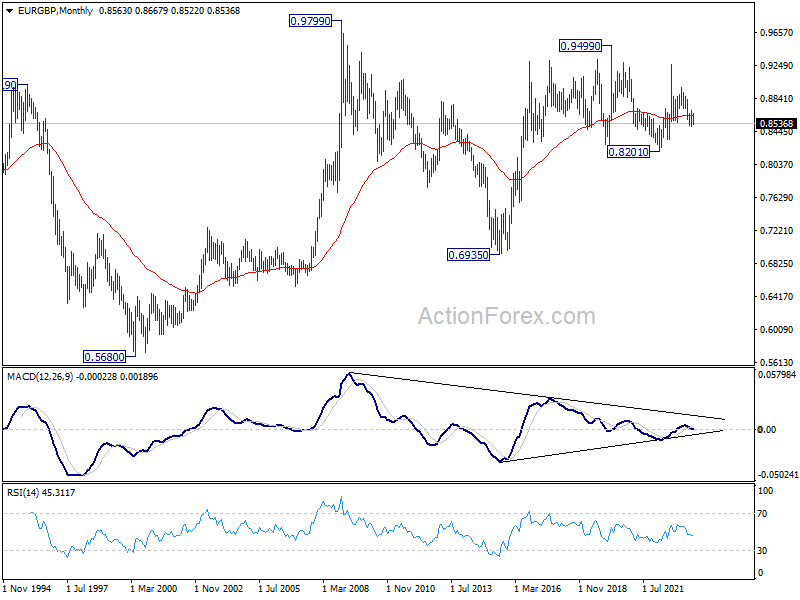
In the long term picture, long term range pattern is extending. But rise from 0.6935 (2015 low) is expected to resume at a later stage, to 0.9799 (2009 high).
EUR/AUD Weekly Outlook
EUR/AUD's up trend continued last week and hit as high as 1.7062. Further rally is expected this week, as part of the whole up trend from 1.4281. Next target is 1.7377 projection level. On the downside, break 1.6737 support is needed to indicate short term topping. Otherwise, outlook will stay bullish in case of retreat.
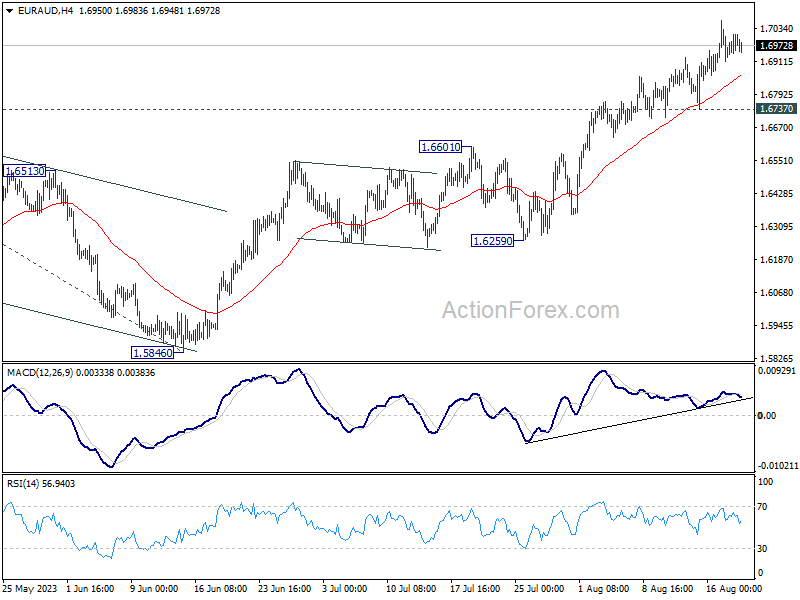
In the bigger picture, the rise from 1.4281 (2022 low) is in progress. Next target is 100% projection of 1.5254 to 1.6785 from 1.5846 at 1.7377. For now, outlook will stay bullish as long as 1.5846 support holds, even in case of another pull back.
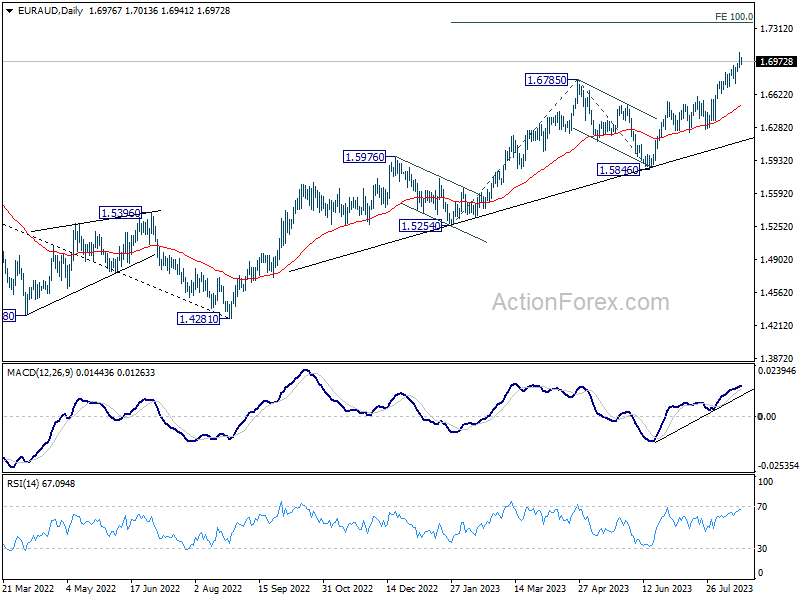
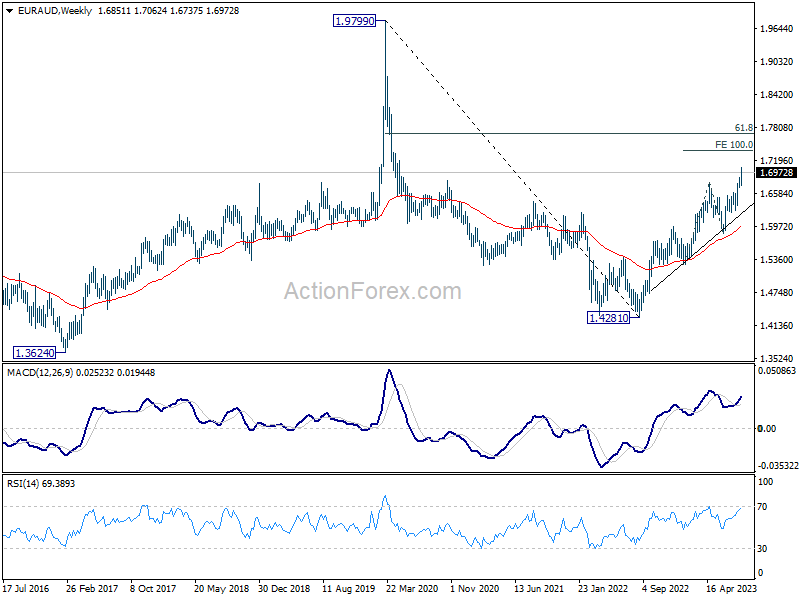
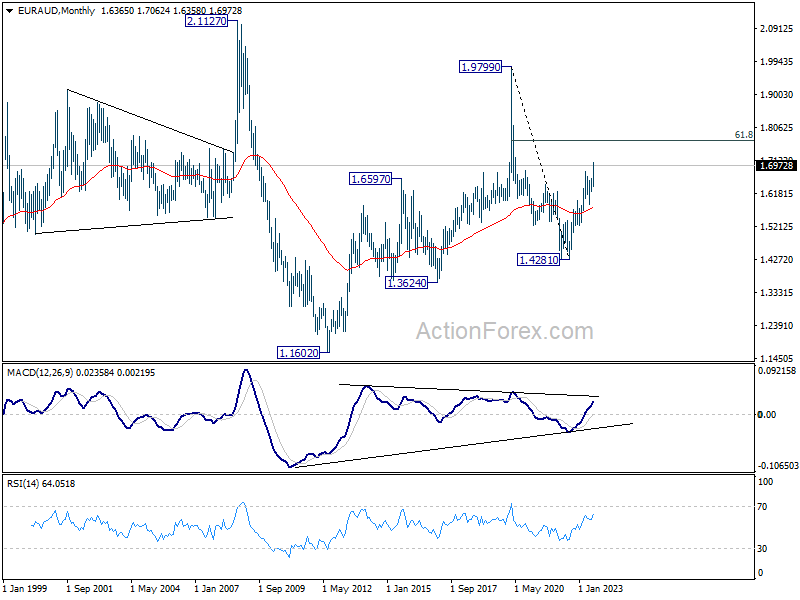
In the longer term picture, it's still early to decide if rise from 1.4281 is resuming whole up trend from 1.1602 (2012 low). But in either case, further rally is in favor as long as 1.5846 support holds. Next target is 61.8% retracement of 1.9799 to 1.4281 at 1.7691.
EUR/CHF Weekly Outlook
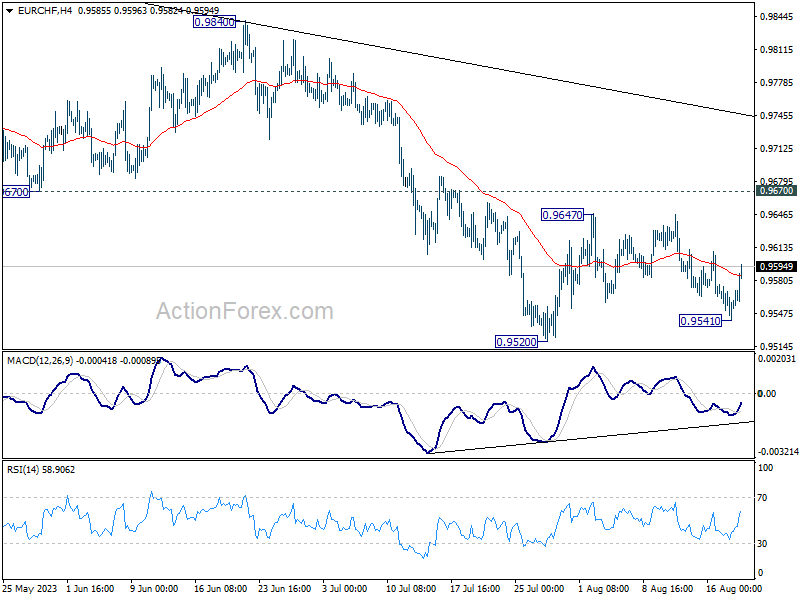
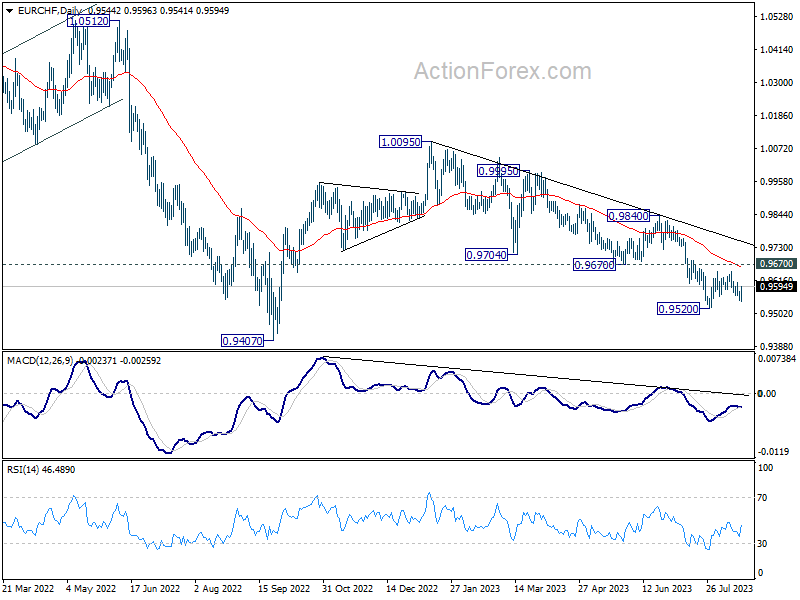
EUR/CHF gyrated lower to 0.9541 last week but recovered ahead of 0.9520. Overall outlook is unchanged as range trading continued. On the upside, break of 0.9647 will resume the rebound from 0.9520. Further sustained break of 0.9670 will be the first sign of bullish reversal and target 0.9840 resistance for confirmation. On the downside, break of 0.9520 will resume the whole fall from 1.0095 towards 0.9407 low.
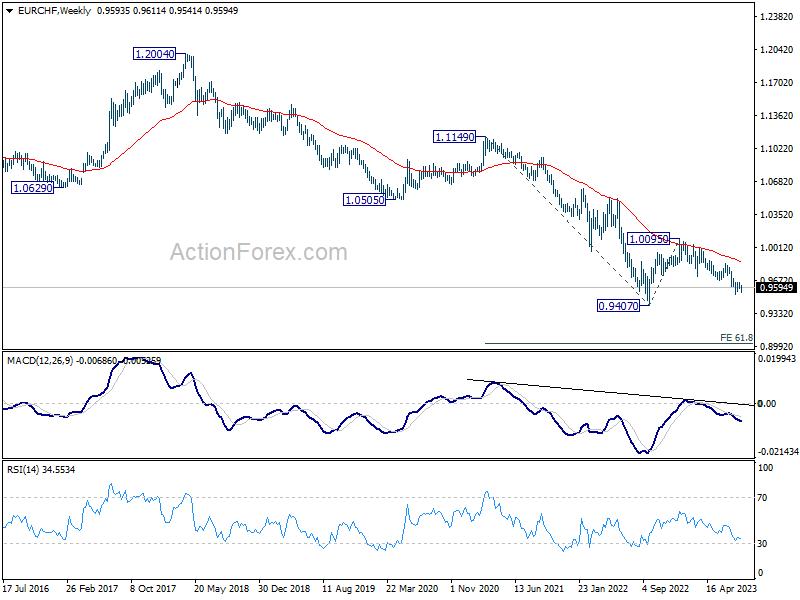
In the bigger picture, medium term outlook is staying bearish as the pair is capped well below falling 55 W EMA (now at 0.9849). Down trend from 1.2004 (2018 high) is in favor to continue. Sustained break of 0.9407 will target 61.8% projection of 1.1149 to 0.9407 from 1.0095 at 0.9018. For now, this will remain the favored case as long as 0.9840 resistance holds, in case of strong rebound.
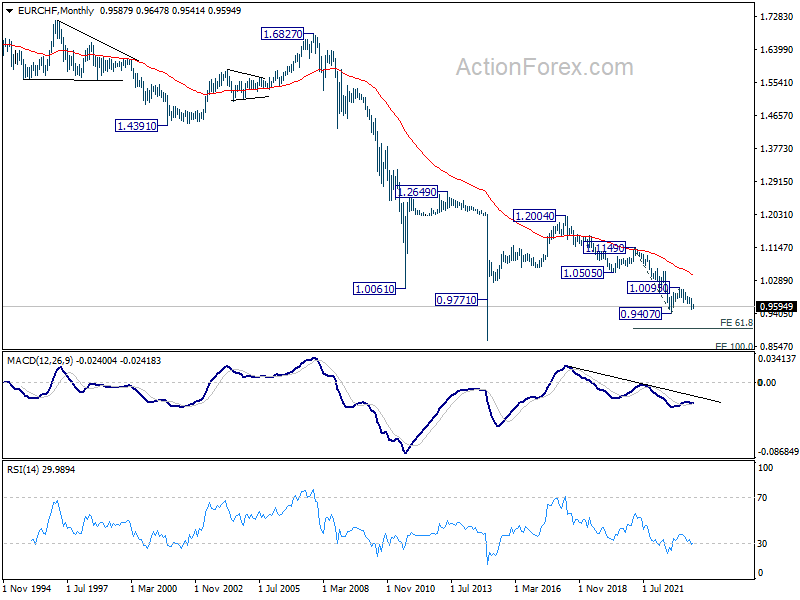
In the long term picture, outlook remains bearish as it's staying well below 55 M EMA (now at 1.0422). Break of 1.00095 resistance is needed to be the first sign of bottoming, or the multi-decade down trend is expected to continue.
Weekly Economic & Financial Commentary: Economic Activity Continues to Fly High
Summary
United States: Economic Activity Continues to Fly High
- Data on the retail and manufacturing sectors surprised to the upside, while residential construction continued to gather momentum. The FOMC meeting minutes acknowledged the economy's resilience and continued to stress the Committee's resolve to bring inflation back down toward its 2% goal.
- Next week: Existing Home Sales (Tue), New Home Sales (Wed), Durable Goods (Thu)
International: Persistent and Resilient: A Few More BoE Hikes Still to Come
- Amid still persistent inflation, the latest U.K. GDP report confirmed a respectable performance from the British economy during the first half of the year. This week, we also received more insight into just how weak China's economy is; activity data, such as retail sales and industrial production, were underwhelming.
- Next week: United Kingdom PMIs (Wed), Eurozone PMIs (Wed), Central Bank of Turkey (Thu)
Interest Rate Watch: A Higher Nominal and Real 10-Year Treasury Yield
- The yield on the 10-year U.S. Treasury climbed to a 15-year high this week. With market expectations of inflation little changed, the move has sparked a tightening in financial conditions not entirely unwelcome by the Fed.
Credit Market Insights: Mortgage Rates Reach Highest Level in over 20 Years
- The housing sector has acutely felt the effect of the Federal Reserve’s policy tightening. This week, Freddie Mac’s 30-year fixed-rate mortgage rose to 7.09%, its highest level in over 20 years.
Topic of the Week: England vs. Spain: The Lionesses’ Share of Inflation
This coming Sunday, England and Spain will face off in the Women’s World Cup Final in Sydney, Australia. Outside of football, however, the two countries are facing different challenges in battling soaring inflation.
The Weekly Bottom Line: Yields Drift Higher, As Macro Narrative Shifts
U.S. Highlights
- The big news this week was U.S. Treasury yields reaching the highest point since 2007 thanks to a string of positive economic data releases. The 10-Year yield reached 4.30% on Thursday, surpassing last October’s high.
- July’s retail sales data was one of those positive releases, as a stronger-than expected monthly gain underscored the resilience of the consumer. And July housing starts was another: starts rose modestly despite high mortgage rates. Mortgage rates hit a 21-year high this week, in line with higher Treasury yields.
- The FOMC minutes also played a role taking yields higher, as they showed that Fed officials see upside risks to inflation, which may warrant further tightening in the policy rate.
Canadian Highlights
Everyone wants to know what the Bank of Canada is going to do next. With recent data coming in stronger than expected, odds of another rate hike have increased.
Canadian inflation data have been uncooperative, with headline picking up on higher gas prices. Even more worrying has been the lack of progress on core inflation.
The one area of the economy that has responded to higher rates has been the housing market, which has seen both sales and prices drop as buyers adjust to higher mortgage rates.
U.S. – Yields Drift Higher, As Macro Narrative Shifts
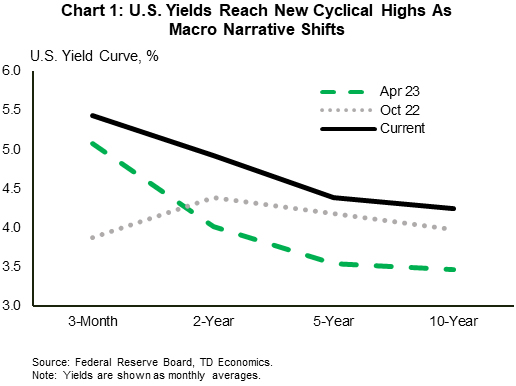
U.S. Treasury yields continued to climb higher this week, following a string of positive economic data releases. With the macroeconomic narrative shifting away from recessionary back towards soft landing, investor sentiment has also swung back in favor of rates needing to stay ‘higher for longer’. Current market pricing on the fed funds rate doesn’t fully price in the first rate cut until May of next year, with a relatively shallow trajectory on the policy rate through H2-2024. This is a sharp U-turn from just a few months ago when market participants had priced over 100 basis points of cuts through the second half of this year alone! As a result, yields across the curve are well off their April lows and have now even surpassed last October’s highs (Chart 1).
Nowhere has the theme of resilience been more on display than across the consumer segment, and that narrative has clearly carried over into the third quarter. Retail sales for July surprised even the most optimistic forecast, rising by an impressive 0.7% month-on-month (m/m) – its strongest monthly gain since January. Stripping out the most volatile items such as sales at gasoline stations, auto dealers and building supply stores showed even more strength – rising 1.0% m/m – with the largest gain coming from non-store retailers (+1.9% m/m). Indeed, some of the extra vigor was likely due to Amazon Prime Day – suggesting we could see some giveback in the months ahead. However, spending was fairly broad-based across most categories, with 9 of 13 retailers reporting gains. Even being conservative on our monthly assumptions for August/September, Q3 consumer spending is still tracking somewhere close to 3%, nearly doubling last quarter’s gain of 1.6%.
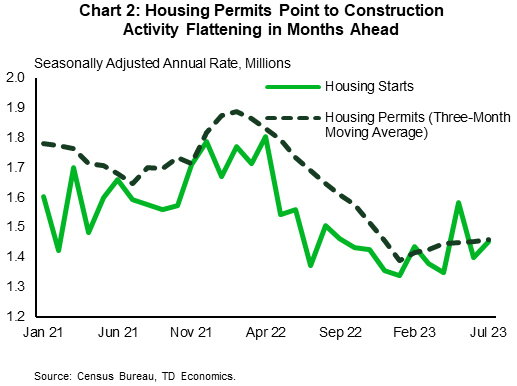
In contrast to the consumer, the housing sector has been one area of the economy that has certainly felt the impact of higher interest rates over the past year. But even here there are some early signs of stabilization. Home construction ticked modestly higher last month, rising by 3.9% m/m to 1.45 million units. Gains were entirely in the single-family segment, which are now up 22% from last November’s low. Flattening material costs alongside a shortage of lived-in homes for sale have been key factors underpinning construction activity across this segment in recent months. Still, further gains over the near-term seem limited. Permitting activity – a good leading indicator of future projects – has flattened in recent months, while builder confidence ticked down for the first time in 7 months in August alongside the recent surge in mortgage rates, which currently sit at a 21-year high of 7.1% (Chart 2).
Given the continued resilience in the economy, it’s no wonder the minutes from the FOMC’s July 25th-26th meeting showed that the majority of members think the inflation fight is far from over and could require additional tightening in the months ahead. Most forecasters are tracking +3% growth for the third quarter and the Atlanta Fed’s forecasting model is predicting 5.8%! While recent readings on inflation have been favorable, the economy will need to slow considerably to keep sustained downward pressure on inflation without requiring further rate hikes.
Canada – Reading the Inflation Tea Leaves
Everyone wants to know what the Bank of Canada (BoC) is going to do next. Given the Bank's dependence on incoming data, each economic release is being poured over to determine whether the Bank has hiked rates high enough. While it is clear that interest rate sensitive sectors have retrenched again after the BoC's June and July hikes, readings on inflation have been found wanting. This has increased the odds of another rate hike this year, pushing government bond yields to new cycle highs.
When the BoC jumped off the sidelines to hike rates again in June, it did so for three reasons. The first was continued strength in consumer spending fueled by robust employment gains. While there has been a loosening in labour markets given the rise in the unemployment rate to 5.5% in July, from 5.0% in May, there is still more to go before consumers start tightening their purse strings. The second factor was the fear that underlying inflation dynamics would cause price growth to remain stuck above the Bank's 2% target. More on that below. And the third factor that irked the BoC was the resurgence of the real estate market following a year-long rout in response to the BoC's aggressive rate hikes through 2022.
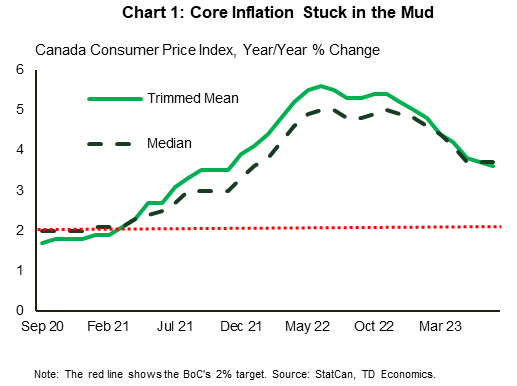
On the inflation front, we had been warning all year that getting inflation to fall from its starting point of 6% year-on-year to 3% y/y would be much easier than going from 3% y/y to 2% y/y. And sure enough, even though inflation fell to 2.8% y/y in June as expected, it jumped up to 3.3% y/y in July. Underlying core inflation metrics also disappointed, as they appear to be stuck around the mid-3% level (Chart 1). This speaks to the stickiness of price pressures. With Canadian consumers spending like 'Swifties', prices for flights, hotels, and going out to restaurants have surged. This trend will likely have raised concerns at the BoC that it will take even longer than expected for inflation to settle around 2%.
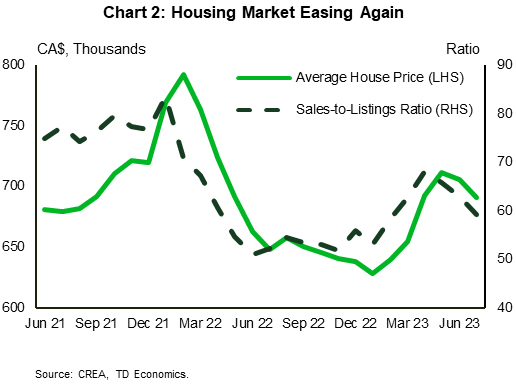
While recent rate hikes have not hit inflation yet, they have quickly impacted the housing market. Since the restart of rate hikes in June, the 5-year discounted mortgage rate has surged by around 1%, putting pressure on affordability. Residential sales have responded, turning negative in July – the first negative print since January. At the same time, listings continue to rise, which has forced the sales-to-listings ratio and average prices lower (Chart 2). More weakness may be in store for the housing market in the coming months as it adjusts to the new higher rate environment. In this way, the BoC has tamped down the risks stemming from the real estate market. And while this market is always the first to turn, the BoC will need more evidence from other areas of the economy before it feels comfortable moving back to the sidelines.
Week Ahead – Powell’s Jackson Hole Speech Will be Must-See TV
US
The main event for next week will be the Kansas City Fed’s Jackson Hole Symposium. Fed Chair Powell’s speech will reiterate that more rate hikes might be needed and that rates should stay higher for longer. With the recent surge with real yields, Fed Chair Powell can acknowledge that policy is restrictive and that future rate cuts could eventually be warranted as long as inflation has been defeated.
The economic data starts on Tuesday with the July existing homes sales report, which should show signs of stabilizing. Wednesday contains the flash PMIs, which could show manufacturing remains in contraction territory and softness with the service sector continues. On Thursday, we will get both initial jobless claims and the preliminary look at durable goods, which is expected to show weakness in July. Friday contains the release of the final reading of the University of Michigan sentiment report, with most traders wanting to know if inflation expectations had any major revisions.
Earnings for the week include results from Baidu, Lowe’s, Nvidia, and Snowflake,
Eurozone
As the ECB is poised to continue delivering more rate hikes to combat inflation, the risks of a hard landing are growing. There’s no shortage of economic releases next week but the one that stands out is the flash PMI readings. The manufacturing sector is clearly going to remain in contraction territory for all the key regions(Germany, France, eurozone), while the service sector steadily weakens, fighting to stay in expansion territory. Traders will also pay attention to both the German IFO business climate report as that could show expectations might be stabilizing and what should be another soft consumer confidence report.
Thin trading conditions in Europe could occur on Tuesday as some banks (France, Italy) are closed for Assumption Day.
UK
Next week is mostly about the UK flash PMI survey, as the composite PMI collapse in July is expected to be followed by further weakness in August. The manufacturing PMI is expected to weaken further from 45.3 to 45.0, the service reading to drop from 51.5 to 50.8, while the composite drops from 50.8 to 50.3. The UK economy is still expected to barely show growth in Q3, but the momentum is fading as the BOE’s rate hiking cycle starts to weigh on the economy.
Russia
Following the plunge in the ruble and an emergency rate hike, the focus on Russia will shift back to the war in Ukraine and the BRICS summit. Russia was having a growing influence in Africa, but that might get tested as President Putin will be absent given his indictment by the ICC.
The economic calendar is light with two releases, industrial production data on Wednesday and money supply on Friday.
South Africa
The one notable release will be the July inflation report. Inflation is expected to stay in the SARB’s target range between 3-6%. The annual headline reading is expected to drop from 5.4% to 4.9%, while the monthly reading rises from 0.2% to 1.0%. The monthly core reading is also expected to see a rise from 0.4% to 0.6%.
Turkey
With inflation out of control, the CBRT is expected to deliver its 3rd straight rise, bringing the 1-week report rate to 19.50%. The consensus range is to see the rate rise from 17.5% to anywhere between 18.50% and 20.5%. The 19.0% level was a key level in the past as that triggered the sacking of Governor Agbal.
Switzerland
Another quiet week with Money supply data released on Monday and export data on Tuesday.
China
One sole key economic data to watch will be on Monday, the monetary policy decision on its one-year and five-year loan prime rates that commercial banks used as a benchmark to price corporate, household loans and housing mortgages respectively.
After a surprise cut of 15 basis points (bps) on the one-year medium-term lending facility rate to 2.50% last Monday, its lowest level since late 2009 to defuse the potential contagion risk in China’s financial system triggered by a major trust fund that failed to make timely payments to holders of its wealth management products which are backed by unsold properties of indebted property developers; forecasts are now calling for a similar 15 bps cut on the one and five-year loan prime rates to bring it down to 3.4% and 4.05% respectively.
Market participants will also be on the lookout for more detailed fiscal stimulus from China’s top policymakers after recent “morale-boosting piecemeal rhetoric measures” that have failed to break the negative feedback loop in the China stock market; the benchmark CSI 300 index has given up all its ex-post Politburo gains from 25 July after the top leadership group promised to implement “counter-cyclical” measures to defuse the deflationary risk spiral in China.
For earnings report releases, a couple of major companies to take note of; Sunny Optical Technology (Tuesday), Country Garden Services (Tuesday), China Life Insurance (Thursday), NetEase (Thursday), Meituan (Friday).
India
A quiet calendar with only foreign exchange reserves and fortnightly bank loan growth data out on Friday.
Australia
Flash Manufacturing and Services PMIs for August will be out on Wednesday.
New Zealand
Balance of Trade for July out on Monday is forecasted to shrink to a deficit of -NZ$0.4 billion from a surplus of NZ$9 million posted in June. If it turns out as expected, it will be its first trade deficit since March 2023 due to a weak external demand environment.
Q2 retail sales will be out on Wednesday where its prior Q1 negative growth of -4.1% y/y is forecasted to narrow to -0.9% y/y.
Japan
Two key data releases to monitor. Firstly, flash Manufacturing and Services PMIs for August out on Wednesday; manufacturing activities are forecasted to improve slightly to 49.9 from 49.6 printed in July while growth in the services sector is expected to come in almost unchanged at 53.6 versus 53.9 in July.
Next up, the significant leading Tokyo area consumer inflation data for August out on Friday; both Tokyo core inflation (excluding fresh food) as well as its core-core inflation (excluding fresh food & energy) are forecasted to be unchanged at 3% y/y and 2.5% y/y respectively. Both inflation measures have remained elevated especially the core-core rate which has soared to a 31-year high.
Market participants will be keeping a close watch on the USD/JPY as it rallied past a key resistance zone of 145.50/146.10 despite rising concerns on possible BoJ’s FX intervention to negate the current bout of JPY weakness.
Singapore
Two key data to focus on. July’s consumer inflation out on Wednesday where the core inflation rate is expected to be almost unchanged at 4.1% y/y versus 4.2% y/y in June.
On Friday, industrial production for July is forecasted to show an improvement; -2.5% y/y from -4/9% y/y printed in June. Despite this forecasted improvement, it is still ten consecutive months of negative growth which increases the risk of a recession for Singapore in Q3 due to a weak external demand environment.
Energy
The oil price rally that has been in place since June has ended. Energy traders will focus on the latest problems from China, the global flash PMIs, the Jackson Hole Symposium, and the BRICS summit. After having an interrupted rally from $68 to $84, WTI crude looks poised to consolidate around the $80 region as traders grapple with a tight market that is facing headwinds from world’s two largest economies. Following the Jackson Hole gathering, it will be clear if the bond market selloff continues or cools down. If the global economic outlook become even more pessimistic, oil might give up a good portion of the recent rally.
Natural gas prices remain fixated over strike action at an LNG facility in Australia. Fresh talks between Woodside Energy and union officials are expected to begin on August 23rd. Natural gas will remain volatile until we have a handle on how gas availability will be for the winter.
Gold
Gold traders will closely watch the annual Jackson Hole Symposium and how aggressive China becomes with providing support to the deepening property crisis. The global bond market selloff has sent gold prices sharply lower over the past month but that could stabilize if we get a dovish Fed Chair Powell and as long as China doesn’t disappoint with the next wave of stimulus.
Spot gold has fallen below the $1900 level, but momentum selling has slowed. Gold traders are also fixating over the $1900 level for gold futures. Currently, gold futures are only $45 away from their March lows, while spot gold is around $80 away. For gold selling pressure to remain, global bond yields might need to surge higher.
Sunday, Aug. 20
Economic Data/Events:
- Italy’s hosts annual Rimini meeting
- Turkish President Erdogan expected to meet Hungarian PM Orban in Budapest.
Monday, Aug. 21
Economic Data/Events:
- China loan prime rates
- New Zealand trade
- Thailand GDP
- Jeffrey Schmid takes office as Kansas City Fed president
Tuesday, Aug. 22
Economic Data/Events:
- US existing home sales
- Mexico international reserves
- Norway GDP
- BRICS group summit of emerging-market nations in Johannesburg.
- China’s Xi Jinping to meet South African President Ramaphosa in South Africa begins.
- ASEAN finance ministers and central bank governors to gather in Jakarta.
- Singapore nomination day for September 1st presidential election.
- Thailand’s parliament meets to choose new PM
- Fed’s Goolsbee speaks at Fed Listens event on youth employment.
Wednesday, Aug. 23
Economic Data/Events:
- US new home sales, Flash PMIs
- Canada retail sales
- European flash PMIs: Eurozone, Germany, France, and the UK
- Eurozone consumer confidence
- Russia industrial production
- Singapore CPI
- South Africa CPI
- Nvidia earnings after the close
- US Republican Party presidential debate in Milwaukee
- Negotiations continue with Australian natural gas workers.
Thursday, Aug. 24
Economic Data/Events:
- US initial jobless claims, durable goods
- Turkey rate decision: Expected to raise rates by 200bps to 19.50%
- The Kansas City Fed’s annual economic policy symposium in Jackson Hole begins
Friday, Aug. 25
Economic Data/Events:
- US University of Michigan consumer sentiment
- Germany IFO business climate, GDP
- Japan Tokyo CPI
- Singapore industrial production
- The B20 summit, the official G20 dialogue forum with the global business community
- UK energy regulator Ofgem makes a price cap announcement.
Sovereign Rating Updates:
- Austria (Fitch)
- Czech Republic (Fitch)
- Austria (S&P)
- Austria (Moody’s)
- Sweden (Moody’s)
Summary 8/21 – 8/25
Monday, Aug 21, 2023
| GMT | Ccy | Events | Consensus | Previous |
|---|---|---|---|---|
| 22:45 | NZD | Trade Balance (NZD) Jul | -50M | 9M |
| 23:01 | GBP | Rightmove House Price Index M/M Aug | -0.20% | |
| 06:00 | EUR | Germany PPI M/M Jul | -0.20% | -0.30% |
| 06:00 | EUR | Germany PPI Y/Y Jul | -5.10% | 0.10% |
| 12:30 | CAD | New Housing Price Index M/M Jul | 0.00% | 0.10% |
| GMT | Ccy | Events | |
|---|---|---|---|
| 22:45 | NZD | Trade Balance (NZD) Jul | |
| Forecast: -50M | Previous: 9M | ||
| 23:01 | GBP | Rightmove House Price Index M/M Aug | |
| Forecast: | Previous: -0.20% | ||
| 06:00 | EUR | Germany PPI M/M Jul | |
| Forecast: -0.20% | Previous: -0.30% | ||
| 06:00 | EUR | Germany PPI Y/Y Jul | |
| Forecast: -5.10% | Previous: 0.10% | ||
| 12:30 | CAD | New Housing Price Index M/M Jul | |
| Forecast: 0.00% | Previous: 0.10% | ||
Tuesday, Aug 22, 2023
| GMT | Ccy | Events | Consensus | Previous |
|---|---|---|---|---|
| 06:00 | CHF | Trade Balance (CHF) Jul | 4.50B | 4.82B |
| 06:00 | GBP | Public Sector Net Borrowing (GBP) Jul | 3.4B | 17.7B |
| 08:00 | EUR | Eurozone Current Account (EUR) Jun | 10.2B | 9.1B |
| 14:00 | USD | Existing Home Sales Jul | 4.15M | 4.16M |
| 22:45 | NZD | Retail Sales Q/Q Q2 | -0.20% | -1.40% |
| 22:45 | NZD | Retail Sales ex Autos Q/Q Q2 | -0.10% | -1.10% |
| 23:00 | AUD | Manufacturing PMI Aug P | 49.6 | |
| 23:00 | AUD | Services PMI Aug P | 47.9 |
| GMT | Ccy | Events | |
|---|---|---|---|
| 06:00 | CHF | Trade Balance (CHF) Jul | |
| Forecast: 4.50B | Previous: 4.82B | ||
| 06:00 | GBP | Public Sector Net Borrowing (GBP) Jul | |
| Forecast: 3.4B | Previous: 17.7B | ||
| 08:00 | EUR | Eurozone Current Account (EUR) Jun | |
| Forecast: 10.2B | Previous: 9.1B | ||
| 14:00 | USD | Existing Home Sales Jul | |
| Forecast: 4.15M | Previous: 4.16M | ||
| 22:45 | NZD | Retail Sales Q/Q Q2 | |
| Forecast: -0.20% | Previous: -1.40% | ||
| 22:45 | NZD | Retail Sales ex Autos Q/Q Q2 | |
| Forecast: -0.10% | Previous: -1.10% | ||
| 23:00 | AUD | Manufacturing PMI Aug P | |
| Forecast: | Previous: 49.6 | ||
| 23:00 | AUD | Services PMI Aug P | |
| Forecast: | Previous: 47.9 | ||
Wednesday, Aug 23, 2023
| GMT | Ccy | Events | Consensus | Previous |
|---|---|---|---|---|
| 00:30 | JPY | Manufacturing PMI Aug P | 49.6 | 49.6 |
| 07:15 | EUR | France Manufacturing PMI Aug P | 45.2 | 45.1 |
| 07:15 | EUR | France Services PMI Aug P | 47.3 | 47.1 |
| 07:30 | EUR | Germany Manufacturing PMI Aug P | 38.7 | 38.8 |
| 07:30 | EUR | Germany Services PMI Aug P | 51.5 | 52.3 |
| 08:00 | EUR | Eurozone Manufacturing PMI Aug P | 42.8 | 42.7 |
| 08:00 | EUR | Eurozone Services PMI Aug P | 50.5 | 50.9 |
| 08:30 | GBP | Manufacturing PMI Aug P | 45.1 | 45.3 |
| 08:30 | GBP | Services PMI Aug P | 50.8 | 51.5 |
| 12:30 | CAD | Retail Sales M/M Jun | 0.00% | 0.20% |
| 12:30 | CAD | Retail Sales ex Autos M/M Jun | 0.30% | 0.00% |
| 13:45 | USD | Manufacturing PMI Aug P | 48.9 | 49.0 |
| 13:45 | USD | Services PMI Aug P | 52.4 | 52.3 |
| 14:00 | USD | New Home Sales Jul | 708K | 697K |
| 14:00 | EUR | Eurozone Consumer Confidence Aug P | -14 | -15 |
| 14:30 | USD | Crude Oil Inventories | -6.0M |
| GMT | Ccy | Events | |
|---|---|---|---|
| 00:30 | JPY | Manufacturing PMI Aug P | |
| Forecast: 49.6 | Previous: 49.6 | ||
| 07:15 | EUR | France Manufacturing PMI Aug P | |
| Forecast: 45.2 | Previous: 45.1 | ||
| 07:15 | EUR | France Services PMI Aug P | |
| Forecast: 47.3 | Previous: 47.1 | ||
| 07:30 | EUR | Germany Manufacturing PMI Aug P | |
| Forecast: 38.7 | Previous: 38.8 | ||
| 07:30 | EUR | Germany Services PMI Aug P | |
| Forecast: 51.5 | Previous: 52.3 | ||
| 08:00 | EUR | Eurozone Manufacturing PMI Aug P | |
| Forecast: 42.8 | Previous: 42.7 | ||
| 08:00 | EUR | Eurozone Services PMI Aug P | |
| Forecast: 50.5 | Previous: 50.9 | ||
| 08:30 | GBP | Manufacturing PMI Aug P | |
| Forecast: 45.1 | Previous: 45.3 | ||
| 08:30 | GBP | Services PMI Aug P | |
| Forecast: 50.8 | Previous: 51.5 | ||
| 12:30 | CAD | Retail Sales M/M Jun | |
| Forecast: 0.00% | Previous: 0.20% | ||
| 12:30 | CAD | Retail Sales ex Autos M/M Jun | |
| Forecast: 0.30% | Previous: 0.00% | ||
| 13:45 | USD | Manufacturing PMI Aug P | |
| Forecast: 48.9 | Previous: 49.0 | ||
| 13:45 | USD | Services PMI Aug P | |
| Forecast: 52.4 | Previous: 52.3 | ||
| 14:00 | USD | New Home Sales Jul | |
| Forecast: 708K | Previous: 697K | ||
| 14:00 | EUR | Eurozone Consumer Confidence Aug P | |
| Forecast: -14 | Previous: -15 | ||
| 14:30 | USD | Crude Oil Inventories | |
| Forecast: | Previous: -6.0M | ||
Thursday, Aug 24, 2023
| GMT | Ccy | Events | Consensus | Previous |
|---|---|---|---|---|
| 12:30 | USD | Initial Jobless Claims (Aug 18) | 241K | 239K |
| 12:30 | USD | Durable Goods Orders Jul | -4.00% | 4.60% |
| 12:30 | USD | Durable Goods Orders ex Transportation Jul | 0.20% | 0.50% |
| 14:30 | USD | Natural Gas Storage | 35B | |
| 23:30 | JPY | Tokyo CPI Y/Y Aug | 3.00% | 3.20% |
| 23:30 | JPY | Tokyo CPI ex Fresh Food Y/Y Aug | 2.90% | 3.00% |
| 23:30 | JPY | Tokyo CPI ex Food Energy Y/Y Aug | 4% | |
| 23:50 | JPY | Corporate Service Price Index Y/Y Jul | 1.20% | 1.20% |
| GMT | Ccy | Events | |
|---|---|---|---|
| 12:30 | USD | Initial Jobless Claims (Aug 18) | |
| Forecast: 241K | Previous: 239K | ||
| 12:30 | USD | Durable Goods Orders Jul | |
| Forecast: -4.00% | Previous: 4.60% | ||
| 12:30 | USD | Durable Goods Orders ex Transportation Jul | |
| Forecast: 0.20% | Previous: 0.50% | ||
| 14:30 | USD | Natural Gas Storage | |
| Forecast: | Previous: 35B | ||
| 23:30 | JPY | Tokyo CPI Y/Y Aug | |
| Forecast: 3.00% | Previous: 3.20% | ||
| 23:30 | JPY | Tokyo CPI ex Fresh Food Y/Y Aug | |
| Forecast: 2.90% | Previous: 3.00% | ||
| 23:30 | JPY | Tokyo CPI ex Food Energy Y/Y Aug | |
| Forecast: | Previous: 4% | ||
| 23:50 | JPY | Corporate Service Price Index Y/Y Jul | |
| Forecast: 1.20% | Previous: 1.20% | ||
Friday, Aug 25, 2023
| GMT | Ccy | Events | Consensus | Previous |
|---|---|---|---|---|
| 06:00 | EUR | Germany GDP Q/Q Q2 F | 0.00% | 0.00% |
| 08:00 | EUR | Germany IFO Business Climate Aug | 86.6 | 87.3 |
| 08:00 | EUR | Germany IFO Current Assessment Aug | 89.8 | 91.3 |
| 08:00 | EUR | Germany IFO Expectations Aug | 83.8 | 83.5 |
| 14:00 | USD | Michigan Consumer Sentiment Index Aug F | 71.2 | 71.2 |
| GMT | Ccy | Events | |
|---|---|---|---|
| 06:00 | EUR | Germany GDP Q/Q Q2 F | |
| Forecast: 0.00% | Previous: 0.00% | ||
| 08:00 | EUR | Germany IFO Business Climate Aug | |
| Forecast: 86.6 | Previous: 87.3 | ||
| 08:00 | EUR | Germany IFO Current Assessment Aug | |
| Forecast: 89.8 | Previous: 91.3 | ||
| 08:00 | EUR | Germany IFO Expectations Aug | |
| Forecast: 83.8 | Previous: 83.5 | ||
| 14:00 | USD | Michigan Consumer Sentiment Index Aug F | |
| Forecast: 71.2 | Previous: 71.2 | ||
Canadian Retail Sales Likely Little Changed in June
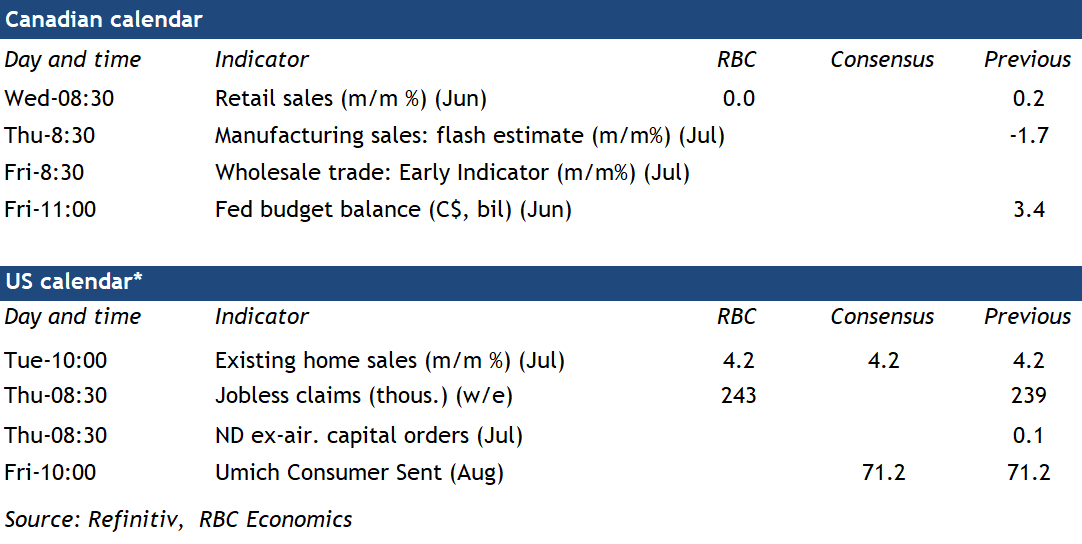
The latest retail sales numbers will be scrutinized for signs of continued excess demand in the economy—particularly after a surprisingly firm increase in Canadian CPI in July. In Q1, exceptionally strong household consumption pushed GDP growth above expectations. In Q2, retail sales have softened. Sales volumes (excluding price impacts) were down almost 2% at an annualized rate over April and May compared to the Q1 average. And Statistics Canada’s advance estimate for June was little changed. Our own RBC cardholder data suggests consumer spending has been somewhat stronger than that, with purchases of discretionary services (not counted in the monthly retail sales data) particularly firm.
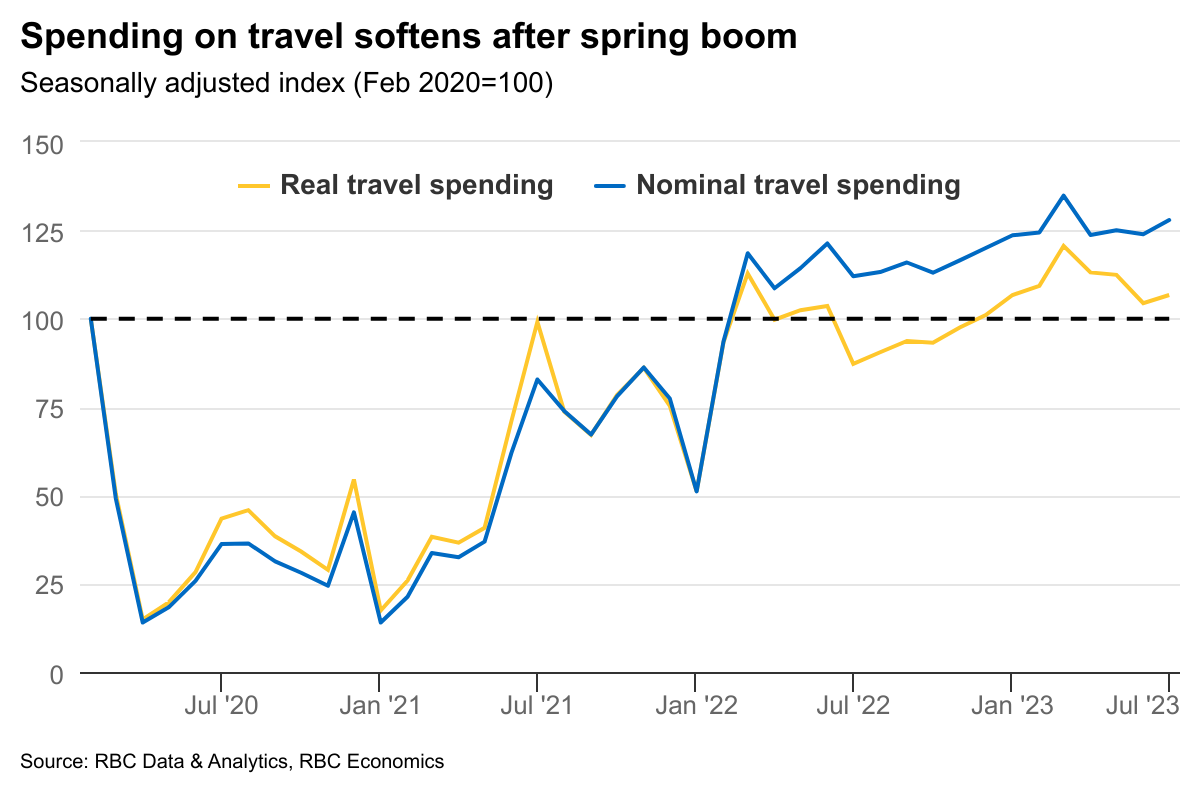
The same data indicates spending remained relatively firm in July. Still, industry reports suggest auto sales declined (on a seasonally-adjusted basis), despite improving availability of stock. And the early summer travel boom is losing momentum as Canadians tighten their belts to adjust to the Bank of Canada’s ten interest rate hikes.
Labour markets remain relatively firm, but the unemployment rate edged up half a percentage point over the last three months. The retail sales number will be one of the final data points to come in ahead of the BoC’s September meeting. Inflation data is still running firm, but early signs of softening in the demand backdrop would help reassure the central bank that a resurgence in inflation isn’t underway. It would also improve the case for skipping another interest rate hike in September.
Week ahead data watch
The flash estimate for July manufacturing sales will be scrutinized for signs of easing after a sharp decline in June sales (-1.7%.) The port strike in B.C. may have disrupted manufacturer shipments in July, but we expect it had a lesser impact on current production (i.e. GDP). Manufacturer’ inventories of production inputs were in much better shape ahead of the strike thanks to improved global supply chain conditions. As a result, production for the most part likely continued. There may, though, have been some temporary delays of shipments of finished products.
Performance of Key Market Instruments When 10-year US Yield Rises Above 4%
August is traditionally seen as a quiet month, but once again significant developments are taking place globally. In particular, the 10-year US yield has climbed decisively above the 4% threshold as market participants are scrambling to explain this move amidst a low liquidity environment. A quick look at market history could give us some valuable insight as to what the future holds for euro-dollar and other key market instruments.
Significant developments everywhere
The market has once again proven that it does not pay much attention to the calendar. And understandably so, as the Chinese developments are making headlines with the world, and especially the euro area, appearing to be deeply worried about the growth outlook for the remainder of 2023. Amidst these conditions, the 10-year US yield is trading comfortably above the 4% threshold, testing the October 2022 highs, and potentially opening the door to recording the highest print since October 2007.
It is worth pointing out that an entire generation of bond traders has not experienced yields trading consistently above 4%. Coupled with the fact that the summer holidays have left the junior traders in charge of the investment banks’ trading books, it makes this period extremely interesting and far more volatile than under normal market conditions.
Having said that, there are several economic and liquidity reasons behind the current rise in US treasuries. These include the strong economic data releases in the US and the rising probability that inflation might not continue its recent downward trend. This could mean that the Fed is not getting closer to considering rate cuts as the market is currently envisaging. If one adds the higher number of US Treasury bonds/notes being auctioned off to refill the government coffers and to fund the ballooning budget deficit, then the 4% level is not difficult to explain.
What happens to euro-dollar when the 10-year UST traded above 4%?
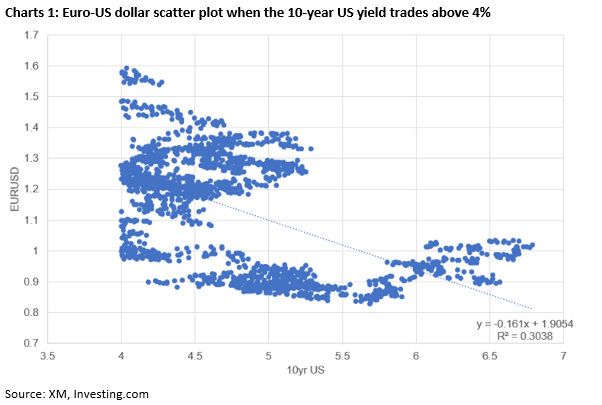
Chart 1 below shows a scatter chart of euro-dollar price action when the 10-year US yield trades above 4% using data since 2000. We can see a decent negative relationship which should be taken into consideration as the 2023 year-end forecasts are currently being updated.
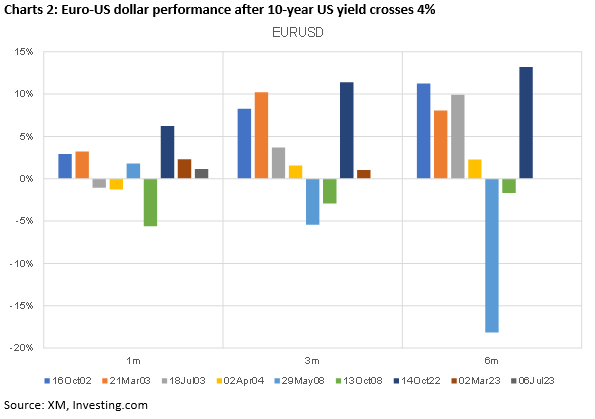
Moving a step further, we decided to look at the 1-month, 3-month and 6-month performance of euro-dollar when the 10-year US yield crosses above 4%. Naturally, this condition created a lot of noise as the number of days appearing in our analysis was quite sizeable. Therefore, our decision was to examine the periods that the 10-year US yield crossed above 4% provided that it spent the previous 20 trading days below this level.
As we can see from Chart 2 below, with the exception of the 2008 episode, euro-dollar performance tends to be positive 3 and 6 months after the 10-year US yield trades above the 4% threshold. The 1-month performance is more mixed and hence probably not a good guide for future episodes.
Any other interesting findings?
By analysing other key market instruments, we found the S&P500 performance to be mixed and rather split between positive and negatives episodes. Hence, avid stock investors should be aware that a higher 10-year US yield doesn’t automatically imply negative future stock market performance. Interestingly, 10-year US yield performance is equally split when focusing on the 6-month move. We have found three periods of very small yield increases ranging from 2.7-5.2bps but also four periods of significant drops of up to 122bps.
From the remaining instruments examined, the 6-month performance of gold, dollar-yen and euro-pound stands out. Intriguingly, gold tends to be higher 6 months after 10-year US yield trades above 4% with the exception of the May 2008 period. Additionally, the performance of both dollar-yen and euro-pound pairs 6 months after the acute US yield move seems to be consistent, with the former showing an average 7% drop over the dates examined and the latter registering a 6.5% advance on average.
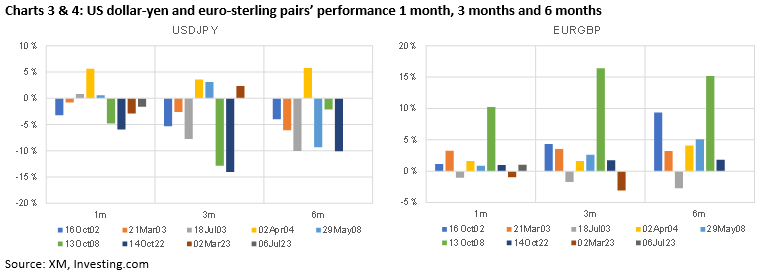
To sum up, it has been quite rare over the past 15 years for the US yield to hover above 4%. Consequently, the lack of relevant market experience under this condition creates uncertainty about the future performance of the key market instruments. Based on our analysis, the 6-month performance of euro-dollar after the 10-year US yield trades above 4% tends to be positive with the exception of the 2008 crisis. Additionally, S&P500 investors are not yet doomed as there have been periods of positive performance despite the elevated 10-year US yield. Finally, from the remaining instruments, dollar-yen and euro-pound exhibit consistent 6-month performance.