

Sample Category Title
USD/CAD Daily Outlook
Daily Pivots: (S1) 1.3210; (P) 1.3255; (R1) 1.3327; More....
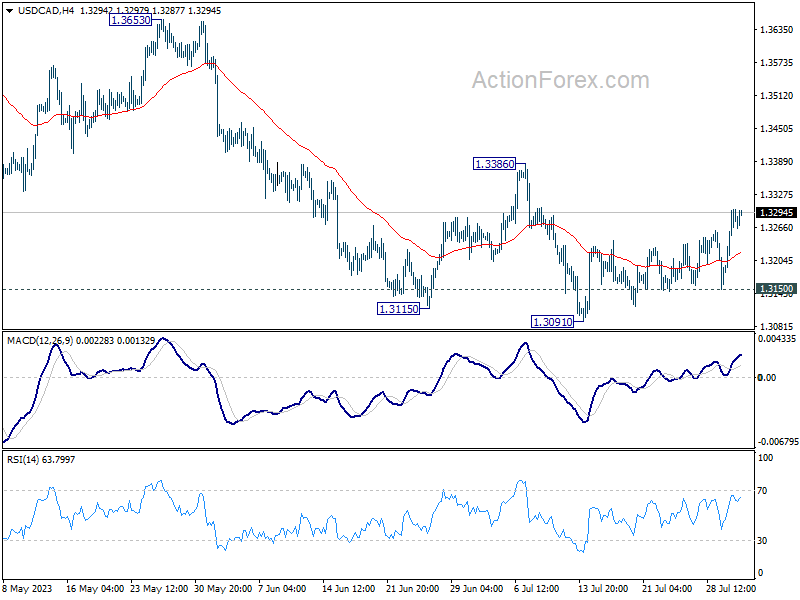
USD/CAD's recovery form 1.3091 short term bottom extends higher today, but stays below 1.3386 resistance. Intraday bias remains neutral and further decline is still mildly in favor. Below 1.3150 support should resume larger decline through 1.3091 low. Nevertheless, on the upside, firm break of 1.3386 will indicate near term reversal and turn outlook bullish.
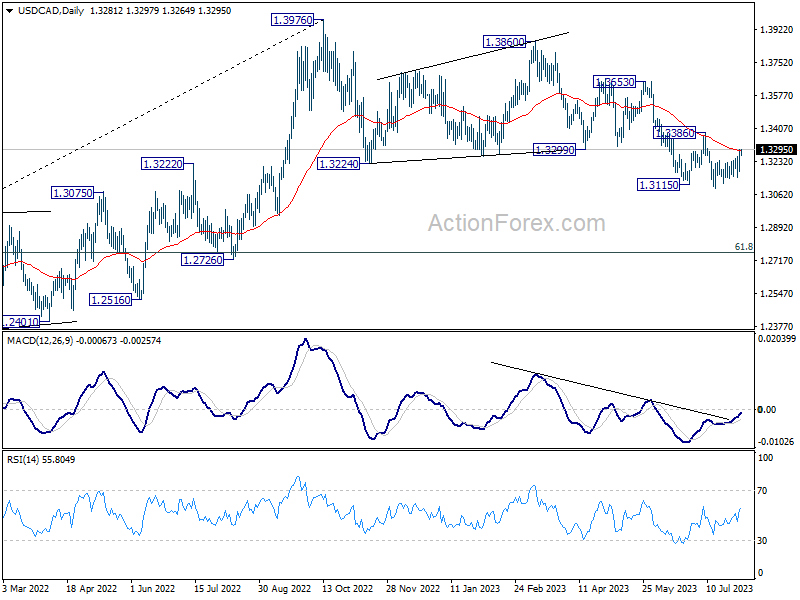
In the bigger picture, price actions from 1.3976 are viewed as a correction to up trend from 1.2005 (2021 low) only. But even so, deeper decline is expected as long as 1.3386 resistance holds. Further fall could be seen to 61.8% retracement of 1.2005 to 1.3976 at 1.2758. Meanwhile, break of 1.3386 will be a sign that the correction has completed and bring stronger rally back to retest 1.3976.
AUD/USD Daily Report
Daily Pivots: (S1) 0.6569; (P) 0.6647; (R1) 0.6692; More...
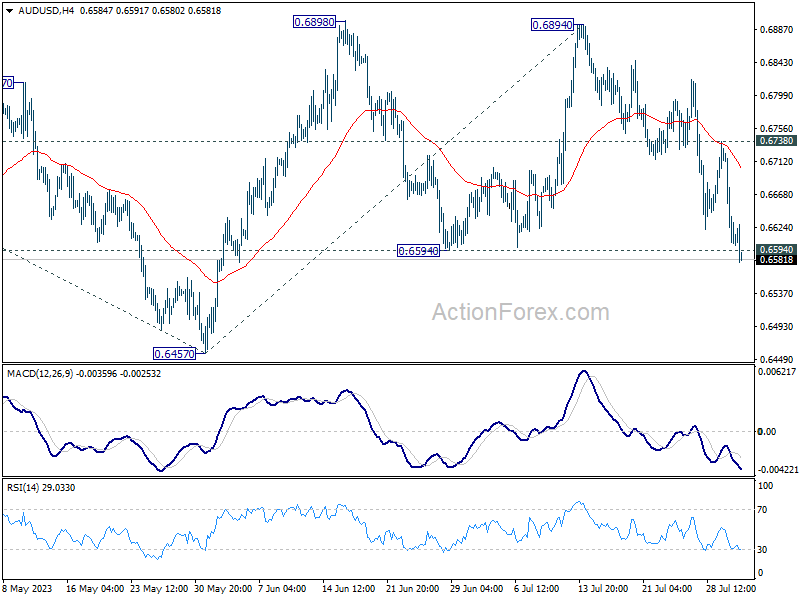
AUD/USD's break of 0.6594 support argues that rebound from 0.6457 has completed at 0.6894 already. Intraday bias is back on the downside for 0.6457. Break there will resume the fall from 0.7156 to 100% projection of 0.7156 to 0.6457 from 0.6894 at 0.6195. For now, risk will stay mildly on the downside as long as 0.6738 resistance holds, in case of recovery.
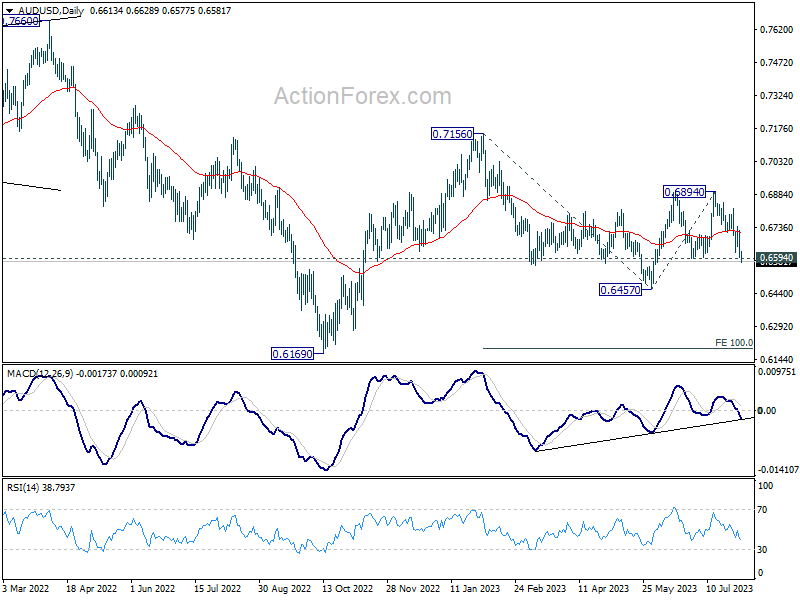
In the bigger picture, outlook is mixed for now as AUD/USD failed to sustain above both 55 D EMA (now at 0.6713) and 55 W EMA (now at 0.6784). On the upside, break of 0.65898 resistance will solidify the case that down trend from 0.8006 (2021 high) has already completed, and target 0.7156 resistance for confirmation. However, break of 0.6457 will likely resume the down trend through 0.6169 (2022 low).
Asian Markets Skittish Following Fitch’s US Rating Downgrade; Commodity Currencies Bear the Brunt
Market sentiment in Asia today leans heavily toward risk aversion, following the unexpected move by Fitch Ratings to downgrade US sovereign rating. Consequently, commodity currencies are grappling with strong sell-offs. New Zealand Dollar is leading the downward spiral, despite strong wage growth reflected Q2's employment data. Australian Dollar, still reeling from the aftereffects of yesterday's RBA decision, is also on a downward trajectory, breaking through key short-term support levels against both Dollar and Euro. Canadian Dollar is faring slightly better, although it's also notably weak.
Amid this atmosphere of risk aversion, Yen is attempting a recovery, albeit with limited momentum so far. Dollar remains robust but is battling to break free from its current range against Euro. Market attention now turns to today's ADP employment report, with traders likely holding off on significant bets until Friday's non-farm payroll figures. Meanwhile, Euro leads the pack among European majors, but they're actually just range bound against each other.
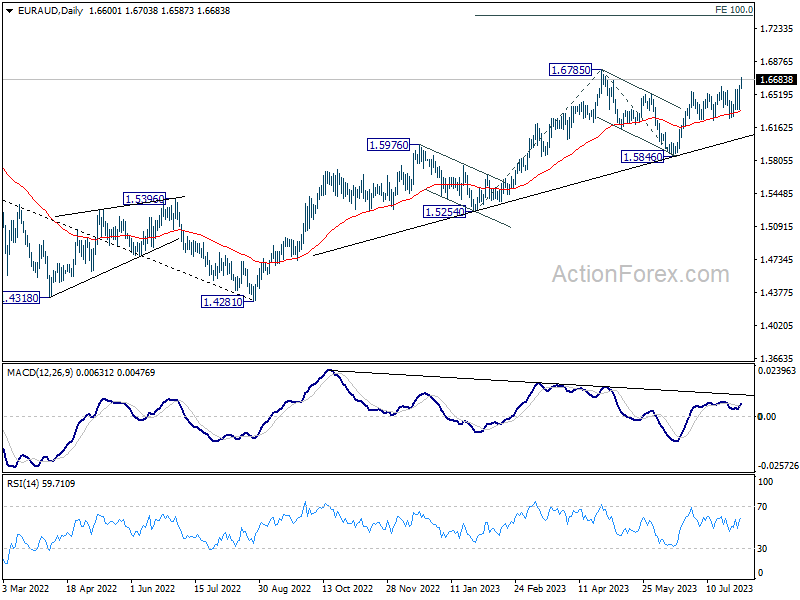
Technically, EUR/AUD finally looks ready to resume medium term up trend with today's strong rally. Immediate focus for the next few days is 1.6785 high. Decisive break there will set the stage for 100% projection of 1.5254 to 1.6785 from 1.5846 at 1.7377. Judging from current sluggishness in EUR/USD, extended rally in EUR/AUD would more likely be accompanied by deeper fall in AUD/USD, probably through 0.6457 support if EUR/AUD breaks 0.6785 decisively.
At the time of writing, Nikkei is down -2.31%. Hong Kong HSI is down -2.17%. China Shanghai is down -0.99%. Singapore Strait Times is down -1.32%. Japan 10-year JGB yield is up 0.034 at 0.628. Overnight, DOW rose 0.20%. S&P 500 dropped -0.27%. NASDAQ dropped -0.43%. 10-year yield rose 0.092 to 4.051.
Fitch cuts US sovereign rating on steady deterioration in standards of governance
Asian stock markets took a significant plunge following Fitch Ratings' surprise decision to downgrade US sovereign rating from AAA to AA+. This move mirrors S&P Global Ratings' decision made over a decade ago, causing considerable unrest among investors.
Fitch's statement highlighted, "In Fitch's view, there has been a steady deterioration in standards of governance over the last 20 years, including on fiscal and debt matters, notwithstanding the June bipartisan agreement to suspend the debt limit until January 2025."
US Treasury Secretary Janet Yellen fiercely contested the downgrade, calling it "arbitrary and based on outdated data." The White House has also voiced opposition to Fitch's assessment, with press secretary Karine Jean-Pierre declaring, "It defies reality to downgrade the United States at a moment when President Biden has delivered the strongest recovery of any major economy in the world."
Fed Goolsbee: Every meeting is live around transition point
Chicago Fed President Austan Goolsbee has refrained from pre-committing to Fed's actions in September, insisting that every meeting is crucial when navigating the transition point. "When you're around the transition point, every meeting is a live meeting and you're trying to figure out trends, not just reflect one month's data," Goolsbee said yesterday.
Goolsbee is "guardedly optimistic" about Fed's ability to stick to what he terms the "golden path," bringing down prices without inducing a recession. He emphasized the importance of watching how core goods and housing inflation evolve in the coming months to remain on this path.
"Those are the two components that over the next three to six months, let's call it, if we are to succeed to stay on the golden path, we've got to see progress on those two parts of inflation," he said. He added that progress on services inflation isn't currently necessary.
He also shared his perspective on the link between wages and inflation, suggesting that wages are more of a lagging indicator rather than a predictor of inflation. According to Goolsbee, if Fed officials focus too much on wages when shaping their policy, they could risk overshooting interest rates.
Fed Bostic warns of overtightening risks, advocates for cautious approach
Yesterday, Atlanta Fed President Raphael Bostic expressed guarded optimism and highlighted the "significant progress" in controlling inflation. He observed, "Inflation is well off its highs that we saw in the last year. And recent numbers have come in promising in ways that suggest that we might be seeing continued declines."
Bostic pointed to the ongoing economic evolution as in line with an "orderly slowdown," which he views as "quite promising". As such, he advocated to be cautious, patient and resolute" in policy-making.
He also voiced concerns about the risk of overtightening monetary policy. "I think we are in a phase now where there is some risk of us overtightening. And so we've just got to have that in mind," he said. By exercising appropriate caution, Bostic believes that the damage to employment can be minimized.
Looking forward, Bostic said, "My baseline outlook doesn't contemplate any cuts until the second half of next year at the earliest." He insists on being "resolute to make sure that we don't move our policy posture in a different direction until we're absolutely, absolutely certain that inflation is going to get to our target."
BoJ Uchida: Monetary easing to continue to nurture firms' changing pricing strategies
BoJ Deputy Governor Shinichi Uchida highlighted in a speech today an emerging trend in firms' pricing strategies, noting that "firms are developing more forward-looking strategies for setting prices." According to Uchida, these changes "might be the chance to finally change Japan's economy." Hence, he emphasized BoJ will "patiently continue with monetary easing to carefully nurture these signs."
Uchida was explicit in outlining the Bank's monetary policy stances. Firstly, he ruled out near-term adjustments to short-term interest rate, currently at -0.10%, stating "there is still a long way to go before such decisions are made."
Secondly, BoJ will "maintain the current framework" until sustainable and stable achievement of 2% inflation target "come in sight".
Thirdly, Uchida affirmed the ongoing yield curve control under the present policy framework, aiming to balance its benefits and drawbacks, especially in relation to financial intermediation and the market.
Despite the high economic and price outlook uncertainty, Uchida stated the recent yield curve control modification, allowing the 10-year JGB yield to rise to up to 1%, is aimed at sustaining the ultra-loose policy. "Needless to say, we do not have an exit from monetary easing in mind," he emphasized.
New Zealand employment up 1% in Q2, wage inflation unchanged at 4.3% yoy
New Zealand reported a better-than-expected employment growth of 1.0% in the second quarter of 2023, surpassing market expectations of a 0.6% rise. On the other hand, unemployment rate slightly increased from 3.4% to 3.6%, marginally above the anticipated 3.5%.
The data released showed that employment rate rose from 69.6% to 69.8%, and the participation rate increased from 72.0% to 72.4%. These are the highest rates recorded since the series began in 1986.
In terms of wage growth, all sector wage inflation climbed by 1.1% on a quarterly basis, resulting in an annual increase of 4.3%. "Annual wage costs continued to increase at historically high rates this quarter, equal to the 4.3 percent annual increase last quarter," said Bryan Downes, business prices delivery manager.
Downes noted that the most significant contribution to the Labour Cost Index for the June 2023 quarter came from retail trade and accommodation industry. This sector witnessed 1.5% increase in wages on a quarterly basis, following 0.7% rise in the previous quarter. The wage growth in this industry was primarily driven by rise in minimum wage, thereby pushing up overall wage growth during the quarter.
Looking ahead
Swiss SECO consumer climate and PMI manufacturing are the main features in European session. US will release ADP private employment later in the day.
AUD/USD Daily Report
Daily Pivots: (S1) 0.6569; (P) 0.6647; (R1) 0.6692; More...
AUD/USD's break of 0.6594 support argues that rebound from 0.6457 has completed at 0.6894 already. Intraday bias is back on the downside for 0.6457. Break there will resume the fall from 0.7156 to 100% projection of 0.7156 to 0.6457 from 0.6894 at 0.6195. For now, risk will stay mildly on the downside as long as 0.6738 resistance holds, in case of recovery.
In the bigger picture, outlook is mixed for now as AUD/USD failed to sustain above both 55 D EMA (now at 0.6713) and 55 W EMA (now at 0.6784). On the upside, break of 0.65898 resistance will solidify the case that down trend from 0.8006 (2021 high) has already completed, and target 0.7156 resistance for confirmation. However, break of 0.6457 will likely resume the down trend through 0.6169 (2022 low).
Economic Indicators Update
| GMT | Ccy | Events | Actual | Forecast | Previous | Revised |
|---|---|---|---|---|---|---|
| 22:45 | NZD | Employment Change Q2 | 1.00% | 0.60% | 0.80% | 1.10% |
| 22:45 | NZD | Unemployment Rate Q2 | 3.60% | 3.50% | 3.40% | |
| 23:50 | JPY | Monetary Base Y/Y Jul | -1.30% | -0.70% | -1.00% | |
| 23:50 | JPY | BoJ Minutes | ||||
| 07:00 | CHF | SECO Consumer Climate Q3 | -25 | -30 | ||
| 07:30 | CHF | Manufacturing PMI Jul | 44.2 | 44.9 | ||
| 12:15 | USD | ADP Employment Change Jul | 195K | 497K | ||
| 14:30 | USD | Crude Oil Inventories | -0.9M | -0.6M |
GBPJPY 3 Wave Pullback Coming After ending Impulse Rally
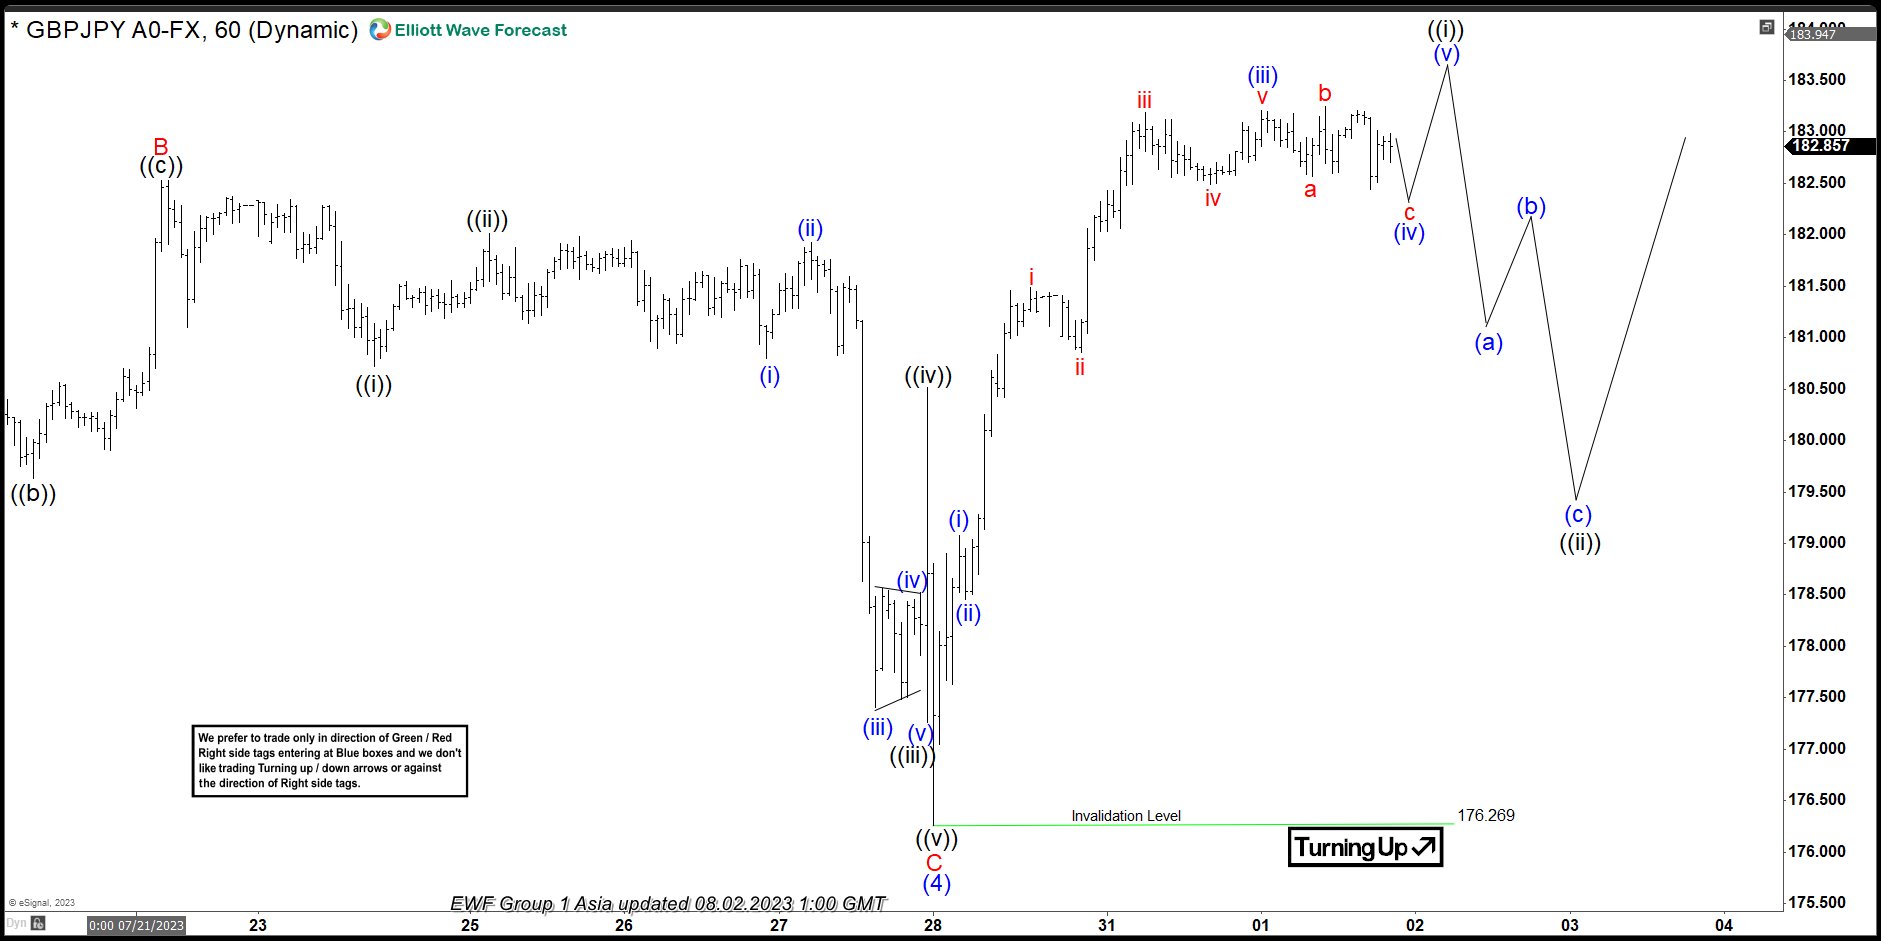
The short-term Elliott wave view in GBPJPY suggests that the pullback to 176.26 low ended larger degree wave (4). While the pullback unfolded as a zigzag structure where wave A ended at 179.45 low. Wave B bounce ended at 182.52 high and wave C managed to reach the 177.65- 174.63 100%-161.8% Fibonacci extension area of A-B. From there, the pair started the next leg higher in an impulse sequence & due a 3-wave pullback minimum soon before more upside happens.
Up from the 176.26 low, the rally took place in an impulse sequence where lesser degree wave (i) ended at the 179.08 high. A pullback to 178.45 low ended small wave (ii) pullback & then the pair made another 5 waves rally within wave (iii) at 183.20 high. Down from there, the pair is doing a short-term pullback in wave (iv) towards the 182.46- 182.21 area before the pair makes a last push higher in wave (v) & ends wave ((i)). Afterward, the pair is expected to see a pullback in wave ((ii)) in 3, 7, or 11 swings before more upside happens. Near-term, as far as dips remain above the 176.26 low expect pair to extend higher.
GBPJPY 1-Hour Elliott Wave Chart From 8.02.2023
GBPJPY Elliott Wave Video
https://www.youtube.com/watch?v=B3dbAt_ae1E
Technical Outlook and Review
DXY:
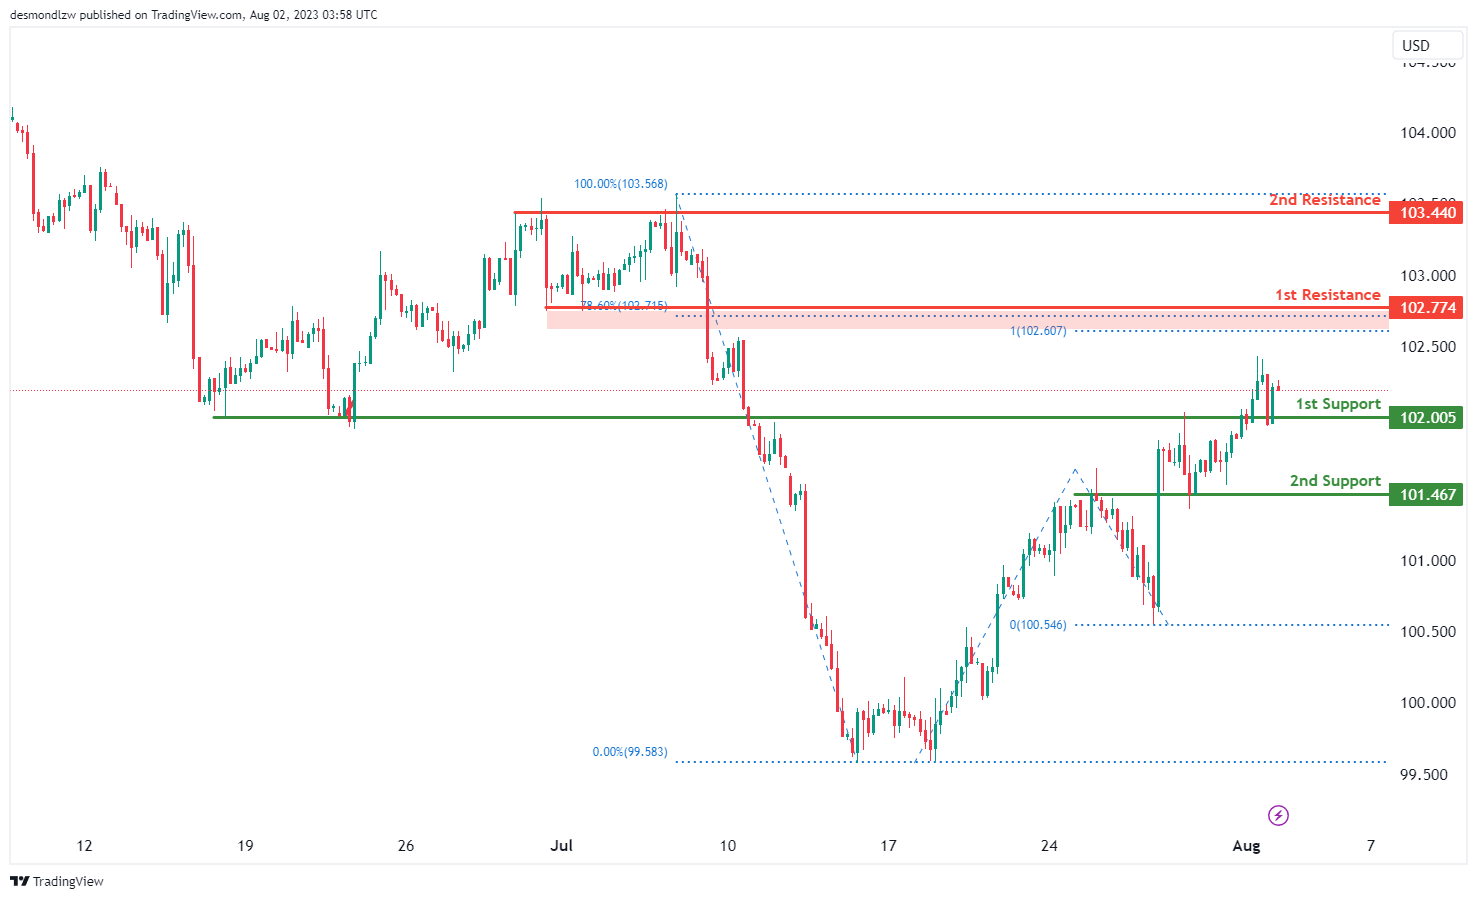
The DXY financial instrument is currently demonstrating bullish momentum, suggesting a potential bullish continuation towards the 1st resistance level at 102.77.
In the scenario of a market pullback, the 1st support level at 102.00 and the 2nd support at 101.46 both serve as critical overlap supports. These levels may provide a solid buffer against any significant price drops.
On the other hand, if the price moves upwards, it could potentially face resistance at the 1st resistance level of 102.77, which is identified as a pullback resistance. Beyond this, the 2nd resistance level at 103.44, recognized for its role as a multi-swing high resistance, may pose additional challenges for any further price increases.
EUR/USD:
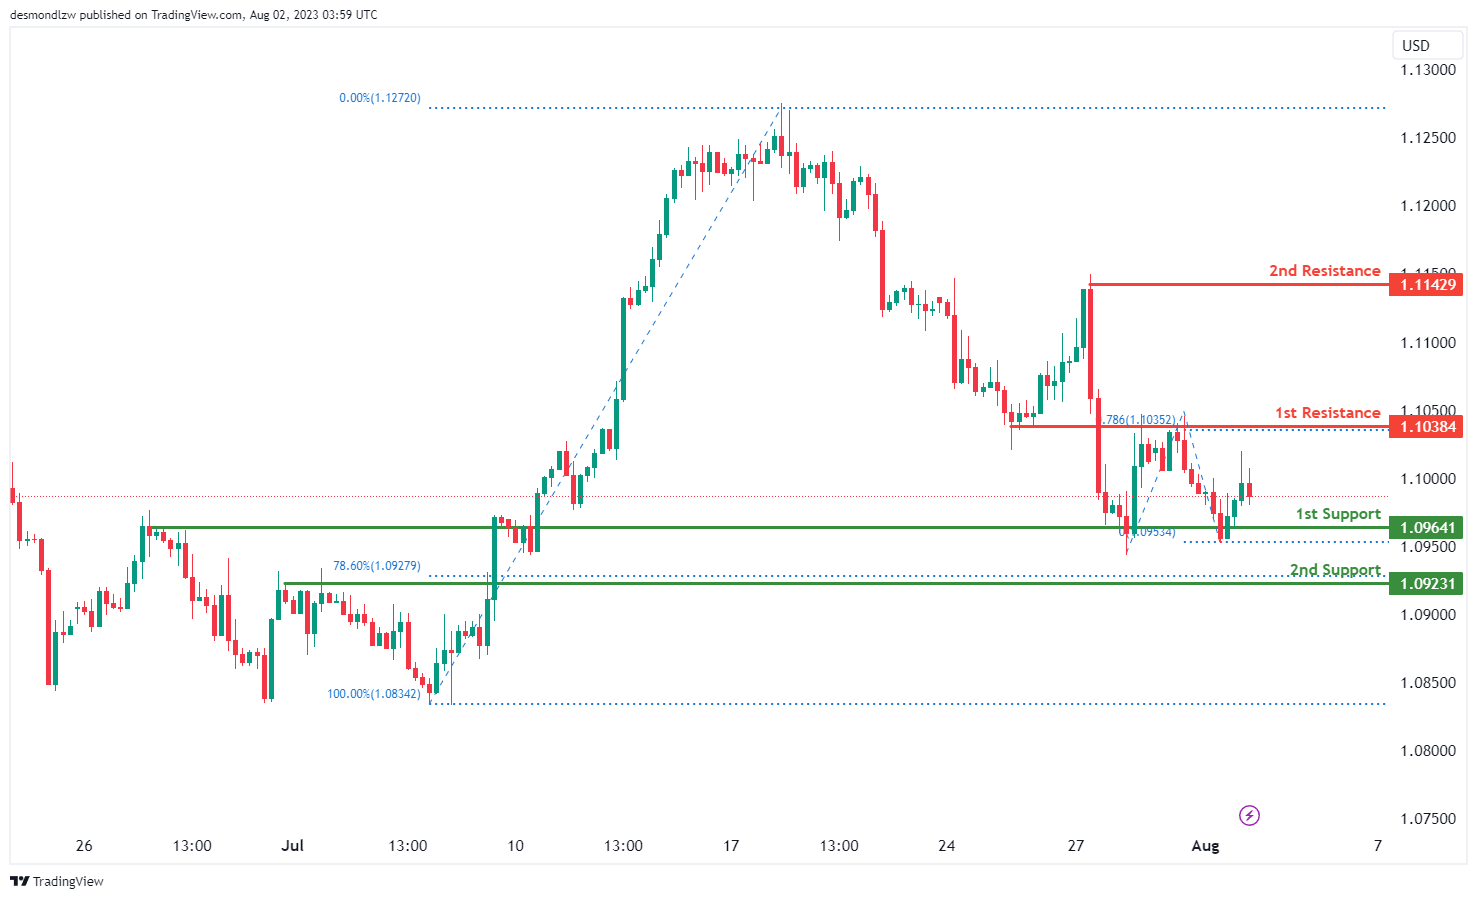
The EUR/USD instrument is currently indicating a bearish trend, which suggests a potential bearish continuation towards the 1st support level at 1.0964. This support level holds significance due to its role as an overlap support.
Should the price decrease further, the 2nd support level at 1.0923, functioning as a pullback support and aligning with the 78.60% Fibonacci retracement level, could provide a strong barrier against further downward movement.
On the other hand, if the price attempts to recover, the 1st resistance level at 1.1038, noted for its role as an overlap resistance and its alignment with the 78.60% Fibonacci Projection, could pose a challenge. If the price manages to break past this point, the 2nd resistance level at 1.1142, identified as a swing high resistance, may offer additional resistance to further price progression.
EUR/JPY:
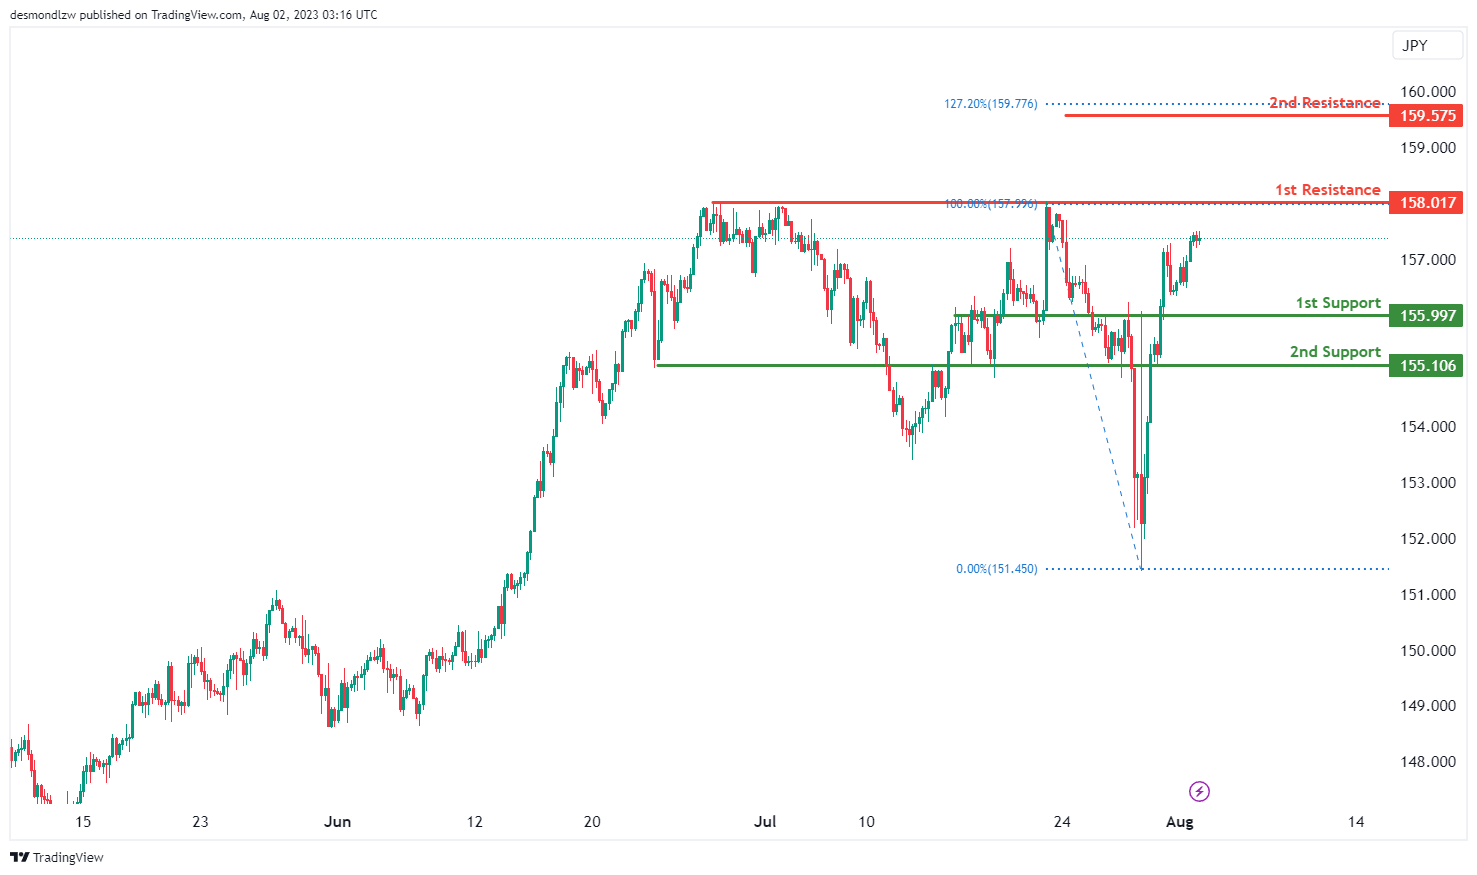
The EUR/JPY chart exhibits a bullish momentum, indicating the potential for a bullish continuation towards the 1st resistance level at 158.01. This resistance level is identified as a multi-swing high resistance, which suggests its significance in potentially halting the price’s upward movement and causing a pullback.
To support the bullish scenario, the chart shows 1st and 2nd support levels at 155.99 and 155.10, respectively. Both of these levels are recognized as overlap supports, adding to their importance in potentially providing a base for the price and contributing to the bullish momentum.
Furthermore, there is a 2nd resistance level at 159.57, which corresponds to the 127.20% Fibonacci Extension. This level is also identified as an overlap resistance and may serve as a significant point of resistance, potentially limiting the price’s further upward movement.
EUR/GBP:
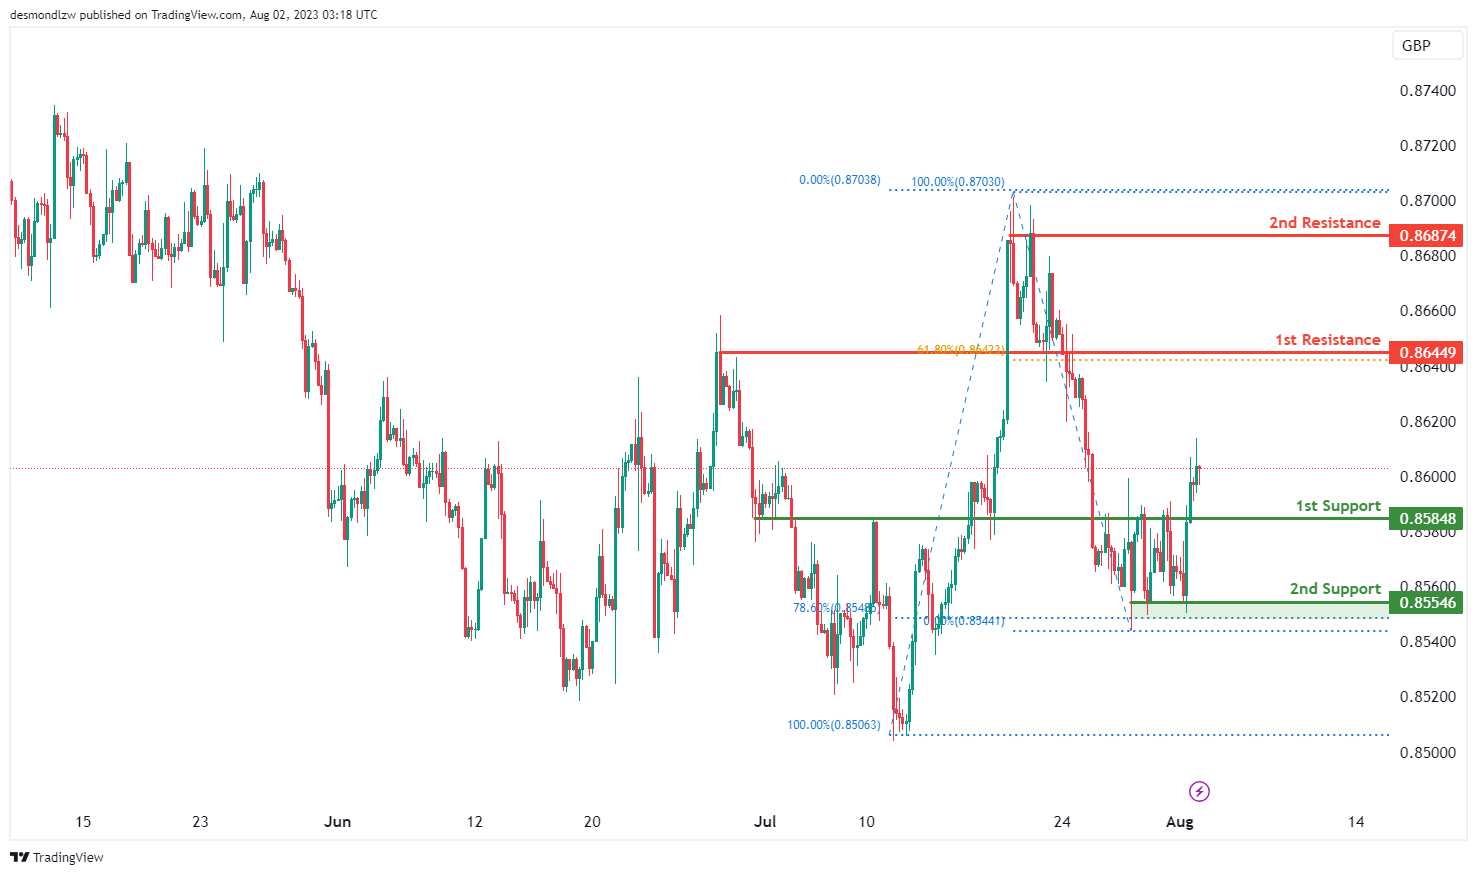
The EUR/GBP chart displays a bullish momentum, indicating the potential for a bullish continuation towards the 1st resistance level at 0.8644. This resistance level is identified as an overlap resistance and also coincides with the 61.80% Fibonacci Retracement, suggesting its significance in potentially halting the price’s upward movement.
To support the bullish scenario, the chart shows 1st and 2nd support levels at 0.8584 and 0.8554, respectively. The 1st support is identified as an overlap support, while the 2nd support represents a multi-swing low support. Both of these levels are essential in providing potential bases for the price and contributing to the overall bullish momentum.
Additionally, there is a 2nd resistance level at 0.8687, recognized as a multi-swing high resistance. This level may act as a crucial point of resistance, potentially limiting the price’s further upward movement.
GBP/USD:
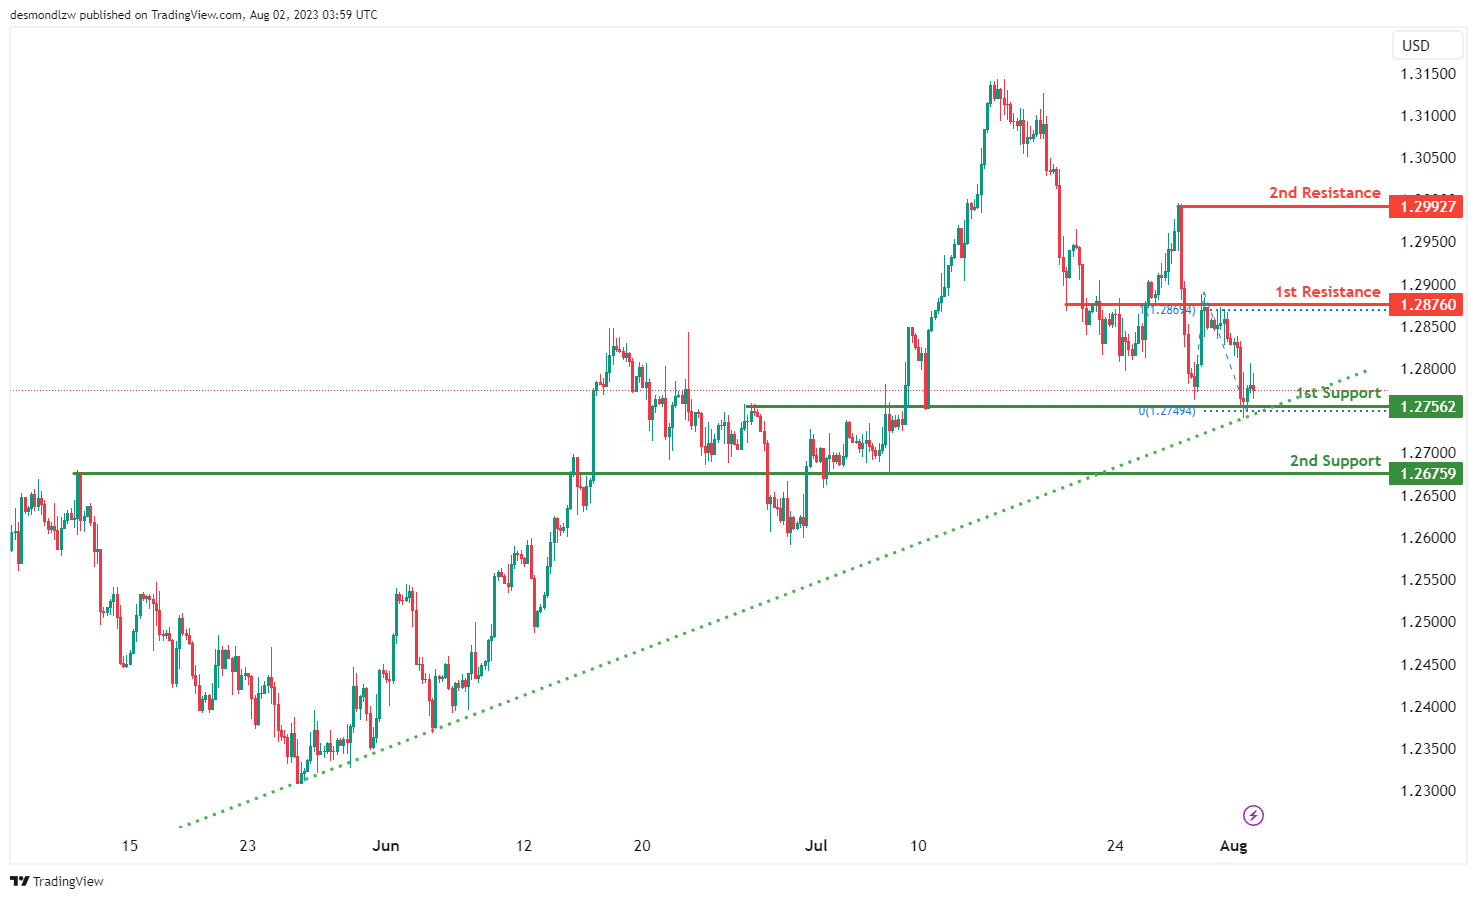
The GBP/USD instrument exhibits a bullish trend, primarily supported by the fact that the price resides above a significant ascending trend line. This positioning suggests a possibility of further bullish momentum.
In this context, a likely scenario could be a bullish continuation towards the 1st resistance level at 1.2876. This resistance level is notable due to its role as an overlap resistance.
On the downside, the 1st support level is at 1.2756, which acts as an overlap support, and could prevent further price decline. If the price drops further, the 2nd support level at 1.2675, another overlap support, could halt this downward progression.
If the price breaks past the 1st resistance level, the 2nd resistance level at 1.2992, marked by a swing high resistance, may present a significant obstacle to additional bullish momentum.
GBP/JPY:
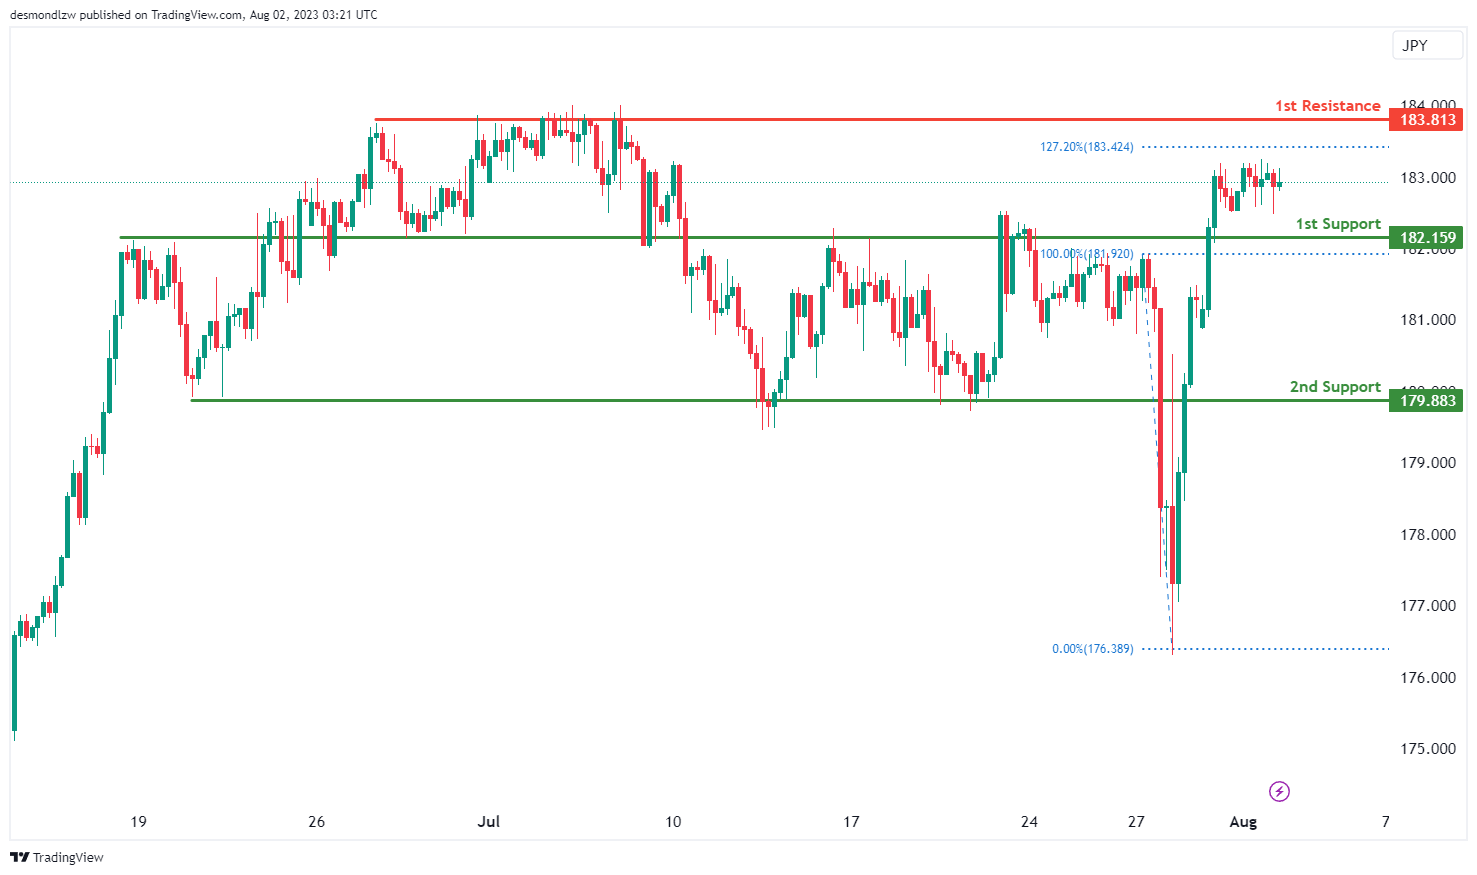
The GBP/JPY chart currently exhibits a neutral momentum, suggesting a lack of clear directional bias. As a result, the price could potentially fluctuate between the 1st support at 182.15 and the 1st resistance at 183.81.
The 1st support level at 182.15 is identified as an overlap support, while the 2nd support at 179.88 is also recognized as an overlap support. These support levels may act as potential barriers, preventing the price from declining further and contributing to the overall neutral momentum.
On the upside, the 1st resistance at 183.81 represents a multi-swing high resistance and also corresponds to the 127.20% Fibonacci Extension level. This resistance level might serve as a crucial point of resistance, potentially restricting the price’s upward movement.
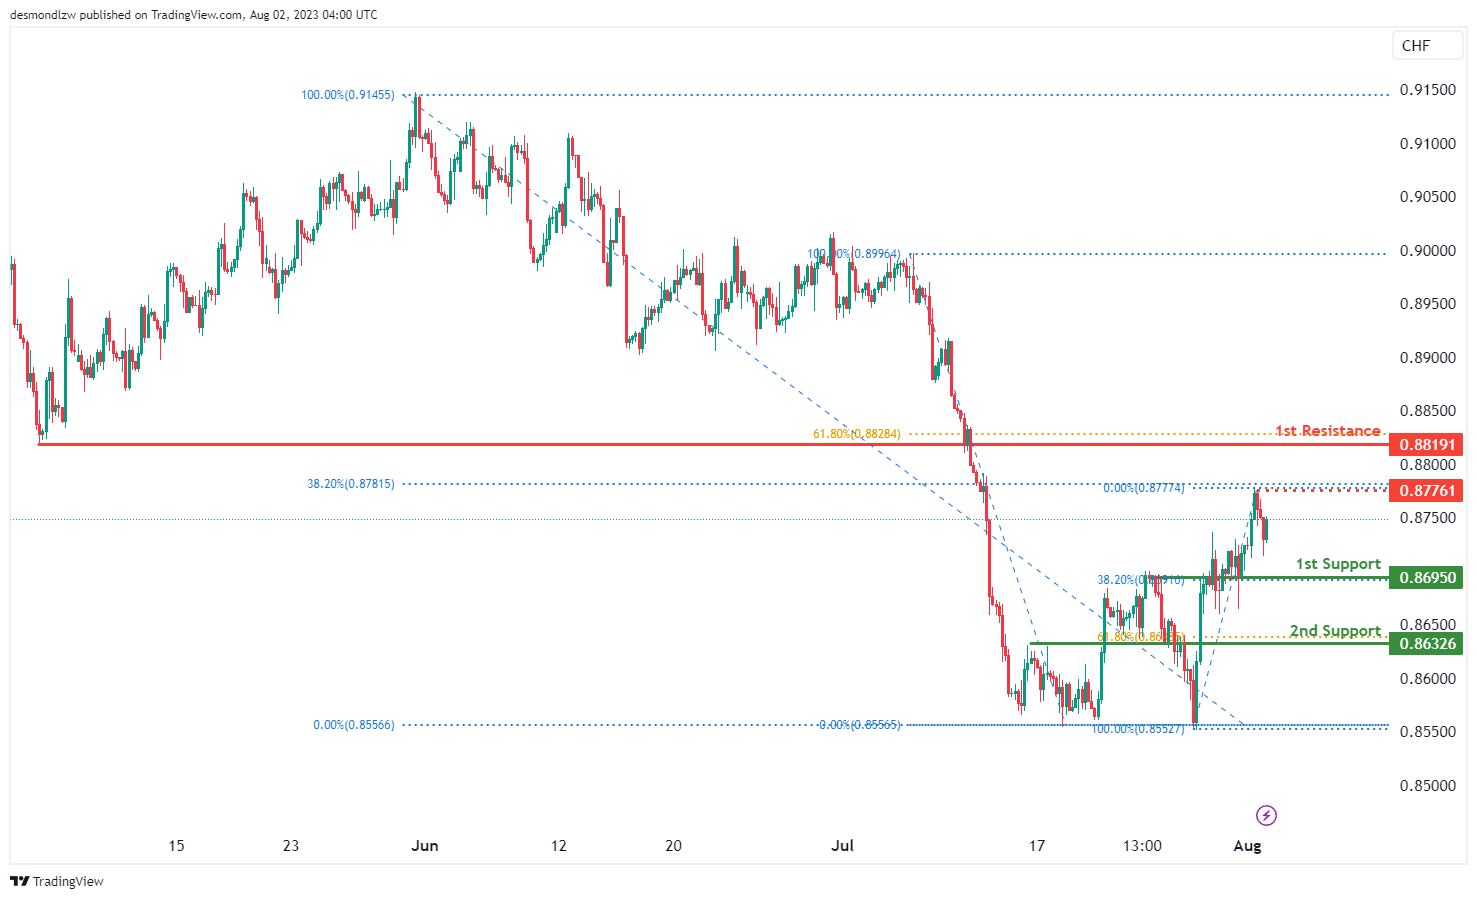
USD/CHF:
The USD/CHF instrument is currently demonstrating a bullish momentum, indicating a potential bullish continuation towards the 1st resistance level at 0.8819. This resistance level holds significance due to its role as a pullback resistance and its alignment with the 61.80% Fibonacci retracement level.
Should the price begin to decline, the 1st support level at 0.8695, serving as an overlap support, aligns with the 38.20% Fibonacci retracement level and could inhibit further price drop. If the price breaks past this level, the 2nd support level at 0.8632, also an overlap support, aligns with the 61.80% Fibonacci retracement level and could provide a further price floor.
In between, the intermediate resistance at 0.8776, notable as a swing high resistance and aligning with the 38.20% Fibonacci retracement level, could pose a significant hurdle for the bullish price movement
USD/JPY:
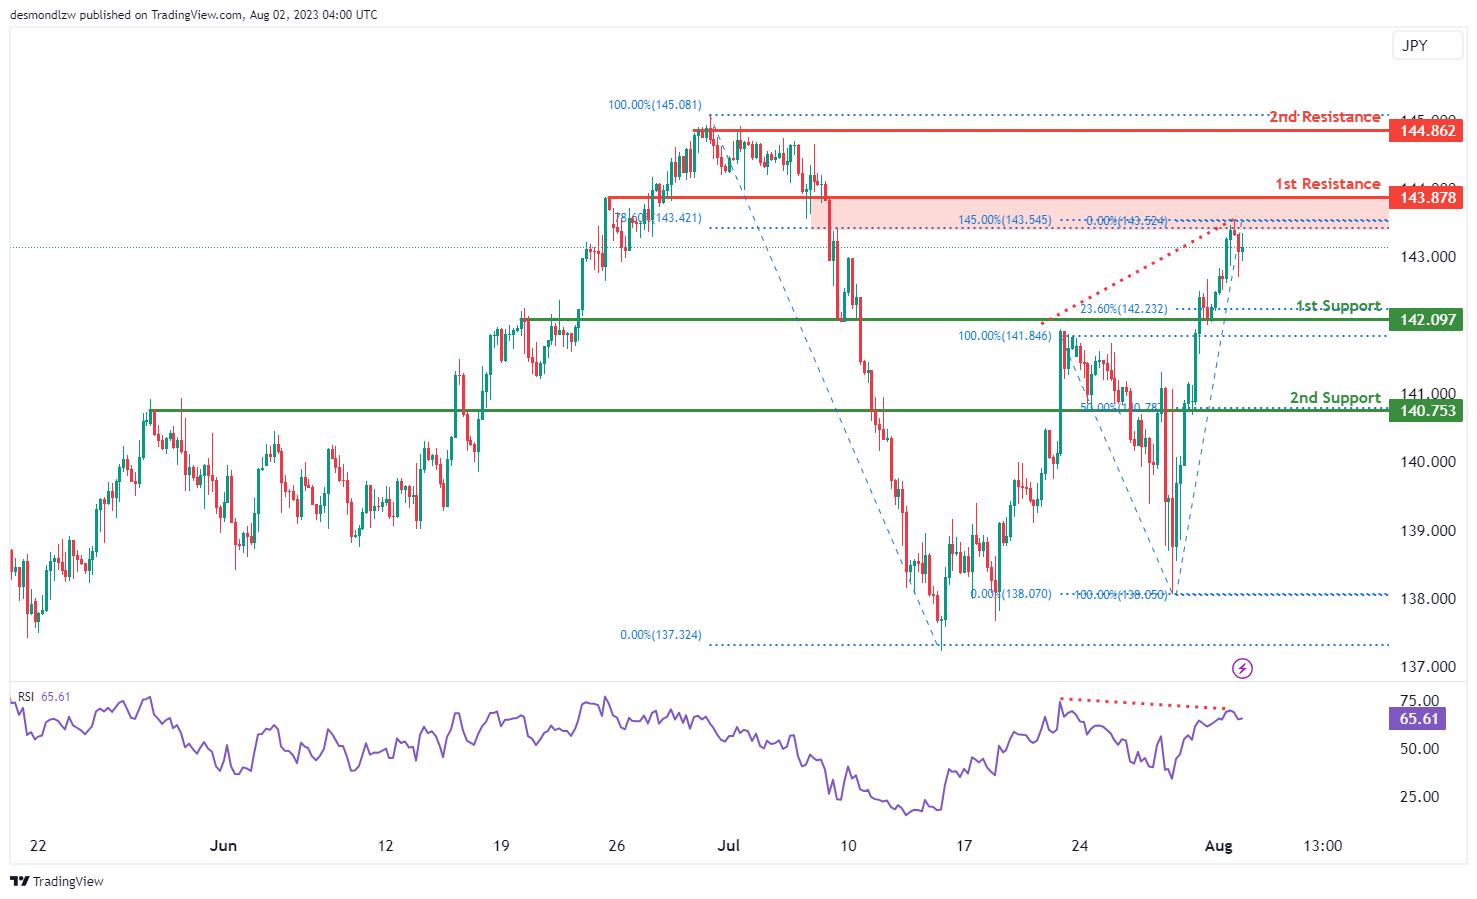
The USD/JPY instrument is currently exhibiting a bearish momentum. Based on this, the price has the potential to continue this bearish movement towards the 1st support level at 142.09. This support level is notable due to its role as an overlap support and its alignment with the 23.60% Fibonacci retracement level.
If the price declines further, the 2nd support level at 140.75, acting as a pullback support, aligns with the 50% Fibonacci retracement level and could act as a solid barrier to additional losses.
On the bearish side, the 1st resistance level at 143.87 is significant due to its role as a pullback resistance. This level aligns with the 78.60% Fibonacci retracement and 145.00% Fibonacci extension, suggesting a Fibonacci confluence that could be challenging for bullish movements.
The 2nd resistance level at 144.86, identified as a multi-swing high resistance, could also serve as a substantial obstacle for price increases.
Adding to the bearish momentum, the Relative Strength Index (RSI) is displaying bearish divergence versus the price, suggesting a potential reversal in the near future.
USD/CAD:
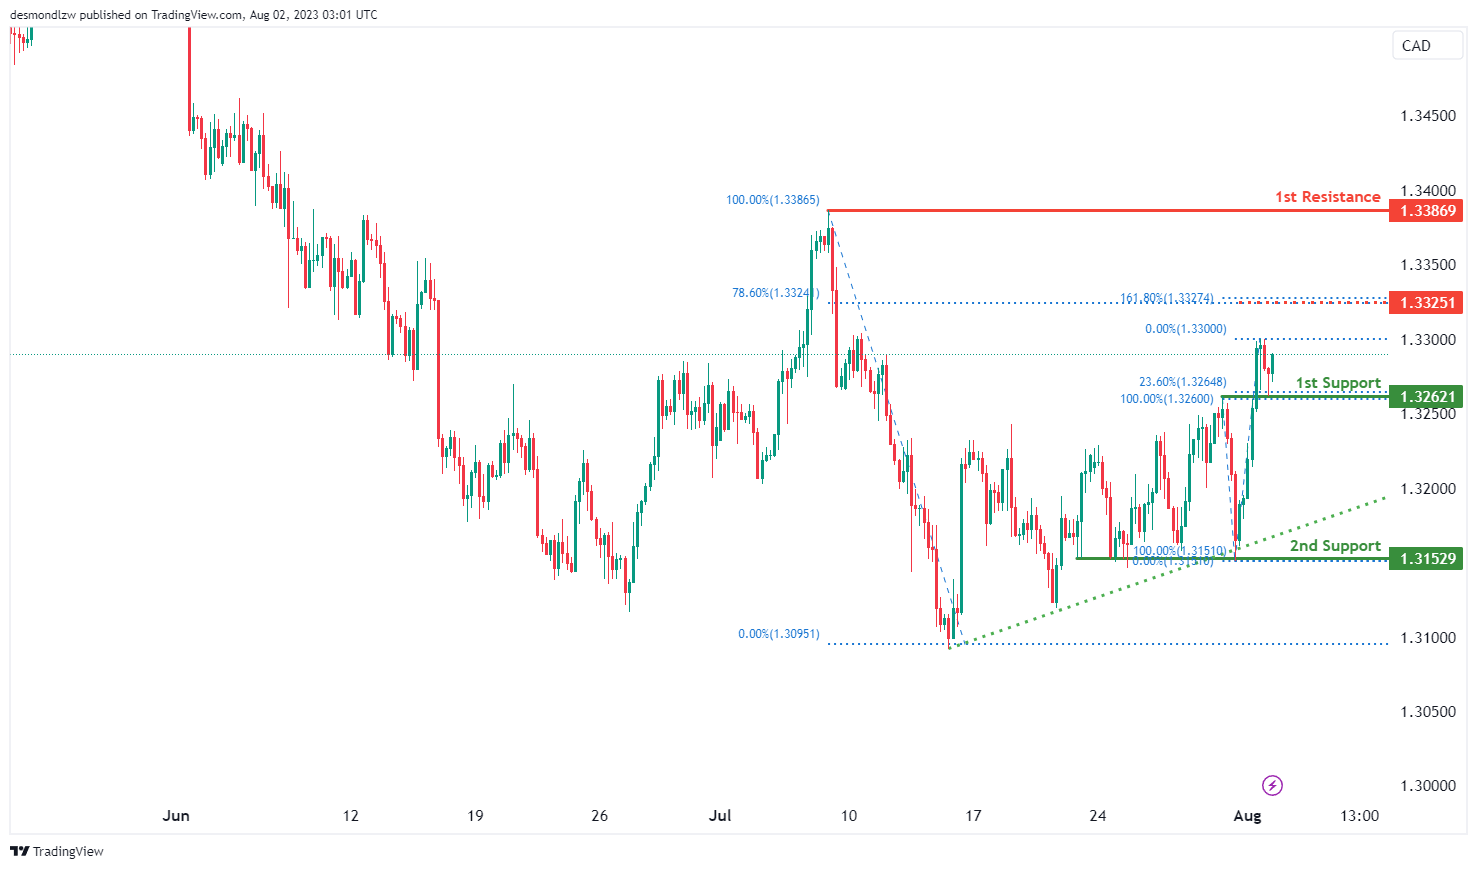
The USD/CAD chart is currently exhibiting a bullish momentum as price has experienced a bullish bounce from the 1st support level at 1.3262, which aligns with both an overlap support and the 23.60% Fibonacci retracement level. In addition, the 2nd support level at 1.3153 represents an overlap support that is significant.
Following this bounce, the price might head towards the intermediate resistance at 1.3325, which plays a crucial role in the potential price movement. This resistance level coincides with an overlap resistance, the 78.60% Fibonacci retracement and the 161.80% Fibonacci extension levels, indicating a strong Fibonacci confluence. In case the bullish momentum strengthens, the 1st resistance is at 1.3387 which represents a significant swing high resistance.
AUD/USD:
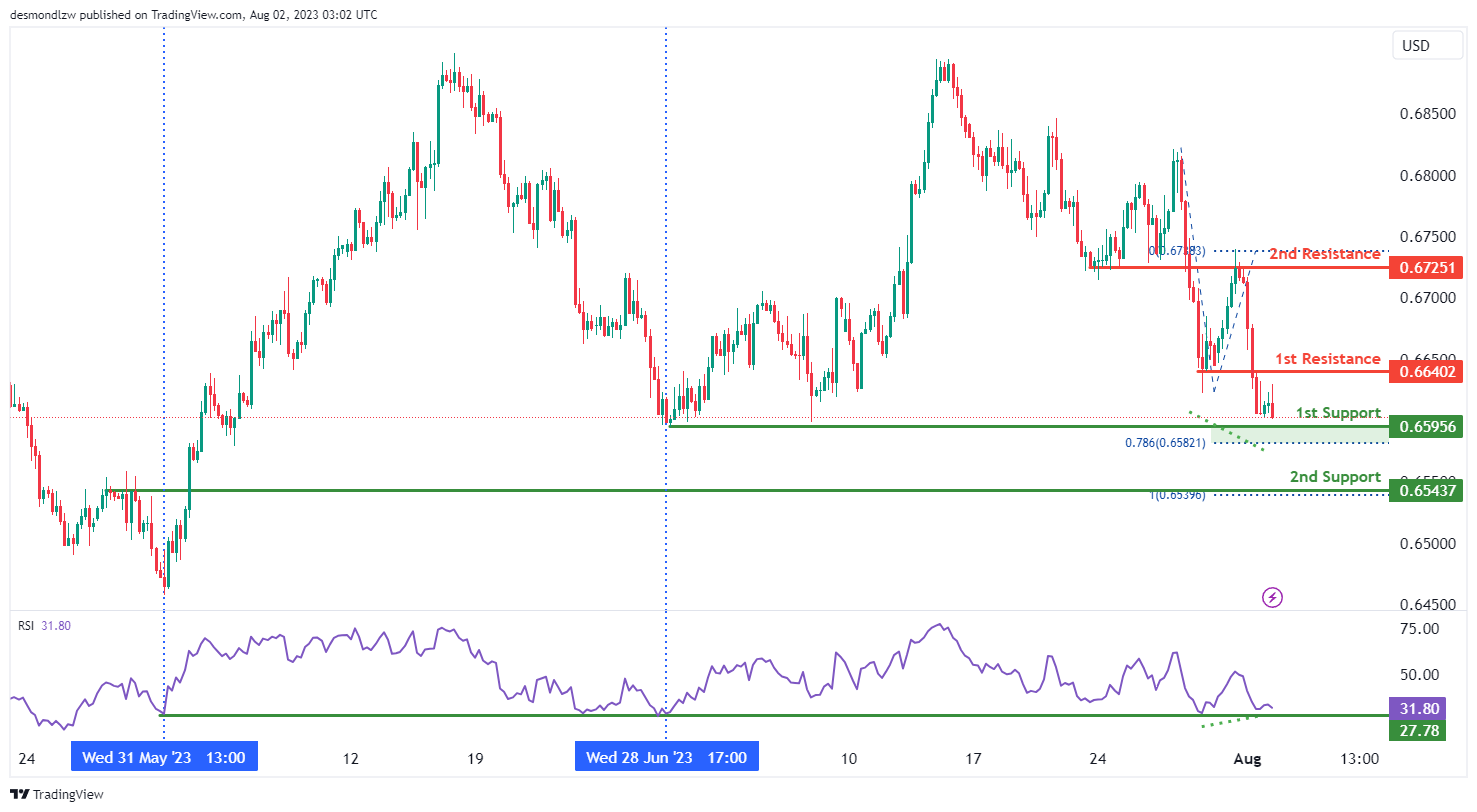
The AUD/USD chart indicates a weak bullish momentum with low confidence. It’s worth noting that the RSI is displaying bullish divergence versus the price, indicating that a potential bounce might occur soon.
A potential scenario suggests that the price might experience a further drop towards the 1st support at 0.6596 in the short term. This support level is essential as it aligns with an overlap support and the 78.60% Fibonacci projection level. From there, a bounce could occur, leading the price towards the 1st resistance at 0.6640, which represents another significant overlap resistance.
If the bullish momentum strengthens, the price may face further resistance at the 2nd resistance level of 0.6725, which also serves as an important overlap resistance. If price does not bounce off the 1st support level, the 2nd support level at 0.6544 represents a pullback support that coincides with the 100.00% Fibonacci projection level.
NZD/USD
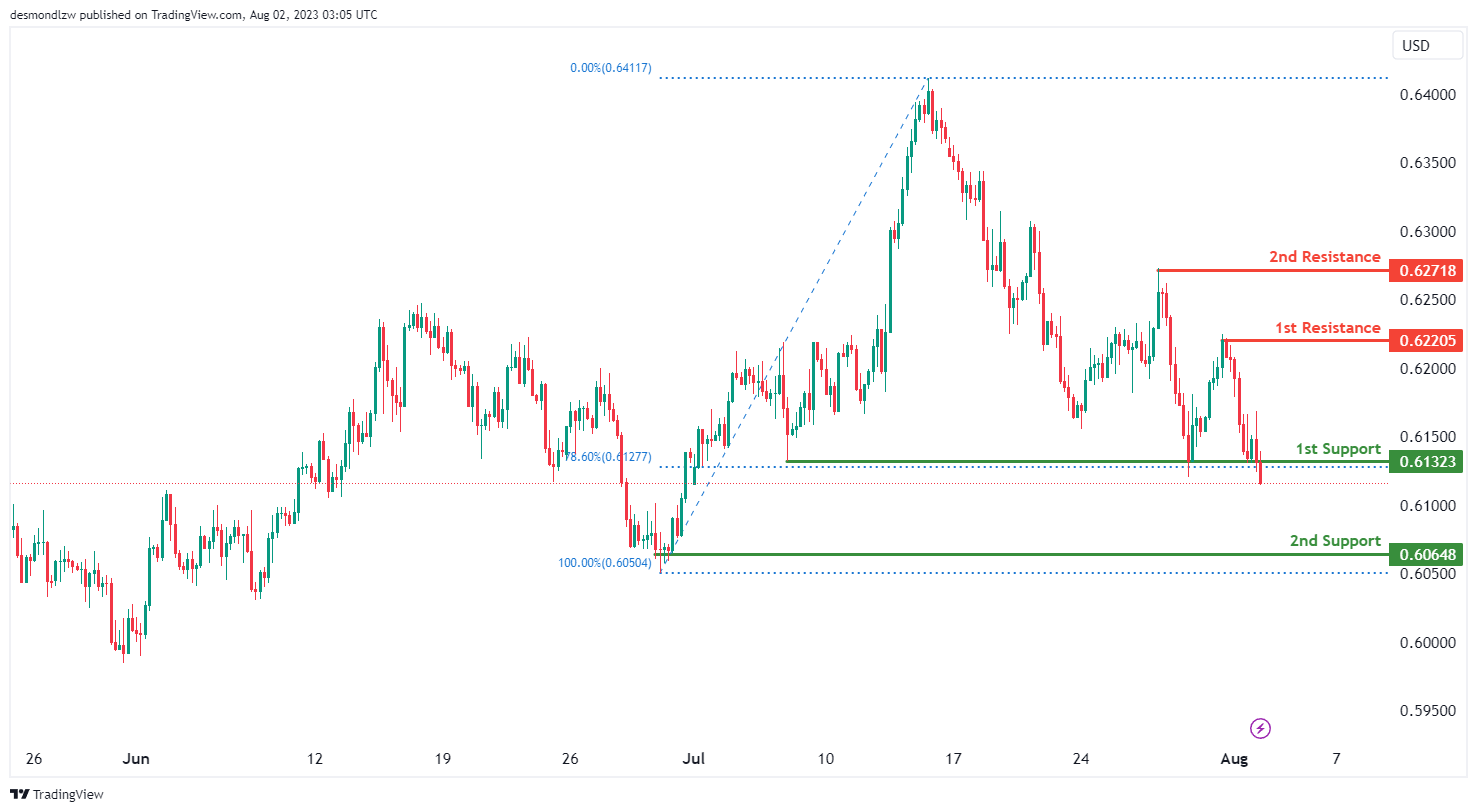
The NZD/USD chart indicates a bearish momentum as price has broken below the 1st support level at 0.6132 this morning, which is a significant area as it aligns with an overlap support and the 78.60% Fibonacci retracement level. This bearish momentum could lead to a drop towards the 2nd support at 0.6065, which also acts as another essential overlap support.
On the upside, the 1st resistance at 0.6221 represents a notable swing high resistance level. Further upward movement may face resistance at the 2nd resistance at 0.6272, which also serves as a significant swing high resistance.
DJ30:
The DJ30 chart indicates a bullish momentum, suggesting a potential bullish continuation towards the 1st resistance level.
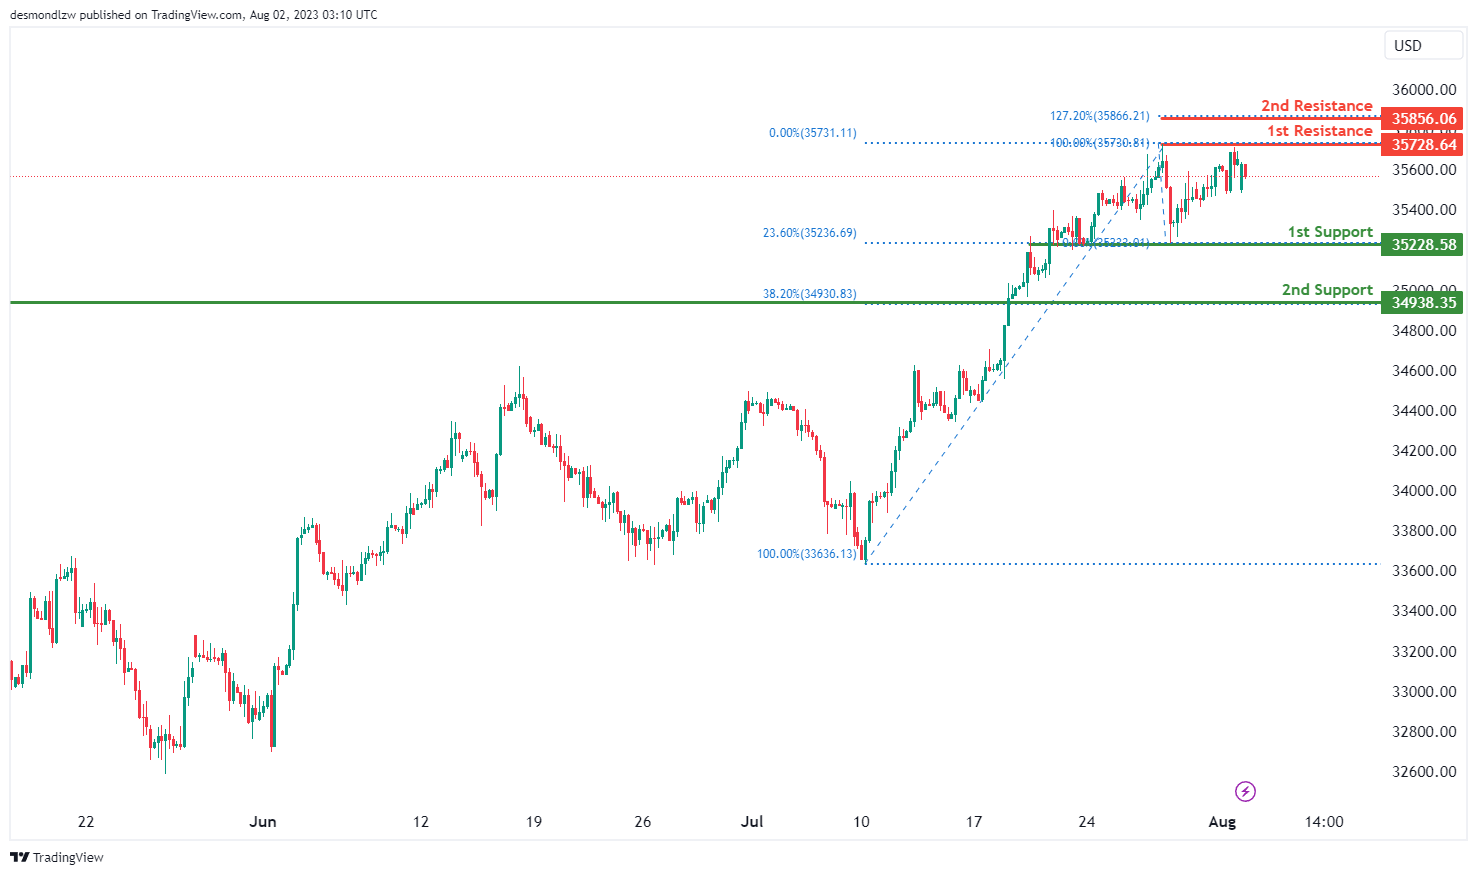
For this scenario, the 1st support at 35228.58 is a significant area as it coincides with the 23.60% Fibonacci retracement, serving as an overlap support. Additionally, the 2nd support at 34938.35 acts as a pullback support, corresponding to the 38.20% Fibonacci retracement.
On the upside, the 1st resistance at 35728.64 represents a crucial swing high resistance. Furthermore, the 2nd resistance at 35867.78 is identified as the 127.20% Fibonacci extension, potentially acting as another significant level.
GER30:
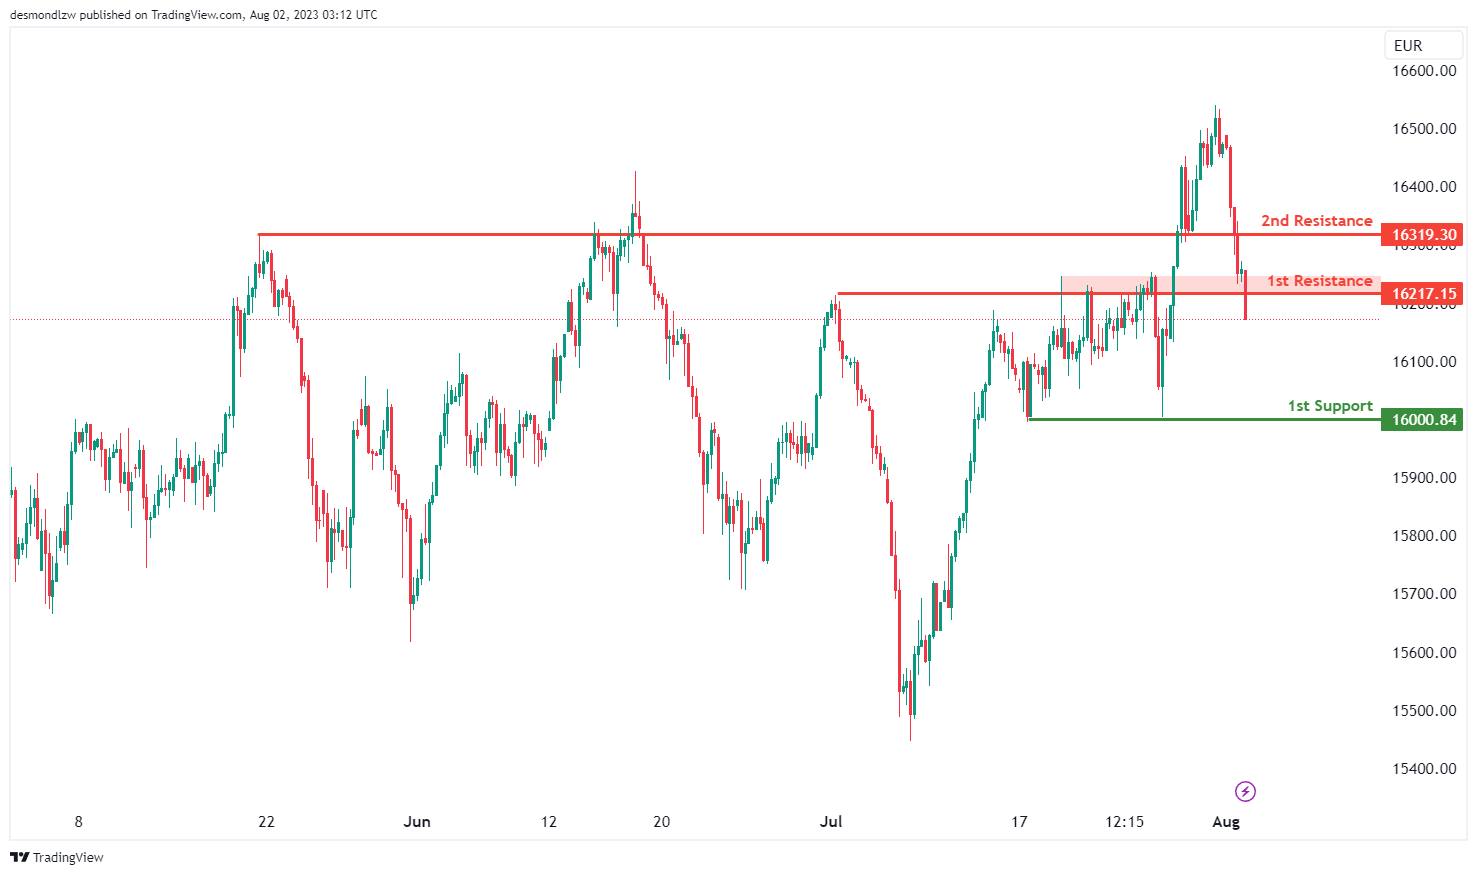
The GER30 chart displays a bearish momentum, suggesting the potential for a bearish continuation towards the 1st support level at 16000.84. This support level is identified as multi-swing low support, indicating its significance in potentially halting the price’s downward movement and providing a potential bounce.
On the upside, the chart shows 1st and 2nd resistance levels at 16217.15 and 16319.30, respectively. Both of these levels are recognized as overlap resistances, indicating their importance in potentially limiting the price’s upward movement and causing a pullback.
US500
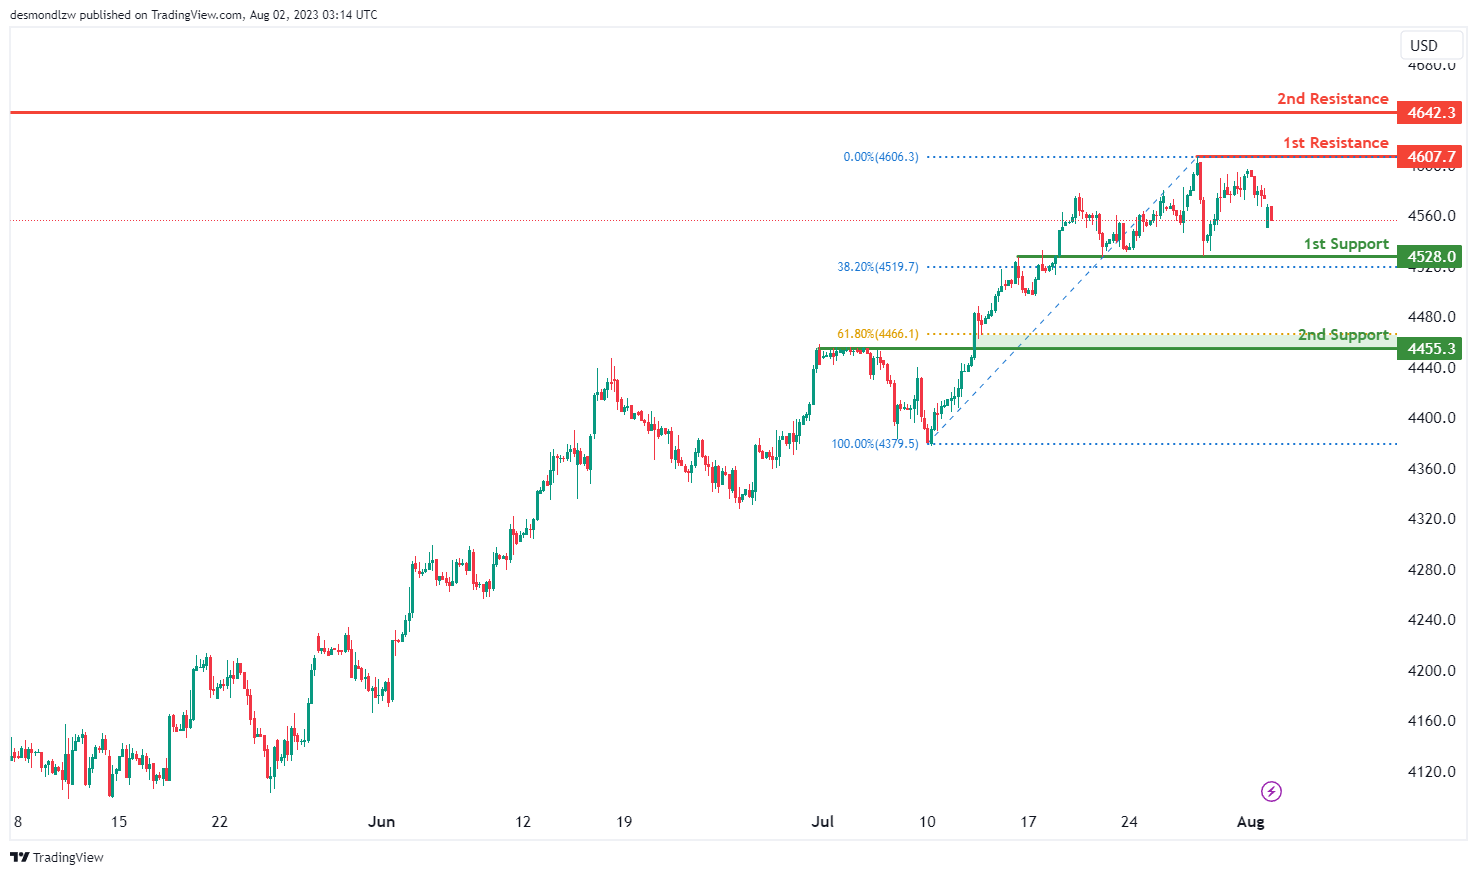
The US500 chart indicates a bearish momentum, suggesting the potential for a bearish continuation towards the 1st support level at 4528.0. This support level is identified as a pullback support and aligns with the 38.20% Fibonacci retracement, adding to its significance in potentially halting the price’s downward movement and causing a bounce.
Additionally, there is a 2nd support level at 4455.3, which is also recognized as a pullback support and corresponds to the 61.80% Fibonacci retracement. This further strengthens its potential as a critical level of support.
On the upside, the chart shows 1st and 2nd resistance levels at 4607.7 and 4642.3, respectively. Both of these levels are recognized as swing high resistances, indicating their importance in potentially limiting the price’s upward movement and causing a pullback.
BTC/USD:
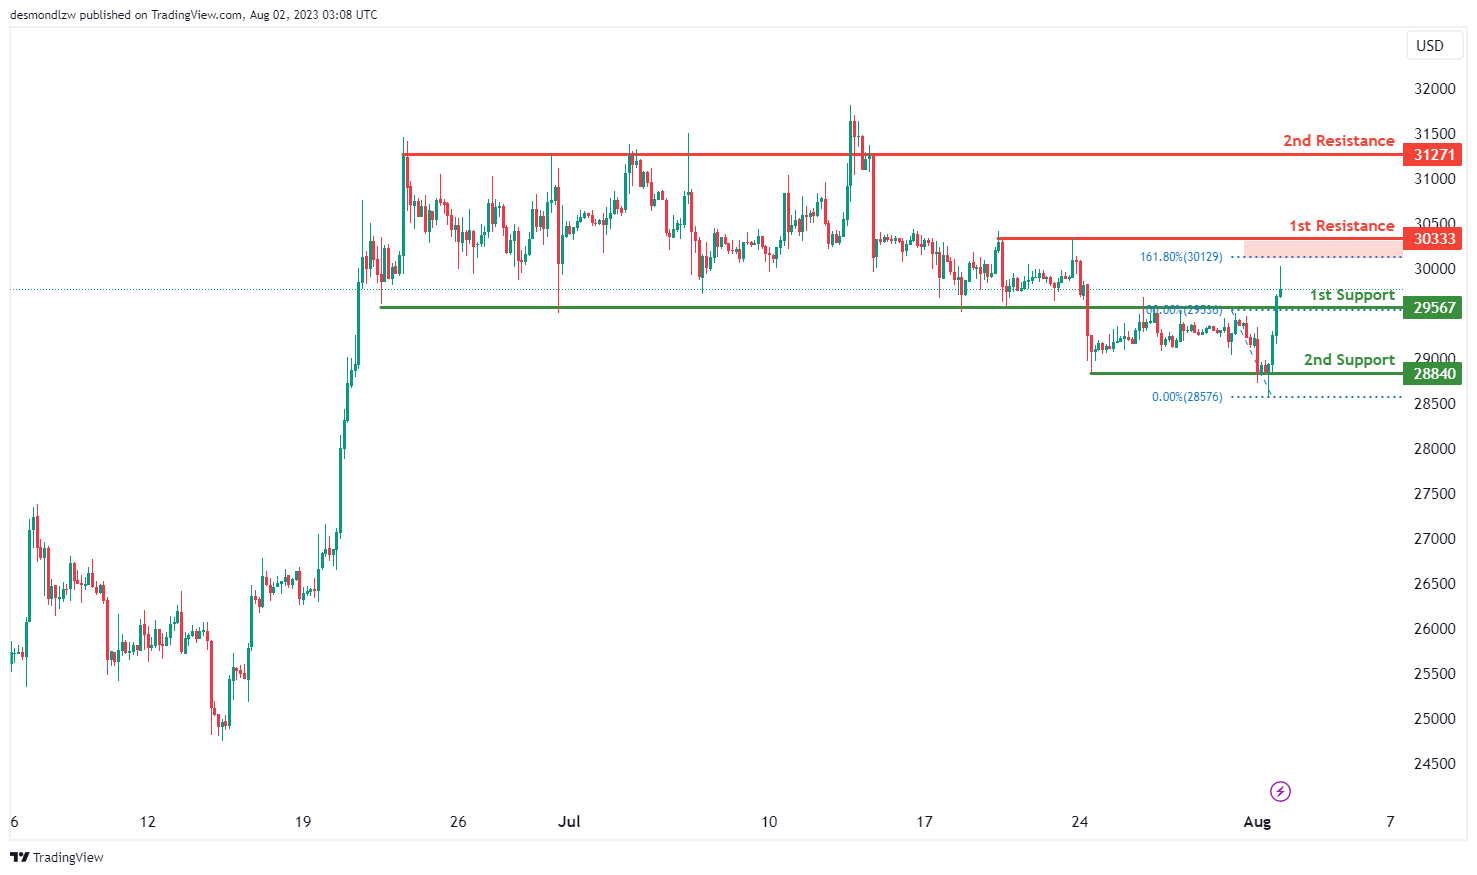
The BTC/USD chart indicates a bullish momentum, suggesting the potential for a bullish continuation towards the 1st resistance level at 30333. This resistance level is significant as it aligns with multi-swing high resistance and also coincides with the 161.80% Fibonacci Extension, adding to its importance as a possible barrier for further upward movement.
For potential downward movements, the chart has 1st and 2nd support levels at 29567 and 28840, respectively. The 1st support is recognized as pullback support, while the 2nd support corresponds to multi-swing low support, both indicating possible levels where the price may find temporary stability and bounce higher.
On the upside, the 2nd resistance at 31271 represents another relevant level as it is an overlap resistance, indicating its potential significance in capping the price’s upward movement.
ETH/USD:
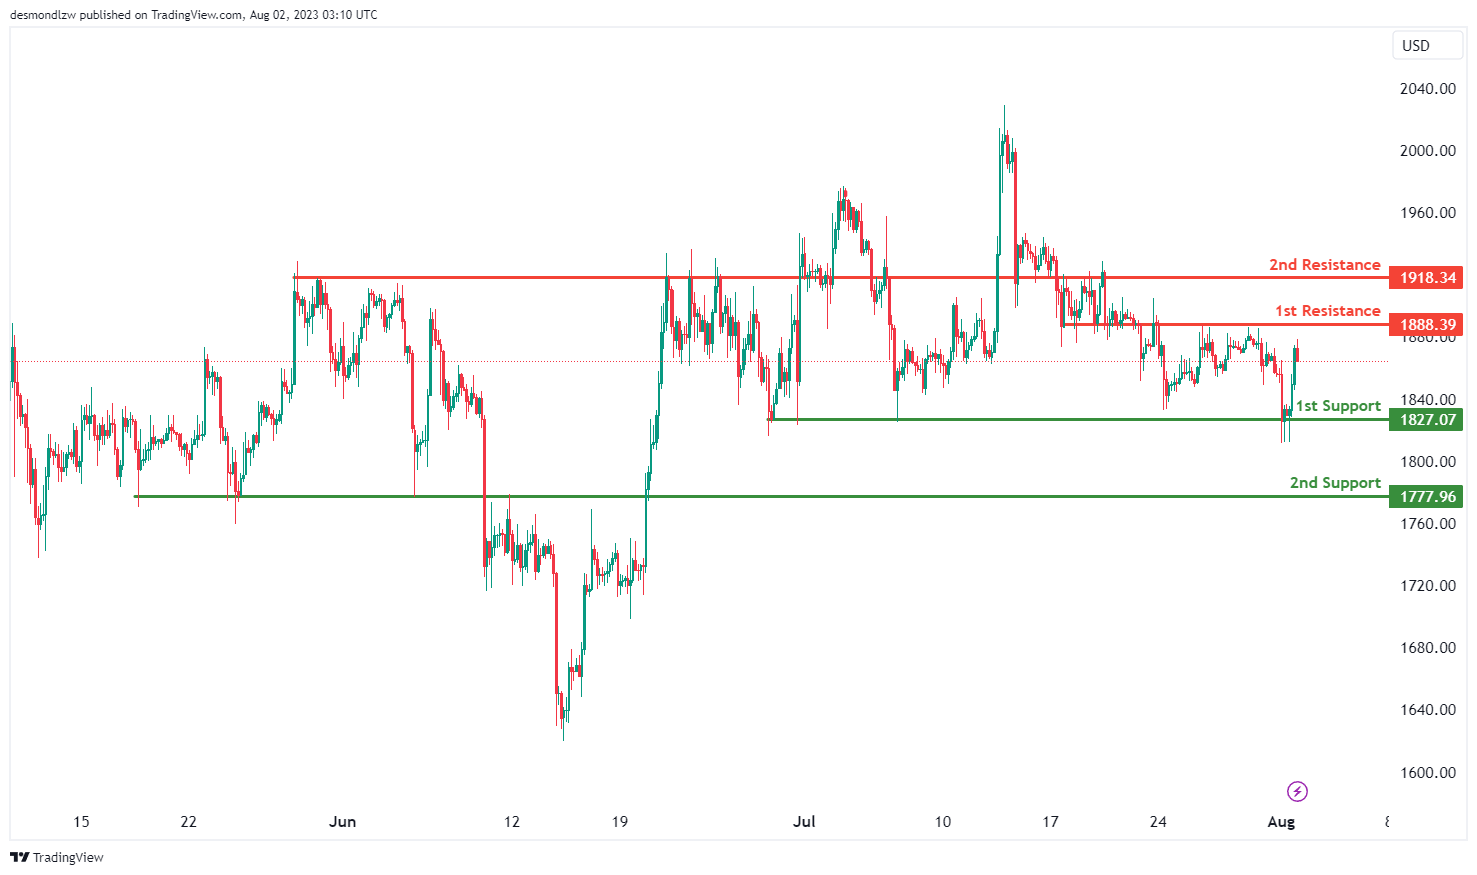
The ETH/USD chart exhibits a bullish momentum, suggesting the potential for a bullish continuation towards the 1st resistance level at 1888.39. This resistance level is recognized as an overlap resistance, indicating its significance in potentially halting the price’s upward movement.
For potential downward movements, the chart has 1st and 2nd support levels at 1827.07 and 1777.96, respectively. The 1st support is identified as multi-swing low support, while the 2nd support serves as an overlap support, both indicating possible levels where the price may find temporary stability and bounce higher.
On the upside, the 2nd resistance at 1918.34 represents another relevant level, adding to its importance as it also coincides with an overlap resistance.
WTI/USD:
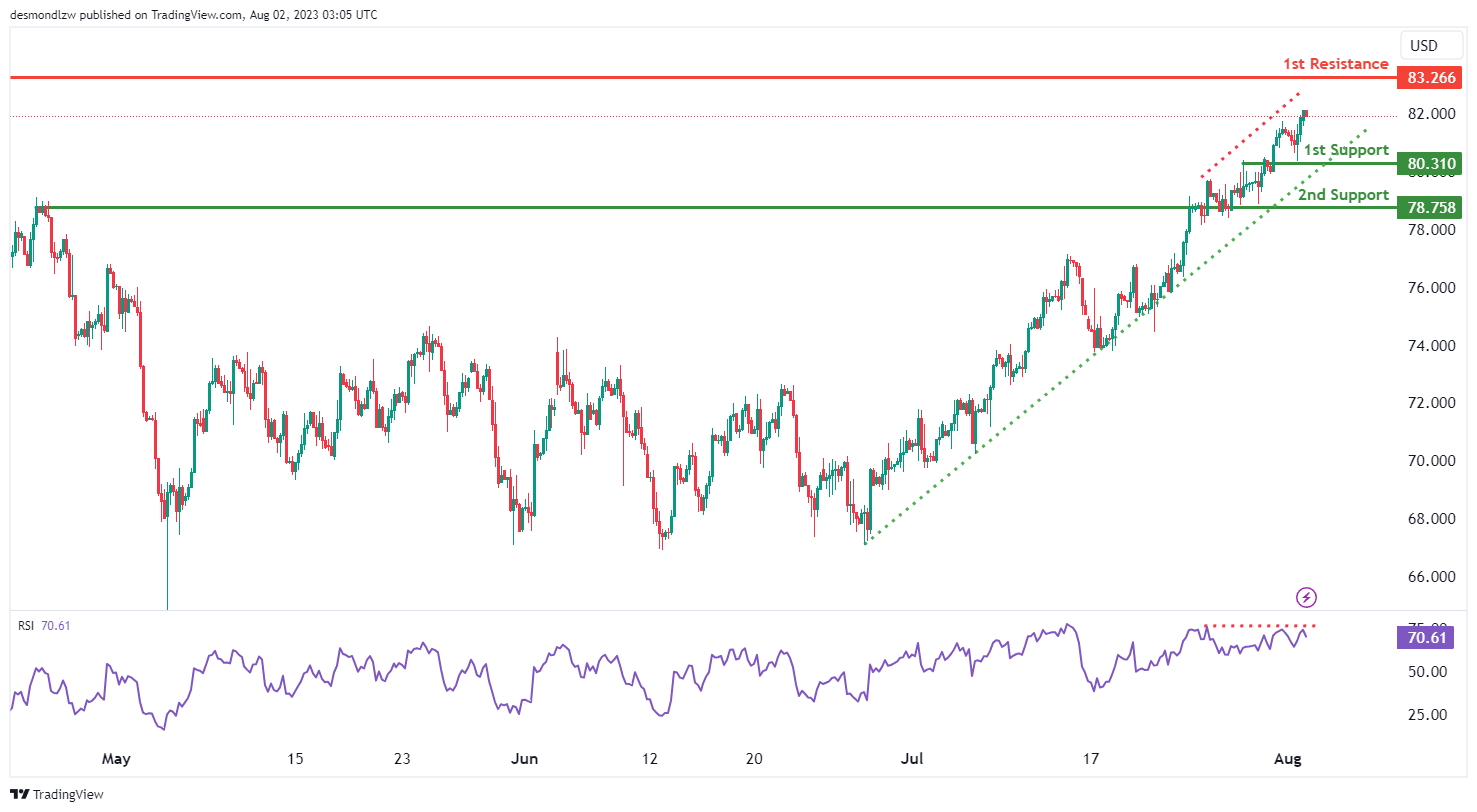
The WTI/USD chart currently shows a weak bearish momentum with low confidence. There is a potential scenario for a bearish continuation towards the 1st support level at 80.31, which is an overlap support. If the bearish momentum persists, the price might further drop towards the 2nd support at 78.76, which also acts as another overlap support.
On the upside, the 1st resistance at 83.27 is considered an overlap resistance, suggesting a potential barrier for upward movement.
It is also worth noting that the RSI is displaying bearish divergence versus price, indicating a possible weakening of the current uptrend and a potential rapid decline in price.
XAU/USD (GOLD):
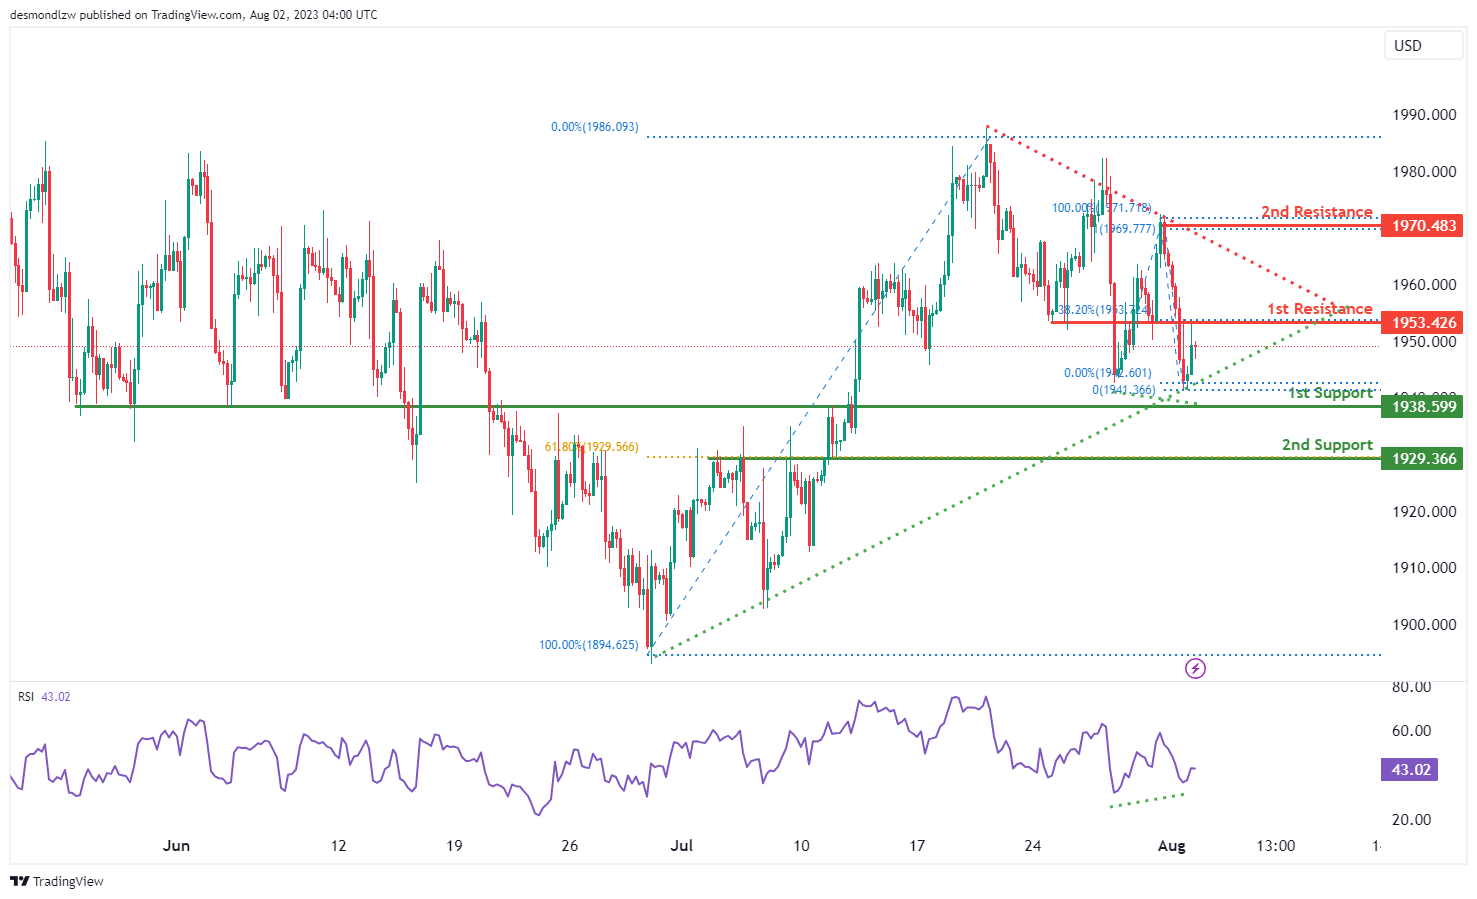
The XAU/USD instrument is currently displaying neutral momentum. Accordingly, the price could potentially fluctuate between the 1st resistance and the 1st support level.
The 1st support level at 1938.59, which acts as an overlap support, serves as a critical barrier for potential downward movements. If the price falls further, the 2nd support at 1929.36, representing a pullback support and aligning with the 61.80% Fibonacci retracement, could provide a strong level of support.
On the upside, the 1st resistance level is at 1953.42. This level is significant due to its role as an overlap resistance and its alignment with the 38.20% Fibonacci retracement. The 2nd resistance level at 1970.48, identified as a swing high resistance, aligns with the 100% Fibonacci projection, potentially challenging further bullish progressions.
The chart pattern is currently forming a symmetrical triangle, often interpreted as a period of consolidation before a decisive movement. A breakout above the upper trendline could signal a bullish trend, while a breakdown below the lower trendline might indicate a bearish trend.
AUD/USD Could Tumble Below This Key Support
Key Highlights
- AUD/USD is struggling to stay above the 0.6600 support zone.
- It traded below a major bullish trend line with support at 0.6740 on the 4-hour chart.
- EUR/USD is consolidating below the 1.1050 pivot level.
- The US ADP employment could change 189K in July 2023, down from 497K.
AUD/USD Technical Analysis
The Aussie Dollar started a fresh decline from the 0.6900 zone against the US Dollar. AUD/USD declined below the 0.6800 and 0.6750 support levels.
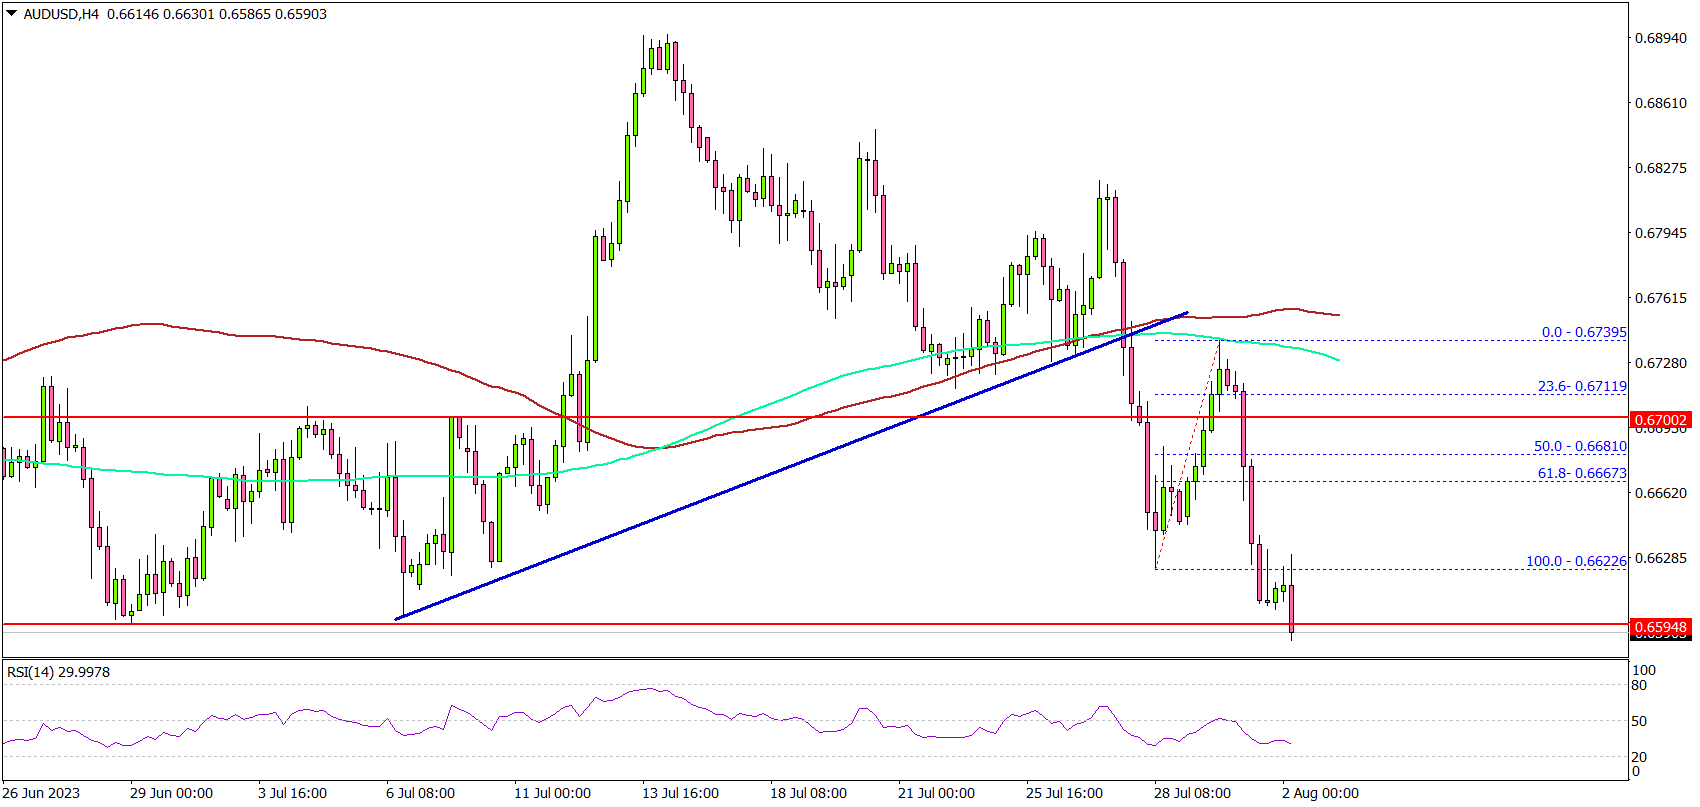
Looking at the 4-hour chart, the pair even traded below a major bullish trend line with support at 0.6740. There was a close below the 0.6650 support, the 100 simple moving average (red, 4 hours), and the 200 simple moving average (green, 4 hours).
The pair is now struggling to stay above the 0.6600 support zone. If there is a daily close below the 0.6600 support, there is a risk of a sharp decline.
The next major support is near 0.6550, below which AUD/USD could slide toward the 0.6520 zone. On the upside, the pair is facing resistance near the 0.6660 level. The first major resistance is near 0.6740 and the 100 simple moving average (red, 4 hours).
A close above the 0.6740 resistance could push the pair toward 0.6760. Any more gains could start a fresh increase toward the 0.6900 level.
Looking at EUR/USD, the pair corrected lower and is now consolidating below the 1.1050 pivot level.
Economic Releases
- US ADP Employment Change for July 2023 - Forecast 189K, versus 497K previous.
Fitch cuts US sovereign rating on steady deterioration in standards of governance
Asian stock markets took a significant plunge following Fitch Ratings' surprise decision to downgrade US sovereign rating from AAA to AA+. This move mirrors S&P Global Ratings' decision made over a decade ago, causing considerable unrest among investors.
Fitch's statement highlighted, "In Fitch's view, there has been a steady deterioration in standards of governance over the last 20 years, including on fiscal and debt matters, notwithstanding the June bipartisan agreement to suspend the debt limit until January 2025."
US Treasury Secretary Janet Yellen fiercely contested the downgrade, calling it "arbitrary and based on outdated data." The White House has also voiced opposition to Fitch's assessment, with press secretary Karine Jean-Pierre declaring, "It defies reality to downgrade the United States at a moment when President Biden has delivered the strongest recovery of any major economy in the world."
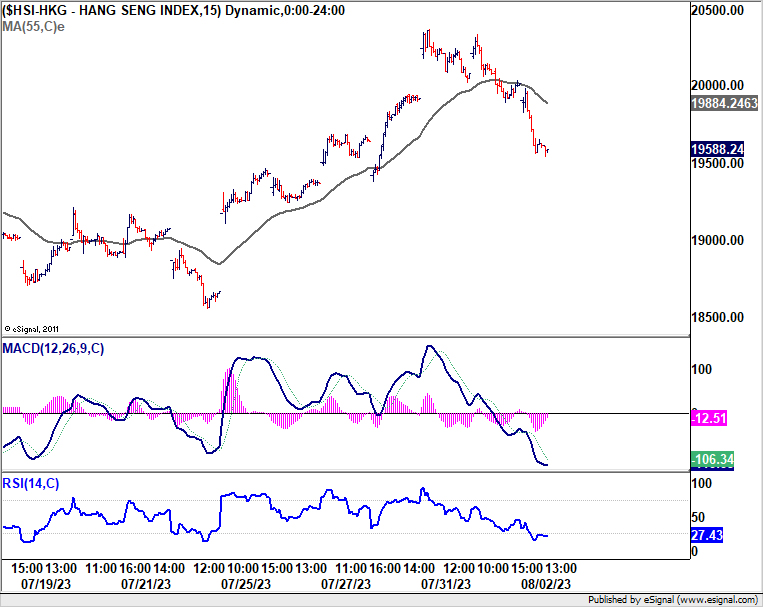
Both Nikkei and HSI are down more than -2% at the time of writing.
BoJ Uchida: Monetary easing to continue to nurture firms’ changing pricing strategies
BoJ Deputy Governor Shinichi Uchida highlighted in a speech today an emerging trend in firms' pricing strategies, noting that "firms are developing more forward-looking strategies for setting prices." According to Uchida, these changes "might be the chance to finally change Japan's economy." Hence, he emphasized BoJ will "patiently continue with monetary easing to carefully nurture these signs."
Uchida was explicit in outlining the Bank's monetary policy stances. Firstly, he ruled out near-term adjustments to short-term interest rate, currently at -0.10%, stating "there is still a long way to go before such decisions are made."
Secondly, BoJ will "maintain the current framework" until sustainable and stable achievement of 2% inflation target "come in sight".
Thirdly, Uchida affirmed the ongoing yield curve control under the present policy framework, aiming to balance its benefits and drawbacks, especially in relation to financial intermediation and the market.
Despite the high economic and price outlook uncertainty, Uchida stated the recent yield curve control modification, allowing the 10-year JGB yield to rise to up to 1%, is aimed at sustaining the ultra-loose policy. "Needless to say, we do not have an exit from monetary easing in mind," he emphasized.
New Zealand employment up 1% in Q2, wage inflation unchanged at 4.3% yoy
New Zealand reported a better-than-expected employment growth of 1.0% in the second quarter of 2023, surpassing market expectations of a 0.6% rise. On the other hand, unemployment rate slightly increased from 3.4% to 3.6%, marginally above the anticipated 3.5%.
The data released showed that employment rate rose from 69.6% to 69.8%, and the participation rate increased from 72.0% to 72.4%. These are the highest rates recorded since the series began in 1986.
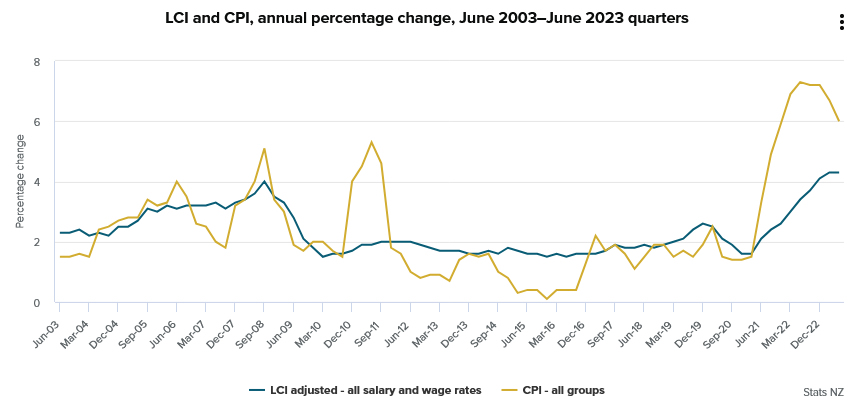
In terms of wage growth, all sector wage inflation climbed by 1.1% on a quarterly basis, resulting in an annual increase of 4.3%. "Annual wage costs continued to increase at historically high rates this quarter, equal to the 4.3 percent annual increase last quarter," said Bryan Downes, business prices delivery manager.
Downes noted that the most significant contribution to the Labour Cost Index for the June 2023 quarter came from retail trade and accommodation industry. This sector witnessed 1.5% increase in wages on a quarterly basis, following 0.7% rise in the previous quarter. The wage growth in this industry was primarily driven by rise in minimum wage, thereby pushing up overall wage growth during the quarter.
Fed Bostic warns of overtightening risks, advocates for cautious approach
Yesterday, Atlanta Fed President Raphael Bostic expressed guarded optimism and highlighted the "significant progress" in controlling inflation. He observed, "Inflation is well off its highs that we saw in the last year. And recent numbers have come in promising in ways that suggest that we might be seeing continued declines."
Bostic pointed to the ongoing economic evolution as in line with an "orderly slowdown," which he views as "quite promising". As such, he advocated to be cautious, patient and resolute" in policy-making.
He also voiced concerns about the risk of overtightening monetary policy. "I think we are in a phase now where there is some risk of us overtightening. And so we've just got to have that in mind," he said. By exercising appropriate caution, Bostic believes that the damage to employment can be minimized.
Looking forward, Bostic said, "My baseline outlook doesn't contemplate any cuts until the second half of next year at the earliest." He insists on being "resolute to make sure that we don't move our policy posture in a different direction until we're absolutely, absolutely certain that inflation is going to get to our target."