Sample Category Title
RBNZ to Hold in August; But a Hike Still Likely Before Year End
- We continue to see the RBNZ raising the cash rate to 5.75%, but in November instead of August.
- Evidence has accumulated suggesting persistent inflation pressures as feared.
- The economy is slowing from a very overheated position but is still growing.
- Even so, recent data have likely not been strong enough to overcome the RBNZ's strong bias to keep the OCR at 5.5%
- We think the theme of economic resilience and sticky inflation will persist and will eventually force the RBNZ to act.
- With the current sticky domestic inflation pressures likely to ease only gradually, we see a slow rate reduction cycle beginning in the second half of 2024.
Since May 2023, we have had the view that the RBNZ would need to tighten policy further to ensure a timely fall of inflation to the 1-3% target range. This view was predicated on a sense that current very high rates of inflation would be slow to recede and that risks to the inflation outlook were tilted to a slower-than-needed fall. Strong net migration was seen as supporting both the housing market and the economy right at the time the RBNZ would have hoped that growth would be quickly slowing and providing much needed disinflationary impetus.
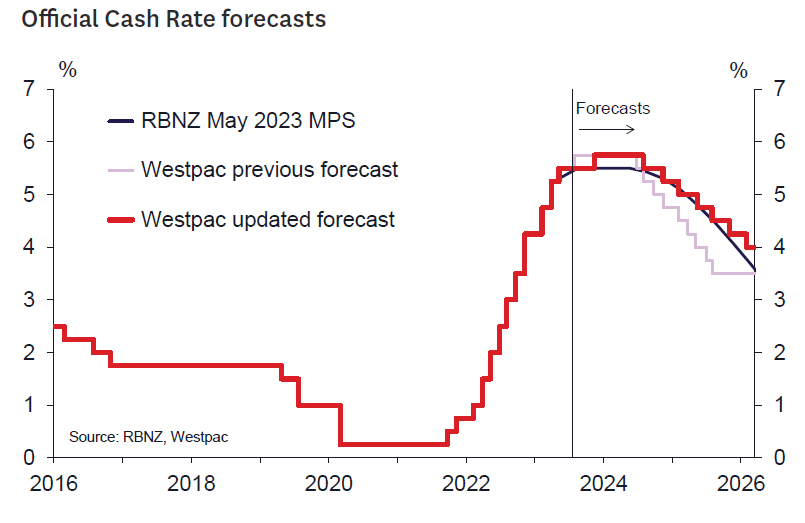
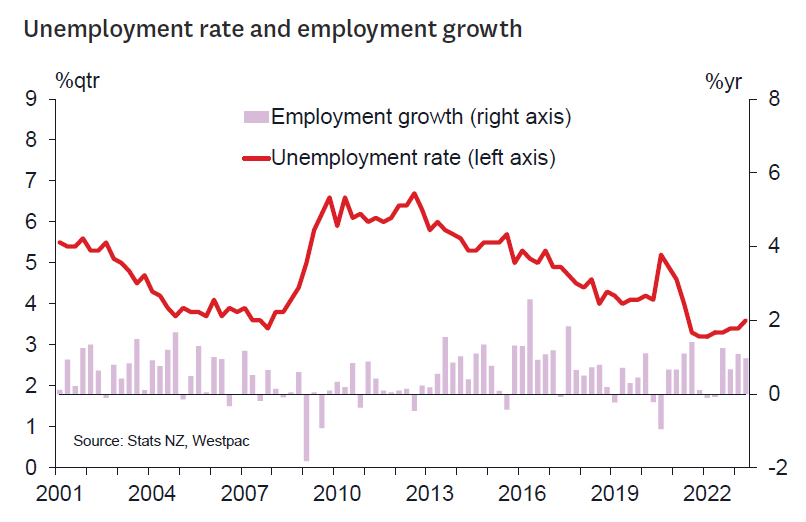
In large part, the accumulated evidence has supported our view. While GDP in the March quarter was somewhat weaker than expected, we also can see tangible signs that strong migration is supporting the economy. The housing market has exhibited strength compared to the relatively dire predictions of commentators earlier this year. Business and consumer confidence have bottomed out and are staging a tentative recovery, which is unusual if the end of the tightening cycle has been reached. The labour market has been a particular area of strength. Employment growth has remained strong in defiance of concerns of a recessionary economy. Large numbers of migrants have found jobs in a labour market that, while better balanced than a year ago, remains tight. The strong labour market has meant that household incomes have continue to grow strongly, leaning against the considerable disinflationary impact of the RBNZ's 525 bps of interest rate increases delivered in recent years.
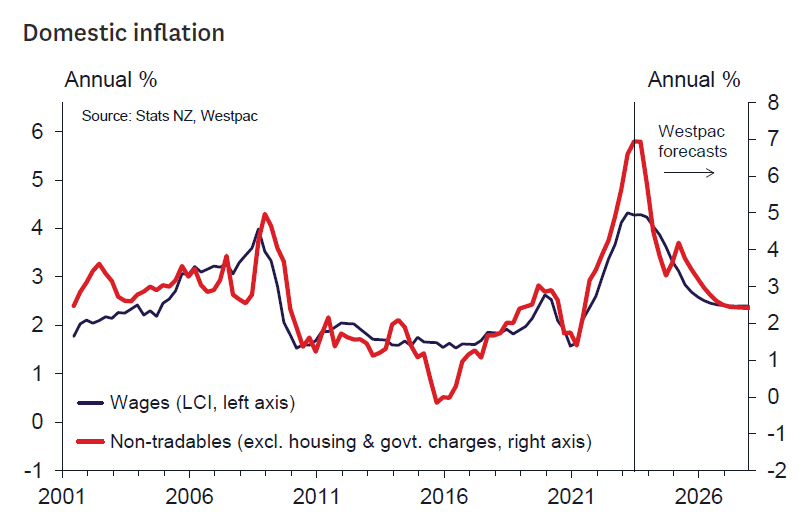
The June quarter CPI provided a timely reminder of upside risks to the inflation outlook. While annual headline inflation fell to 6%, in line with projections, lower imported inflation masked widespread and unexpectedly strong home grown non-tradables inflation. Non-tradables inflation is the part of inflation most impacted by RBNZ policy and fell only slightly to 6.6%. More generally, overall inflation remains far north of the promised land of the 1-3% target range. However, this strong and potentially concerning data needed to overcome the RBNZ's very strong bias to keep the OCR steady at 5.5% until the second half of next year. A high hurdle was in place, and we don't see the evidence as sufficient to move the RBNZ in August.
We retain confidence that recent trends will continue. The economy will likely continue to be supported by ongoing strong migration, the housing market will continue to strengthen, and inflation will only slowly moderate at current interest rates. We continue to doubt the economy will experience outright recession in the second half of 2023 as forecast by the RBNZ (although risks from the concerning situation in China and weaker agricultural commodity prices warrant keeping a close eye on that element of the forecast). But the data probably won't be sufficient to budge the RBNZ Monetary Policy Committee in August – so we must play the man (the MPC) as opposed to the ball on this one.
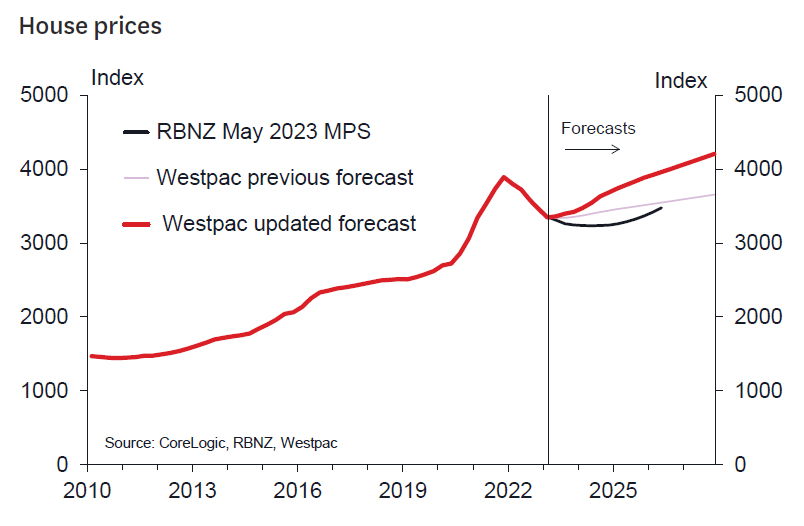
Our forthcoming August Economic Overview will describe our new forecasts in greater detail. However, the bottom line is that the interest rate reductions we had previously expected to occur in the second half of 2024 will likely now occur more slowly, consistent with the RBNZ only easing cautiously as inflation moderates slowly. We suspect many other central banks will be taking a similar, cautious approach.
The Next Key Data Releases that Could Allow ECB to Hike in September
The July central banks meetings lived up to expectations as both the Fed and the ECB announced their respective rate hikes but essentially removed their forward guidance. Data dependency is the new name of the game as the market is now counting down to the mid-September meetings. Which are the next key dates until the September 14 ECB gathering? What data figures would the ECB hawks like to see to push for another rate hike? Could the euro manage to defy expectations for a tough August against the US dollar?
ECB’s change of strategy
ECB's President Lagarde, representing the entire governing council, announced a strategy change, following nine consecutive rate hikes over the past 12 months, by moving to a data dependency stance. Using Lagarde’s own words, “data and our assessment of data will actually tell us whether and how much ground we have to cover”. The market obviously interpreted her message as dovish with the euro underperforming the dollar.
It has always been difficult for central banks to signal the likely end in their hiking (or easing) cycles as they have to maintain the fragile balance in their boards and avoid market disappointment. A big plus for Lagarde, compared to the Fed's Chairman Powell, is that she appears to have developed a decent relationship with the market in the current hiking cycle. This could prove crucial if the ECB decides to announce another rate hike at the September 14 gathering.
Key dates until the next ECB meeting
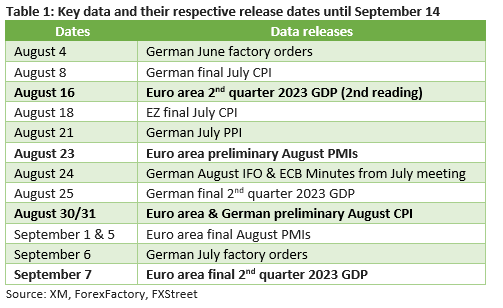
With data releases being the new compass for the ECB going forward, Table 1 below shows the key data releases and their respective dates up to the September ECB meeting.
What would the ECB hawks need to see to support a rate hike?
The ECB’s mandate remains price stability. Naturally, they are closely following all the inflation-linked data releases, indicators and projections. This framework includes market-based indicators like the 5year-5year inflation swaps, which remains elevated at 2.48%, the various business surveys and the famous ECB staff projections. Understandably, the market would be on its toes on the relevant dates as seen in Table 1 above. However, the key ones for the next 45 days are the August 23 release of the preliminary August PMIs (specifically, the prices paid subcomponent), and the German and euro area aggregate preliminary CPI prints for August on August 30/31.
A plethora of upside surprises could prove decisive for the September discussion. Especially if the headline euro area CPI stabilizes above 5% following an aggressive downward move since November 2022 and the core CPI indicator continues to confirm its stubborn nature. In addition, the ECB staff forecasts, to be released after the September 14 ECB meeting, play a key role in setting monetary policy. Therefore, the combination of strong inflation prints for August and the 2025 CPI rate staff projection remaining comfortably above the 2% threshold (it was seen at 2.2% at the June 2023 staff projections), could tip the balance in favour of another 25bps rate move.
Certain ECB members seem to care more about growth
Certain ECB members seem to be really concerned by the recent bad run of growth-related data releases, and particularly by the fact that Germany has been the growth laggard in 2023. It is worth noting that we are experiencing a rather rare occasion of France outgrowing Germany for three consecutive quarters. Therefore, ECB members will likely be all over the growth data as the final 2nd quarter GDP prints from Germany and the euro area aggregate are coming on August 25 and September 7 respectively. Stronger growth figures, especially in Germany, would really be welcomed by the ECB hawks.
Furthermore, the German IFO surveys, German factory orders and the various PMI surveys (especially the orders subcomponents) would undoubtedly be dissected by both sides at the ECB as they try to prop up their arguments for the September meeting. Especially in the case of the PMIs, the ECB hawks would really love the headline German manufacturing PMI to reverse its recent tanking and plot a course towards the 50-midpoint. Such a move would probably need further positive news from China, on top of the recent announcements that have not really caused much enthusiasm in the market.
Euro would benefit from stronger data releases
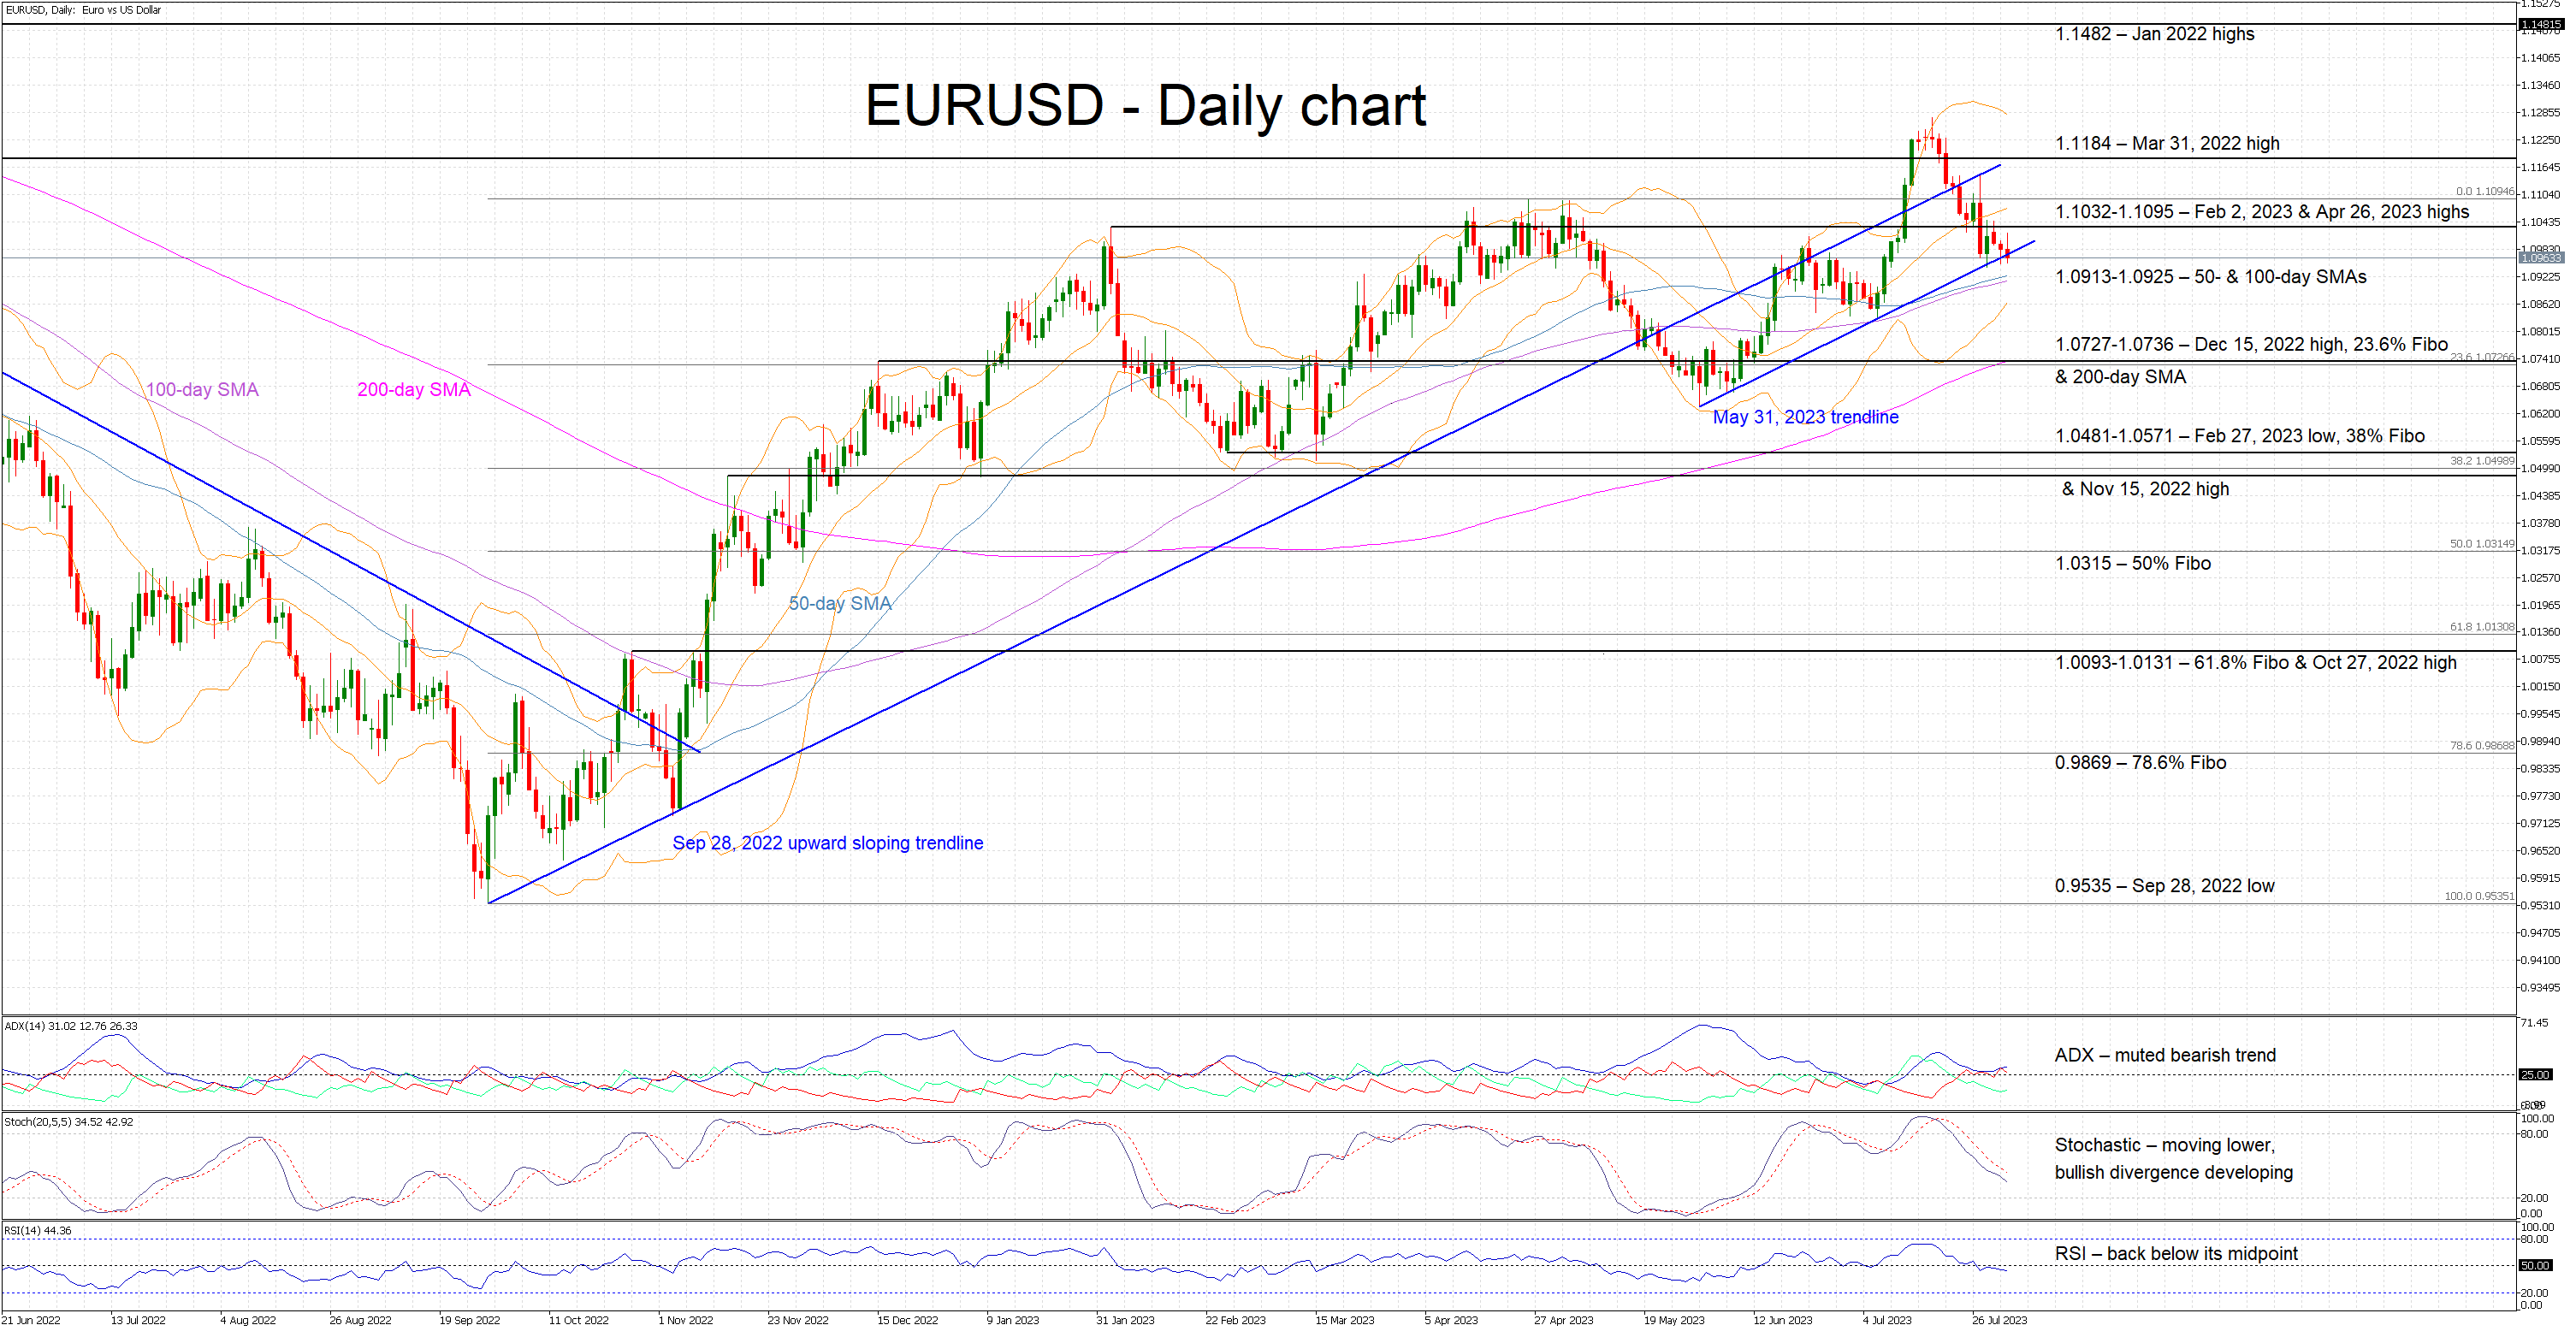
The euro remains on the backfoot as the main driver of its recent performance was the market's confidence that the ECB will maintain its hawkish strategy. Removing this factor, the euro looks very vulnerable and thus raising questions for the viability of the long-term rally recorded against the US dollar since the September 28, 2022 low. A plethora of upside data surprises, particularly on the inflation front, could reenergize the euro bulls in recording a new 2023 high above the current one at $1.1275. On the flip side, the $1.0913-$1.0925 area is important from a short-term perspective as a break of this range would open the door to a more aggressive move towards $1.0727.
What To Trade In August?
As is the custom, every new month in the financial market often presents long-term, swing trading opportunities for traders like you and me. Even better, FBS is usually there to provide insights into the expected trading opportunities through such analytical pieces as this. So, keep reading, and let’s review a few of these trade ideas together.
GBPJPY - D1 Timeframe
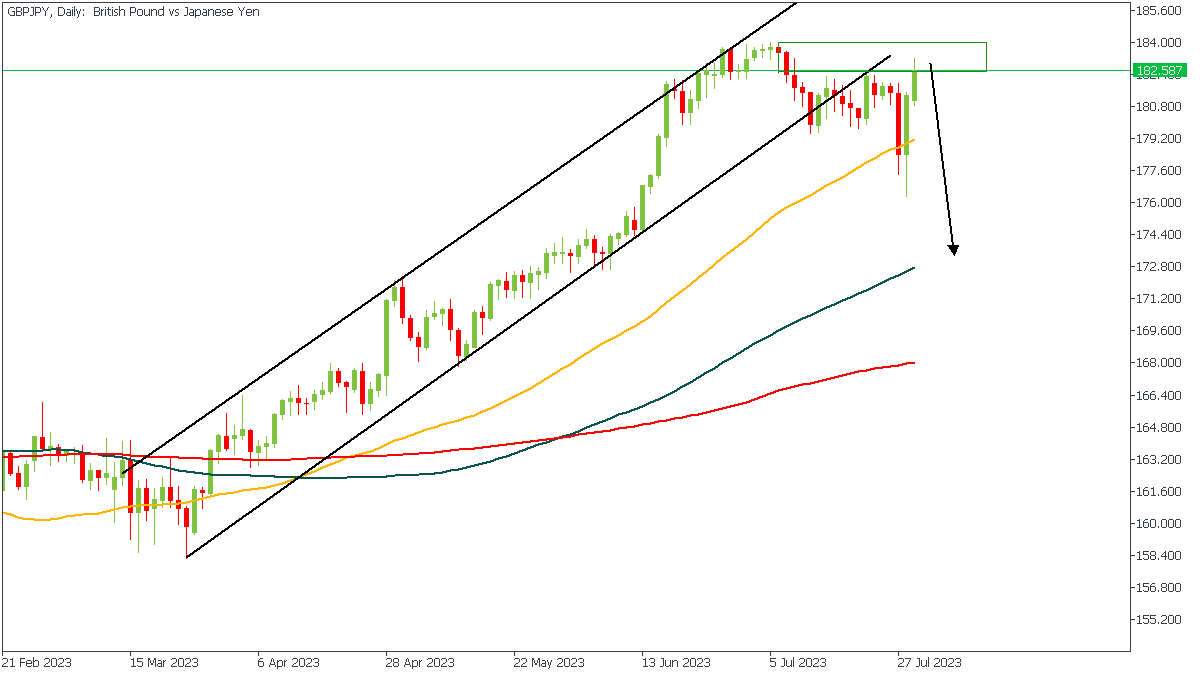
As I mentioned in a recent article, GBPJPY, after having broken out of a consolidation channel, returned for a retest of the turncoat trendline, which it had initially broken below. As a result, I expect a reaction from the supply zone to confirm my bearish sentiment and present me with reliable entry criteria. The rejection from that supply zone is the final piece of the puzzle I would be waiting for.
Analyst’s Expectations:
- Direction: Bearish
- Target: 174.671
- Invalidation: 184.168
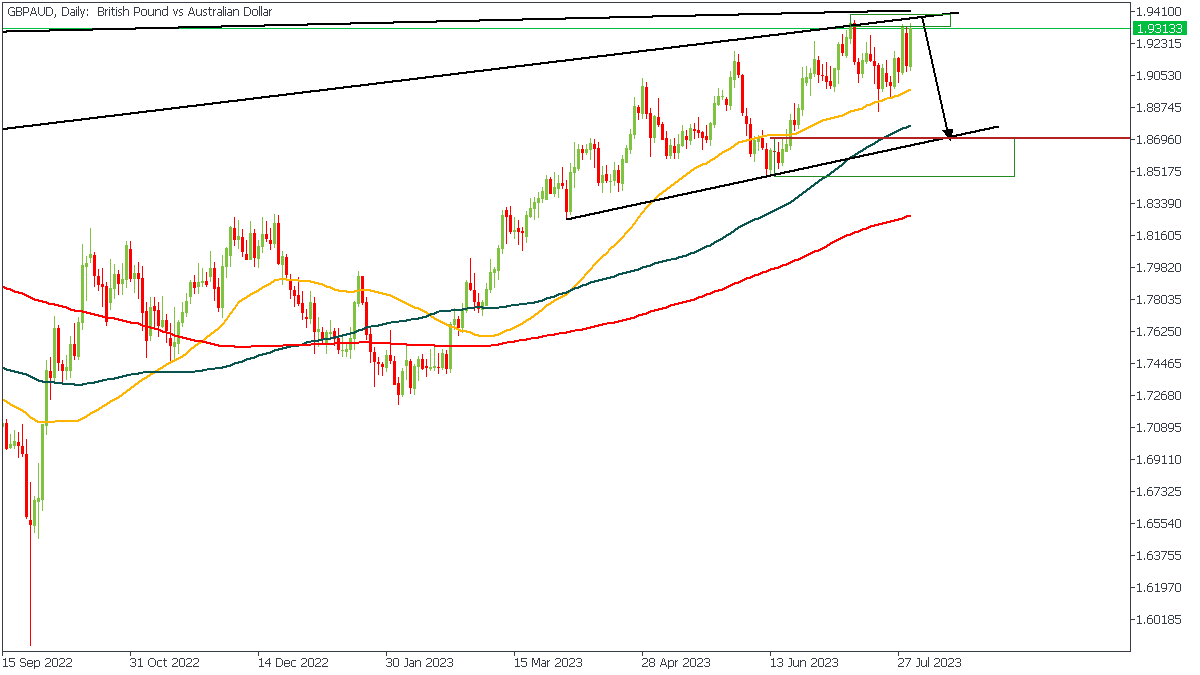
GBPAUD - D1 Timeframe
GBPAUD is retesting a major supply zone extending to the monthly timeframe. The initial movement had been rejected from the supply zone and trendline resistance earlier, so I expect to see a further drop from the same zone. Although the market is yet to present a proper break of structure, the price would nonetheless reach for the trendline support and the demand zone below it.
Analyst’s Expectations:
- Direction: Bearish
- Target: 1.87287
- Invalidation: 1.94012
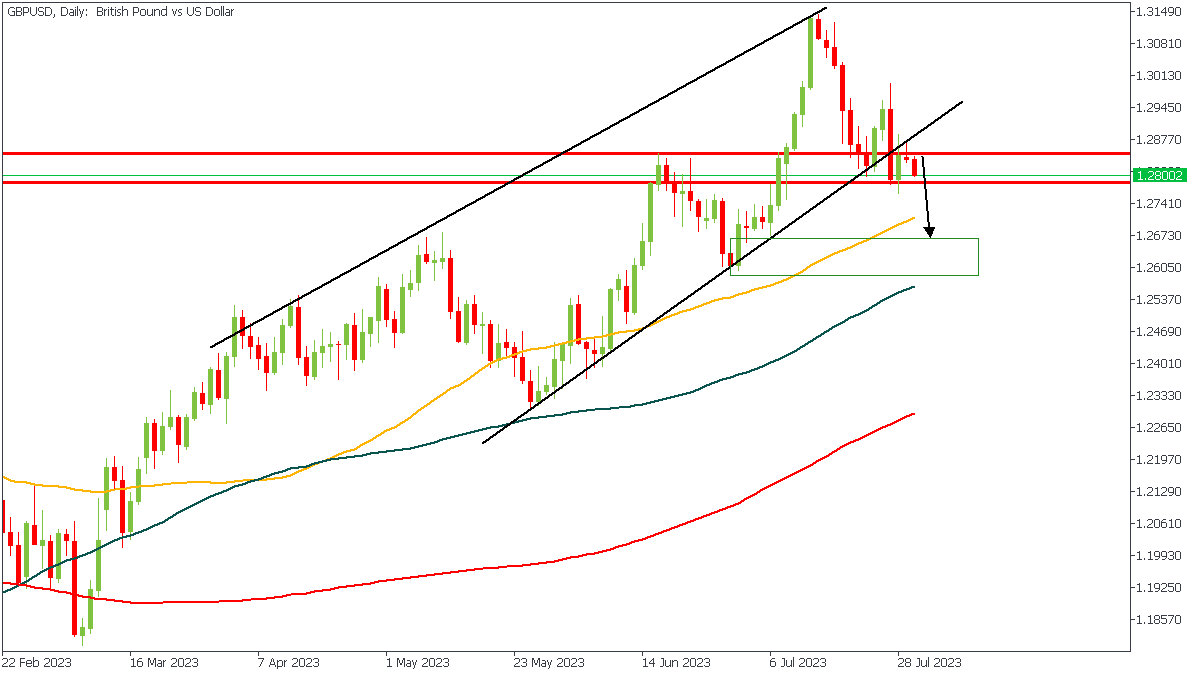
GBPUSD - D1 Timeframe
GBPUSD recently broke out of a consolidation channel and has completed a retest of the said trendline. Looking at the current price action, the break of structure, and the trendline retest, I expect to see a continuation of the downward movement. The rejection from the trendline is expected to push prices further down toward the demand zone between the 50 and 100 period moving averages.
Analyst’s Expectations:
- Direction: Bearish
- Target: 1.27000
- Invalidation: 1.28760
CONCLUSION
The trading of CFDs comes at a risk. Thus, to succeed, you have to manage risks properly. To avoid costly mistakes while you look to trade these opportunities, be sure to do your due diligence and manage your risk appropriately.
Sunset Market Commentary
Markets
Fitch’s US rating downgrade from the top AAA to AA+ (stable outlook) didn’t go uncommented. Fitch cited a worsening budget situation, a high and growing debt burden and an erosion of governance (ie. narrowly avoiding a default as debt ceiling discussions get resolved at the eleventh hour) as reasons for the move. US Treasury Secretary Yellen already yesterday evening lashed out at the rating agency, calling its decision arbitrary and based on outdated data. Prominent economists including former Treasury Secretary Summers said that there are indeed reasons to be concerned about the long-run trajectory of the US deficit but added that the country’s ability to service debt wasn’t in doubt. Others were “puzzled” about the “strange move”, and shouldn’t impact markets much. Evidence from the past (eg. with S&P 2011 US rating cut) indeed shows effects, if any, are limited and temporary. The largest moves were visible on equity markets. In Asian dealings, stock indices lost up to 3% and more. European markets opened lower and then extended losses up to 1.75% (EuroStoxx 50) before paring them to about 1% currently. We nevertheless feel that the Fitch decision was seen as an excuse for some profit-taking after a strong July month rather than anything else. US equity futures also pared their losses, resulting in a lower opening of 0.4-1.3%. US government bonds at the center of all the fuzz at first … strengthened. Marginally, but still. That too is a copy paste of the 2011 script, when rating agency S&P also lowered the US’s AAA rating a notch over the debt ceiling. Back then, US bonds outright surged although circumstances were not all the same (European debt crisis, ultra-low policy rates, Fed shortly after announced a second round of “Operation Twist”). The minor UST advance was later undone by a strong ADP job report though. Some 324k jobs were created in July, crushing consensus for 190k. The figure for June saw a downward 42k revision but does little to counterbalance the big beat. Leisure and hospitality (+201k) are again driving growth, ADP said. It added that manufacturing remains a point of weakness, with the interest-rate sensitive industry shedding jobs for the fifth month straight (-36k). “The economy is doing better than expected and a healthy labor market continues to support household spending. We continue to see a slowdown in pay growth without broad-based job loss.”, the ADP chief economist summarizes. US yields currently add 2.1-7.8 bps across the curve with the 10-y moving further north of the 4% barrier. German Bunds hugely outperform by shedding 2.4-7 bps. The dollar rose against most peers, including the euro – even as the common currency was doing pretty well itself. EUR/USD loses further territory towards 1.095. DXY extends a winning streak to 102.5. Cyclicals and other more risky currencies including AUD, NZD and SEK all feel selling pressure as does sterling. EUR/GBP rises well above 0.86(2). News & Views
The Bank of Japan’s deputy governor and one of the key policy architects said Friday’s tweak to the yield curve control programme should not be seen as moving towards an exit from its ultra-easy stance. It is aimed at “patiently continuing with monetary easing”. He also pushed back against any expectations for a rate hike soon, saying that would mean the BoJ is in a state where it needs to cool the economy to address high inflation. The latter is still well above the 2% target but the central bank holds on to the view that it is the result of cost-push factors. Since Friday’s tweak, the Japanese 10y yield surged beyond 0.60%. The move was so abrupt the BoJ intervened on Monday with unscheduled bond buying. Uchida said there is no specific level at which the BoJ would step in again. He did say that they will, depending on the speed at which it is reaching 1% (the de facto new 10-y rate cap). The 10-y yield today adds another 2 bps to 0.638%, the highest in nine years.
The US Treasury boosted the auction size for the upcoming August-October quarter compared to the May-July quarter as it seeks to restore its depleted cash balance and to fund a bigger than in May expected deficit. It is the first time it did so in over two years. For maturities from 2y up to 7y, the size will increase between $1 bn to $3 bn in every month from August on. Maturities from the 10y over 20y to 30y will get a significant one-time boost this month before scaling down by $3 bn again for the final two months of the quarter. The US next week kicks off its mid-month refinancing operation through a 3-y, 10-y and 30-y auction. The combined surplus compared to the first month of the previous quarter amounts to $7bn (or $103 bn in total).
Swiss Franc Eases Ahead of Swiss Inflation Report
- Swiss inflation projected to fall to 1.6%
- ADP Employment blows past estimate
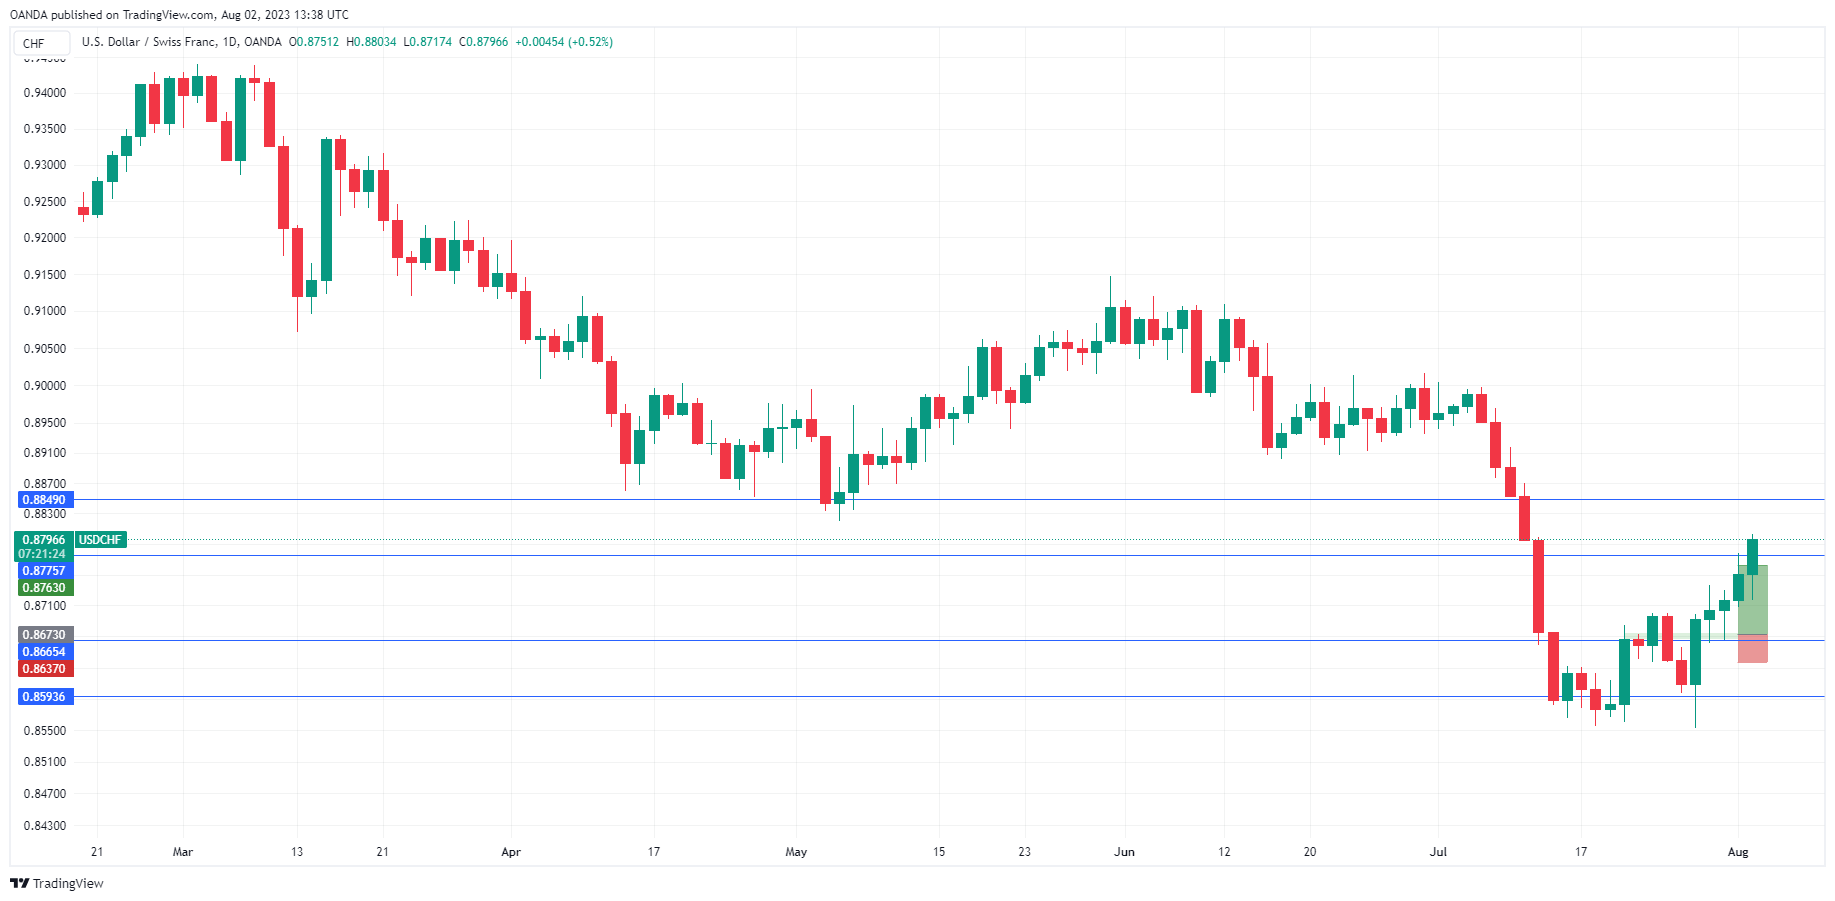
The Swiss franc has extended its losses on Wednesday. In the North American session, USD/CHF is trading at 0.8795, up 0.50%.
Swiss inflation expected to fall to 1.6%
Swiss National Bank President Jordan has often complained that inflation remains too high, although other central bankers, who are grappling with much higher inflation, would be happy to change places. I suppose that Jordan would grudgingly admit that the inflation picture has brightened. Inflation fell to 1.7% in June, as both the headline and core rates dropped into the Bank’s target range of 0%-2% for the first time since January 2022. The good news is expected to continue on Thursday, with Swiss inflation projected to tick lower to 1.6% in July.
Although Switzerland’s inflation picture is looking bright, the SNB is still expected to go ahead with a rate hike at the meeting on September 21st. The SNB is concerned that inflation could reverse directions and rise to 2% by the end of the year, due to rising services inflation and higher mortgage costs. Inflation may continue to decelerate in July, but the SNB could dismiss the downswing as temporary and decide to keep raising rates.
Investors will be keeping a close eye on US employment releases over the next few days. The ADP Employment report kicked off a host of job releases, highlighted by nonfarm payrolls on Friday. ADP looked sharp with a gain of 327,000 for July, below the June reading of a revised 455,000 but easily beating the consensus estimate of 189,000. A month ago, the sizzling ADP reading made headlines and raised speculation that nonfarm payrolls might follow suit with a strong release. In the end, nonfarm payrolls fell significantly, as expected. It remains to be seen whether NFP will deliver another soft reading or will it follow ADP and surprise with a banner reading.
USD/CHF Technical
- USD/CHF is testing resistance at 0.8776. The next resistance is at 0.8848
- 0.8665 and 0.8593 are providing support
US Downgrade Will Focus Attention on Other Countries
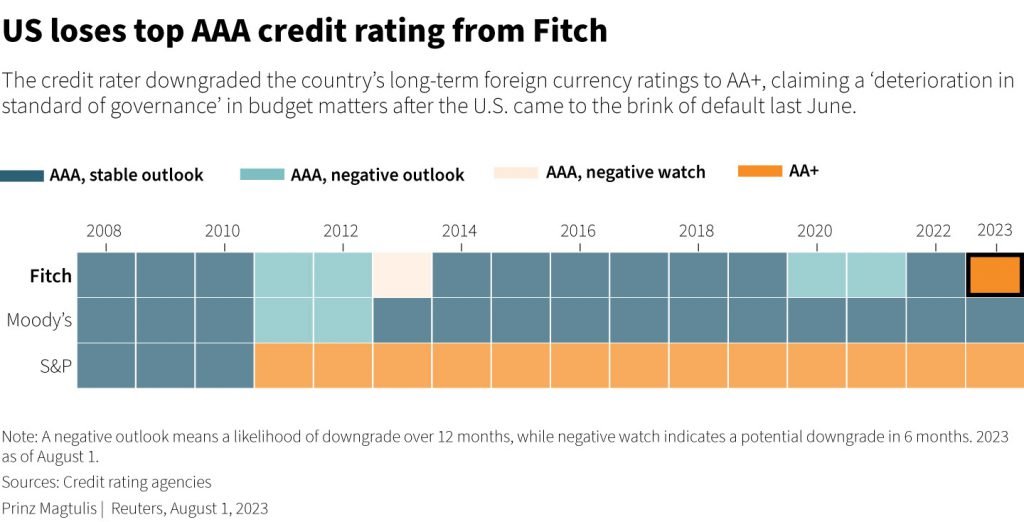
Fitch Ratings unexpectedly cut the US long-term credit rating by one notch to AA+. In response, markets have begun a gradual but broader risk repricing.
The suddenness of Fitch’s move is disconcerting, given that the rating was not under review and the outlook was stable. Moreover, another season of the sovereign debt ceiling saga ended a few months ago, and the next episode is not expected in the coming quarters. Standard & Poor’s actions, which made a similar move twelve years ago, were more logical. Then, for the first time in modern history, the states were faced with gridlocked lawmakers in the debate over the national debt ceiling. But since then, the repetition of the same scenario has made markets less and less reactive, as evidenced by their performance this spring.
Fitch’s rationale for this move is nothing new: deteriorating governance, chronic budget deficits and repeated negotiations to raise the debt ceiling.
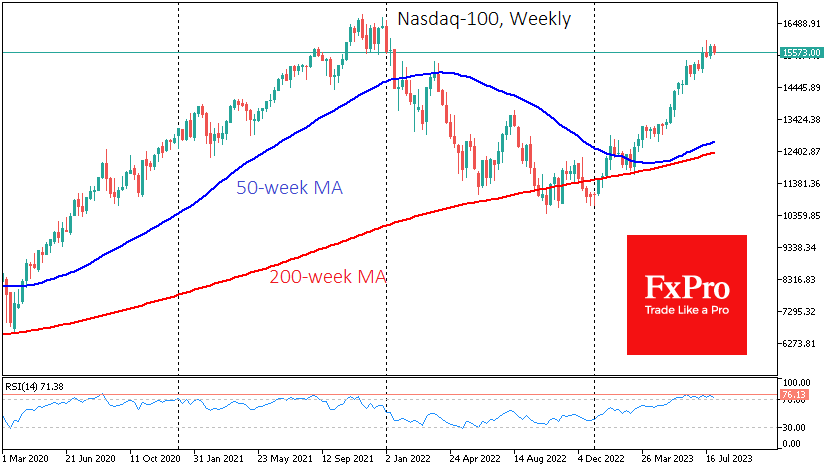
In 2011, after a similar move by the S&P500, the Nasdaq100 lost almost 17%, and the S&P500 lost 18% in four weeks of declines before regaining ground. Such amplitude is unlikely to be repeated, if only because the US economy is now in better shape, with unemployment at multi-decade lows and solid wage growth promising sales and corporate profits.
This news should trigger forced portfolio rebalancing by large funds in the coming days. In addition, the overbought conditions that have built up in recent weeks are now working against equity indices, increasing the potential for profit-taking. In short, if markets needed a reason to profit from the spring rally, they have it.
Perhaps in the most pessimistic scenario, the Nasdaq100 is unlikely to fall below 12500 from the current 15700, with more likely targets around 13500. The optimistic scenario suggests increased buying once it breaks below 15000.
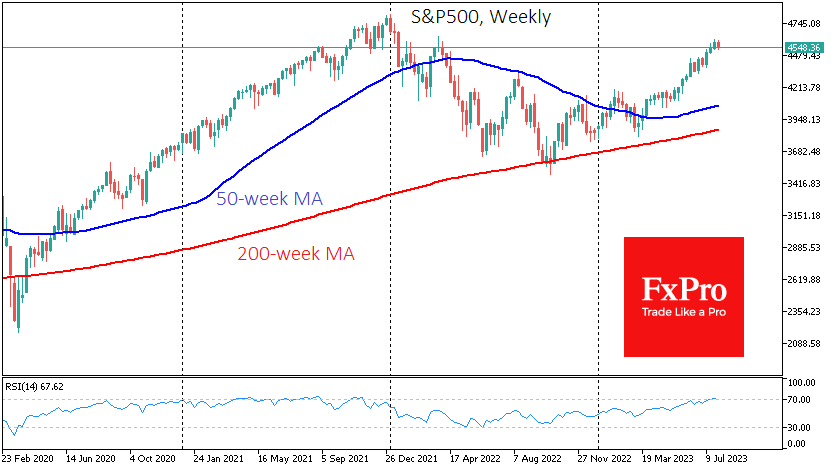
For the S&P500, the worst-case sell-off scenario could end near 4000 from the current 4577. More likely downside targets are around 4200, and it could end near 4400 in an optimistic scenario.
Unlike the actions of the monetary authorities, rating actions can affect both a country’s currency and equity markets, leading to a sell-off in the event of a downgrade.
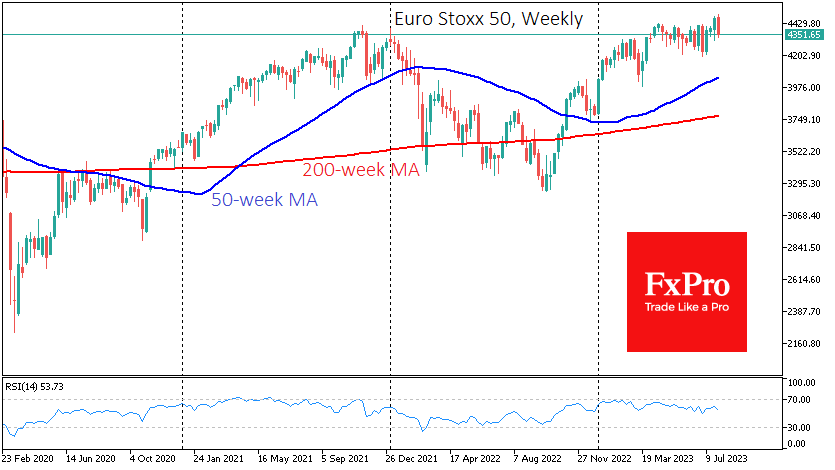
However, a downgrade of the US credit rating will force investors to scrutinise other markets. Twelve years ago, problems in Greece, Spain and Italy became a significant concern within months. Now, even more than in southern Europe, the debt burden of China and other major emerging markets should be the focus of attention. There is also the question of whether Japan can keep up with the increased servicing of its gargantuan debt.
Major Crypto Market Players Try to Regain Buyers’ Trust
Market picture
The cryptocurrency market has regained its cap to above $1.18 trillion (+1.6% in 24 hours). The market’s initial rebound on buying back the most sagging assets was supported by the unexpected news of Fitch downgrading the US long-term rating on Wednesday, which triggered an impulsive pull into Bitcoin and gold.
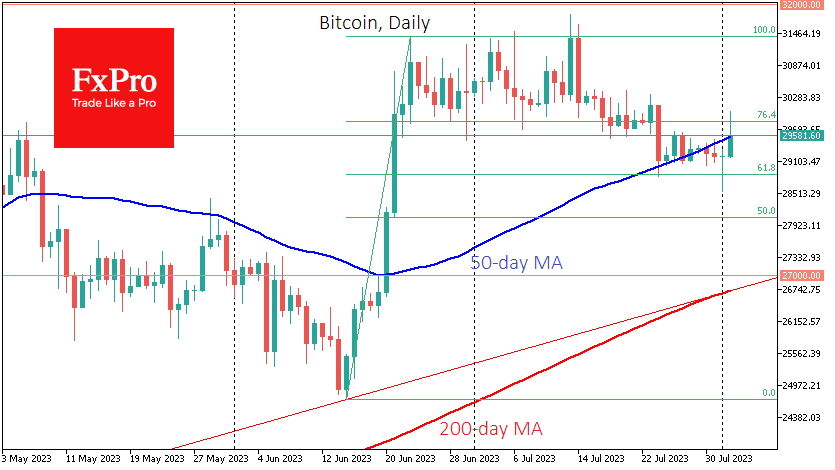
Bitcoin fell to $28.6K on Tuesday, hitting lows since June 21 amid market concerns over the Curve Finance hack and a likely drop in liquidity on the AAVE platform. The first cryptocurrency experienced impressive upward momentum, touching $30.0K early Wednesday morning. Although we do not see the realisation of a rapid decline scenario, for Bitcoin now, the 50-day moving average plays the role of resistance. The chances of a rapid decline will increase sharply with Wednesday’s close below $29.2K.
News background
TRON founder Justin Sun unexpectedly withdrew about $52 million in stablecoins from the decentralised finance protocol AAVE, impacting borrowing rates. In parallel, Sun announced a partnership between Tron and Curve. These actions stopped the slide of confidence in the cryptocurrency market and brought some speculative buyers back.
A positive signal for Bitcoin could be an increase in the reserves of mining pools. They reduced sales of cryptocurrency and resumed its accumulation, noted in CryptoQuant.
The U.S. will tax income from staking. The US Internal Revenue Service (IRS) has issued a new clarification, according to which the funds received from staking are considered income and should be taxed.
Tether, the issuer of USDT, the largest USDT stablecoin by capitalisation, reported excess reserves of $850 million, formed at the end of the second quarter of 2023.
New Zealand Dollar Sinks After Soft Jobs Report
- New Zealand unemployment rate rises
- NZD slide continues
- ADP Employment report smashes estimate
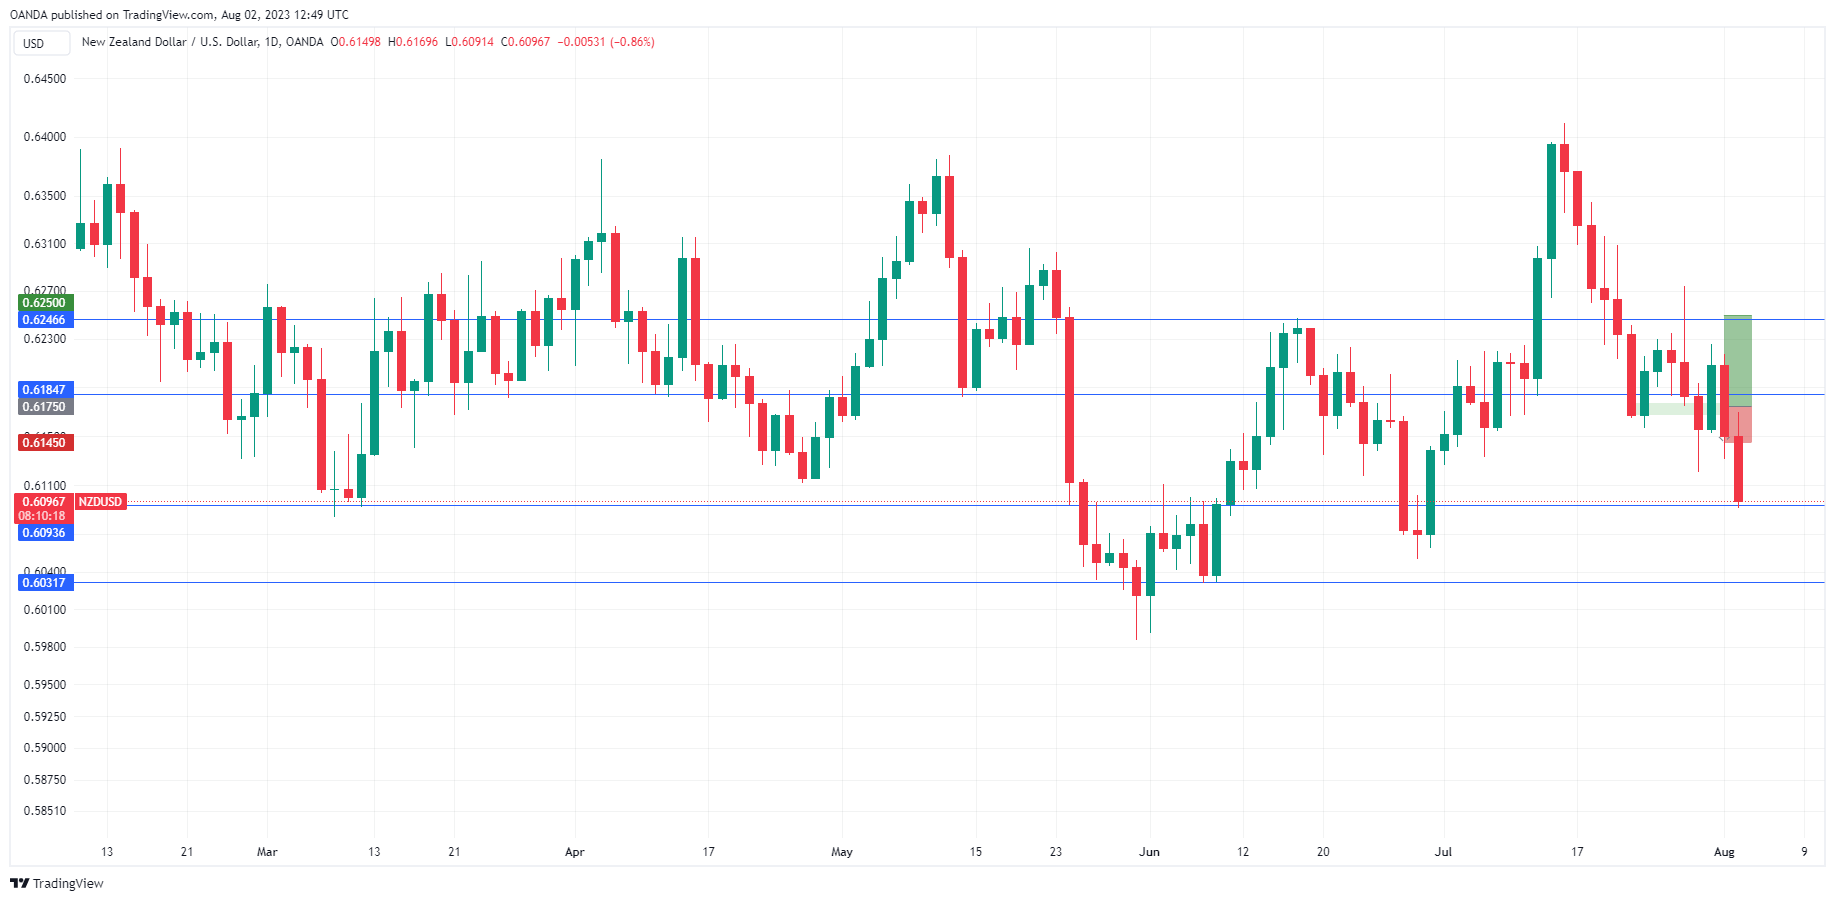
The New Zealand dollar has extended its losses on Wednesday. In the European session, NZD/USD is trading at 0.6093, down 0.91%. Earlier, NZD/USD touched a low of 0.6091, its lowest level since June 30th.
New Zealand unemployment climbs, wages dip
The New Zealand labour market has been tight, despite aggressive tightening by the Reserve Bank of New Zealand. Wednesday’s employment report for the second quarter showed some softening, which has extended the New Zealand dollar’s losses.
The unemployment rate rose to 3.6%, up from 3.4% in the first quarter and above the consensus estimate of 3.5%. Wage growth eased to 4.3%, below the 4.5% reading in Q1 and the estimate of 4.4%. These numbers point to a weaker labour market, but Employment Change rose 1.0%, up from 0.8% in Q1 and above the estimate of 0.5%. The mixed numbers show that the labour market may have lost a step but still remains strong enough to bear further rate hikes from the RBNZ. In July, the central bank maintained the cash rate at 5.50% and meets next on August 16th.
China released July PMIs this week, and the soft readings are weighing on the New Zealand dollar. China is New Zealand’s largest trading partner and the New Zealand dollar is sensitive to Chinese economic releases. We’ll get a look at the Caixin Services PMI on Thursday. The consensus estimate stands at 52.5, following a June reading of 53.9. A reading above 50.0 points to expansion.
In the US, the ADP Employment report kicked off a host of job releases, highlighted by nonfarm payrolls on Friday. ADP impressed with a gain of 327,000 for July, below the June reading of 455,000 but blowing past the consensus estimate of 189,000. A month ago, ADP came in at 497,000, fuelling speculation that nonfarm payrolls might follow suit with a strong release. In the end, nonfarm payrolls fell significantly, as expected. Will the NFP follow ADP’s lead and crush the estimate?
NZD/USD Technical
- NZD/USD is testing support at 0.6093. Below, there is support at 0.6031
- 0.6184 and 0.6246 are the next resistance lines
EUR/USD Mid-Day Outlook
Daily Pivots: (S1) 1.0957; (P) 1.0980; (R1) 1.1008; More...
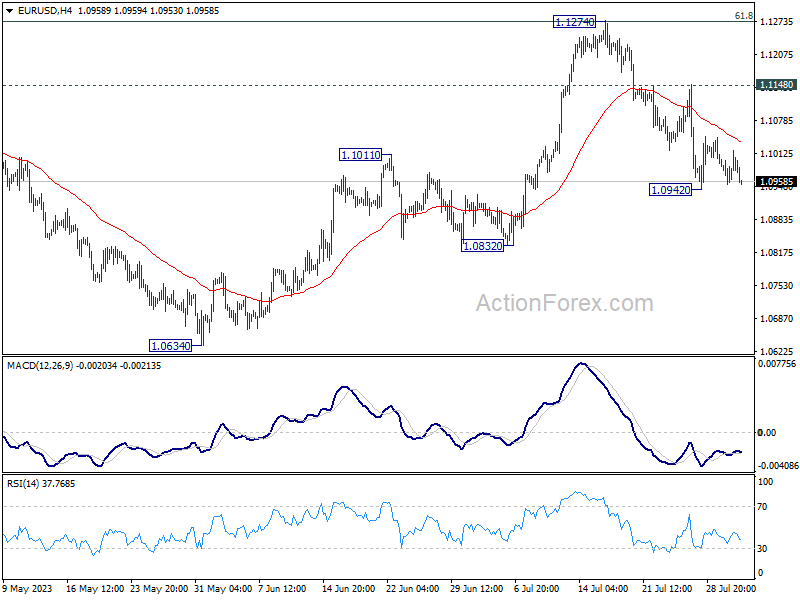
No change EUR/USD's outlook as range trading is still extending above 1.0942. Intraday bias stays neutral and further fall is expected as long as 1.1148 resistance holds. Below 1.0942 will target 1.0832 support next. Nevertheless, break of 1.1148 will argue that the decline has completed and bring retest of 1.1274 high.
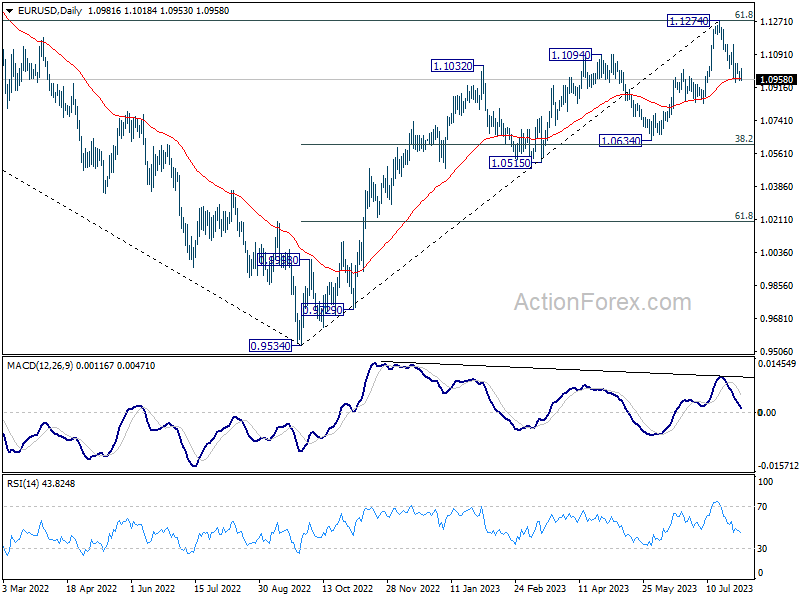
In the bigger picture, a medium term top could be formed at 1.1274, after failing to break through 61.8% retracement of 1.2348 (2021 high) to 0.9534 at 1.1273 decisively, on bearish divergence condition in D MACD. Sustained trading below 55 D EMA (now at 1.0963) will bring deeper correction to 1.0634 cluster support (38.2% retracement of 0.9534 to 1.1274 at 1.0609). Strong support could be seen there, at least on first attempt, to set the range for consolidation.
GBP/USD Mid-Day Outlook
Daily Pivots: (S1) 1.2731; (P) 1.2786; (R1) 1.2832; More...
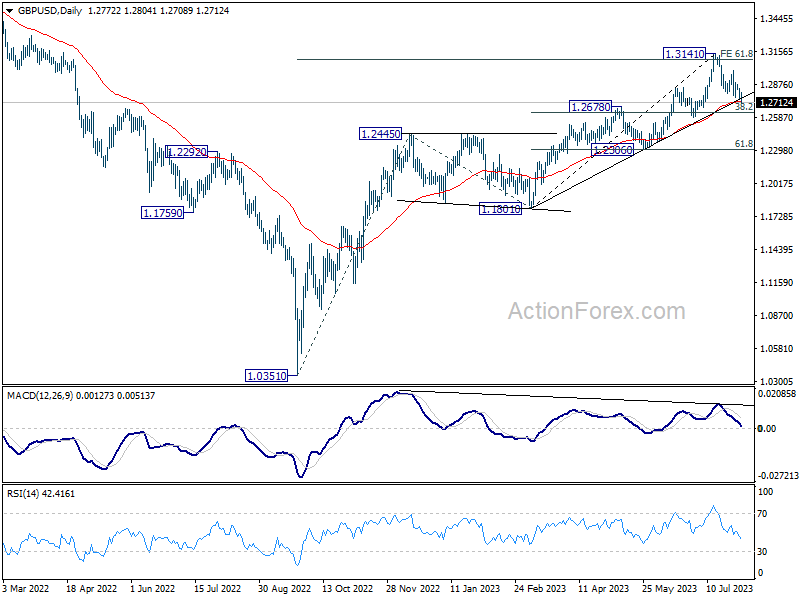
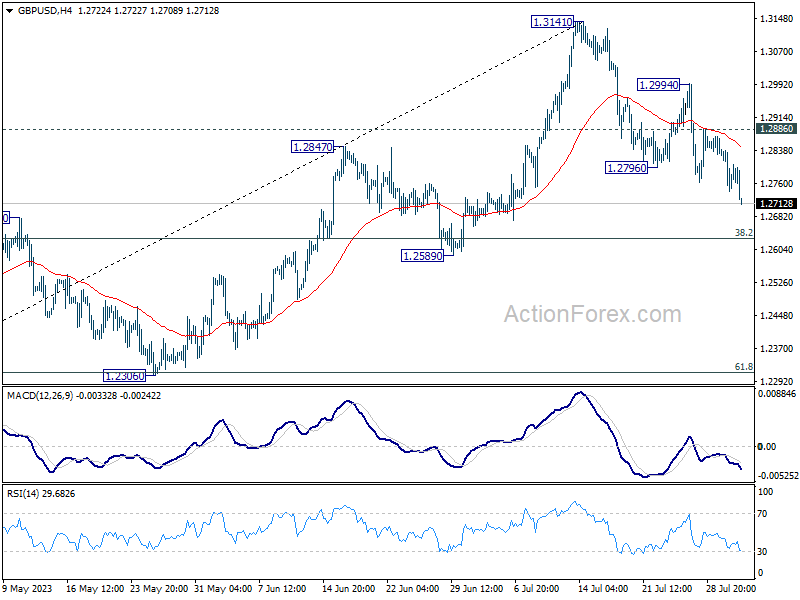
GBP/USD's fall from 1.3141 continues today and intraday bias stays on the downside. Deep decline would be seen to 38.2% retracement of 1.1801 to 1.3141 at 1.2629, as a correction to rise from 1.1801. On the upside, above 1.2886 minor resistance will turn bias back to the upside for stronger rebound.
In the bigger picture, as long as 1.2678 resistance turned support holds, rise from 1.0351 (2022 low) is expected to continue through 1.3141 high at a later stage. However, sustained break of 1.2678 will argue that it's at least correcting this rally, with risk of bearish reversal. Deeper fall would be seen to 1.2306 support next.