Sample Category Title
EUR/CHF Daily Outlook
Daily Pivots: (S1) 0.9583; (P) 0.9603; (R1) 0.9633; More...
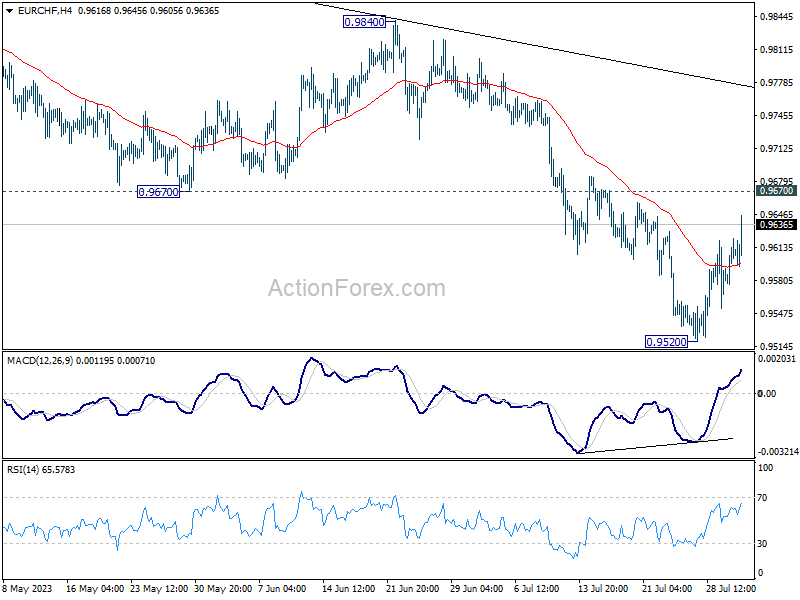
Intraday bias in EUR/CHF remains neutral and outlook remains bearish with 0.9670 support turned resistance intact. Break of 0.9520 will resume the fall from 1.0095 towards 0.9407 low. Nevertheless, sustained break of 0.9670 will be the first sign of bullish reversal and target 0.9840 resistance for confirmation.
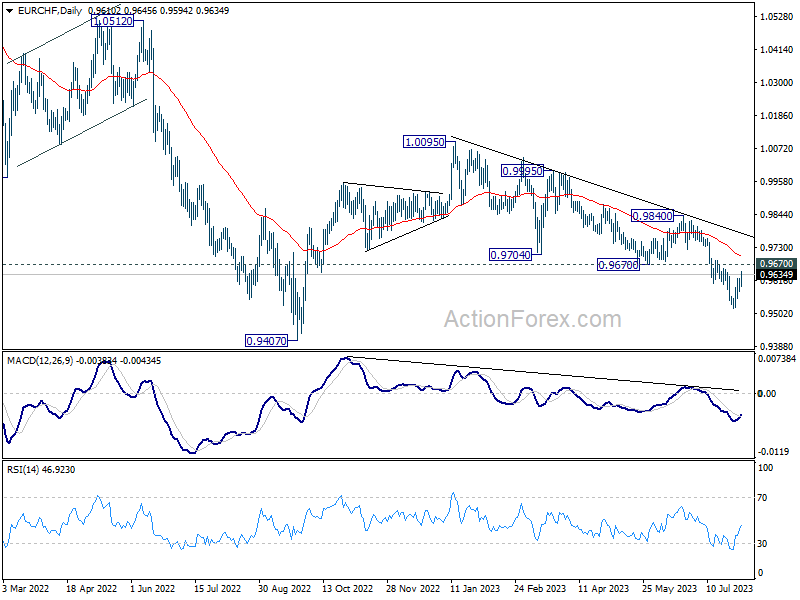
In the bigger picture, medium term outlook is staying bearish as the pair is capped well below falling 55 W EMA (now at 0.9876). Down trend from 1.2004 (2018 high) is in favor to continue. Sustained break of 0.9407 will target 61.8% projection of 1.1149 to 0.9407 from 1.0095 at 0.9018. For now, this will remain the favored case as long as 0.9840 resistance holds, in case of strong rebound.
Intraday bias in EUR/CHF remains neutral and outlook remains bearish with 0.9670 support turned resistance intact. Break of 0.9520 will resume the fall from 1.0095 towards 0.9407 low. Nevertheless, sustained break of 0.9670 will be the first sign of bullish reversal and target 0.9840 resistance for confirmation.
USDJPY Near Midpoint of Recent Upward Channel
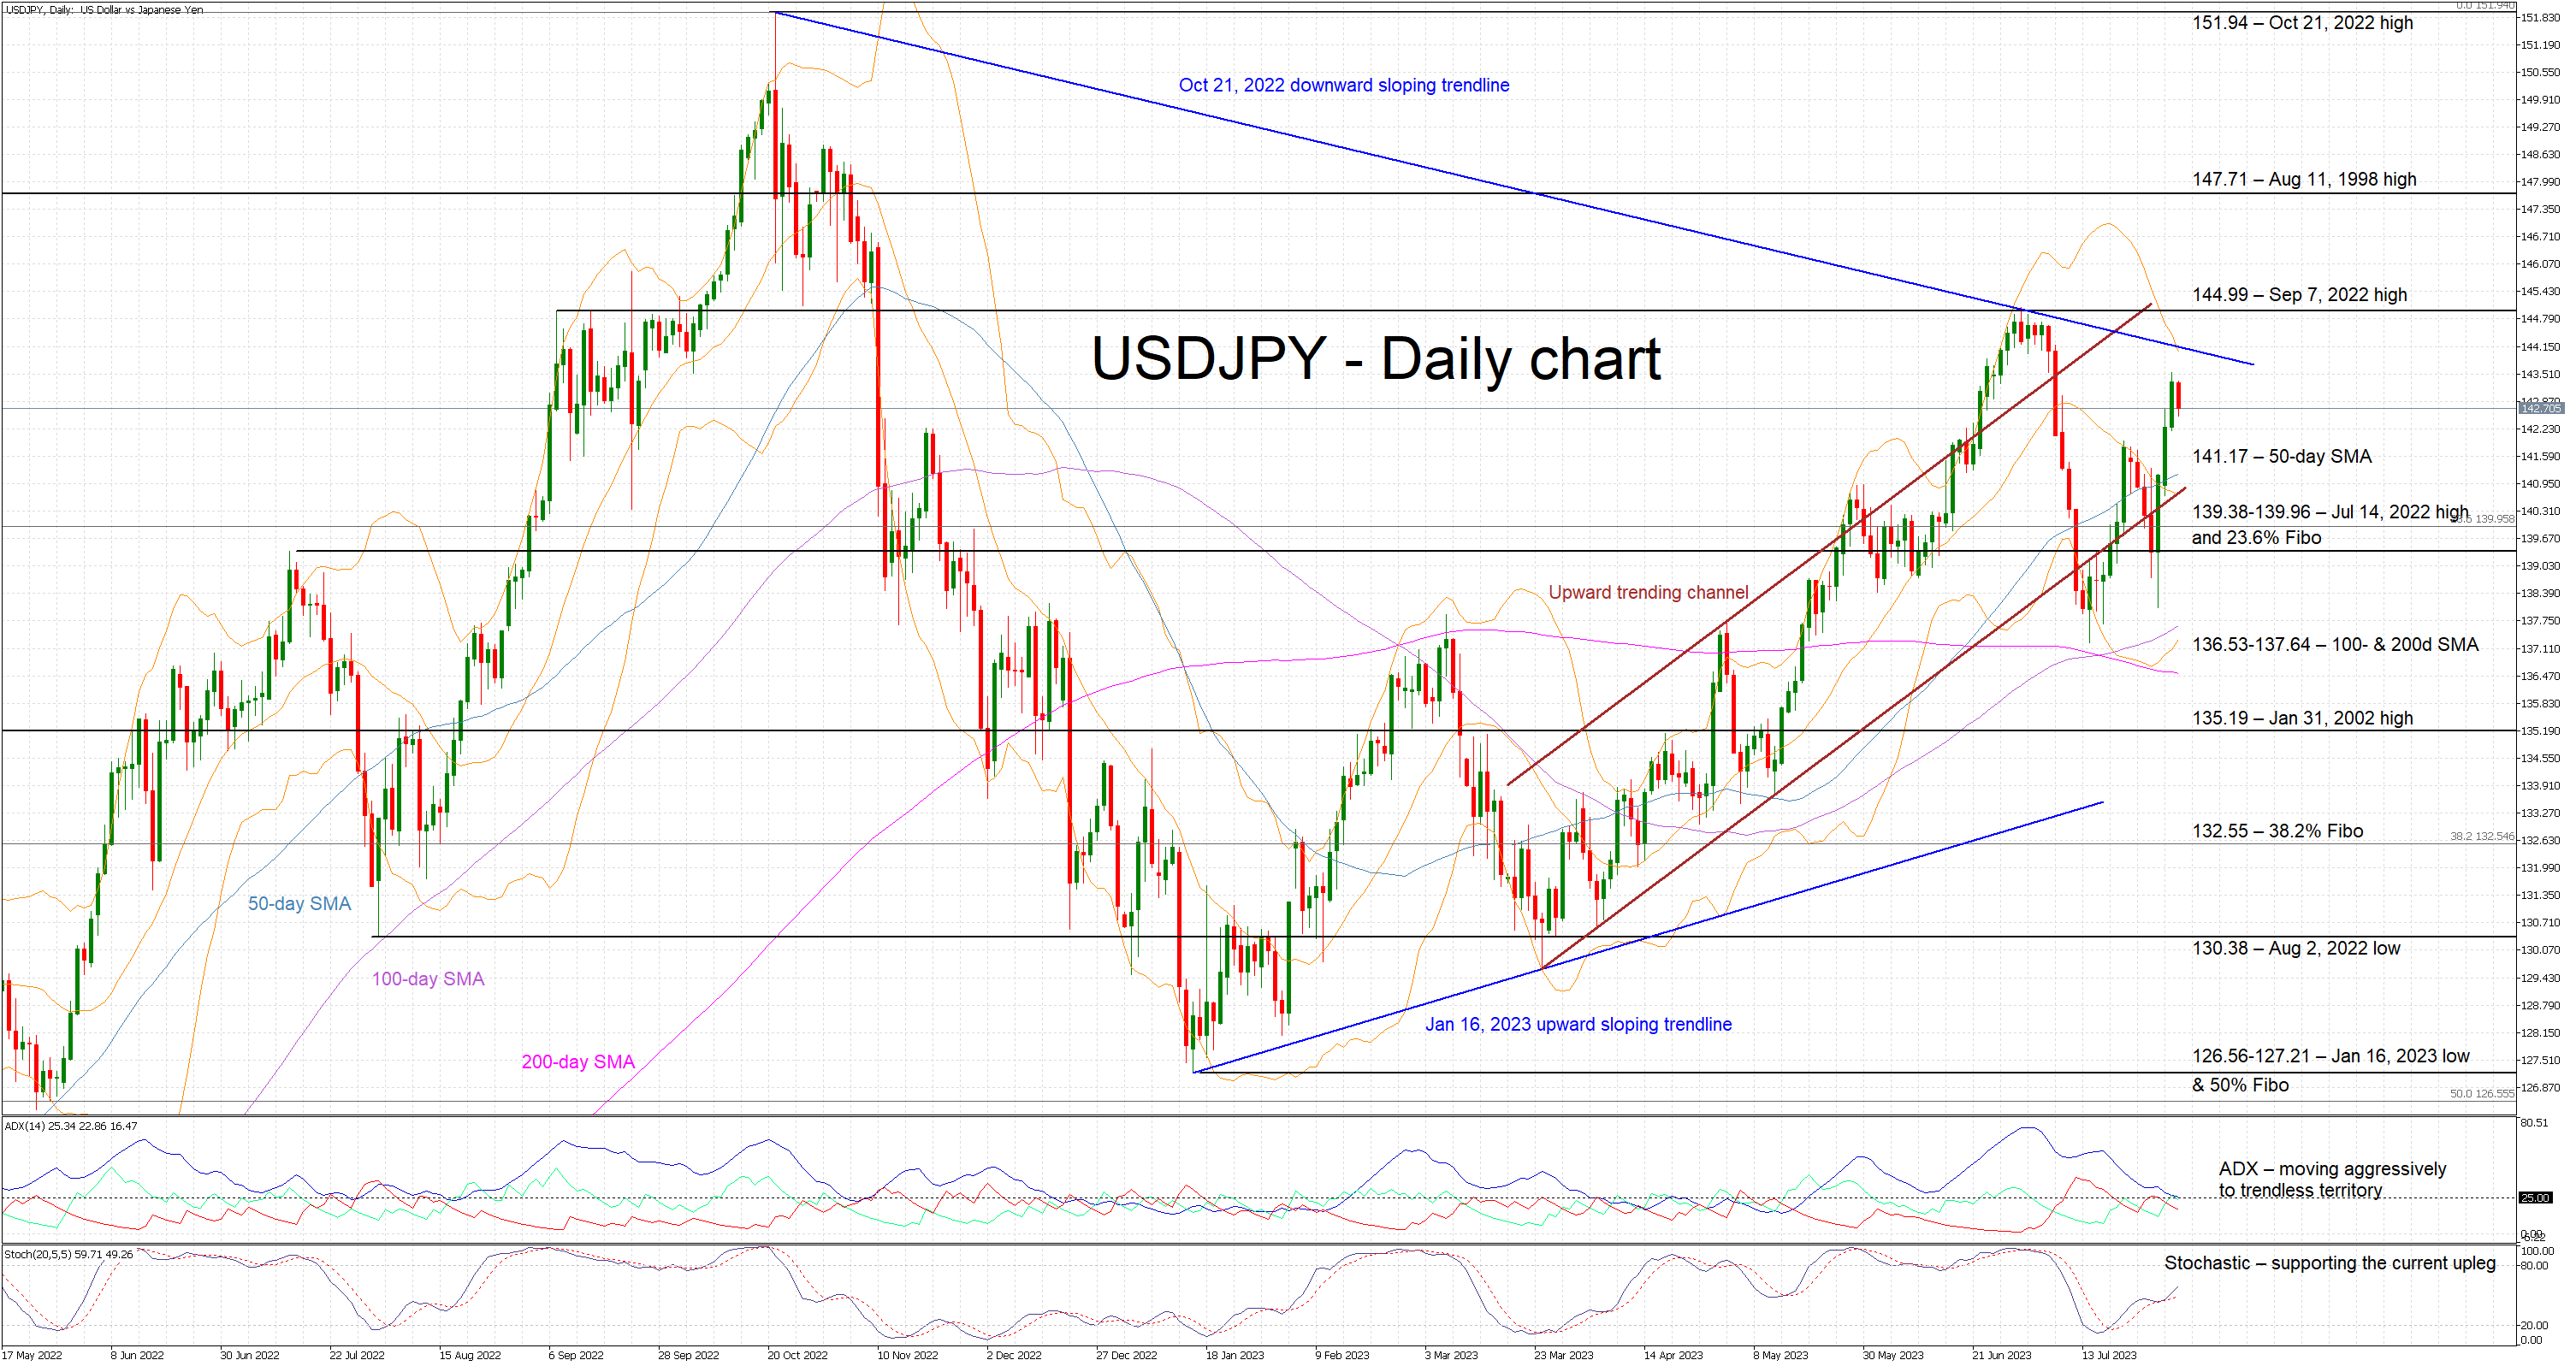
USDJPY is edging lower today following the good move recorded since the latest BoJ meeting. The pair remains near the midpoint of the upward trending channel that has been in place since the March 2023 banking sector-induced pullback and a tad below the 2023 high, thus keeping the recent rhetoric about a likely intervention alive.
The bulls are trying to register a series of higher highs and higher lows and reestablish their control over the market but the momentum indicators are mixed at this stage. The Average Directional Movement Index (ADX) has been on an aggressive downward path since the June 30 peak. It is now preparing to drop below its 25-threshold and hence signal a range-trading market. On the other hand, the stochastic oscillator appears to support the bulls’ intentions. It has managed to bounce off its moving average (MA) and it is now heading higher towards its overbought area while building a good gap from its MA.
Should the bulls remain determined in staging another rally, they would try to push USDJPY above the October 21, 2022 downward sloping trendline and the September 7, 2022 high at 144.99. They would then have the opportunity to record a new 2023 high before they set their eyes on a bigger prize, the August 11, 1998 high at 147.71.
On the flip side, the bears are anxiously trying to avoid a return to the recent USDJPY highs. They appear willing to defend the October 21, 2022 trendline and gradually lead the pair towards the busy 139.38-139.96 area populated by the July 14, 2022 high and the 23.6% Fibonacci retracement level of the March 9, 2022 - October 21, 2022 uptrend respectively. However, they first have to overcome the 50-day simple moving average (SMA) 141.17.
To sum up, USDJPY bulls are back in control assisted by a bullish stochastic, but the battle's outcome is yet to be decided.
GBP/USD Technical Analysis
On the hourly chart of GBP/USD at FXOpen, the pair started a fresh decline below the 1.2880 pivot level. The British Pound traded below the 1.2800 level to move into a bearish zone against the US Dollar.
The pair settled below the 50-hour simple moving average and tested the 1.2740 zone. It is now facing hurdles near a connecting bearish trend line at 1.2800 and the 50-hour simple moving average. If there is a clear upside break above 1.2800, the pair could rise toward the 1.2880 level in the near term.
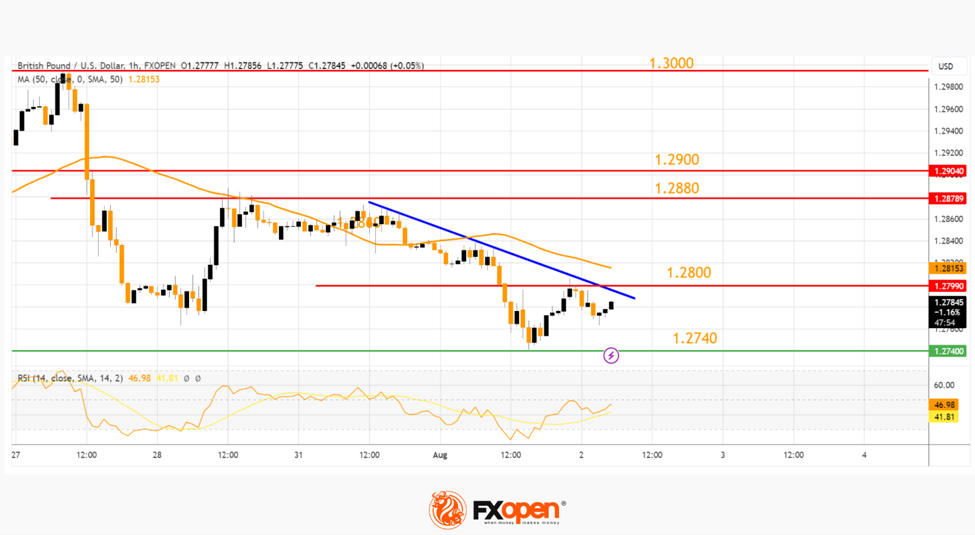
The next key resistance sits near the 1.2900 level, above which the GBP/USD pair might gain bullish momentum and revisit the 1.3000 zone.
On the downside, the first major support is near the 1.2740 zone, below which the pair could decline toward 1.2700. The next stop for the bears may perhaps be near the 1.2650 level.
This article represents the opinion of the Companies operating under the FXOpen brand only. It is not to be construed as an offer, solicitation, or recommendation with respect to products and services provided by the Companies operating under the FXOpen brand, nor is it to be considered financial advice.
EUR/USD and USD/JPY Daily Chart Outlook: Dollar Could Outperform
EUR/USD started a fresh decline from the 1.1265 zone. USD/JPY is rising and might aim to move above the 144.85 resistance.
Important Takeaways for EUR/USD and USD/JPY Analysis
- The Euro failed to clear 1.1265 and declined below 1.1090.
- There is a key bullish trend line forming with support near 1.0965 on the daily chart of EUR/USD at FXOpen.
- USD/JPY climbed above the 140.00 and 141.15 levels.
- There is a major bullish trend line in place with support at 139.00 on the daily chart at FXOpen.
EUR/USD Technical Analysis
On the daily chart of EUR/USD at FXOpen, the pair started a fresh decline from the 1.1265 zone. The Euro declined below the 1.1090 support zone to move into a short-term bearish zone against the US Dollar.
The pair even spiked below 1.1000 before the bulls emerged near 1.0965. The euro seems to be finding bids near the 50% Fib retracement level of the upward move from the 1.0661 swing low to the 1.1275 high.
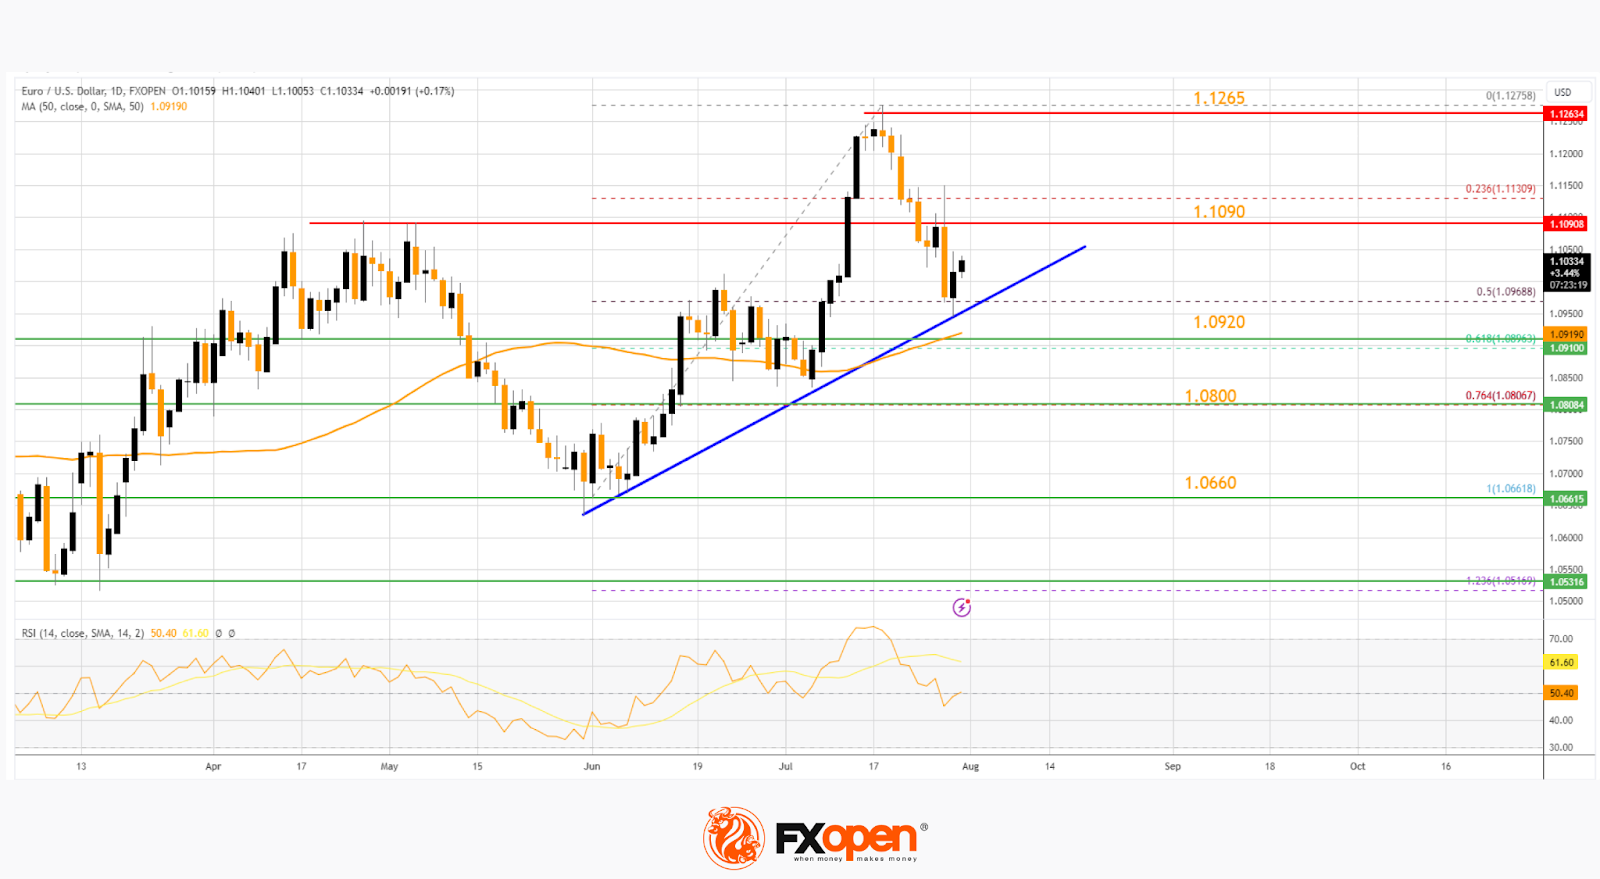
There is also a key bullish trend line forming with support near 1.0965. The main support on the EUR/USD chart is near the 50-day simple moving average at 1.0920.
The 61.8% Fib retracement level of the upward move from the 1.0661 swing low to the 1.1275 high is also near 1.0920. If there is a downside break below 1.0920, the pair could drop toward 1.0800. Any more losses could open the doors for a move to 1.0660.
On the upside, the pair is facing resistance near the 1.1090 zone, above which the bulls might aim for a steady increase. The next major resistance is near 1.1265. An upside break above 1.1265 could set the pace for another increase. In the stated case, the pair might rise toward 1.1340.
USD/JPY Technical Analysis
On the daily chart of USD/JPY at FXOpen, the pair started a strong rise from the 130.50 zone. The US Dollar gained bullish momentum above 135.00 against the Japanese Yen.
Finally, the bears appeared near the 145.00 zone. A high was formed near 145.07 before a downside correction. The pair dipped below the 141.15 pivot level and tested the 137.55 zone. A low is formed near 137.24, and the pair is now attempting a fresh increase.
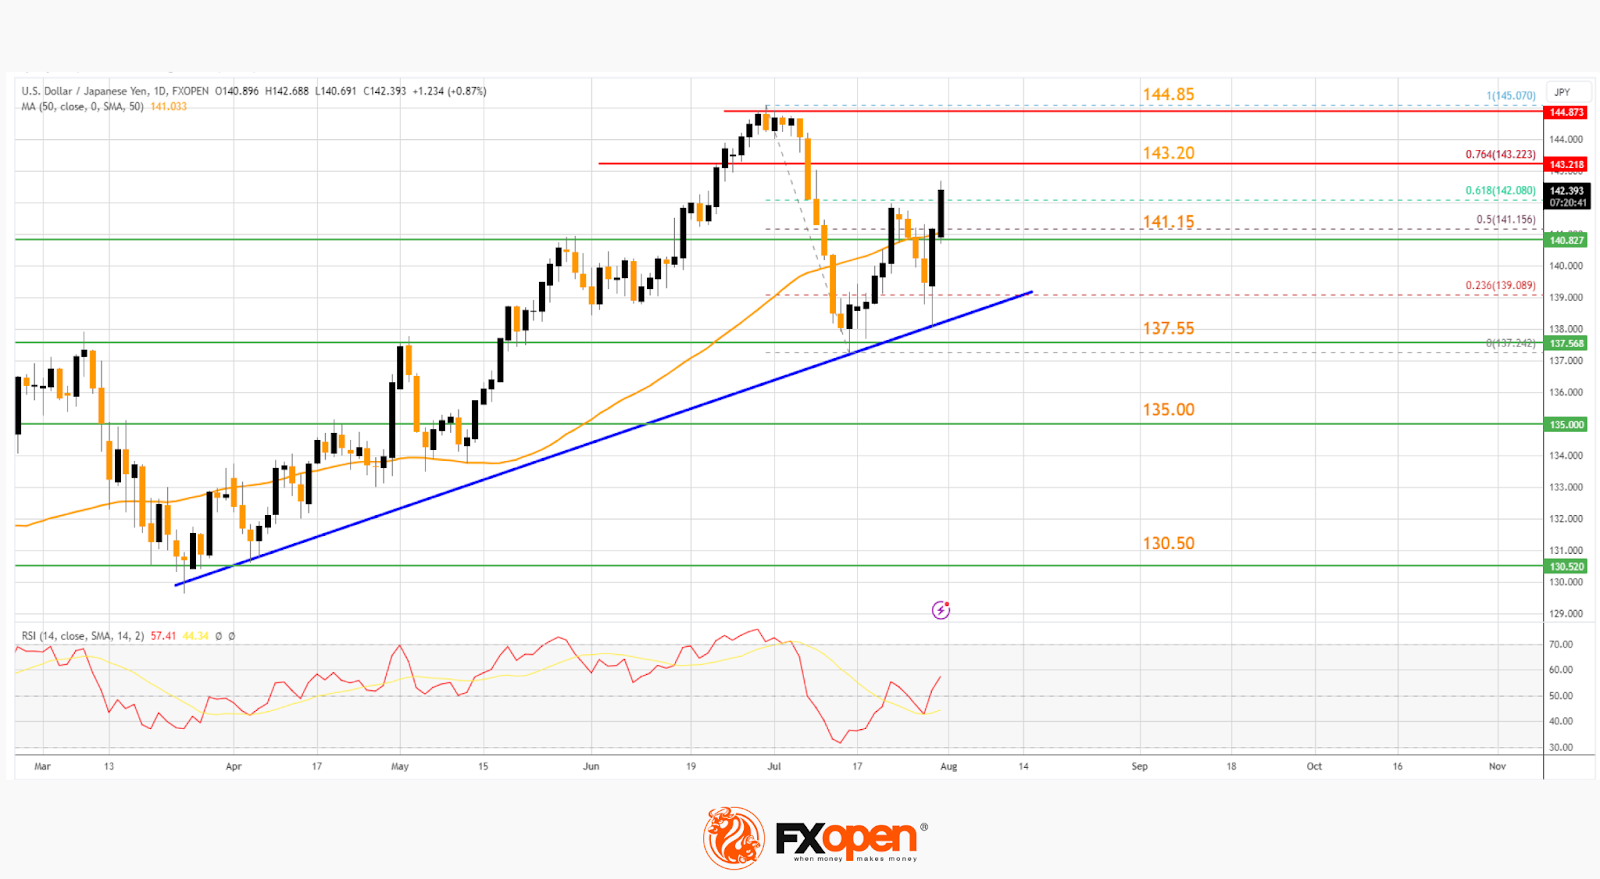
There was a move above the 50% Fib retracement level of the downward move from the 145.07 swing high to the 137.24 low. It is now trading above the 50-day simple moving average.
Immediate resistance on the USD/JPY chart is near the 76.4% Fib retracement level of the downward move from the 145.07 swing high to the 137.24 low at 143.20. The next major resistance is near 144.85. If there is a close above it, and RSI moves above 60, the pair could rise toward 146.20.
On the downside, the first major support is near 141.15. The next support is near a major bullish trend line at 139.00. If there is a close below 139.00, the pair could decline steadily.
In the stated case, EUR/USD might drop toward 137.55. If the bulls fail to protect the 137.55 zone, there could be a drop toward 135.00. The next stop for the bears may perhaps be near the 130.50 region.
This article represents the opinion of the Companies operating under the FXOpen brand only. It is not to be construed as an offer, solicitation, or recommendation with respect to products and services provided by the Companies operating under the FXOpen brand, nor is it to be considered financial advice.
Nikkei 225 Technical: On the Verge of a Potential Multi-Week Corrective Decline
- Yesterday’s daily “Shooting Star” candlestick coupled with today’s long-body daily bearish candle increases the odds of a bearish breakdown below the 50-day moving average.
- Ongoing minor decline from the 1 August high of 33,490 high has reached an oversold condition, an imminent minor bounce may occur first before a potential new down leg.
- Key short-term resistance will be at 33,490.
The price actions of the Japan 225 Index (a proxy of the Nikkei 225 futures) have staged the expected up move and reached the 33,200 resistance (printed an intraday high of 33,494 yesterday, 1 August).
Thereafter, it declined by -2.75% to hit an intraday low of 32,544 in today, 2 August Asian session at this time of the writing.
The current weakness of the Index has been mainly attributed to the negative feedback loop triggered by US sovereign debt credit downgrade to AA+ from AAA by Fitch Ratings that also spread to other major Asian benchmark stock indices intraday today; Hang Seng Index (-2.40%), Hang Seng TECH Index (-3.60%), CSI 300 (-0.90%), KOSPI 200 (-2.05%), ASX 200 (-1.29%), and Straits Times Index (-1.50%).
At the risk of breaking down below the 50-day moving average
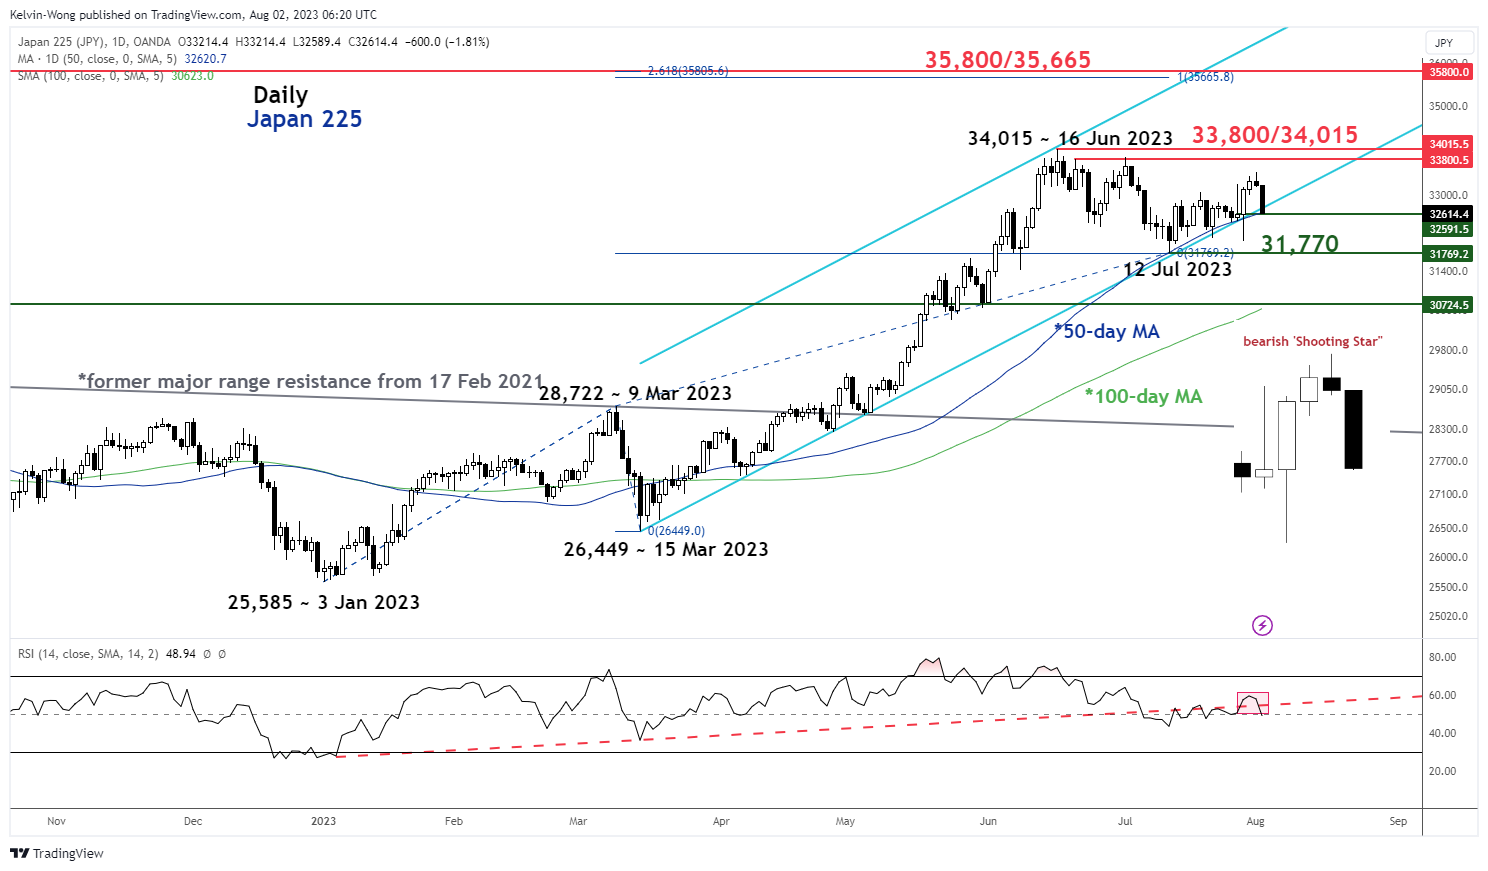
Fig 1: Japan 225 medium-term trend as of 2 Aug 2023 (Source: TradingView, click to enlarge chart)
Several medium-term negative elements have surfaced in the price actions of the Japan 225 Index. Yesterday’s price action has formed a daily “Shooting Star candlestick pattern that indicates the risk of a bearish reversal in sentiment.
Today’s longed-body bearish candlestick follow-through has increased the odds of such a bearish reversal that may see the Index break below its 50-day moving average (now at 32,590) that has supported the Index since 27 March 2023.
The potential break below the 50-day moving average may unleash a multi-week corrective decline within a major uptrend phase of the Index.
Minor decline from the 1 August high of 33,490 reached an oversold condition
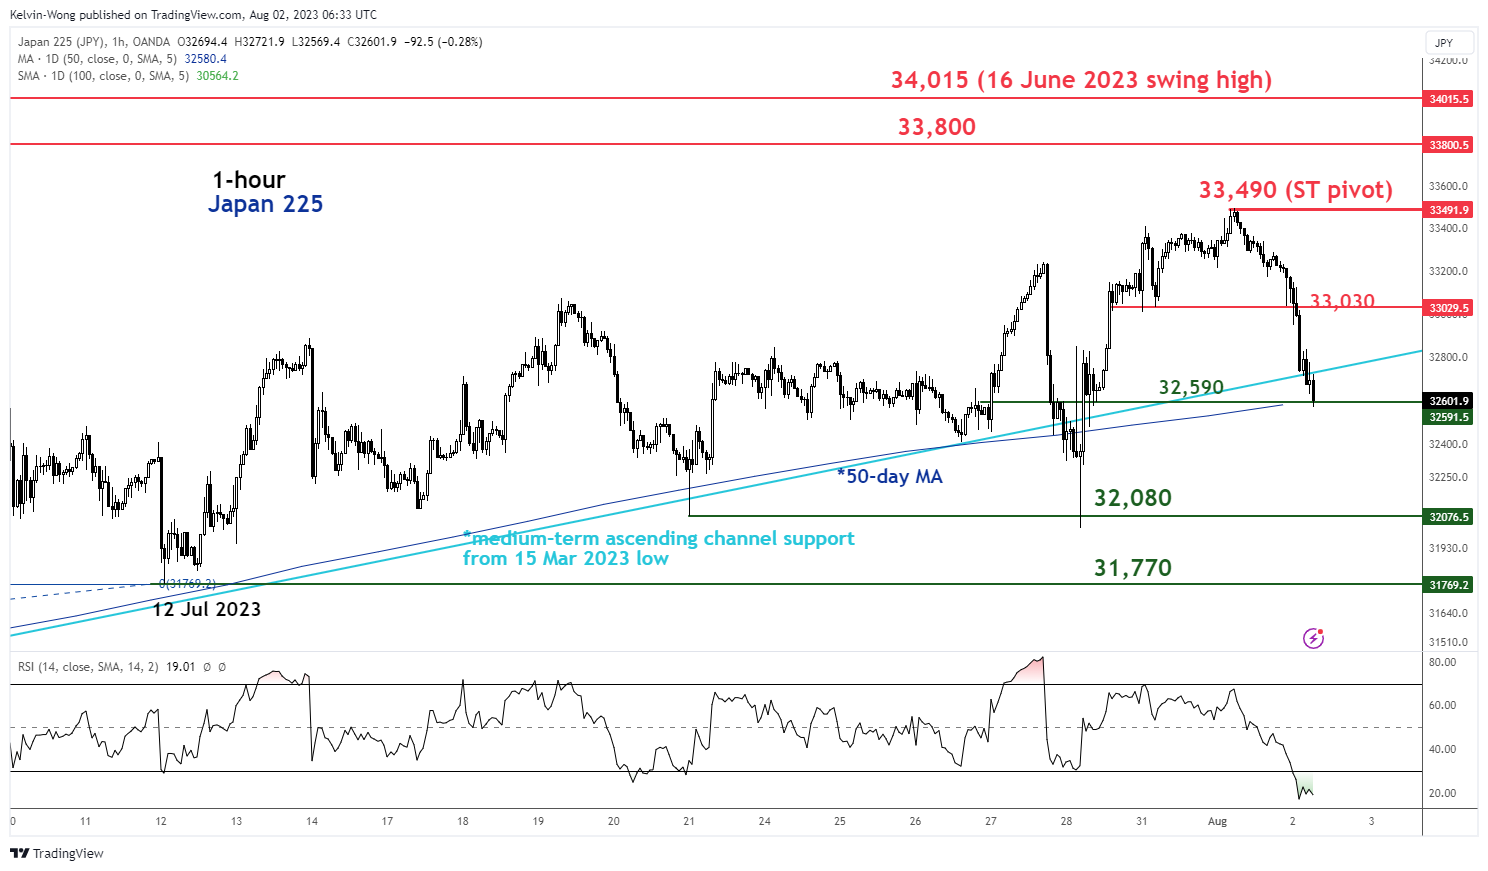
Fig 2: Japan 225 minor short-term trend as of 2 Aug 2023 (Source: TradingView, click to enlarge chart)
The ongoing minor decline from yesterday, 1 August high of 33,490 has led the hourly RSI oscillator to reach its oversold region that indicates a potential imminent bounce may take shape due to overstretched price actions in the short-term.
Watch the 33,030 intermediate resistance (close to 50% Fibonacci retracement of the current minor decline from the 1 August high of 33,490 to today’s current intraday low of 32,544).
33,490 key short-term pivotal resistance to maintain the short-term bearish tone with the next supports coming in at 32,080, and 31,770 (12 July 2023 swing low).
On the flip side, a clearance above 33,490 invalidates the bearish tone to see the next resistances at 33,800 and 34,015 in the first step.
Fitch’s Decision Unnerves Asian-Pacific Traders
Markets
Core bonds slipped yesterday. US yields pushed between 2.5 and 8.5 bps higher in a steepening move. German yields followed that trend closely by adding 2.6-7.1 bps. The yield surge came after the US Treasury boosted its quarterly borrowing estimate for July through September to $1000bn, well up from the $733bn it projected in May. Reasons for the upward revision include a higher planned cash balance as well as a deteriorating budget deficit. The latter is by the way one of the key elements in Fitch’s US downgrade (see below). Economic data included the US July manufacturing ISM and JOLTS June report. Both undershot expectations but the impact on markets was both temporary and negligible. As yields shot up, equities dropped. A strong July month likely also caused some vertigo amongst investors amid a flurry of mixed-to-disappointing earnings. European stocks dropped 1.4% (EuroStoxx50). Wall Street finished between 0.2% higher (DJI) and 0.4% lower (Nasdaq). A more or less equal performance by USTs and Bunds kept EUR/USD nicely balanced. The pair closed marginally lower just south of 1.10. Sterling fell, bringing EUR/GBP close to the 0.86 barrier again. Japan’s yen extended a decline. USD/JPY moved higher to 142.29 while EUR/JPY gets within striking distance of its previous multi-year high.
Fitch’s decision unnerves Asian-Pacific traders. In an echo to 2011, risk assets drop but ironically USTs show resilience. US yields gapped lower at the open before paring some of the losses, in longer tenors especially. Japanese stocks underperform with the Nikkei losing 2.5%. In currency markets, the euro is topping the G10 leaderboard, eking out a small gain against the dollar as well. The kiwi dollar faces selling pressure from a labour market report showing wage pressures easing. The remainder of the economic calendar is pretty meagre with only the US unofficial ADP job report scheduled for release. Consensus expects a solid 190k employment growth in July after a bumper June (+497k). With the payrolls due on Friday and Fitch’s minor bombshell, the report is probably of second-tier importance for today, barring a huge surprise in the outcome. Short-term yields both in Europe and the US remain close to their cycle highs. We look out whether the US 10-y maintains the 4% barrier it recovered yesterday. Germany’s 10-y is sniffing at the 2.55% resistance. EUR/USD is in technically neutral area. A break below 1.0865 turns the picture dollar positive but probably requires remaining US data (from ADP and services ISM over the payrolls to CPI next week) to be (very) strong.
News and views
New Zealand employment grew a more-than-expected 1% q/q in Q2 of this year. The slight deceleration from an upwardly revised 1.1% in Q1 brings employment 4% higher compared to the same period last year and the level is higher than the central bank projected in May. However, labour supply is rising faster than demand. The participation rate rose to a record high of 72.4%, pushing up the unemployment rate from 3.4% to 3.6%. While wages still rise a well above-average 1.9% q/q, the aforementioned dynamics are expected to dampen wage growth going forward. Wages climbed 4.3% y/y, slightly below the RBNZ’s 4.4% forecast and slowing from the 4.5% in Q1, which was the highest since the data were first published in 1993. The central bank in May signaled the end of its tightening cycle with the policy rate at 5.5%. Market odds prior to today’s labour market report were nevertheless slightly in favour of one more hike (56%) as, amongst others, (domestic) inflation is still much too high. That has now turned (44%). The kiwi dollar loses territory against the greenback. NZD/USD drops towards 0.61.
Credit rating agency Fitch removed the US top AAA-rating by lowering it one level to AA+. It had warned to do so back in May, when Congress bickering over raising the debt limit brought the country only weeks away from defaulting. That was ultimately averted, but Fitch said that the repeated debt-limit clashes and eleventh-hour resolutions caused “erosion of governance”. In addition, the agency is concerned about the US’s swelling fiscal deficits with the situation expected to deteriorate over the next three years at a time government debt is already high and growing. Fitch’s decision is an echo to S&P’s downgrade in 2011, which also followed a clash over the debt limit. Moody’s still gives the US it’s top Aaa grade.
EUR/USD Daily Outlook
Daily Pivots: (S1) 1.0957; (P) 1.0980; (R1) 1.1008; More...
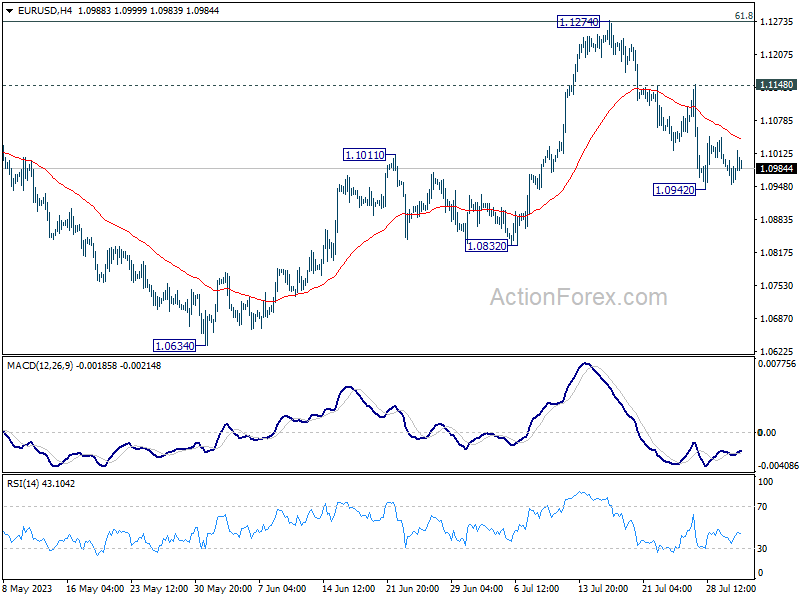
Range trading continues in EUR/USD and intraday bias stays neutral at this point. Further fall is expected as long as 1.1148 resistance holds. Below 1.0942 will target 1.0832 support next. Nevertheless, break of 1.1148 will argue that the decline has completed and bring retest of 1.1274 high.
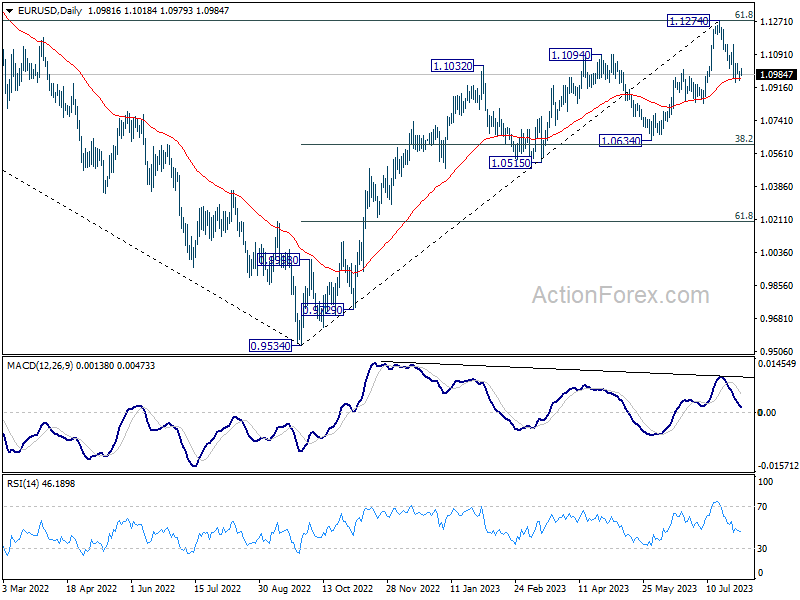
In the bigger picture, a medium term top could be formed at 1.1274, after failing to break through 61.8% retracement of 1.2348 (2021 high) to 0.9534 at 1.1273 decisively, on bearish divergence condition in D MACD. Sustained trading below 55 D EMA (now at 1.0963) will bring deeper correction to 1.0634 cluster support (38.2% retracement of 0.9534 to 1.1274 at 1.0609). Strong support could be seen there, at least on first attempt, to set the range for consolidation.
GBP/USD Daily Outlook
Daily Pivots: (S1) 1.2731; (P) 1.2786; (R1) 1.2832; More...
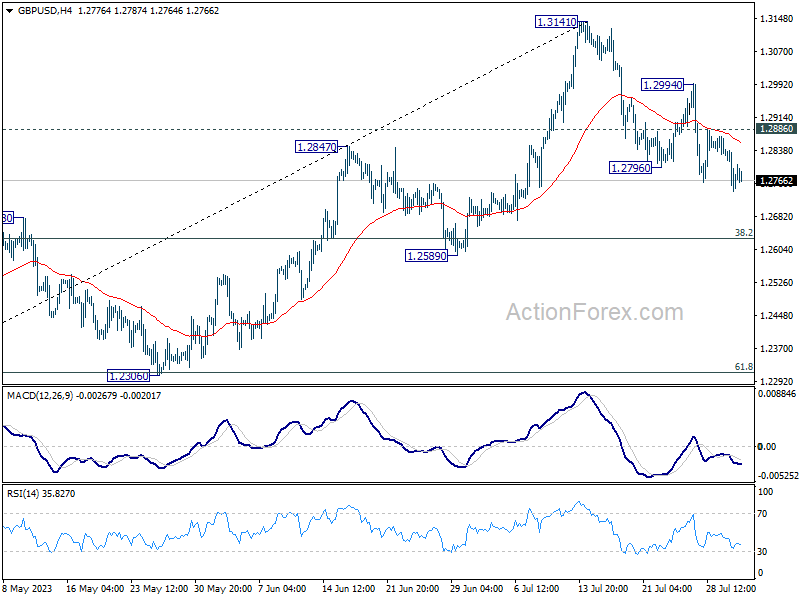
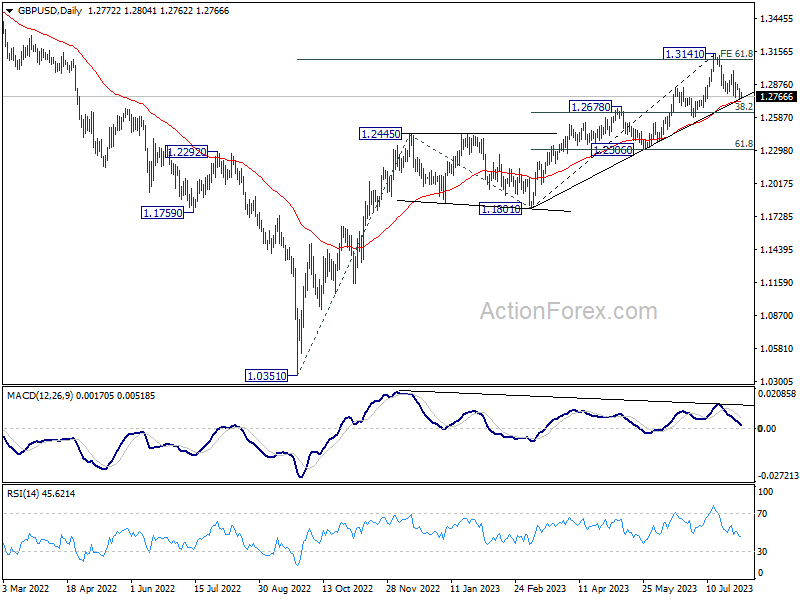
Intraday bias in GBP/USD remains on the downside for the moment. Current fall from 1.3141 would target 38.2% retracement of 1.1801 to 1.3141 at 1.2629, as a correction to rise from 1.1801. On the upside, above 1.2886 minor resistance will turn bias back to the upside for stronger rebound.
In the bigger picture, as long as 1.2678 resistance turned support holds, rise from 1.0351 (2022 low) is expected to continue. Next target is 100% projection of 1.0351 to 1.2445 from 1.1801 at 1.3895. However, sustained break of 1.2678 will argue that it's at least correcting this rally, with risk of bearish reversal.
USD/CHF Daily Outlook
Daily Pivots: (S1) 0.8711; (P) 0.8745; (R1) 0.8784; More....
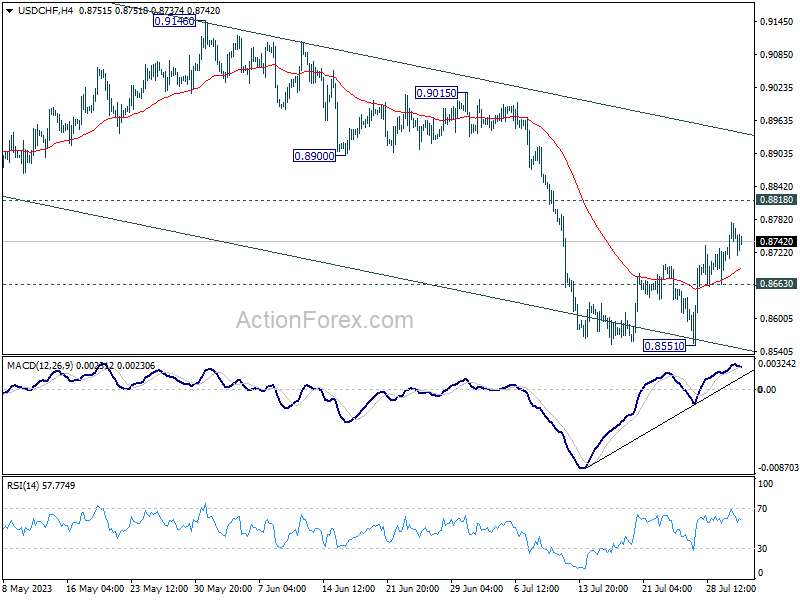
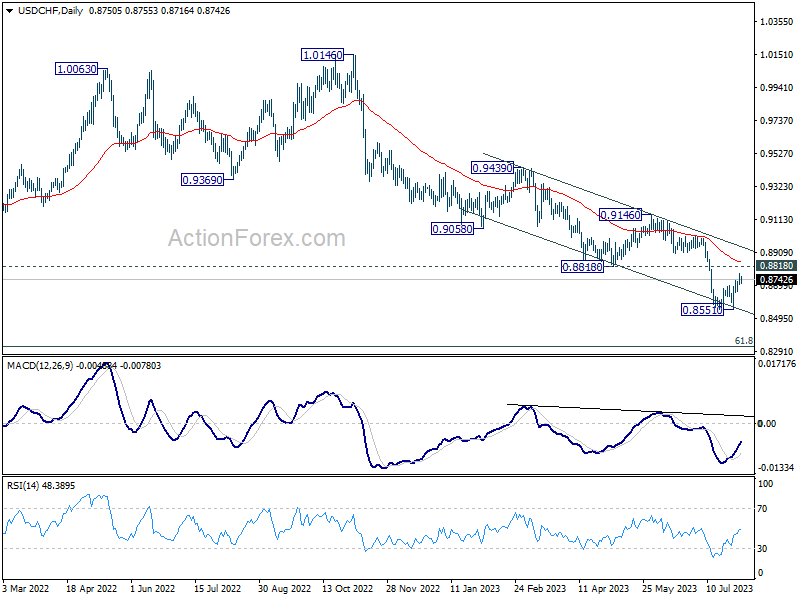
Intraday bias in USD/CHF stays mildly on the upside as rebound from 0.8551 would extend higher. Strong resistance could be seen from 0.8818 support turned resistance to complete the recovery. Below 0.8663 minor support will turn bias back to the downside for retesting 0.8551. However, decisive break of 0.8818 will carry larger bullish implication and target 0.9146.
In the bigger picture, down trend from 1.0146 is seen as in progress as long as 0.8188 support turned resistance holds. Next target is 61.8% retracement of 0.7065 (2011 low) to 1.0342 (2016 high) at 0.8317. However, sustained break of 0.8818 will be the first sign of medium term bottoming, and turn focus back to 0.9146 resistance for confirmation.
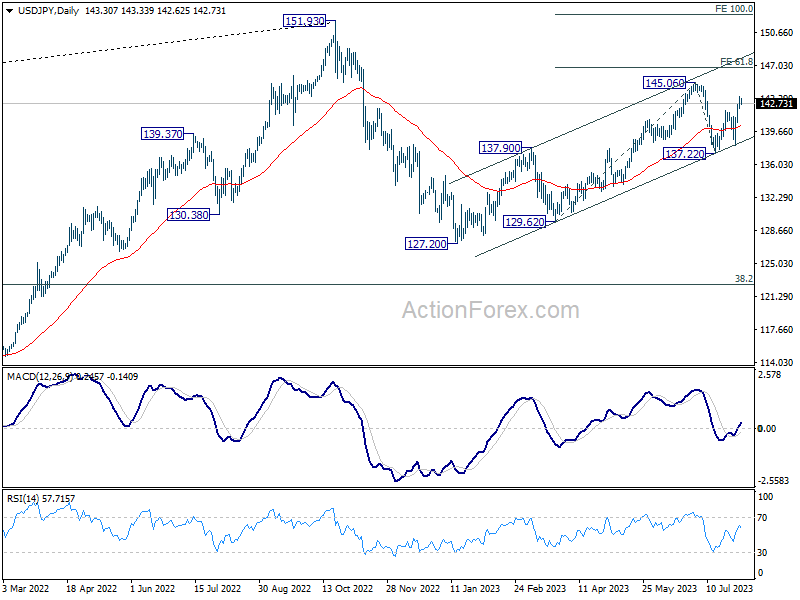
USD/JPY Daily Outlook
Daily Pivots: (S1) 142.52; (P) 143.03; (R1) 143.86; More...
Intraday bias in USD/JPY remains mildly on the upside for the moment. Rise from 137.22 should target a retest on 145.60 resistance first. Decisive break there will resume whole rally from 172.20. Next target is 61.8% projection of 129.62 to 145.06 from 137.22 at 146.76. On the downside, below 141.99 minor support will mix up the outlook and turn intraday bias neutral first.
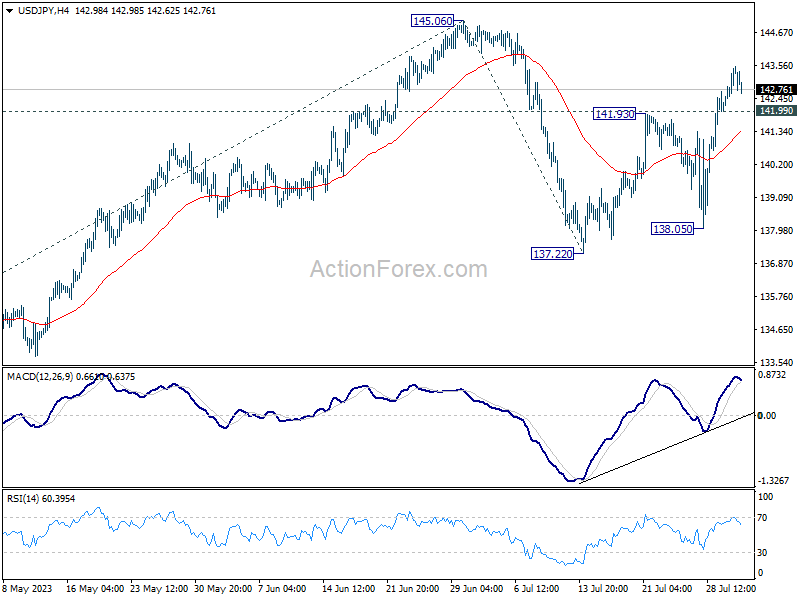
In the bigger picture, overall price actions from 151.93 (2022 high) are views as a corrective pattern. Rise from 127.20 is seen as the second leg of the pattern and could still be in progress. But even in case of extended rise, strong resistance should be seen from 151.93 to limit upside. Meanwhile, break of 137.22 support should confirm the start of the third leg to 127.20 (2023 low) and below.