

Sample Category Title
USD/CAD Daily Outlook
Daily Pivots: (S1) 1.3219; (P) 1.3236; (R1) 1.3270; More....
Intraday bias in USD/CAD remains neutral as sideway consolidation continues. Outlook stays bearish for further decline with 1.3385 resistance intact. On the downside, break of 1.3091 will resume larger fall and target 61.8% projection of 1.3653 to 1.3115 from 1.3386 at 1.3054. However, firm break of 1.3386 will indicate near term reversal and turn outlook bullish.
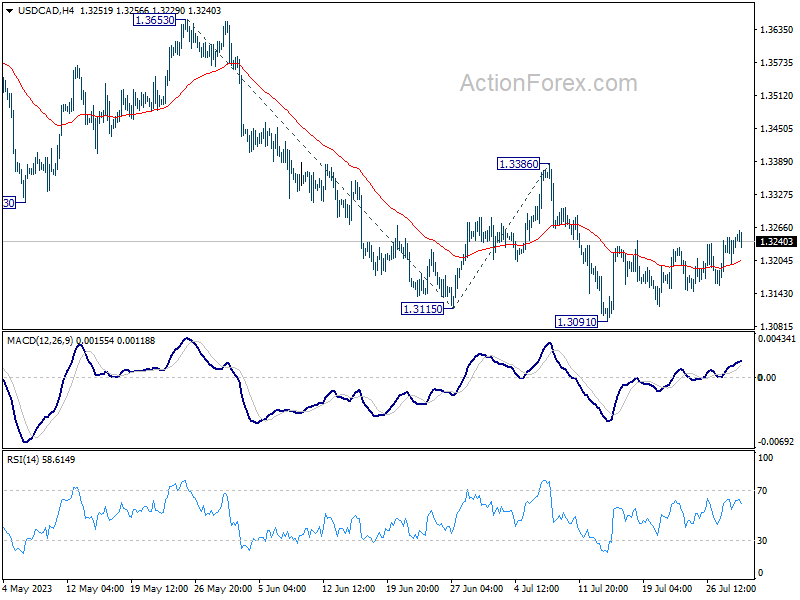
In the bigger picture, price actions from 1.3976 are viewed as a correction to up trend from 1.2005 (2021 low) only. But even so, deeper decline is expected as long as 1.3386 resistance holds. Further fall could be seen to 61.8% retracement of 1.2005 to 1.3976 at 1.2758. Meanwhile, break of 1.3386 will be a sign that the correction has completed and bring stronger rally back to retest 1.3976.
EUR/GBP Daily Outlook
Daily Pivots: (S1) 0.8551; (P) 0.8571; (R1) 0.8591; More...
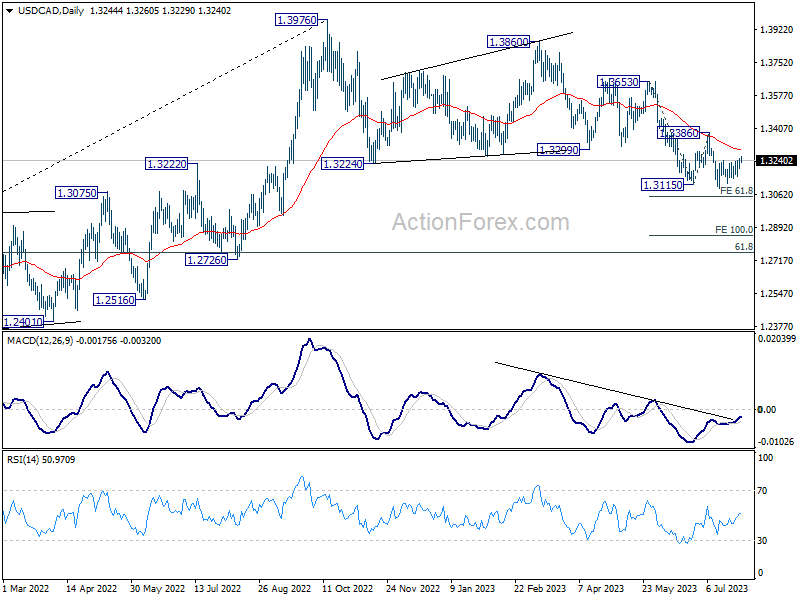
Intraday bias in EUR/GBP stays neutral for the moment. On the downside, below 0.8543 will target a test on 0.8502 low. Decisive break there will resume larger decline from 0.8977. On the upside, above 0.8618 minor resistance will turn bias back to the upside for 0.8700, and possibly further to 0.8717 key support turned resistance.
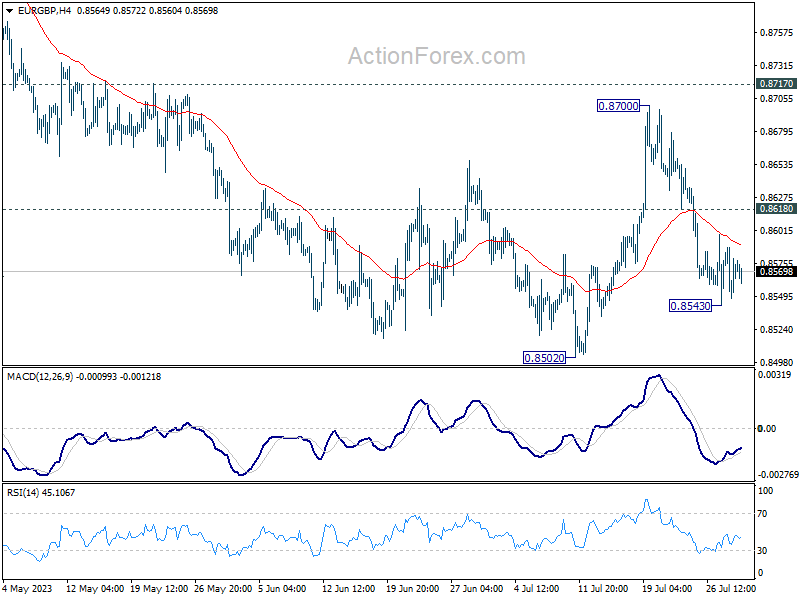
In the bigger picture, the down trend from 0.9267 (2022 high) is seen as part of the long term range pattern from 0.9499 (2020 high). Firm break of 0.8717 support turned resistance will argue that it has completed with three waves down to 0.8502. Further break of 0.8977 will bring retest of 0.9267 high. Nevertheless, rejection by 0.8717, followed by break of 0.8502 will resume the decline towards 0.8201 (2022 low).
EUR/AUD Daily Outlook
Daily Pivots: (S1) 1.6426; (P) 1.6502; (R1) 1.6650; More...
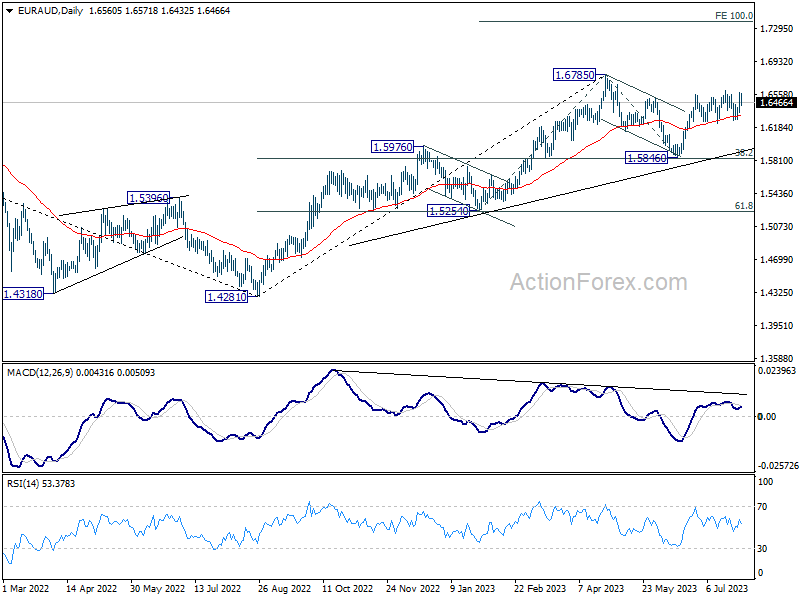
Intraday bias in EUR/AUD remains neutral as sideway trading continues. Further Further rally is expected with 1.6231 support intact. Firm break of 1.6601 will solidify the case that corrective fall from 1.6785 has completed, and target a retest on this high next.
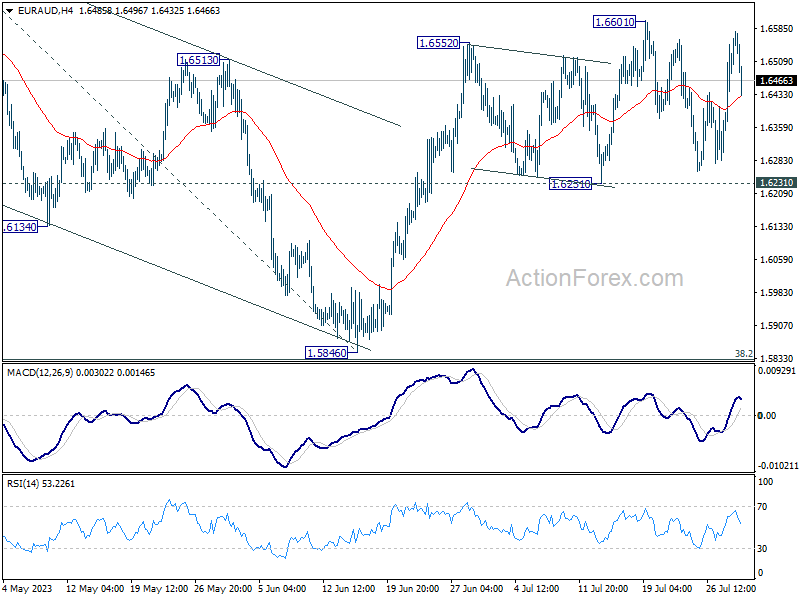
In the bigger picture, with 38.2% retracement of 1.4281 to 1.6785 at 1.5828 intact, rally from 1.4281 is still in progress. Firm break of 1.6785 will confirm rise resumption. Next target is 100% projection of 1.5254 to 1.6785 from 1.5846 at 1.7377. On the other hand, rejection by 1.6785 will extend the corrective pattern with another fall leg. But outlook will stay bullish as long as 1.5828 holds.
EUR/CHF Daily Outlook
Daily Pivots: (S1) 0.9546; (P) 0.9570; (R1) 0.9616; More...
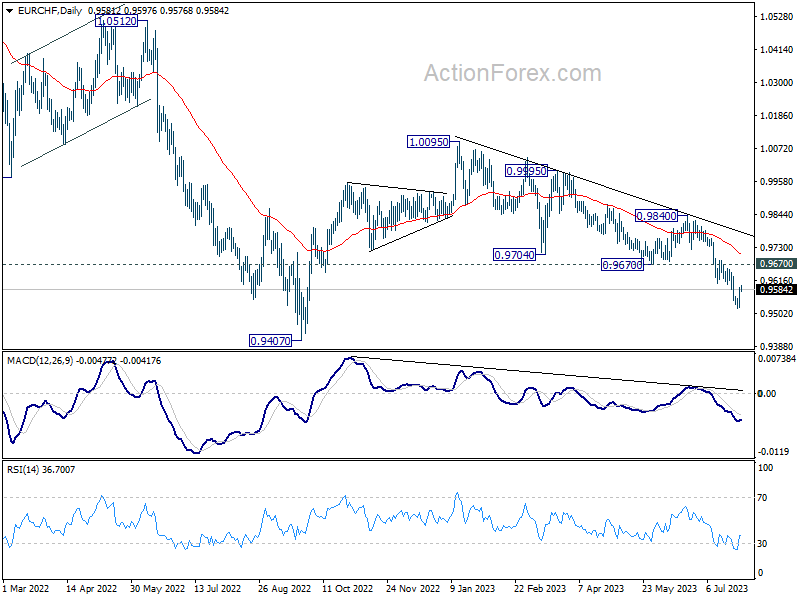
Intraday bias in EUR/CHF remains neutral for consolidations above 0.9520. While stronger recovery could be seen, outlook will remain bearish as long as 0.9670 support turned resistance holds. Break of 0.9520 will resume the fall from 1.0095 towards 0.9407 low.
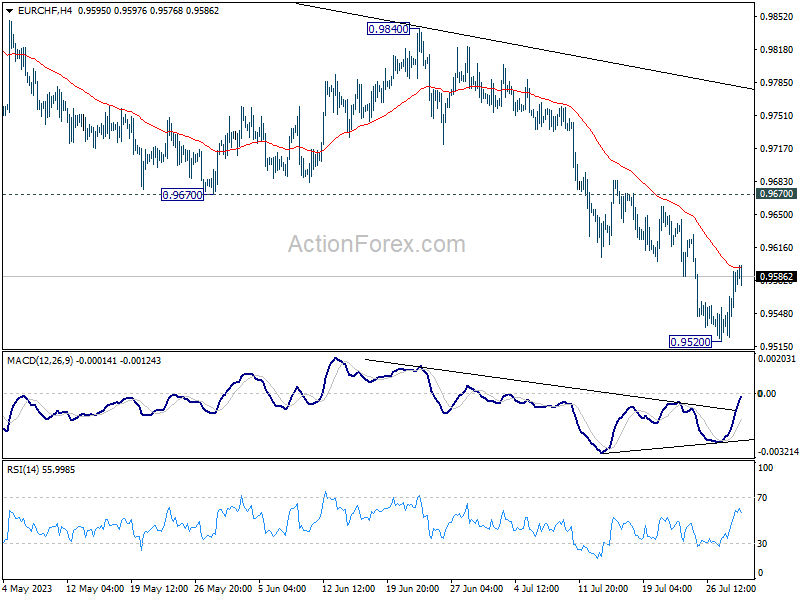
In the bigger picture, medium term outlook is staying bearish as the pair is capped well below falling 55 W EMA (now at 0.9876). Down trend from 1.2004 (2018 high) is in favor to continue. Sustained break of 0.9407 will target 61.8% projection of 1.1149 to 0.9407 from 1.0095 at 0.9018. For now, this will remain the favored case as long as 0.9840 resistance holds, in case of strong rebound.
EUR/JPY Daily Outlook
Daily Pivots: (S1) 152.75; (P) 154.18; (R1) 156.95; More....
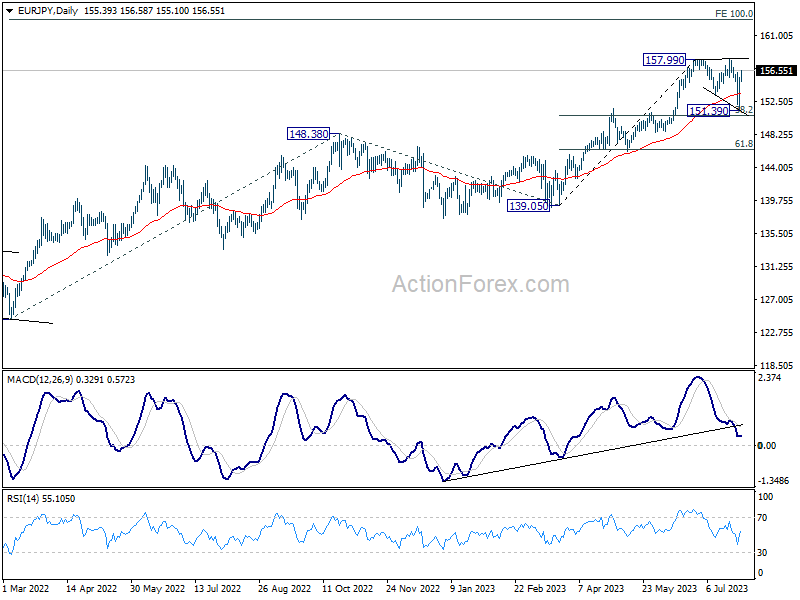
Intraday bias in EUR/JPY is mildly on the upside for retesting 157.99/158.03 resistance. As noted before, correction from 157.99 could have completed at 151.39, just ahead of 38.2% retracement of 139.05 to 157.99 at 150.77. Decisive break of 157.03 will resume larger up trend to 162.82 projection level next. On the downside, below 155.10 minor support will turn intraday bias neutral again. But outlook will remain bullish as long as 150.77 holds, in case of another dip.
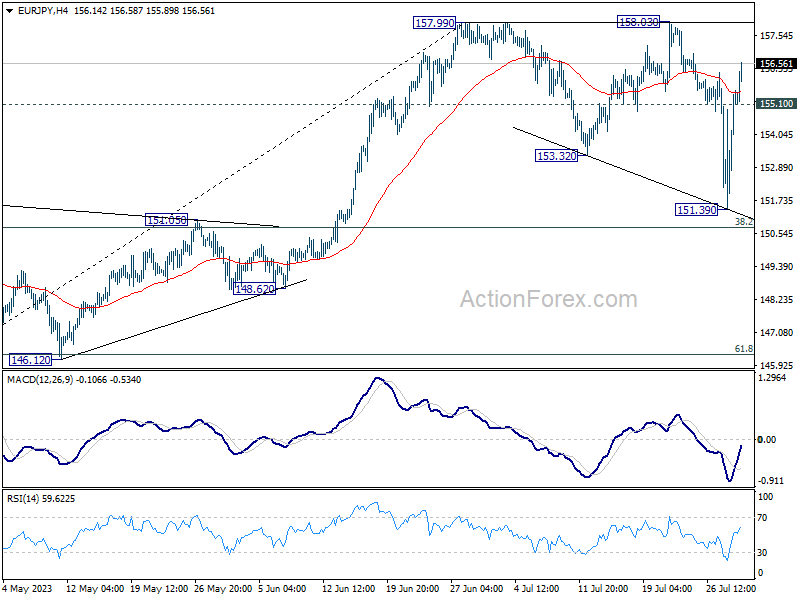
In the bigger picture, as long as 151.60 resistance turned support holds, rise from 114.42 (2020 low) is in progress. On resumption, next target is 100% projection of 124.37 to 148.38 from 138.81 at 162.82. Nevertheless, sustained break of 151.60 will argue that larger correction is already underway. Deeper decline would be seen to 55 W EMA (now at 145.56).
Hang Seng Index Technical: Risk of a Minor Pull-Back after Bullish Breakout
- Price actions staged a bullish breakout from a three-month descending range.
- Daily MACD trend indicator rose to a five-month high reading above the zero centreline which reinforces a medium-term uptrend condition of the Hang Seng Index.
- In the shorter term, a minor pull-back cannot be ruled out due to an extremely overbought reading seen in the hourly RSI oscillator.
- Key short-term support to watch will be at 19,700.
One of China’s proxies benchmark stock indices, the Hang Seng Index staged a bullish breakout last Friday, 28 July on the backdrop of more upcoming consumer-related stimulus measures, and private sector-friendly rhetoric from China’s top policymakers announced in the past two weeks to reverse the current weak internal demand environment in China.
Medium-term bullish breakout from descending range in place since April 2023
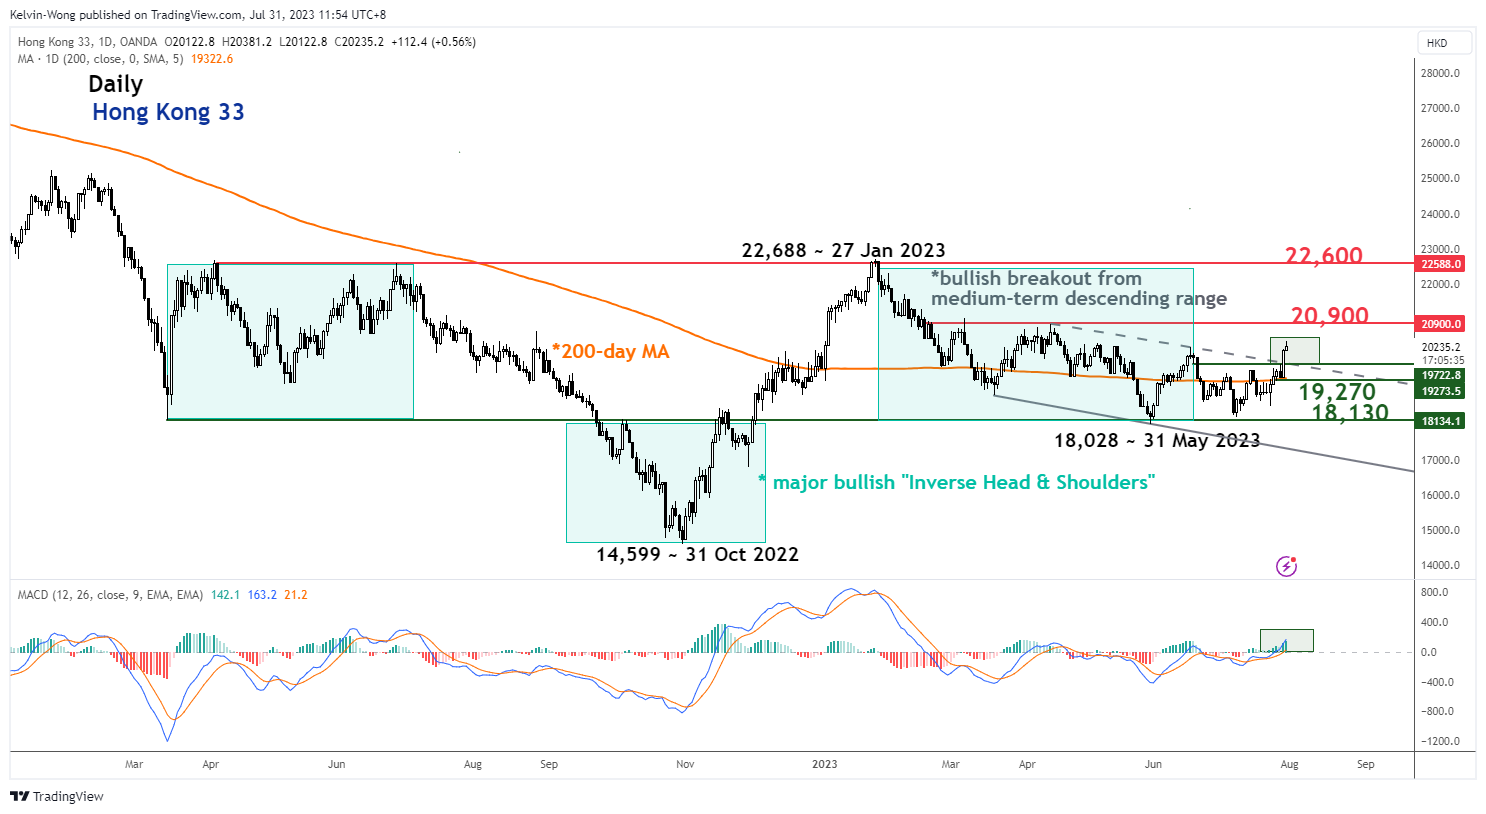
Fig 1: Hong Kong 33 medium-term trend as of 31 Jul 2023 (Source: TradingView, click to enlarge chart)
Price actions of the Hong Kong 33 Index (a proxy for the Hang Seng Index futures) have broken above the medium-term descending range resistance in place since the 17 April 2023 high now turns pull-back support at 19,700. Additionally, in the past week, the Index has recorded a weekly gain of +6.25% which was its best weekly performance seen in the past six months.
The daily MACD trend indicator has pierced above the zero line and recorded a five-month high of 162.9 at this time of the writing which reinforces a medium-term uptrend condition for the Index.
Minor uptrend hit overstretched condition, at risk of a minor pull-back
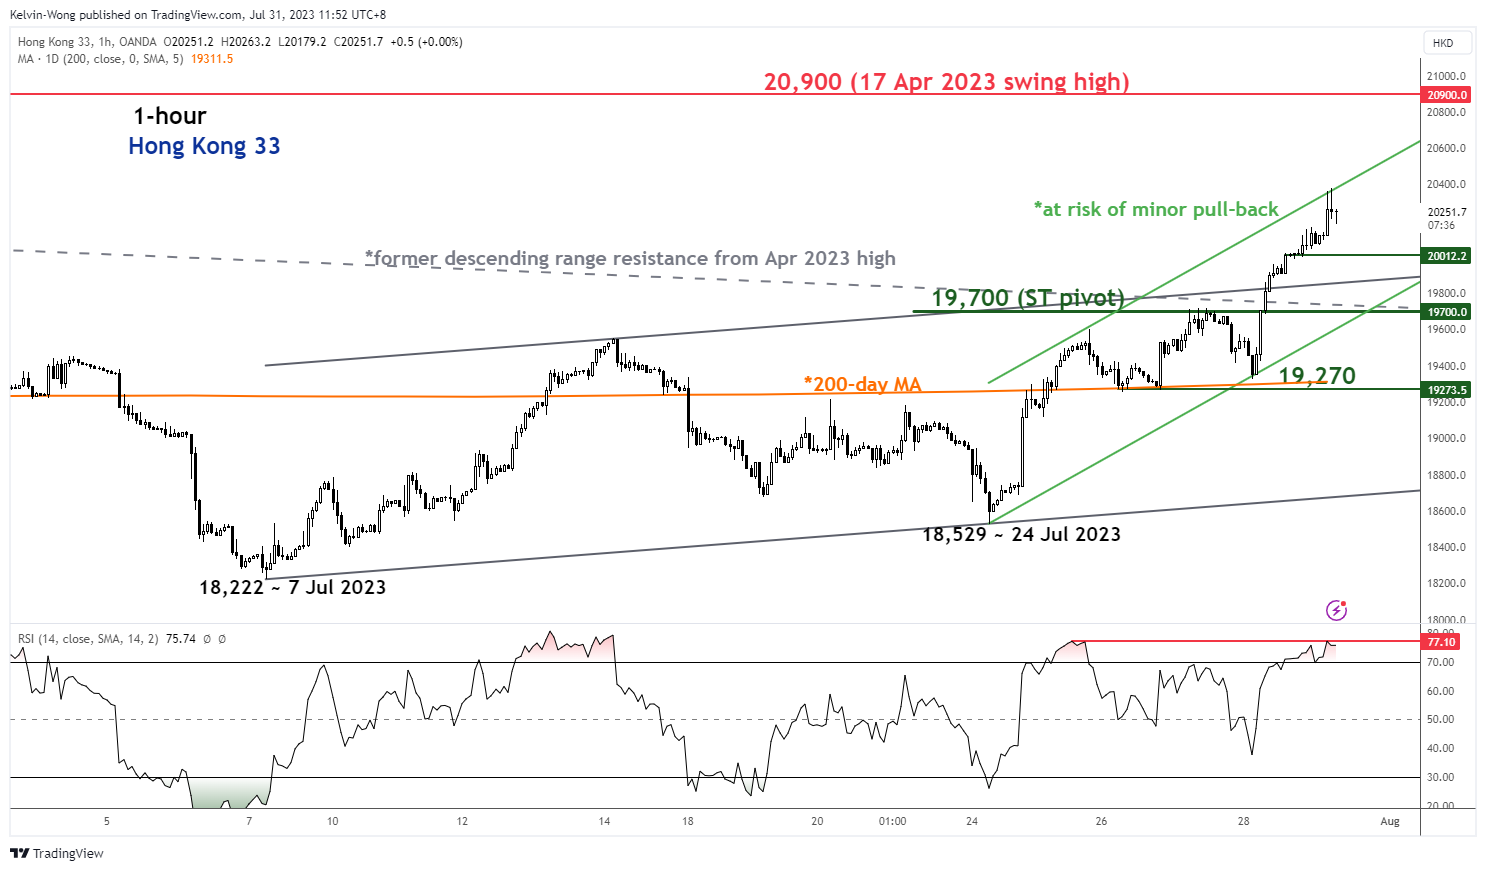
Fig 2: Hong Kong 33 minor short-term trend as of 31 Jul 2023 (Source: TradingView, click to enlarge chart)
In the shorter-term (see 1-hour chart), the price actions of the Index have reached the upper boundary of a minor ascending channel in place since the 24 July 2024 low of 18,529 coupled with an extreme overbought condition reading of 77.10 seen on the hourly RSI oscillator.
These short-term technical elements suggest that the current short-term burst up in price actions is overstretched, and a minor pull-back may occur within its short to medium-term uptrend phases with near-term support at 20,010.
The key short-term pivotal support will be at 19,700 to maintain the short-term uptrend phase from the 24 July 2023 low with the next resistance coming in at 20,900.
However, a break below 19,700 sees a deeper pull-back to expose the next support at 19,270 (also the 200-day moving average).
Technical Outlook and Review
DXY:
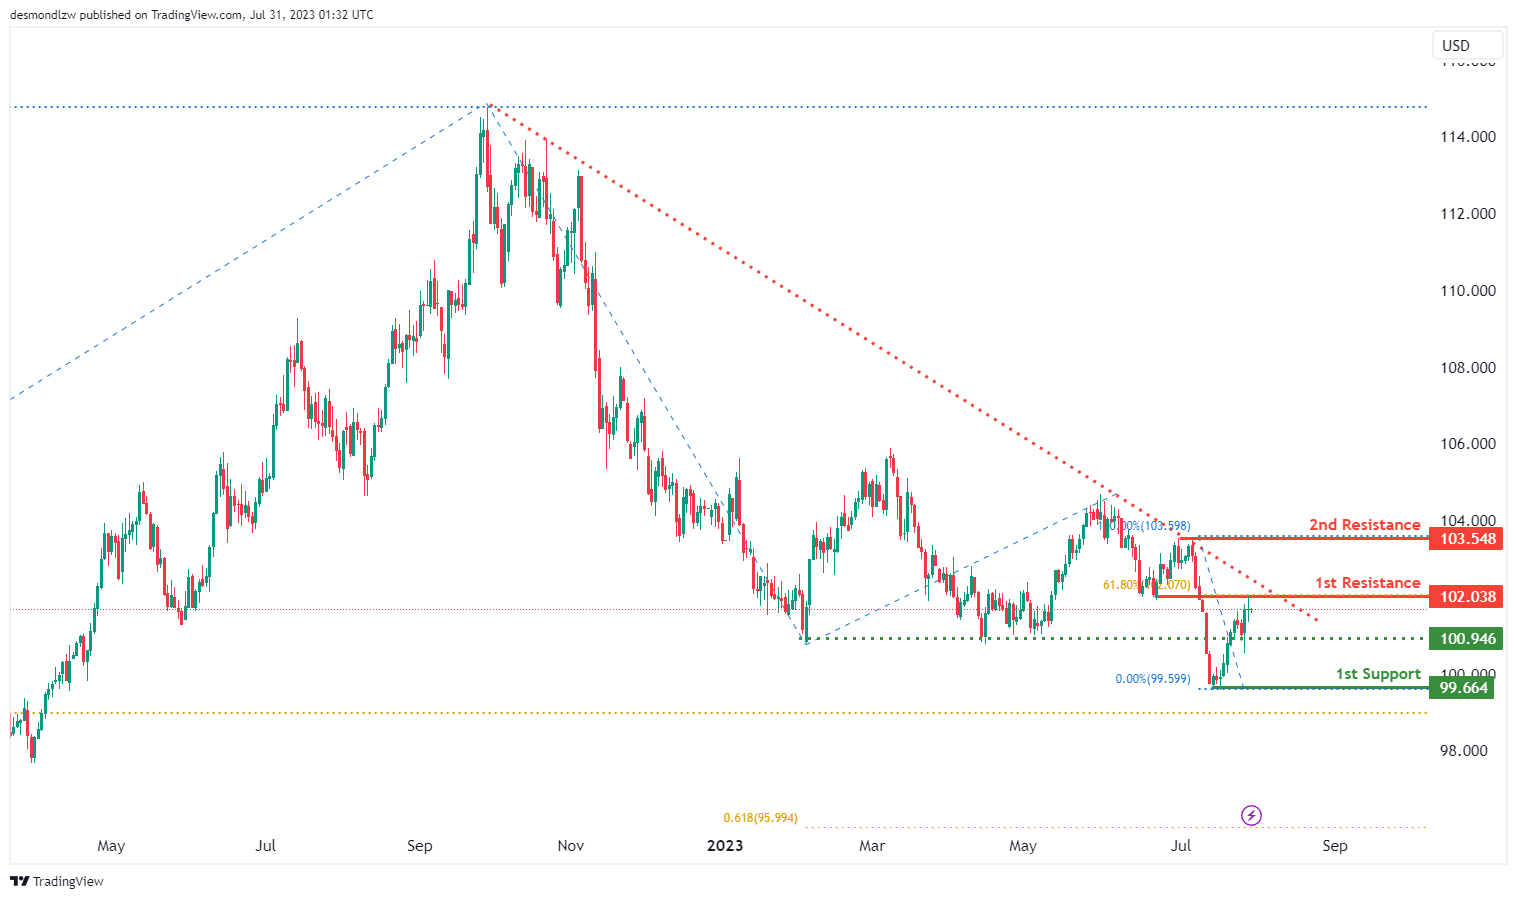
The DXY is demonstrating a bearish trend at the moment, being positioned below a significant descending trend line. This suggests the potential for a continuation of bearish momentum.
The likelihood is that price could potentially continue its bearish move towards the 1st support, located at 99.66. This support level has credibility due to its history as a multi-swing low support.
An intermediate support level is also present at 100.94, acting as a pullback support, offering an additional cushion against a stronger downtrend.
In case of an upward movement, the 1st resistance level to watch is at 102.03. This resistance point is an overlap resistance and also aligns with the 61.80% Fibonacci retracement level.
Further up, the 2nd resistance is found at 103.54. This level has acted as a swing high resistance in the past and could serve as a significant barrier against price advancement.
EUR/USD:
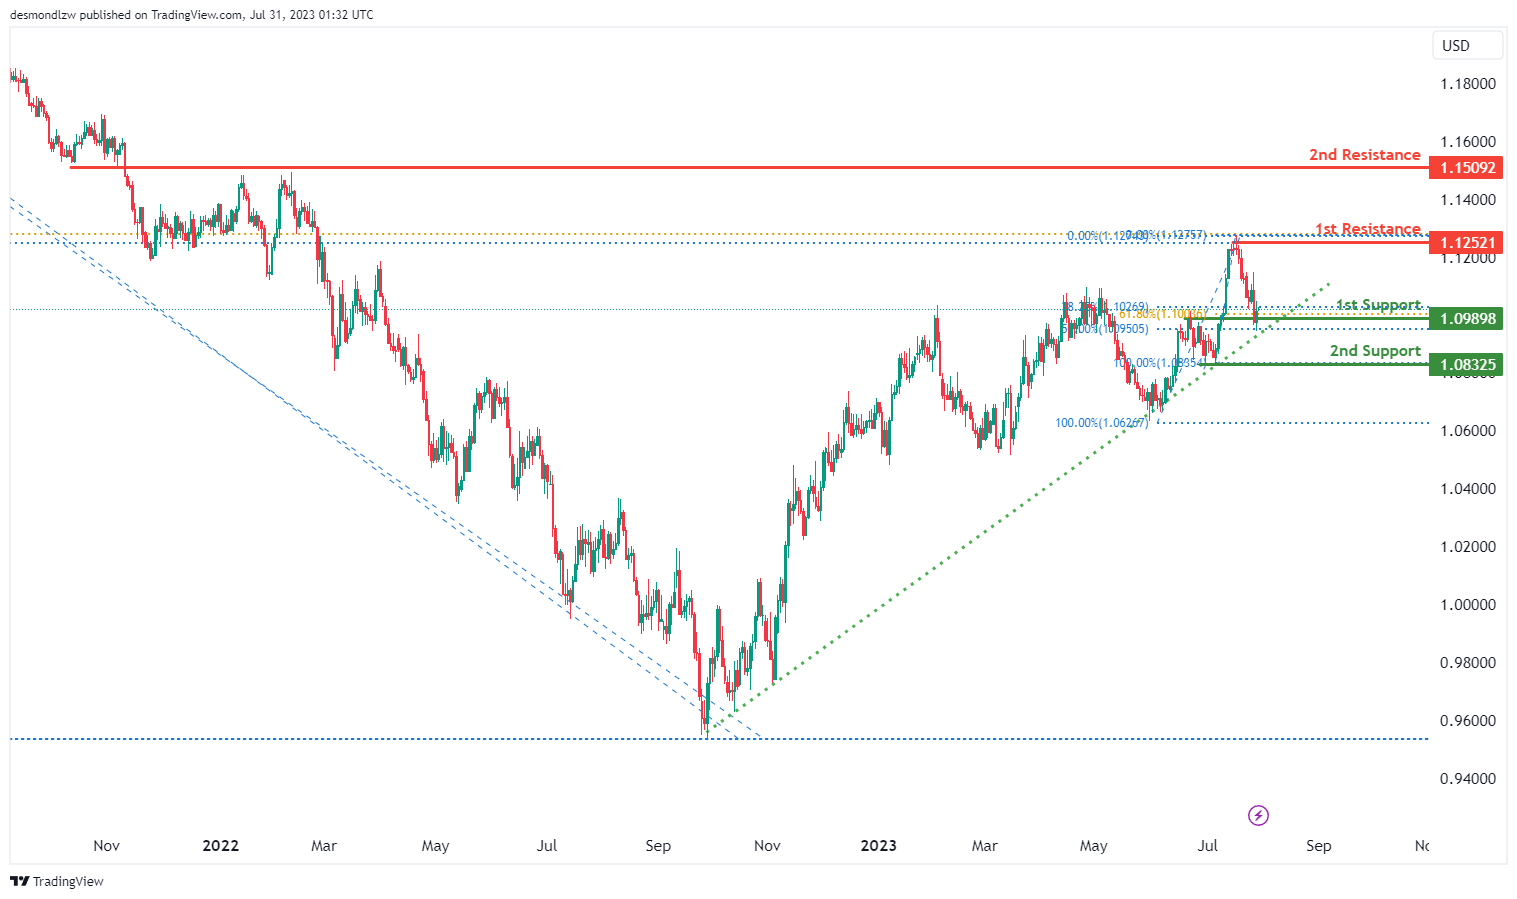
The EUR/USD is currently showing a bullish trend, positioning itself above a key ascending trend line which suggests the potential for additional bullish momentum.
The price is expected to make a bullish bounce off the 1st support level and head towards the 1st resistance. The 1st support level is at 1.0989 and it’s seen as a key level due to its role as an overlap support as well as its alignment with the 61.80% and 50% Fibonacci retracement levels, creating a Fibonacci confluence.
If the price does fall further, the 2nd support at 1.0832 could come into play. This level is deemed solid due to its previous role as a multi-swing low support.
On the upside, the 1st resistance level to watch is at 1.1252, which has functioned as a swing high resistance in the past. Should the price break past this level, the 2nd resistance at 1.1509 could present a challenge. This level is significant as it has served as an overlap resistance previously.
EUR/JPY:
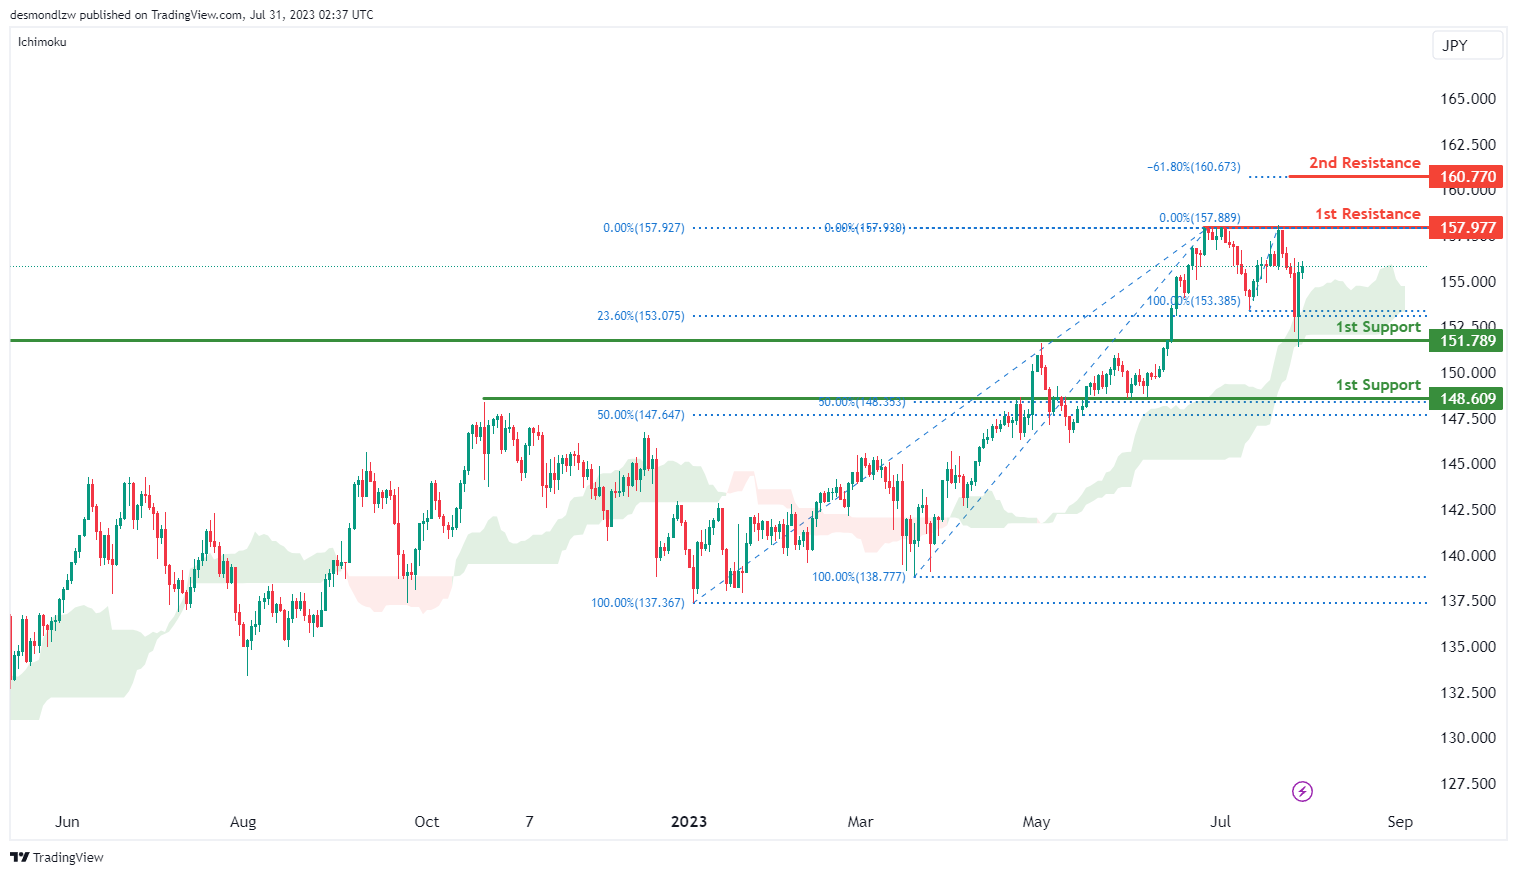
The EUR/JPY chart demonstrates a bullish momentum, supported by the fact that the price is above the bullish Ichimoku cloud.
A potential scenario indicates a bullish continuation towards the 1st resistance level at 157.97. This resistance is considered significant as it represents a multi-swing high resistance.
In case of any potential retracement, the price might find support at the 1st support level of 151.78, which aligns with the 23.60% Fibonacci retracement. Additionally, the 2nd support at 148.60 is another relevant area as it corresponds to the 50% Fibonacci retracement.
Furthermore, there is a 2nd resistance at 160.77, which is identified as the -61.8% Fibonacci expansion level. These support and resistance levels are vital in determining possible price movements for EUR/JPY.
EUR/GBP:
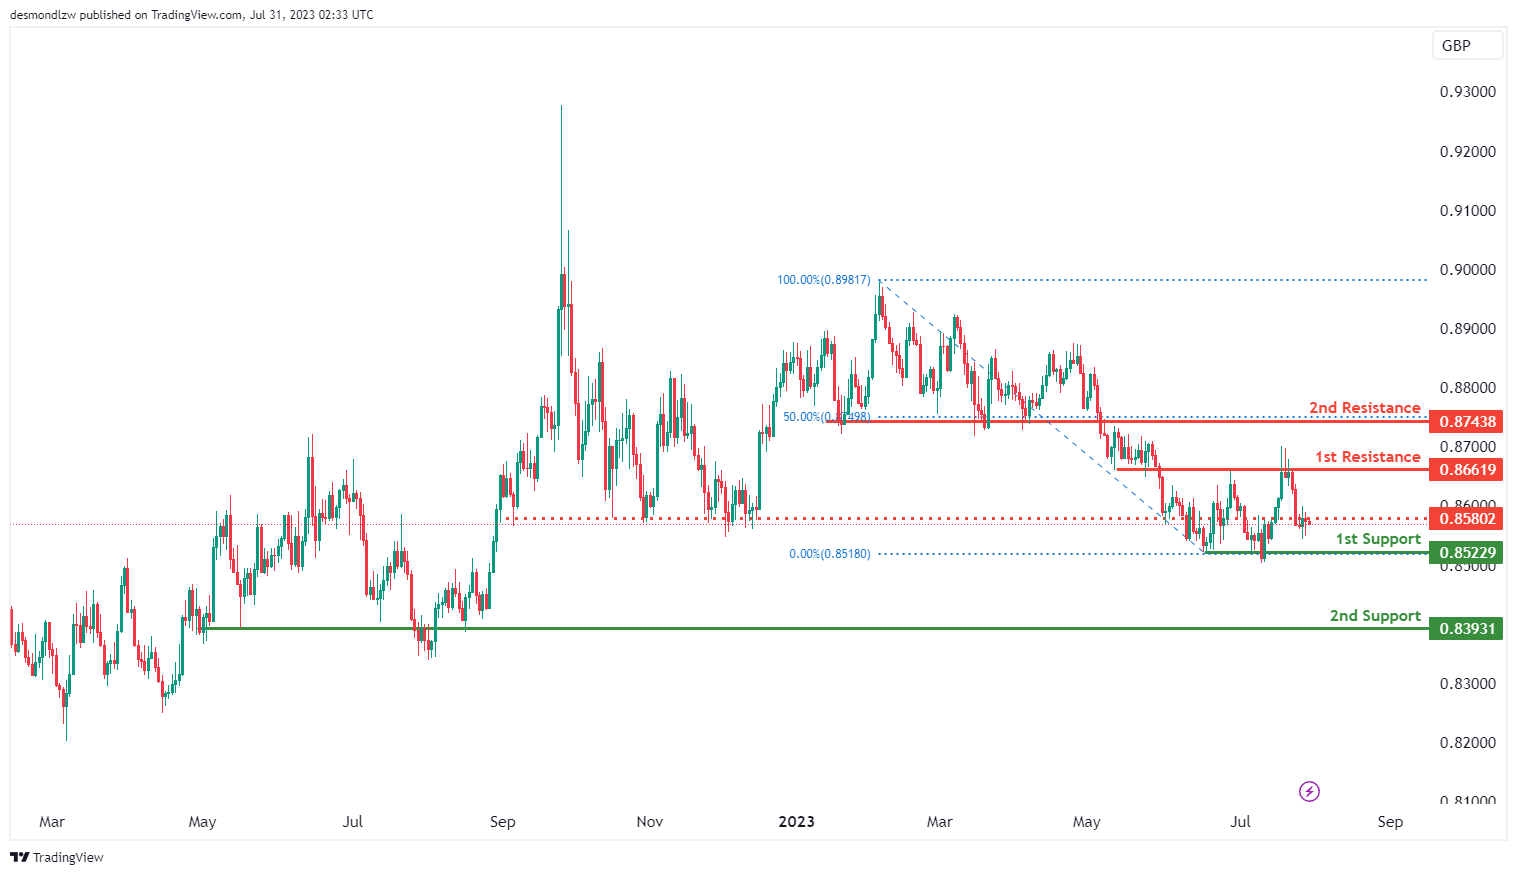
The EUR/GBP chart indicates a bearish momentum, suggesting a potential bearish continuation towards the 1st support level at 0.8522. This support is considered significant as it acts as an overlap support.
In the event of further downward movement, the price might find additional support at the 2nd support level of 0.8393, which also functions as an overlap support.
On the upside, the 1st resistance at 0.8661 is recognized as an overlap resistance, and the 2nd resistance at 0.8743 represents a pullback resistance, coinciding with the 50% Fibonacci retracement. Additionally, there is an intermediate resistance at 0.8580, which also acts as an overlap resistance.
GBP/USD:
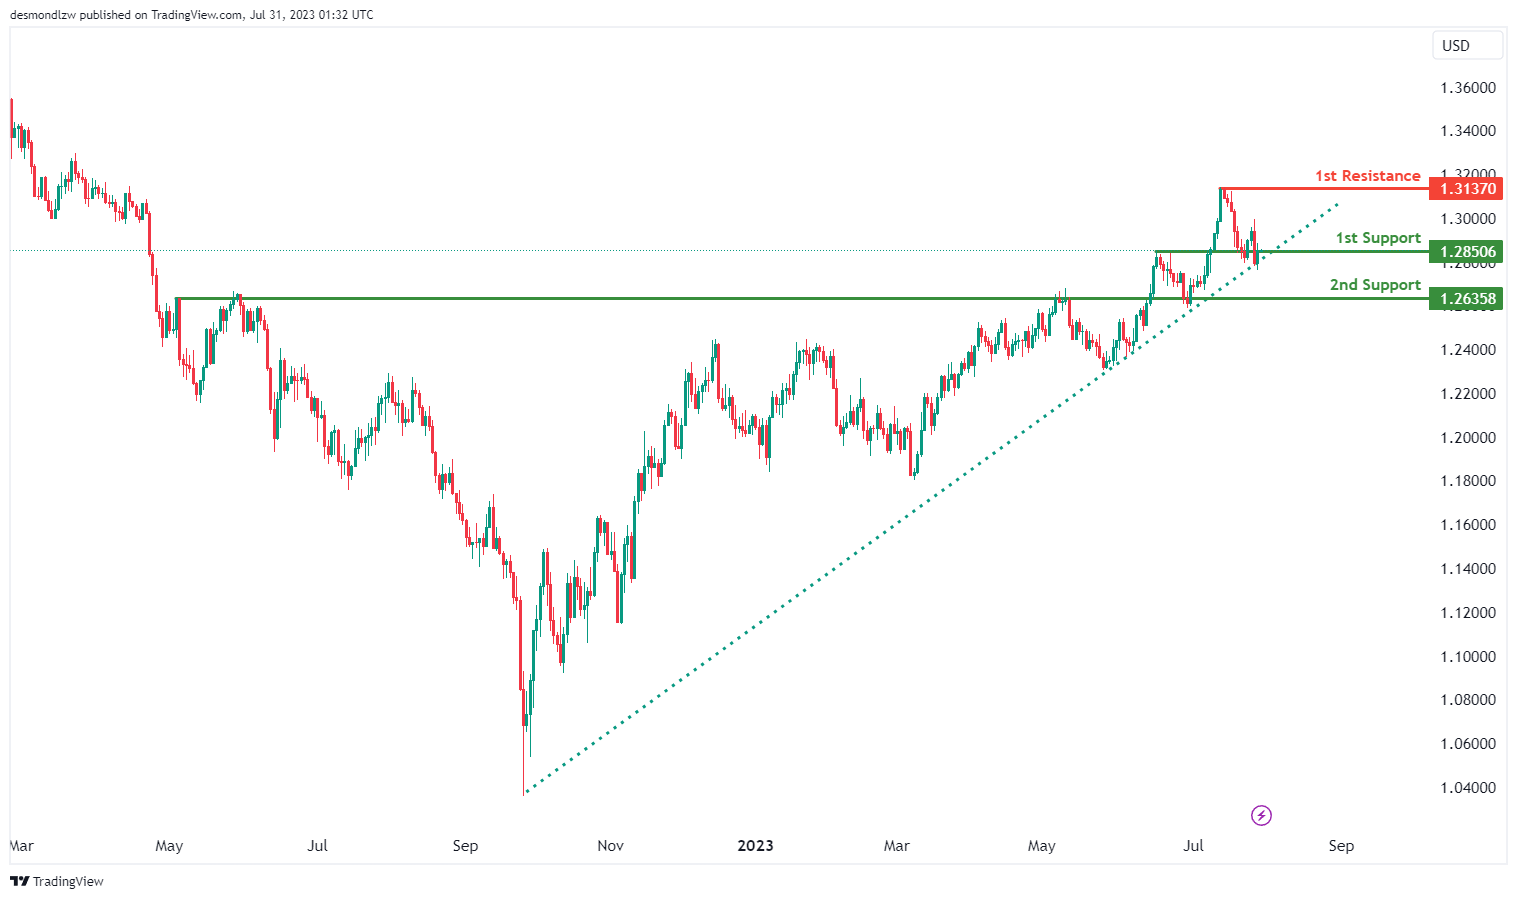
The GBP/USD pair is presently illustrating a bullish trend, as it’s positioned above an important ascending trend line, indicating the potential for further bullish momentum.
The price is anticipated to follow a bullish trajectory towards the 1st resistance. The 1st support level is set at 1.2850 and is considered strong due to its role as an overlap support.
Should the price decline further, the 2nd support at 1.2635, another overlap support, could serve as a significant level to halt the price drop.
On the bullish side, the 1st resistance level is located at 1.3237, a level that has previously served as a swing high resistance, posing a potential hurdle to the price movement.
GBP/JPY:
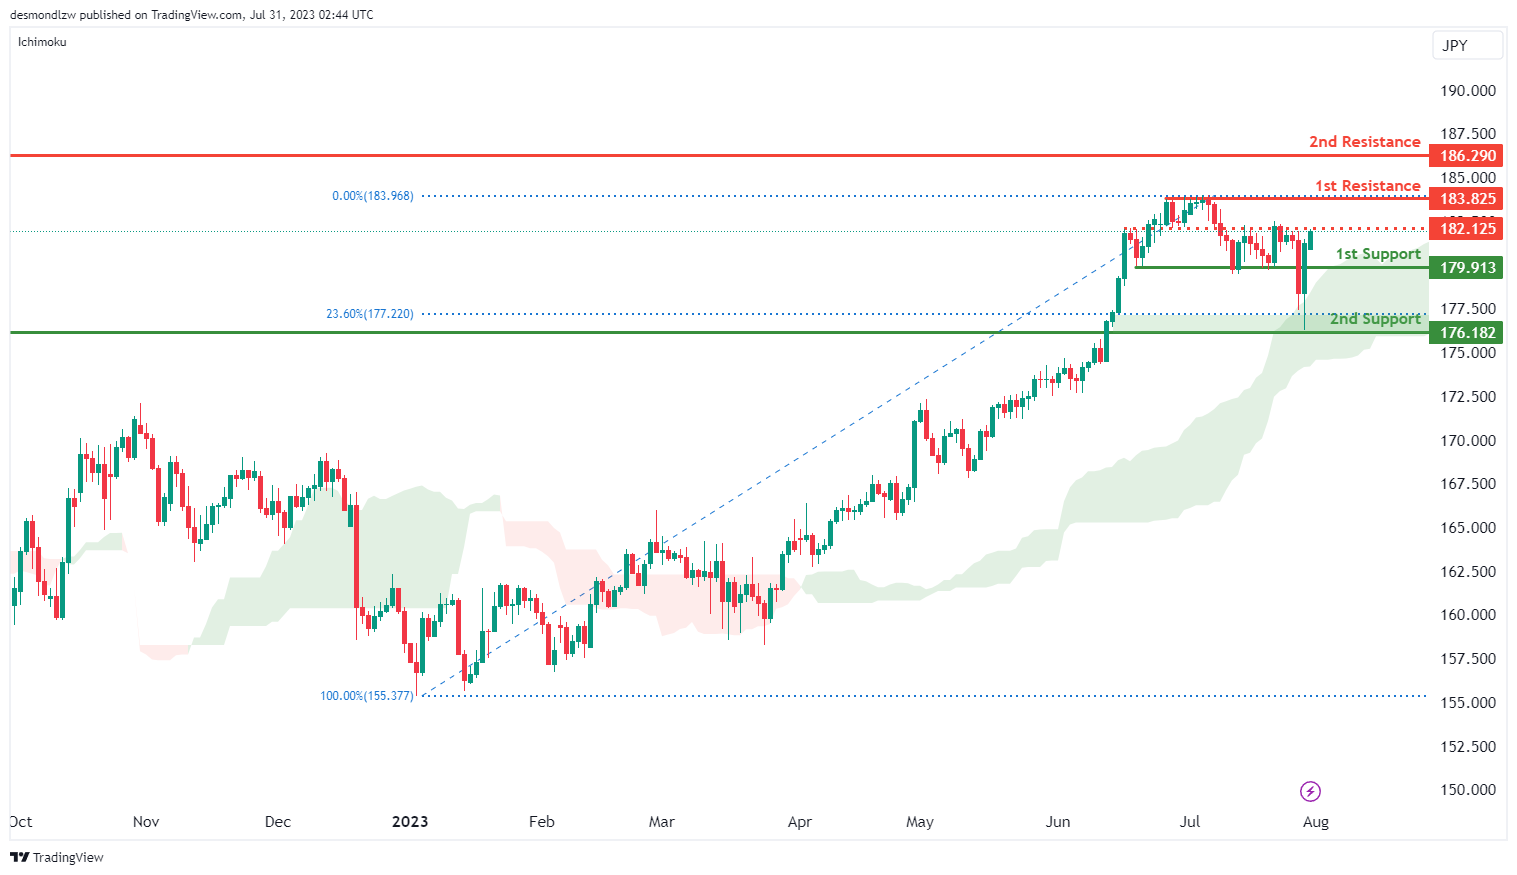
The GBP/JPY chart indicates a bullish momentum, supported by the fact that the price is above the bullish Ichimoku cloud.
A potential scenario suggests a bullish continuation towards the 1st resistance level at 183.82. This resistance is considered significant as it represents a multi-swing high resistance.
In case of any potential retracement, the price might find support at the 1st support level of 179.91. Additionally, the 2nd support at 176.18 is another relevant area as it corresponds to the 23.60% Fibonacci retracement.
Furthermore, there is a 2nd resistance at 186.29, which is identified as a swing high resistance. Moreover, the intermediate resistance at 182.12 also acts as an important overlap resistance.
USD/CHF:
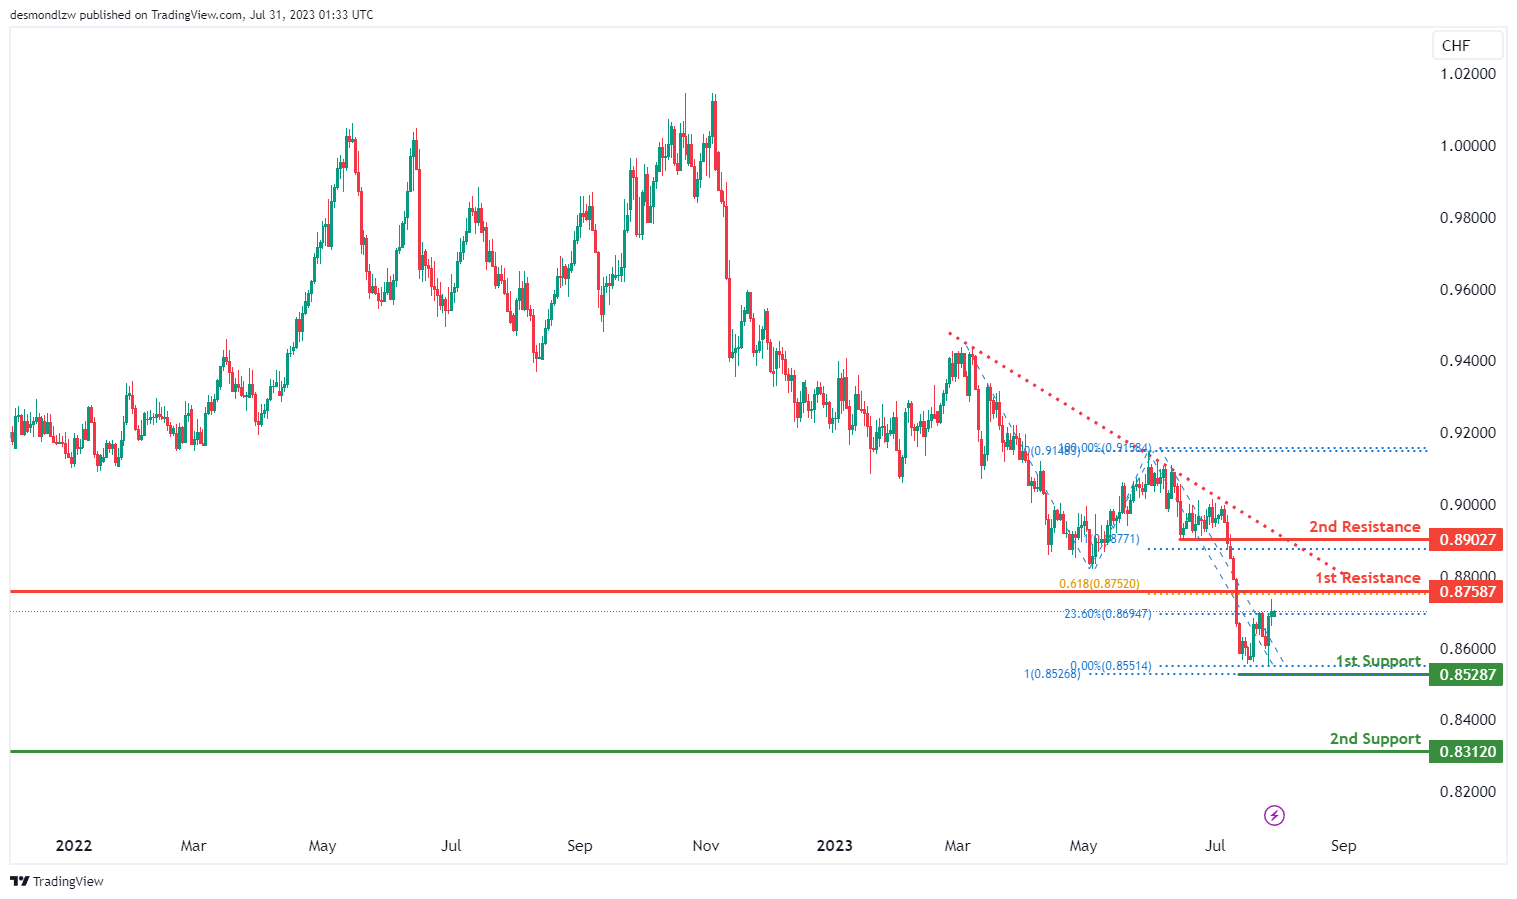
The USD/CHF currency pair is currently showing a bearish trend, positioned below a significant descending trend line, suggesting potential for further bearish momentum.
There could potentially be a bearish reaction off the 1st resistance level, causing the price to drop towards the 1st support level. The 1st support level is found at 0.8528 and it’s important due to its position at the 100% Fibonacci Projection.
If the price continues its downward trajectory, the 2nd support level at 0.8312, serving as a swing low support, could halt further price decline.
On the upward side, the 1st resistance level is at 0.8758, acting as a pullback resistance and corresponding with the 61.80% Fibonacci Projection. If the price manages to exceed this level, it would encounter the 2nd resistance at 0.8902, which serves as a pullback resistance and coincides with the 100% Fibonacci Projection.
USD/JPY:
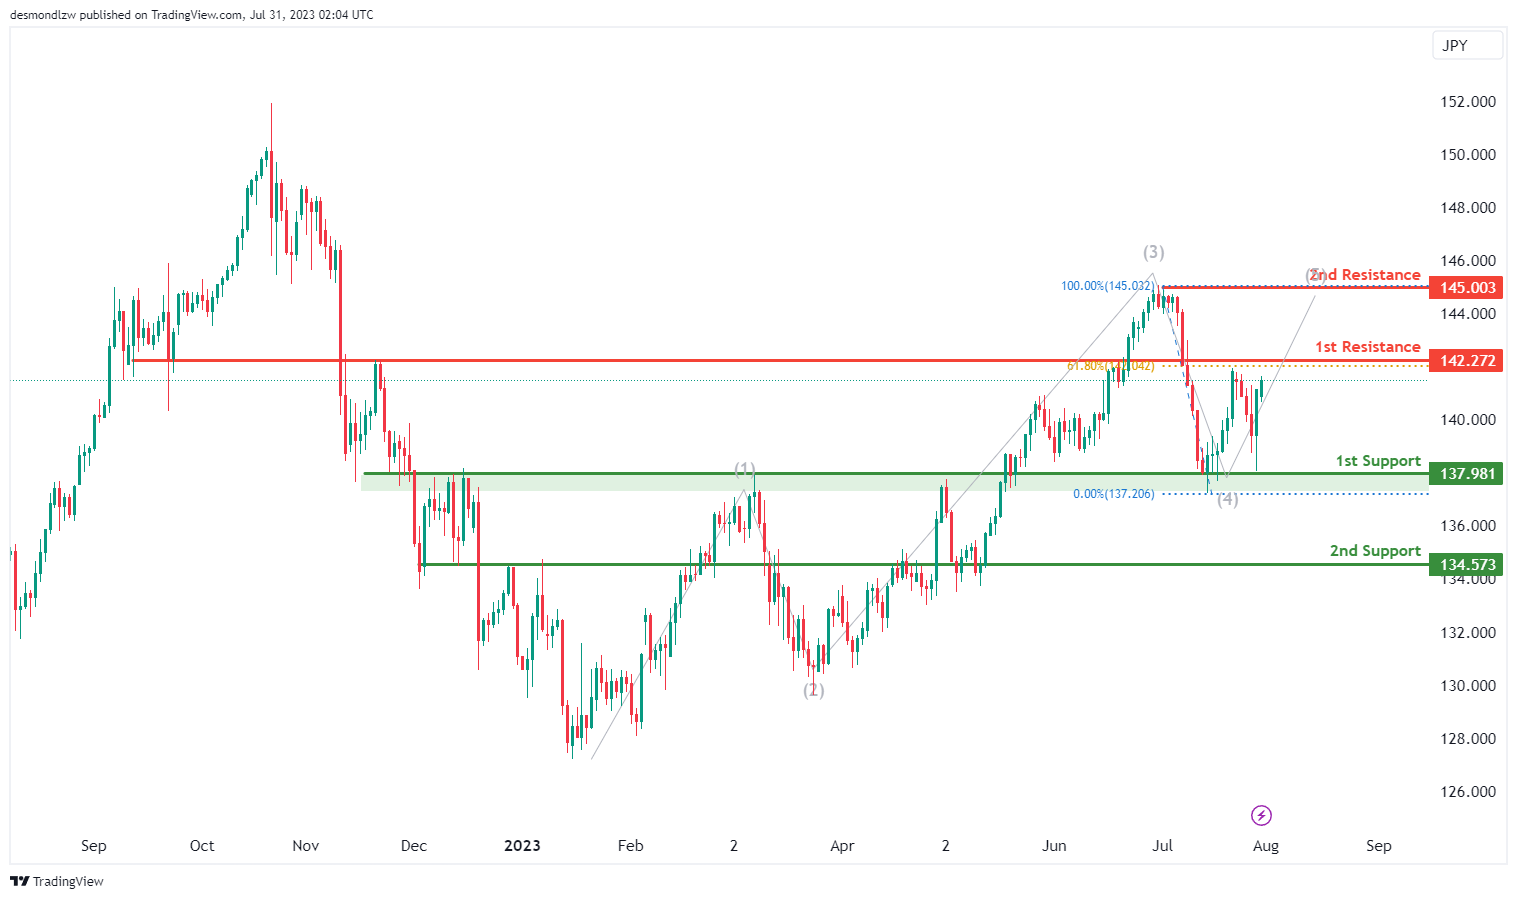
The USD/JPY currency pair is currently displaying a bullish trend, indicating a potential for further upward momentum.
The expectation is that the price may continue its bullish progression towards the 1st resistance level. The 1st support level, positioned at 134.57, provides a key role as an overlap support which could potentially halt any short-term price declines.
If the bearish pull becomes stronger and the price falls below the 1st support, the 2nd support at 134.57, functioning as a pullback support, is the next significant level to watch.
On the other hand, in an upward direction, the 1st resistance level is located at 142.27. This level has previously acted as an overlap resistance and corresponds with the 61.80% Fibonacci retracement level, thus could provide a hurdle to further price increase.
If the price manages to breach this resistance, the 2nd resistance level at 145.00, recognized as a swing high resistance, would be the next target.
USD/CAD:
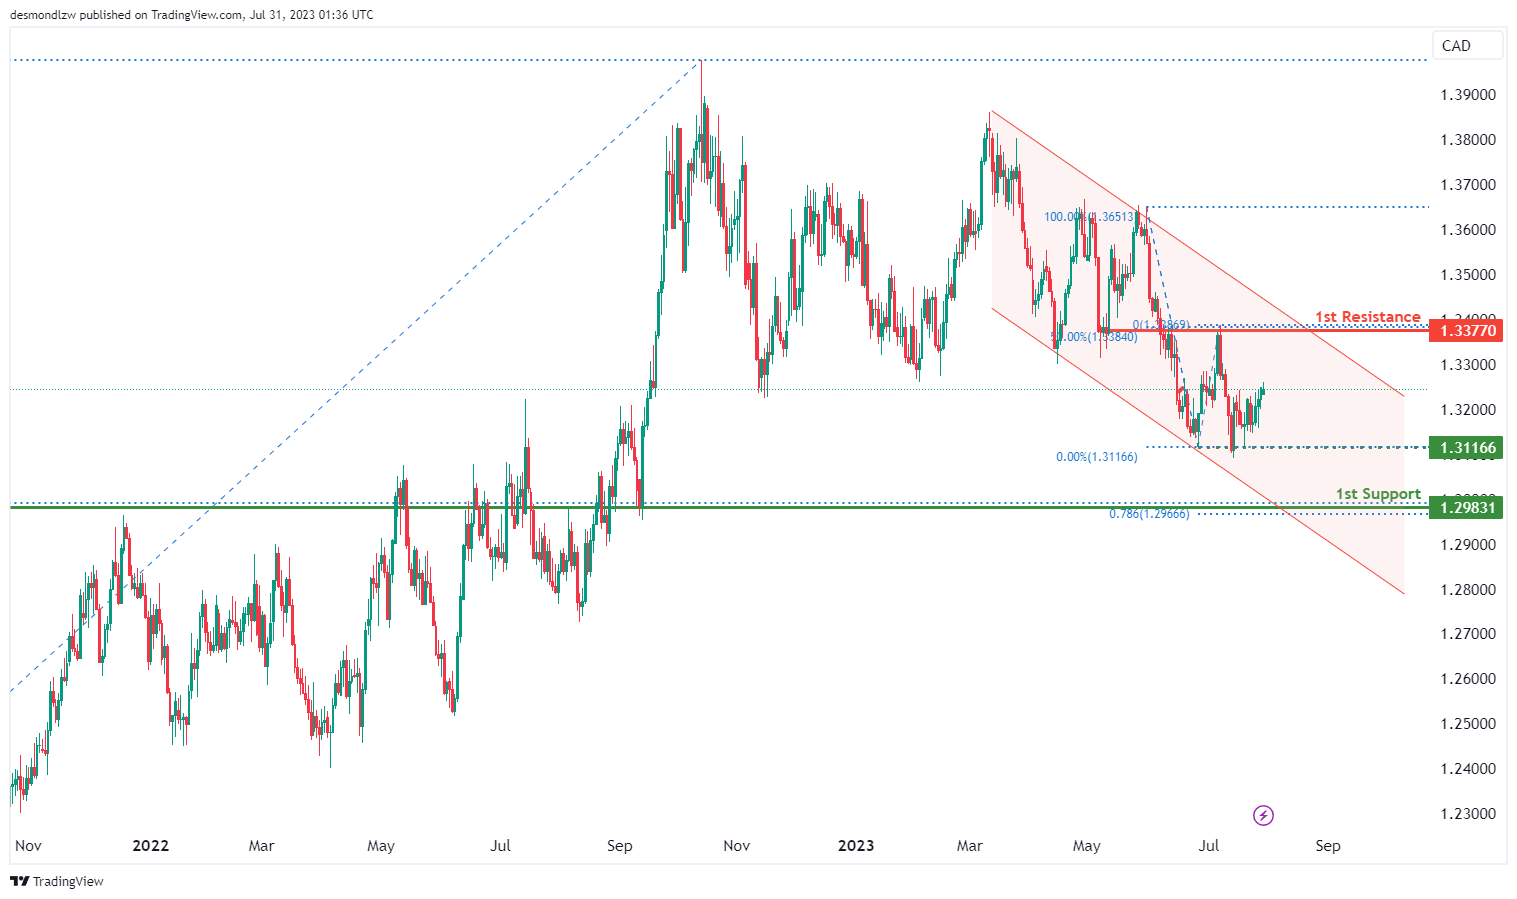
The USD/CAD chart demonstrates a bullish momentum, suggesting a potential bullish movement towards the 1st resistance level at 1.3377, which is identified as an overlap resistance coinciding with the 50.0% Fibonacci retracement level.
In case of a downward movement, there is an intermediate support at 1.3117 that acts as a pullback support should price retreat to this level. Should price break below this intermediate support level,
the 1st support at 1.2983 holds significance as it aligns with multiple factors of Fibonacci levels. These factors include an overlap support that coincides with both the 50.00% Fibonacci retracement and the 78.60% projection levels, indicating a Fibonacci confluence. This convergence of Fibonacci levels strengthens the support’s significance. It is also worth noting that price is trading within a bearish channel.
AUD/USD:
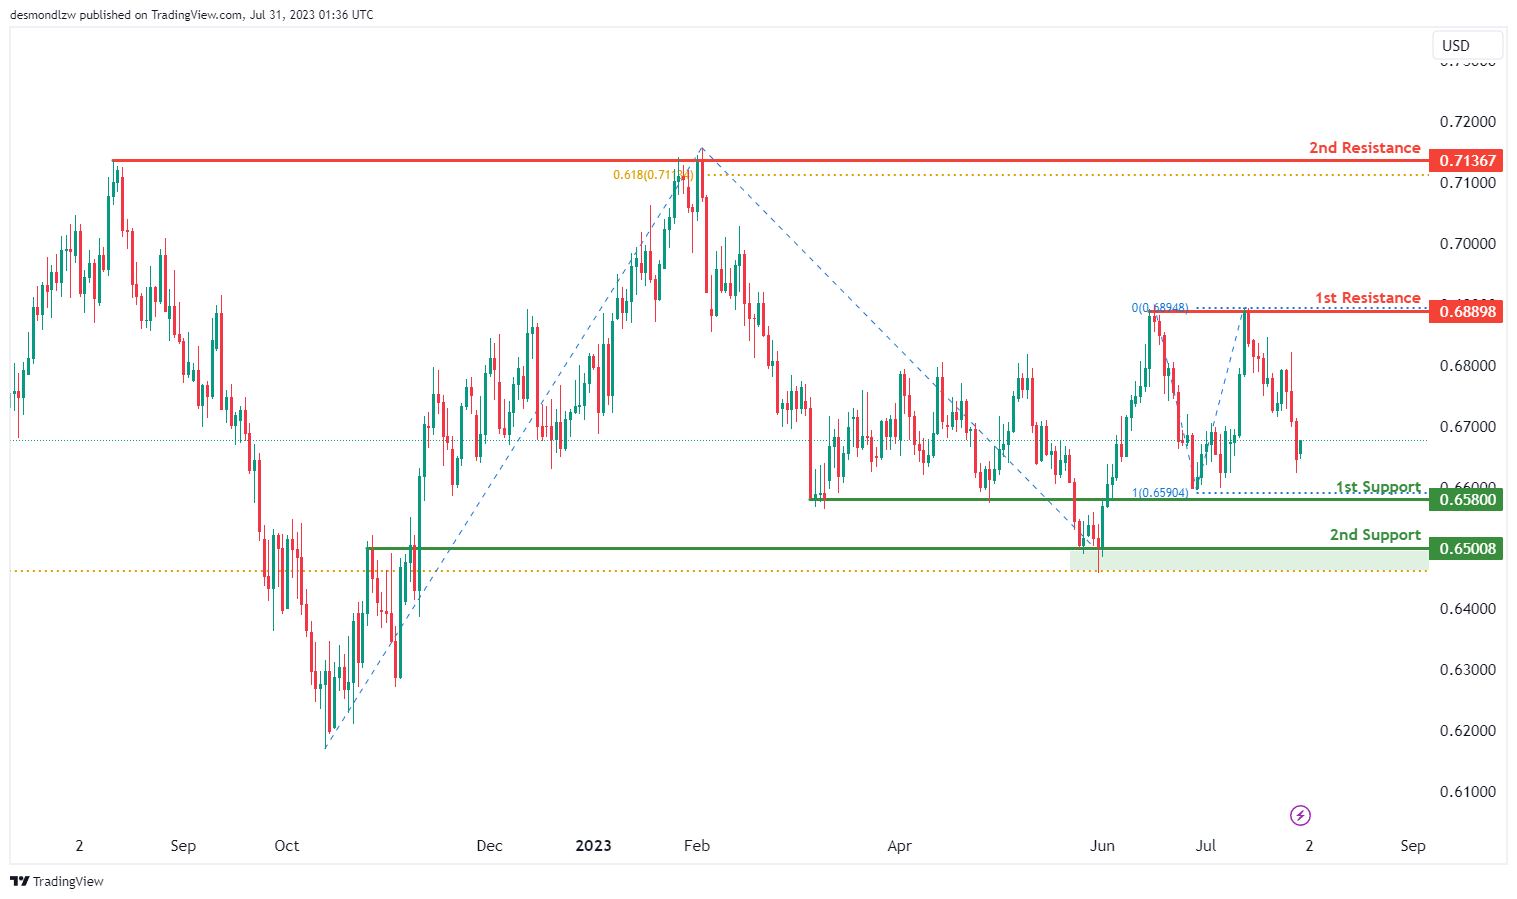
The AUD/USD chart displays a bullish momentum, indicating a potential bullish move towards the 1st resistance at 0.6889. This 1st resistance level represents an overlap resistance. Additionally, the 2nd resistance at 0.7137 serves as another important area, acting as an overlap resistance coinciding with the 61.80% Fibonacci projection level.
In case of a downward movement, the 1st support level at 0.6580 is identified as an overlap support coinciding with the 100.00% Fibonacci projection level. Should the bearish trend persist, the 2nd support at 0.6501 represents another significant level, acting as an overlap support coinciding with the 61.80% Fibonacci retracement level.
NZD/USD
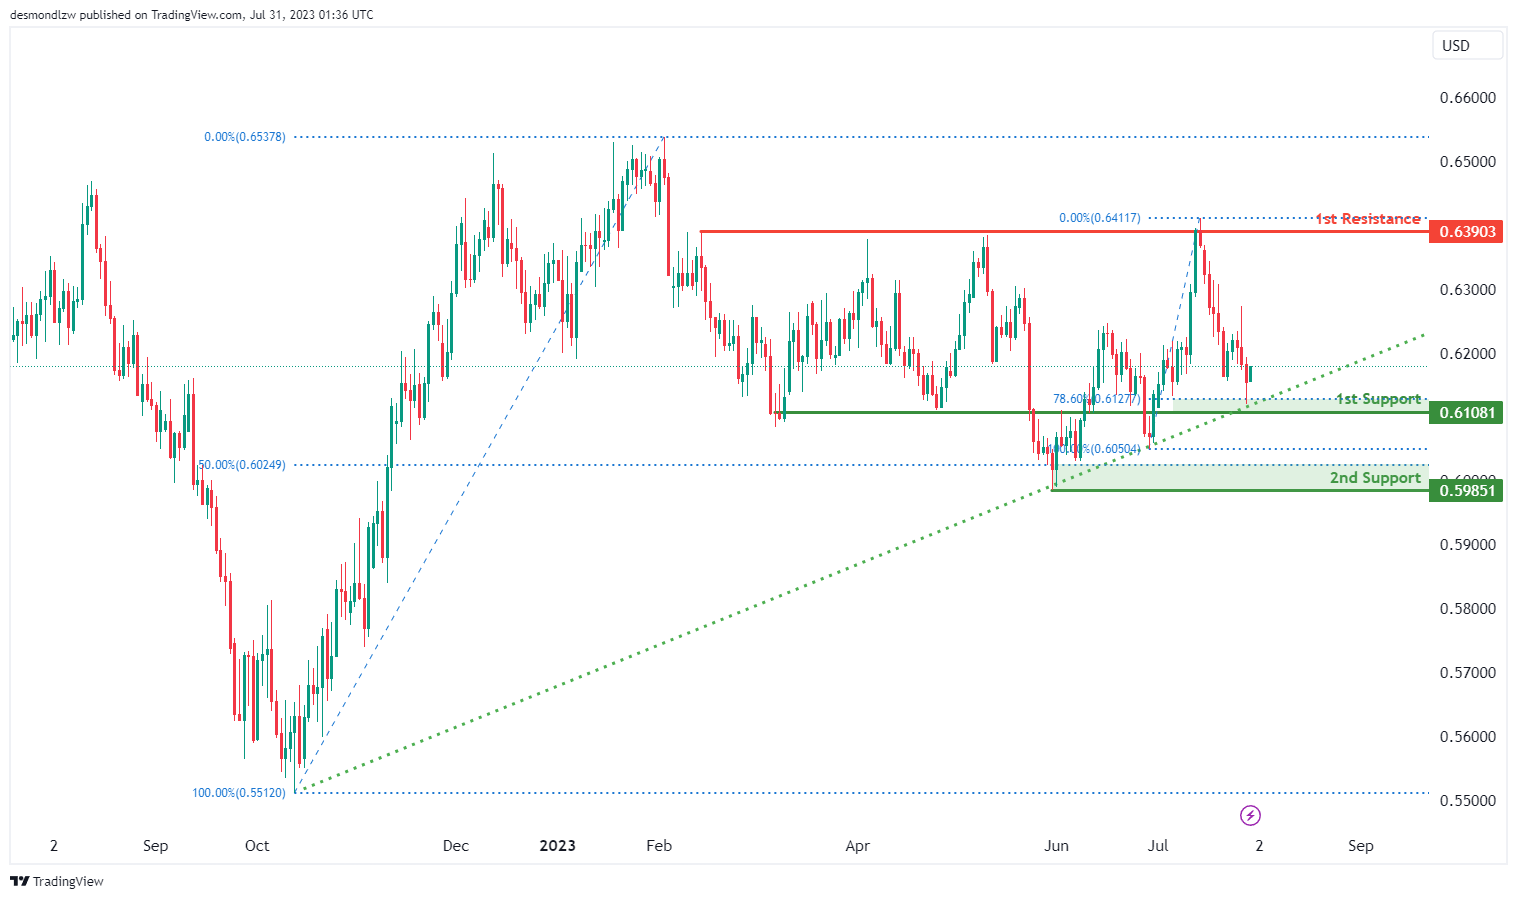
The NZD/USD chart currently demonstrates a bullish momentum, indicating a potential scenario for price to rise towards the 1st resistance level at 0.6390 which is an overlap resistance.This is attributed to the price reversing above a major ascending trend line, suggesting the possibility of further bullish movement.
The 1st support at 0.6108 is a significant area, acting as an overlap support that coincides with the 78.60% Fibonacci retracement level. Furthermore, the 2nd support at 0.5985 represents another key level, serving as a pullback support and coinciding with the 50.00% Fibonacci retracement level.
DJ30:
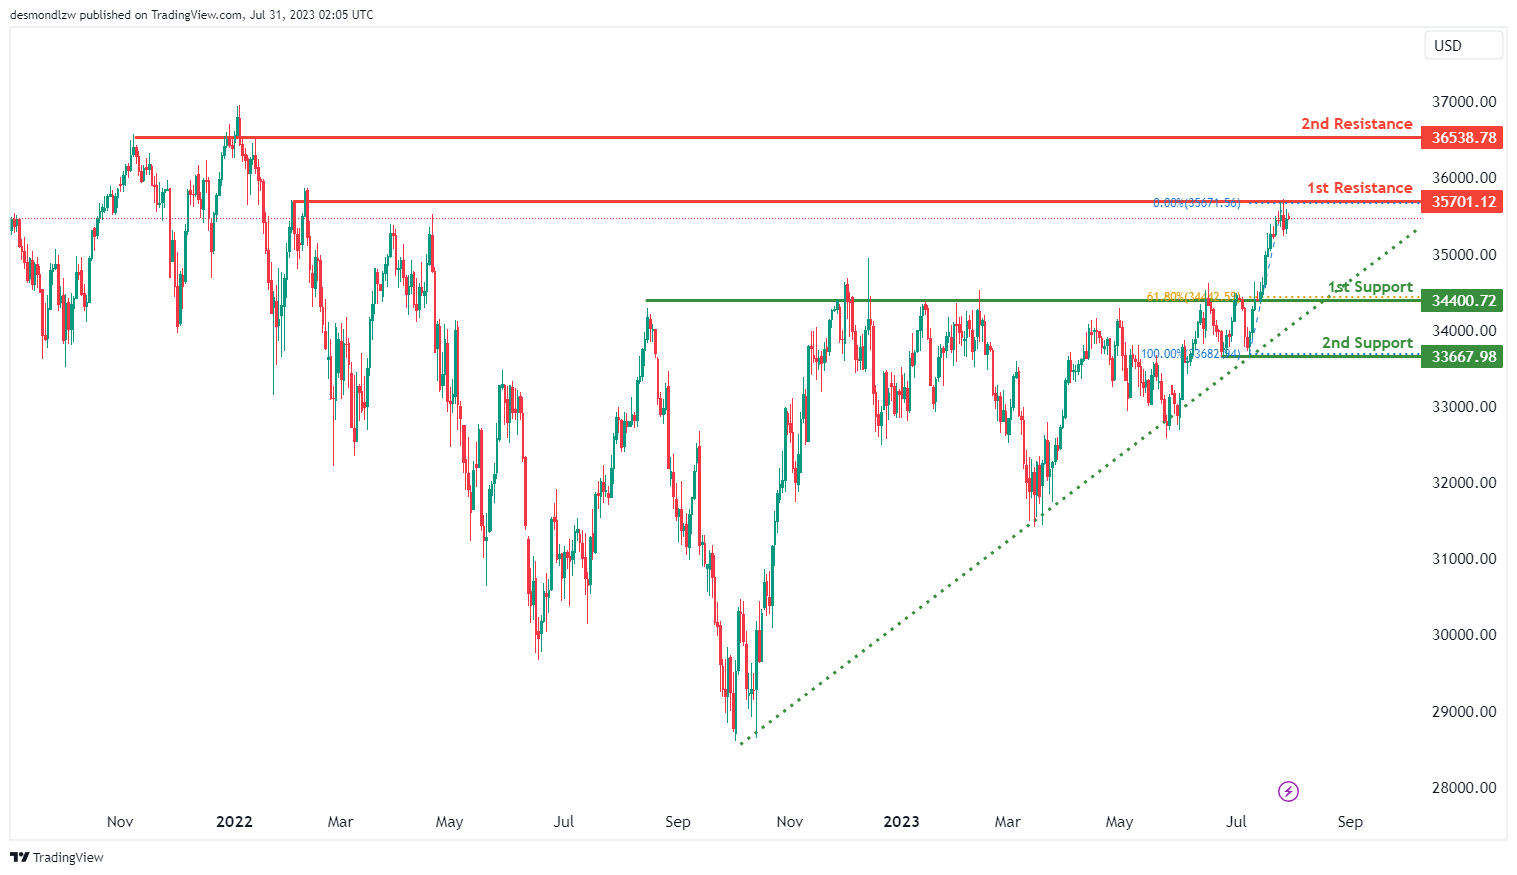
The DJ30 chart demonstrates a bullish momentum, as the price is above a major ascending trend line, suggesting the potential for further upward movement.
A possible scenario indicates a bullish continuation towards the 1st resistance at 35701.12, which is identified as an overlap resistance.
On the downside, the 1st support at 34400.72 is a significant area, acting as an overlap support and coinciding with the 61.80% Fibonacci retracement. Additionally, the 2nd support at 33667.98 serves as another key level, representing a multi-swing low support.
On the upside, the 2nd resistance at 36538.78 is recognized as an overlap resistance. These support and resistance levels play crucial roles in determining potential price movements for DJ30.
GER30:
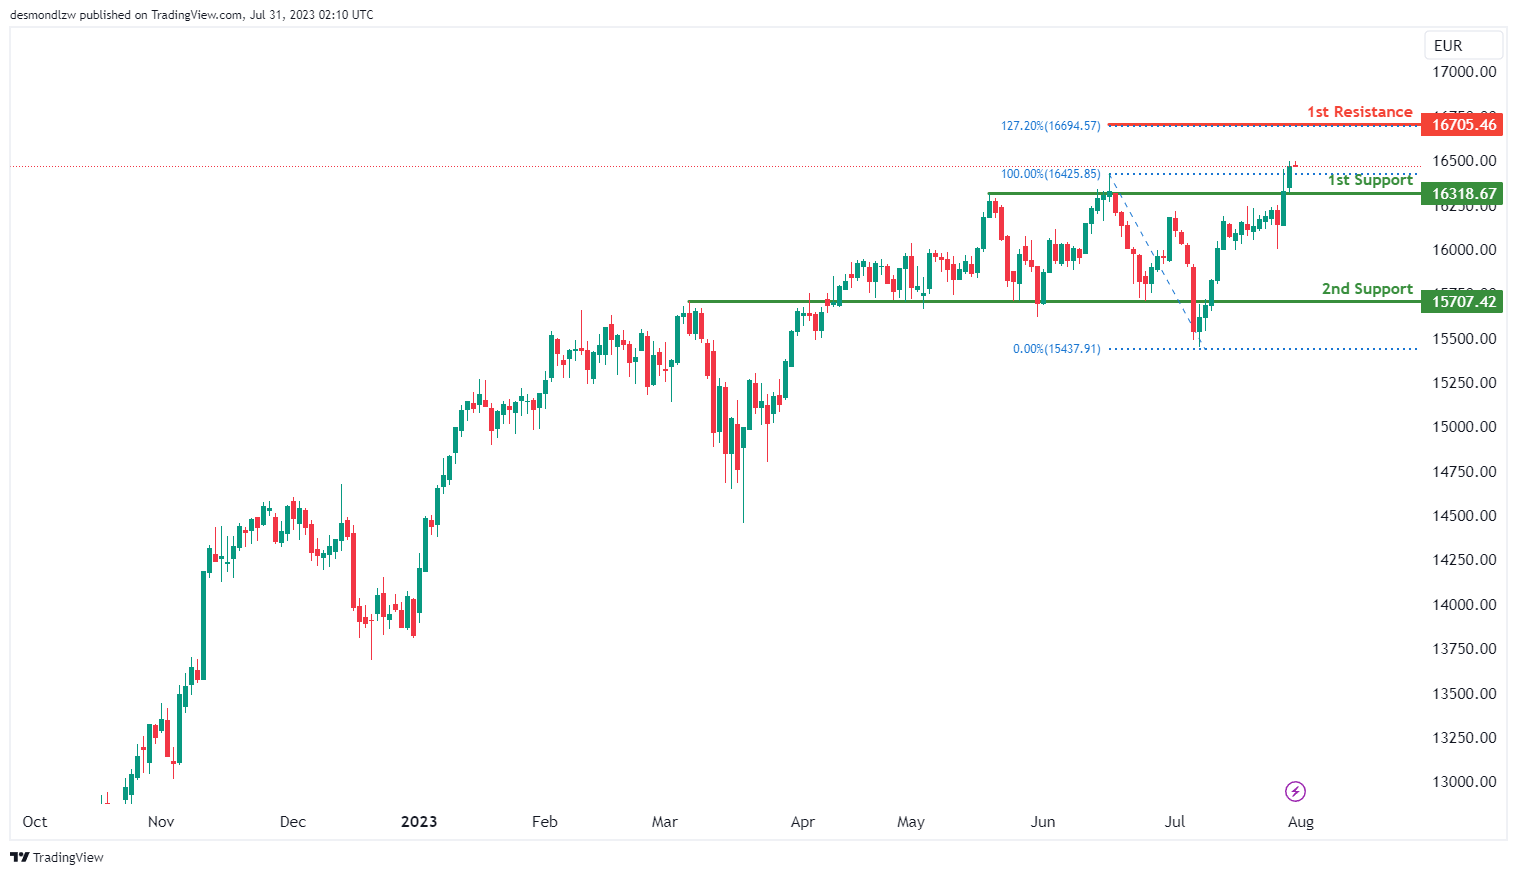
The GER30 chart indicates a bullish momentum, suggesting a potential bullish bounce off the 1st support level at 16318.67, which is an overlap support. This bounce could lead the price towards the 1st resistance at 16705.46, which is significant as it corresponds to the 127.20% Fibonacci Extension.
Additionally, the 2nd support at 15707.42 serves as another important area, acting as an overlap support. These support and resistance levels are critical in determining potential price movements for GER30.
US500
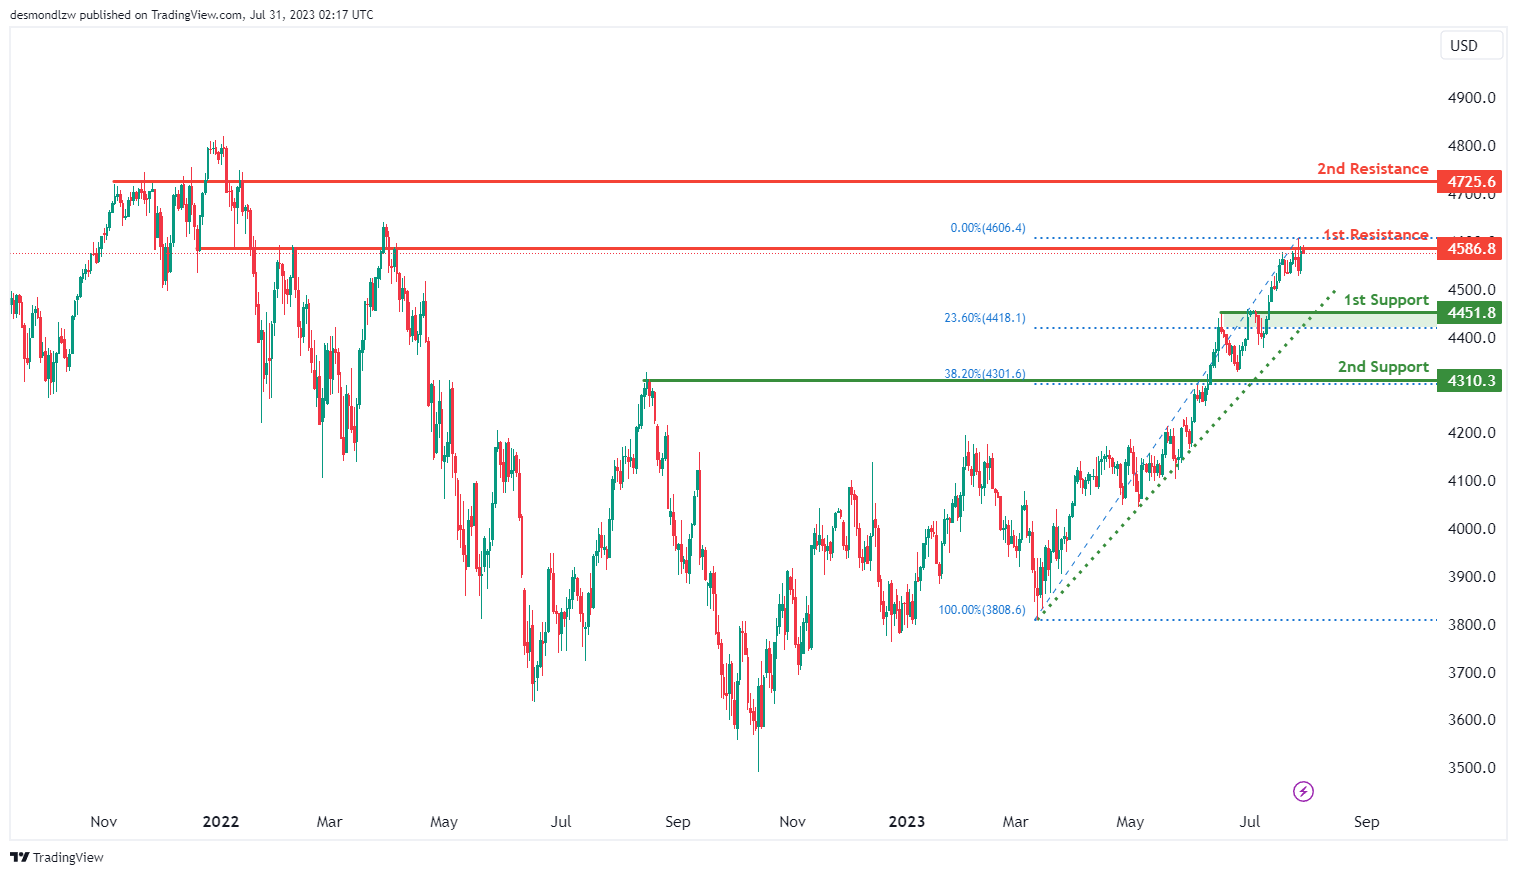
The US500 chart shows a bearish momentum, suggesting a potential bearish reaction off the 1st resistance level at 4586.8. This resistance is significant as it acts as an overlap resistance.
If the bearish reaction occurs, the price might drop towards the 1st support level at 4451.8, which is recognized as a pullback support and coincides with the 23.60% Fibonacci retracement. Further downward movement may find additional support at the 2nd support level of 4310.3, which is another pullback support aligned with the 38.20% Fibonacci retracement.
On the upside, the 2nd resistance at 4725.6 represents an important level, acting as an overlap resistance. These support and resistance levels play a crucial role in determining potential price movements for US500.
BTC/USD:
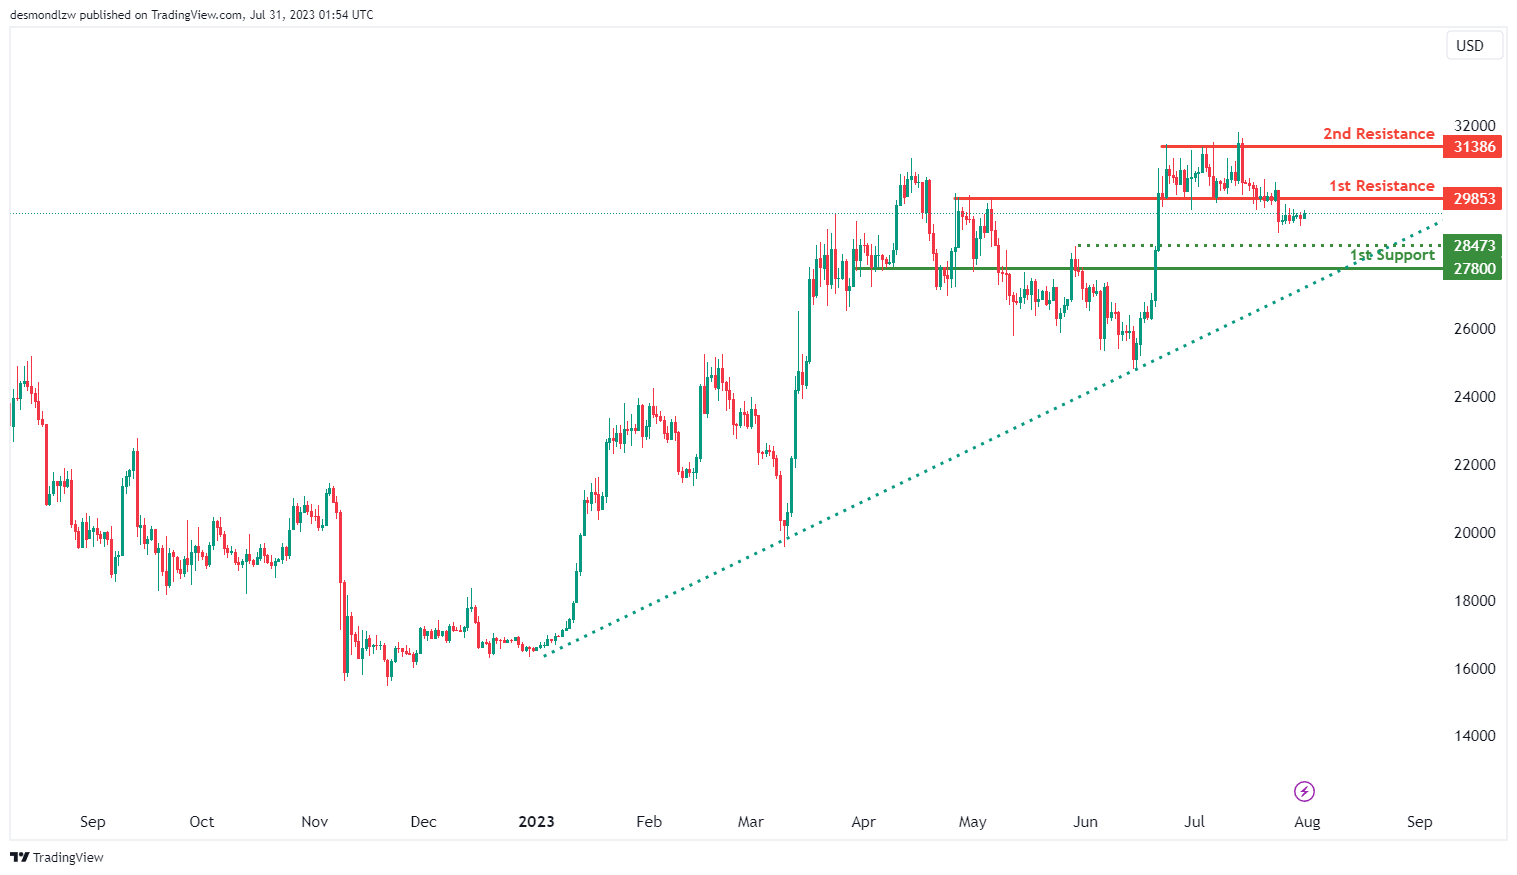
The BTC/USD chart currently exhibits a neutral overall momentum. However, it’s worth noting that the price is above a major ascending trend line, which suggests the possibility of further bullish momentum in the future.
Price could potentially fluctuate between the 1st resistance at 29853 and the 1st support at 27800. The 1st support level is considered significant as it represents an overlap support, while the 1st resistance is recognized as another overlap resistance.
On the upside, the 2nd resistance at 31386 is a critical level, acting as a multi-swing high resistance. Conversely, the intermediate support at 28473 serves as a pullback support and may provide additional stability in case of price retracements.
ETH/USD:
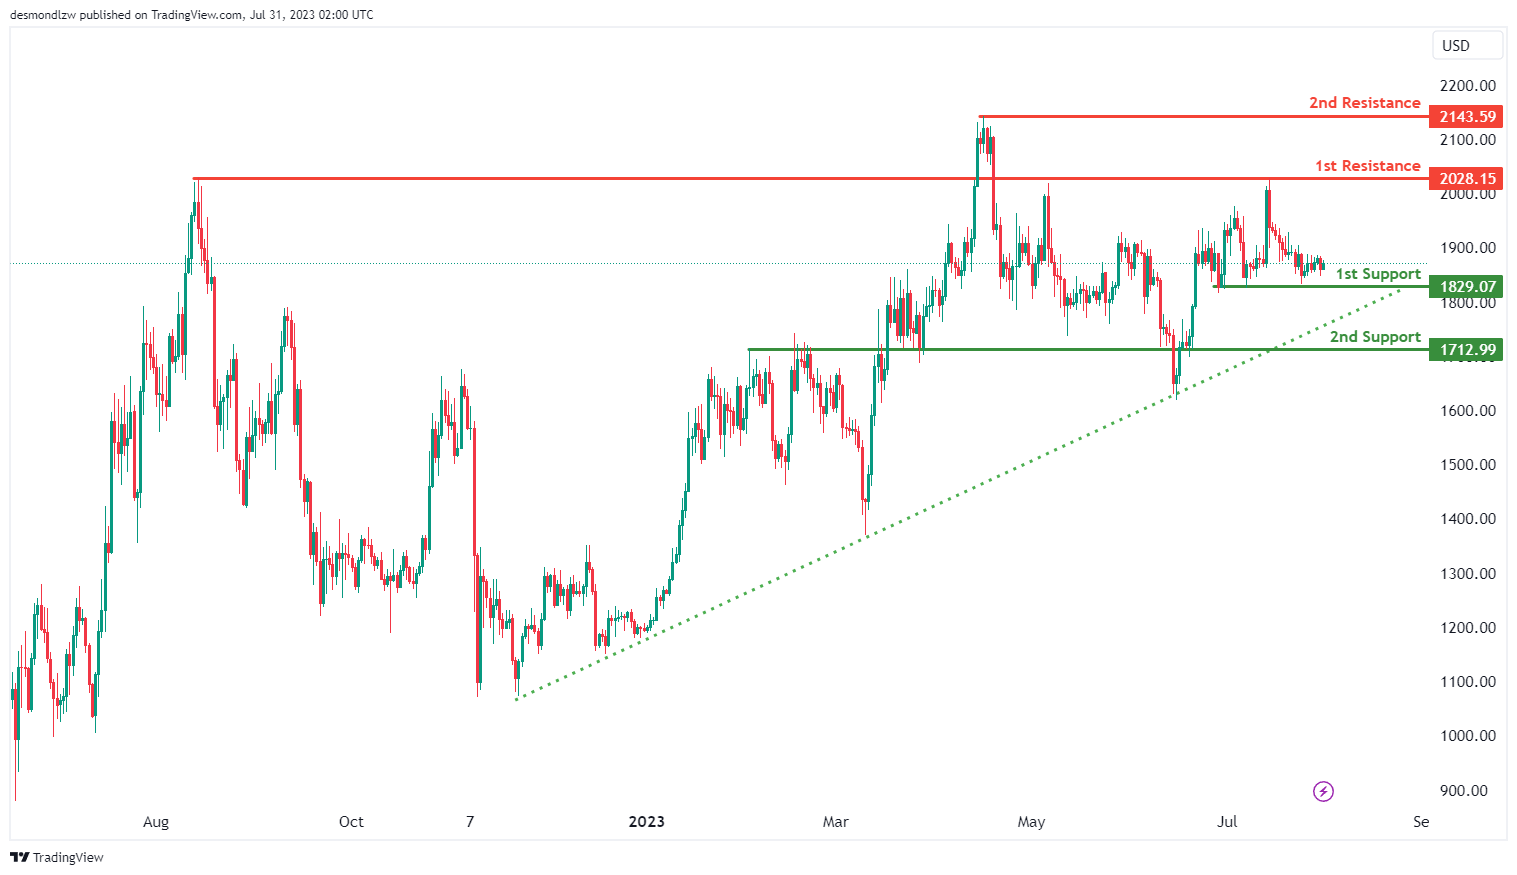
The ETH/USD chart indicates a bullish momentum, supported by the fact that the price is above a major ascending trend line, suggesting the potential for further upward movement.
A possible scenario for the price is a bullish bounce off the 1st support level at 1829.07, which is a multi-swing low support, leading it towards the 1st resistance at 2028.15. This resistance level is identified as an overlap resistance.
In case of further upward movement, the 2nd resistance at 2143.59 represents a significant swing high resistance. Conversely, on the downside, the 2nd support at 1712.99 acts as another key area, functioning as an overlap support. These support and resistance levels play crucial roles in determining potential price movements for ETH/USD.
WTI/USD:
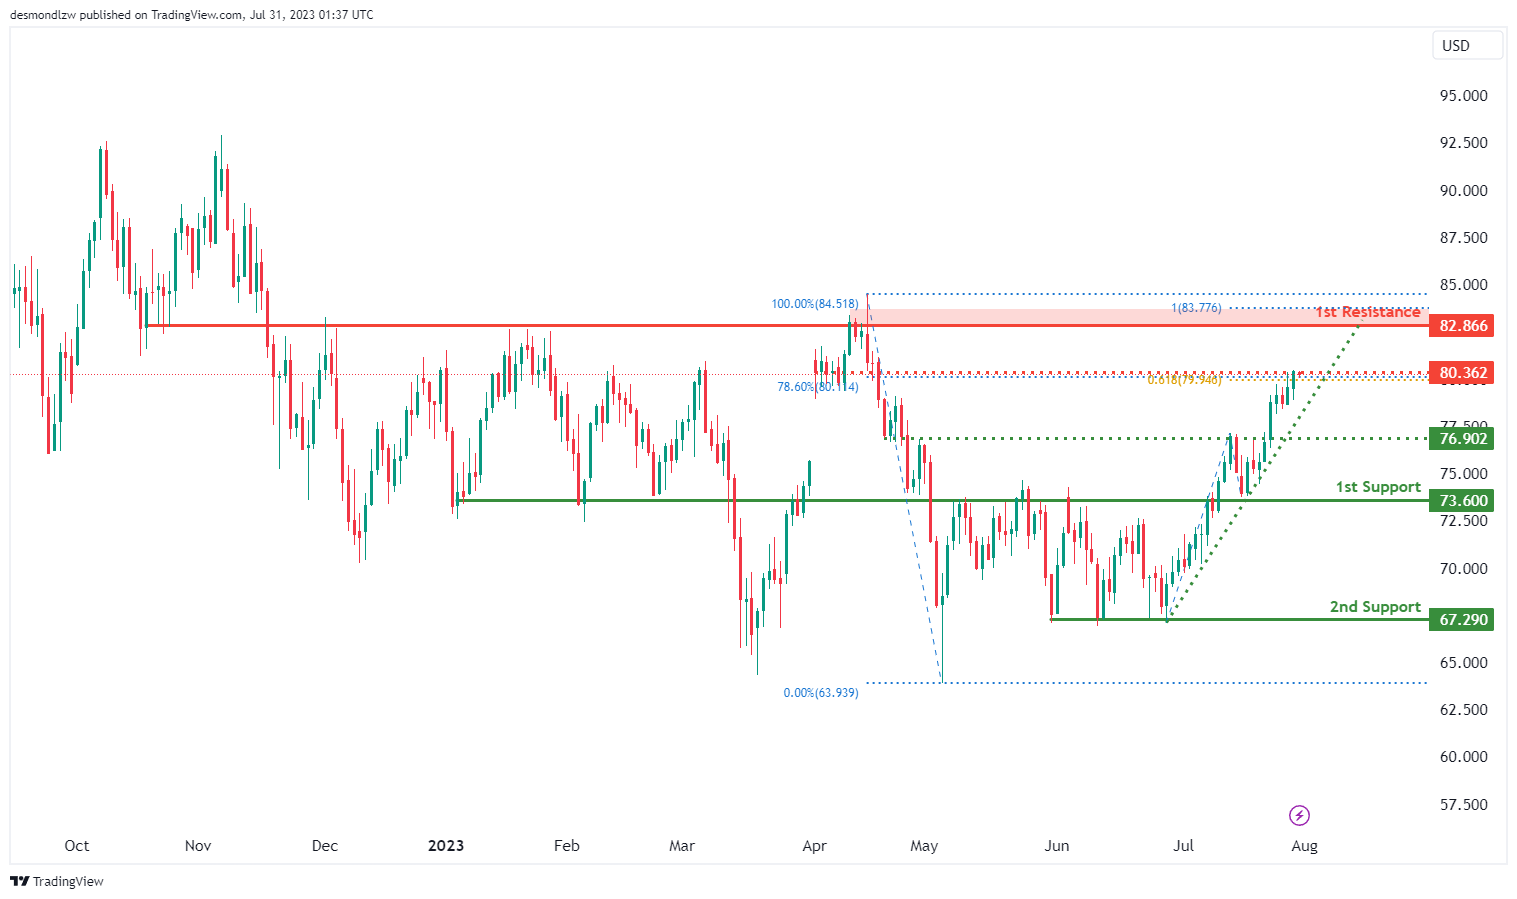
The WTI/USD chart currently shows a bullish momentum. This is attributed to the price being above a major ascending trend line, suggesting the possibility of further bullish movement. However, it’s worth noting that price is trading close to an intermediate resistance level at 80.36 which coincides with a confluence of Fibonacci levels i.e. the 78.60% retracement and 61.80% projection levels. Should the price break above this level, the 1st resistance at 82.87 is significant as it represents an overlap resistance that coincides with the 100.00% Fibonacci projection level.
On the downside, there is an intermediate support level at 76.90 which represents a pullback level.
The 1st support at 73.60 is significant as it represents an overlap support. Additionally, the 2nd support at 67.29 also serves as an overlap support level.
XAU/USD (GOLD):
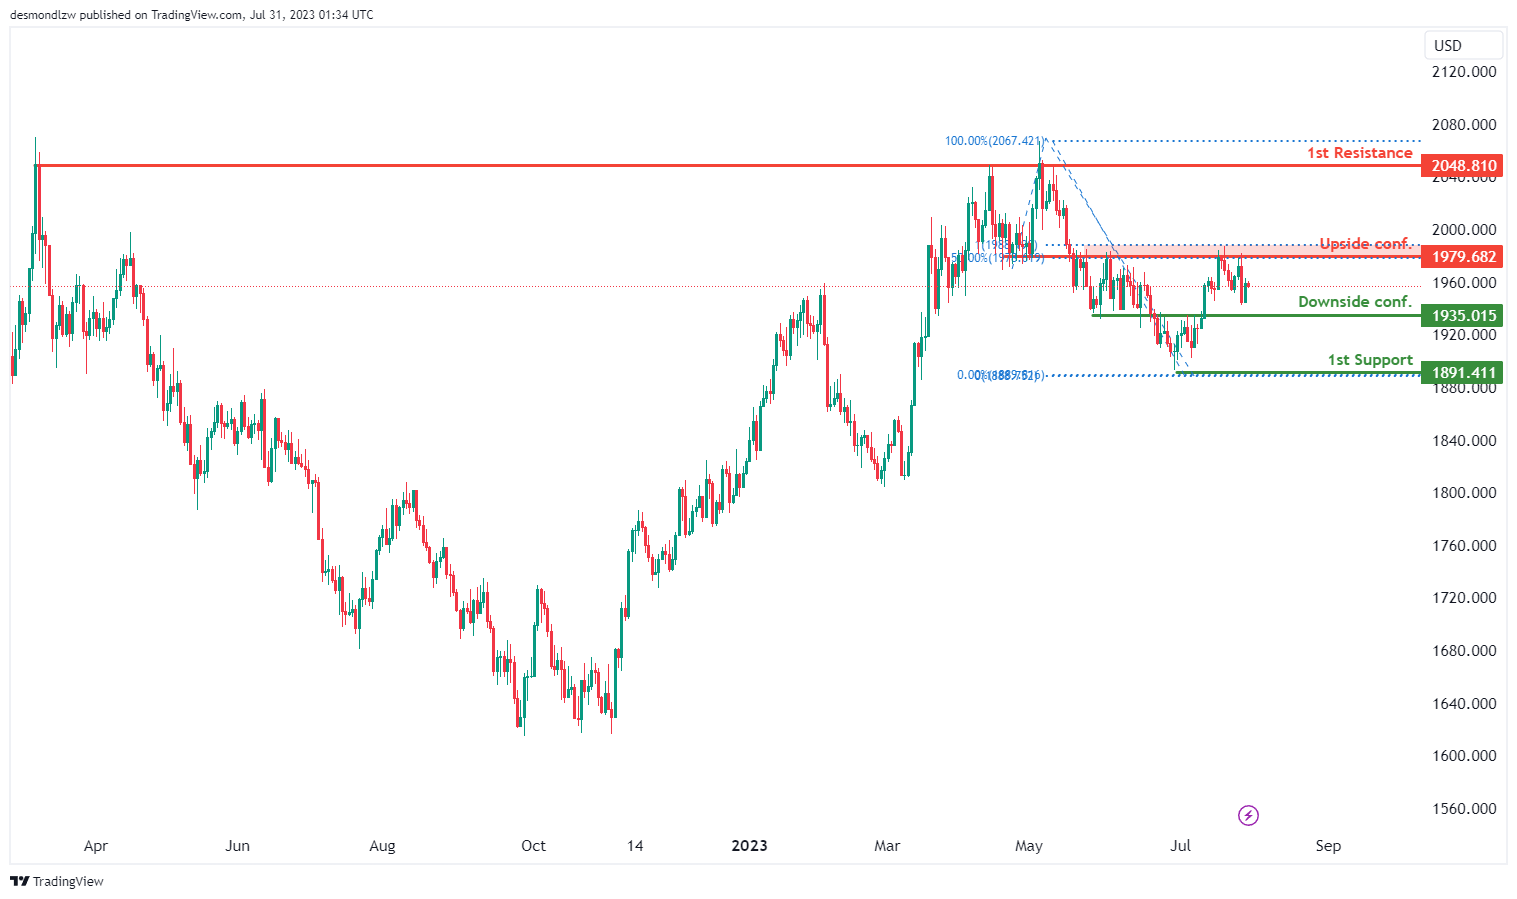
The XAUUSD pair is currently exhibiting a neutral trend. The 1st support level is positioned at 1891.41, which has served as a swing low support in the past, making it a key level to monitor for potential price rebounds.
The level at which one should look for downside confirmation is 1935.01. The specifics of why this level is significant aren’t provided, but it’s likely due to past price interactions at this level.
On the flip side, the 1st resistance level lies at 2048.81. This level has been a multi-swing high resistance and aligns with the 61.80% Fibonacci retracement level, thus could pose a challenge to bullish movements.
Finally, one should watch for upside confirmation at the level of 1979.68. This level, which aligns with the 50% Fibonacci retracement, has acted as an overlap resistance in the past. Hence, it could offer a level of resistance to upward price movements.
China’s Economy Started Third Quarter on Softer Footing
Markets
US Treasuries on Friday rallied after the important Employment Cost Index rose a little less than expected in the previous quarter. Combined with the core PCE deflator missing consensus by an inch and a downward revision to the U. of Michigan consumer sentiment, yields moved 2.9 to 6.4 bps lower with the front end of the curve outperforming. German yields gapped higher at the open in catch-up move with the US the day before. But its 2-y yield in the end lost more than 4 bps after July CPI in several euro area member states including France and Germany was a tiny – as in 0.1 ppt – fraction slower than expected. Markets also disregarded Spain’s notable exception. Markets expect monetary tightening to be at or close to an end. Combined with not too shabby growth figures, especially in France, the idea of a soft landing scenario gains further traction. Equities were well supported against this background (+1.9% Nasdaq, 0.4% EuroStoxx50). This also provided the euro with an upper hand over the dollar. EUR/USD rebounded intraday from around 1.095 to go into the weekend above 1.10. DXY’s test of 102 was quickly over. The Japanese yen fully (and more) wiped out gains on the BoJ rumours on Thursday and the actual decision on Friday. USD/JPY closed at 141.16, EUR/JPY surged back above 155.
Stocks rise in Asian-Pacific trading as well. China is no exception, even as PMI data this morning showed the (services) economy losing further momentum (see below). Hope continues to linger that authorities in the country will announce some concrete form of consumption support through the likes of cash subsidies. China did release a wideranging policy document this morning but it is mainly targeted towards improving the supply of goods rather than demand. In Japan, the BoJ’s unscheduled bond buying operation draws attention (cf. infra). Yields in the country rally further, especially at the long tenors that are outside the central bank’s scope (30-y: +10.9 bps). The yen does not profit whatsoever though. The US dollar trades with a minor strengthening bias. Core bonds slip at the start of the new week and going into an interesting economic calendar today. In the US we’ll be watching the SLOOS, the American equivalent to the ECB’s Bank Lending Survey. Powell at the Fed meeting last week already said that their tightening campaign had indeed further curbed credit demand. Q2 GDP growth and July inflation numbers are scheduled for release in the euro area. The European economy is expected to grow 0.2% after stagnating in Q1. Risks, if any, are tilted slightly to the upside given France’s and Ireland’s strong numbers. Inflation is expected to have declined by 0.1% m/m with some marginal risks to the downside, taking into account national readings last week. Core inflation is the one critical for markets and the ECB though with especially services inflation to remain sticky as German base effects (cheap transport tickets in June-August last year) kick in. This should keep the euro and core/German bond yields well supported. Important events for the remainder of the week include US ISM’s, payrolls and central bank meetings in Australia, Czechia and the UK.
News and views
China’s economy started the third quarter on a softer footing. The composite PMI eased from 52.3 to 51.1 in July. The decline was driven by a further and bigger-than-expected slowdown in the services sector (to 51.5 from 53.2). New orders fell more than last month, backlogs are being reduced at a fast pace and the sector is laying off more people as well. The manufacturing offers a glimmer of hope though, with the PMI unexpectedly recovering slightly to 49.3 amid a less sharp demand drop and improving business activity expectations. It suggests the battered sector may be close to or even recovering from a bottom. China’s yuan is under marginal selling pressure this morning with USD/CNY moving to 7.148.
The Bank of Japan held an unscheduled bond buying operation this morning. It said it would buy JPY 300bn of 5 to 10-year notes at market yields. The move follows the central bank’s announcement of a more flexible approach in its yield curve programme which caps the 10-y yield at 0.5%. Combined with the BoJ raising the rate on its fixed-rate bond buying operations, the new cap in practice is set at 1%. Yields on 10-y JGB’s surged to a nine-year high on Friday but clearly at a pace that’s judged too fast by the BoJ. The 10-y yield this morning moved beyond 0.6% for the first time since 2014 before paring, yet only temporarily, some gains on the BoJ news. The Japanese yen loses still. USD/JPY is nearing the 142 barrier.
GBP/JPY Daily Outlook
Daily Pivots: (S1) 178.01; (P) 179.75; (R1) 183.18; More...
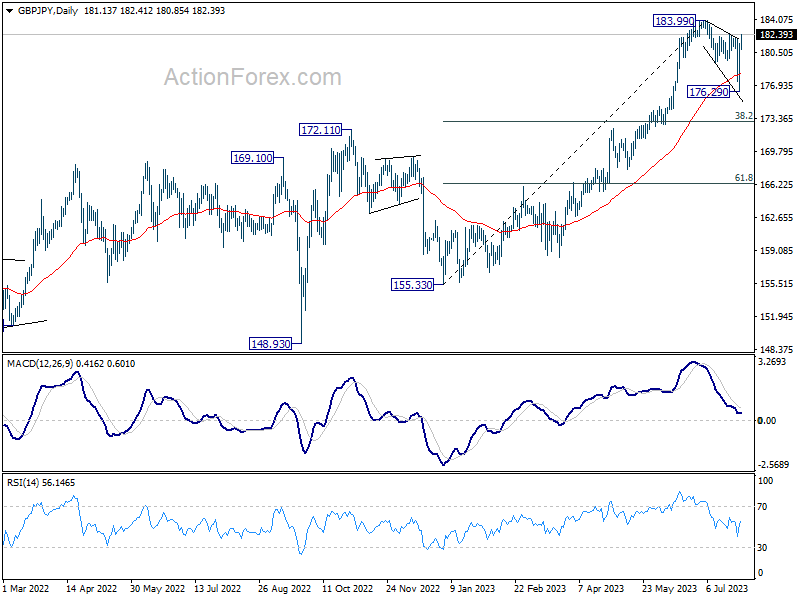
Immediate focus is now on 182.51 resistance in GBP/JPY. Firm break there should confirm that whole corrective pattern from 183.99 has completed with three waves down to 176.29. Further rally should be seen through 183.99 to resume larger up trend. Break of 180.51 minor support will argue that the corrective pattern is extending with another falling leg. But overall, outlook will stay bullish as long as 38.2% retracement of 155.33 to 183.99 at 173.04holds, in case of another dip.
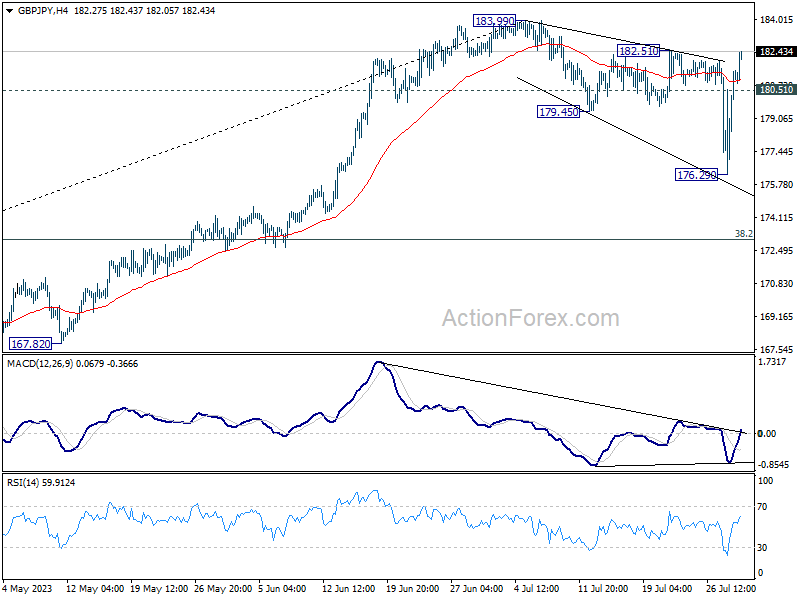
In the bigger picture, as long as 172.11 resistance turned support holds, up trend from 123.94 (2020 low) is expected to continue through 183.99 at a later stage, towards 195.86 (2015 high). Nevertheless, firm break of 172.11 will argue that larger correction is already underway.
Yen Extending Fall, Markets Eye RBA and BoE, US NFP This Week
Yen extended its late last week's slide in Asian session today, a downward trajectory that prevailed despite a notable ascent in 10-year JGB yields above the 0.6% mark. Market watchers seemed to have absorbed BoJ's recent communication effectively — that the added flexibility to its yield curve control doesn't suggest an impending tightening cycle. As a result, Yen might stay under selling pressure in the short-term, especially if the ongoing investor enthusiasm about Japan's economic prospects, mirrored in the resilient Nikkei index, holds.
Elsewhere in the currency markets, Swiss Franc and Euro trail Yen as the next weakest currencies, with Euro likely to react to today's release of Eurozone's CPI flash data. New Zealand and Australian Dollar are gaining strength, tracking a broad risk appetite in the market despite the continued sluggish economic momentum in China as indicated by PMI data. The picture for Sterling, Canadian and Dollar is more mixed at present, with these currencies awaiting potentially market-moving events including BoC rate decision and job data from both Canada and the US.
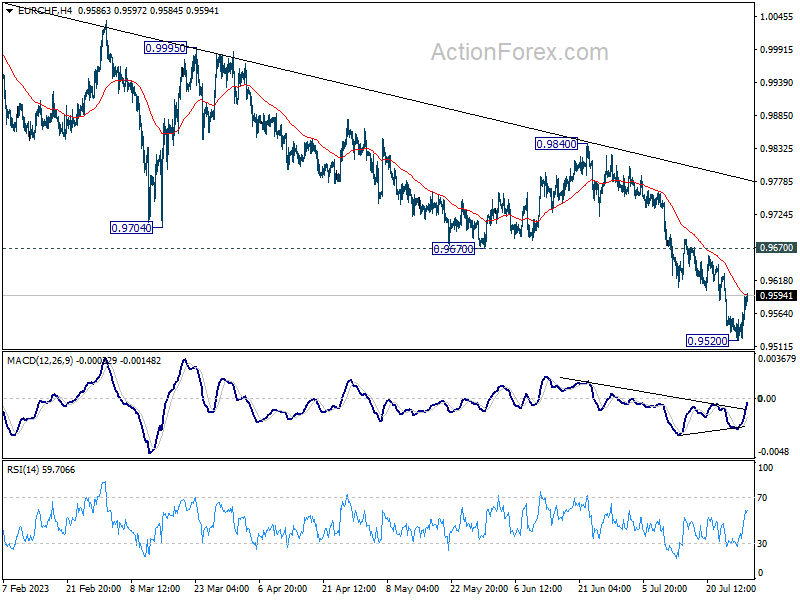
Technically, EUR/CHF is worth some attention today. While a short term bottom could be in place at 0.9520, on bullish convergence condition in 4H MACD, it's way to early to call for trend reversal. Upside surprise in today's Eurozone CPI flash could prompt further recovery in the cross towards 0.9670 support turned resistance. But as long as this level holds, larger fall from 1.0095 is expected to resume through 0.9520 at a later stage.
In Asia, at the time of writing, Nikkei closed up 126%. Hong Kong HSI is up 1.38%. China Shanghai SSE is up 0.36%. Singapore Strait Times is up 0.16%. Japan 10-year JGB yield is up 0.0594 at 0.610.
ECB Lagarde: A September pause not necessarily definitive
In an interview published in Le Figaro on Sunday, ECB President Christine Lagarde said , "At the next meeting in September, there could be a further hike of the policy rate or perhaps a pause."
But, she further clarified that "a pause, whenever it occurs, in September or later, would not necessarily be definitive." This suggests that the ECB remains flexible in its approach to policy adjustments, committed to assessing the economic landscape on a meeting-by-meeting basis.
Elucidating on ECB's mandate, Lagarde said, "We are committed to returning inflation to our target in a timely manner and for this we need a sufficiently restrictive policy in terms of level and length."
On a more positive note, Lagarde pointed out that recent Q2 GDP figures for France, Germany, and Spain were "quite encouraging." These data points, she suggested, lend support to their projection of a 0.9% GDP growth in Eurozone this year.
Fed Kashkari: If we need to hike from here, we will do so
Minneapolis Fed President Neel Kashkari has indicated Fed's willingness to raise rates if necessary but maintains that the approach will be dictated by incoming data, as he said on CBS's Face the Nation on Sunday
Kashkari called that a "good progress as core inflation moved from 5.5% a year ago to 4.1%. However, he was quick to caution against complacency, adding, "But it's still double our 2 percent rate. And so we don't want to declare victory."
His emphasis on a flexible, data-driven strategy was further evident in his comments, "If we need to hike -- raise rates further from here, we will do so. But we're going to let the data guide us and not prejudge the outcome."
On the topic of future rate decisions, Kashkari kept all options open: "September and beyond. You know, we may or may not raise in September, but we also will continue to watch all the data, the inflation data, the wage data, as well as the unemployment data to make those assessments."
Despite recent uncertainties, Kashkari expressed optimism about the economy's resilience: "The economy continues to surprise how resilient it is. The base case scenario seems to be that we'll have a slowing economy, but that we would avoid a recession."
Japan's industrial production rose 2.0% mom in Jun, moderately picking up
Japan's Ministry of Economy, Trade and Industry reported 2.0% mom increase in industrial production in June, below expected 2.4%. This places the seasonally adjusted index of production at factories and mines at 105.3, with 2020 as the base of 100.
Motor vehicles led industrial production growth, surging 6.1% thanks to robust demand in both domestic and overseas markets. Out of 15 industrial sectors covered , 10 sectors saw increased output, while production in five dropped.
Despite the production growth coming in lower than expected, the Ministry maintained its basic assessment, noting that industrial production was "showing signs of moderately picking up."
Looking ahead, the Ministry's forecast based on a poll of manufacturers anticipates slight output decline of -0.2% in July, followed by climb of 1.1% in August.
Also released, retail sales rose 5.9% yoy in June, above expectation of 5.4% yoy, picked up from prior month's 5.7% yoy.
China's PMI manufacturing ticked up to 49.3, but marked 4th month of contraction
China's official Manufacturing PMI rose from 49.0 in June to 49.3 in July, slightly above anticipated 49.2. However, it marked the fourth consecutive month that this indicator remained below the 50-point mark separating expansion from contraction on a monthly basis.
Zhao Qinghe, a senior NBS official, indicated that while there was a slight rebound, many enterprises reported experiencing a "complicated and severe" external environment. In his statement, Zhao stated, "overseas orders have decreased, and insufficient demand is still the main difficulty faced by enterprises."
Meanwhile, Non-Manufacturing PMI, which measures activity in both services and construction sectors, dropped from 53.32 to 51.5, missing the expected 53.1, marking its fourth straight monthly decline. The services subindex fell from 52.8 to 51.5, while the construction subindex saw a significant drop from 55.7 to 51.2.
Composite PMI, which provides a broader picture of the economy, also declined from 52.3 in June to 51.1 in July, reflecting the challenges faced by both the manufacturing and non-manufacturing sectors.
NZ ANZ business confidence rose to -13.1, highest since Sep 2021
New Zealand's business confidence has reached its highest point since September 2021, with ANZ Business Confidence Index improved from -18.0 to -13.1. Although this remains in the negative territory, it shows a relative boost in optimism.
Looking at the details, Own Activity Outlook, a measure of businesses' expectations of their own activity, experienced a slight drop from 2.7 to 0.8. However, various components of the index witnessed improvements. Export intentions increased from -1.8 to 1.5, indicating a renewed confidence in overseas markets. Both investment and employment intentions showed minor improvements.
Inflation indicators were mixed, with cost expectations climbing from 76.0 to 80.6, while inflation expectations saw a slight ease from 5.29% to 5.14%. At the same time, profit expectations and pricing intentions edged slightly lower.
Despite expecting a recession and rising unemployment, ANZ's view on the current economic environment is that it's "patchy rather than capitulating," suggesting that although there are definite challenges ahead, New Zealand's economy might show more resilience than expected.
RBA and BoE, US NFP and ISM, EZ CPI, China PMIs, and much more...
As anticipation builds for the imminent policy meetings of RBA and BoE, and a slew of significant economic data, the global financial markets are poised for more volatility. The only question is which event is more impactful.
Opinions are split regarding policy action of RBA, following Q2 inflation data that indicated more rapid cooling than anticipated. According to a Reuters poll, a slender majority of 55% surveyed economists expect another 25bps increase to 4.35%, while the remaining experts forecast a pause. Regardless, a strong consensus points towards an eventual peak rate of 4.35% by the end of September, suggesting that the debate centers around the timing of the next hike – this week or the next month. Market participants are equally, if not more, interested in RBA's new economic projections.
Across the globe, BoE is widely anticipated to increase rates, with the consensus veering towards a 25bps hike to 5.25%. However, given the surprise 50bps rise in June, a similar move can't be entirely discounted. The MPC could opt for a bolder stance to underscore their commitment to combating inflation. Irrespective of the decision this week, it is generally accepted that the current tightening cycle is not nearing its conclusion, with peak rates projected to hit 5.75% or potentially even higher. An added layer of intrigue will be the voting behavior of new MPC member Megan Greene, who has stepped into the shoes of known dove Silvana Tenreyro. Alongside the rate decision, BoE will also release its latest economic forecasts.
In addition to these central bank decisions, a host of critical economic data is poised to shape market trends this week. In US, spotlights will be on non-farm payroll report and ISM indexes. However, these are not the sole determinants of market sentiment. Equally significant would be Eurozone's CPI and GDP figures. Furthermore, indicators such as China's PMIs, Canadian employment statistics, Swiss CPI, and New Zealand's employment data will also command close attention from investors.
Here are some highlights for the week:
- Monday: Japan industrial production, retail sales, consumer confidence; New Zealand ANZ business confidence; China official PMIs; Germany import prices, retail sales; Swiss retail sales; UK M4 money supply, mortgage approvals; Eurozone CPI, GDP; US Chicago PMI.
- Tuesday: New Zealand building permits; Japan unemployment rate, PMI final; Australia RBA rate decision; China Caixin PMI manufacturing; Eurozone PMI manufacturing final, unemployment rate; Germany unemployment; UK PMI manufacturing final; Canada PMI manufacturing; US ISM manufacturing, construction spending.
- Wednesday: New Zealand employment; Japan monetary base, BoJ minutes; Swiss SECO consumer climate, PMI manufacturing; US ADP employment.
- Thursday: Australia trade balance; China Caixin PMI services; Germany trade balance; Swiss CPI; Eurozone PMI services final, PPI; UK PMI services final, BoE rate decision; US jobless claims, nonfarm productivity; ISM services, factory orders.
- Friday: RBA monetary policy statement; Germany factory orders; France industrial production; UK PMI construction; Eurozone retail sales; Canada employment, Ivey PMI; US non-farm payroll.
GBP/JPY Daily Outlook
Daily Pivots: (S1) 178.01; (P) 179.75; (R1) 183.18; More...
Immediate focus is now on 182.51 resistance in GBP/JPY. Firm break there should confirm that whole corrective pattern from 183.99 has completed with three waves down to 176.29. Further rally should be seen through 183.99 to resume larger up trend. Break of 180.51 minor support will argue that the corrective pattern is extending with another falling leg. But overall, outlook will stay bullish as long as 38.2% retracement of 155.33 to 183.99 at 173.04holds, in case of another dip.
In the bigger picture, as long as 172.11 resistance turned support holds, up trend from 123.94 (2020 low) is expected to continue through 183.99 at a later stage, towards 195.86 (2015 high). Nevertheless, firm break of 172.11 will argue that larger correction is already underway.
Economic Indicators Update
| GMT | Ccy | Events | Actual | Forecast | Previous | Revised |
|---|---|---|---|---|---|---|
| 23:50 | JPY | Industrial Production M/M Jun P | 2.00% | 2.40% | -2.20% | |
| 23:50 | JPY | Retail Trade Y/Y Jun | 5.90% | 5.40% | 5.70% | |
| 01:00 | CNY | NBS Manufacturing PMI Jul | 49.3 | 49.2 | 49 | |
| 01:00 | CNY | Non-Manufacturing PMI Jul | 51.5 | 53.1 | 53.2 | |
| 01:00 | NZD | ANZ Business Confidence Jul | -13.1 | -18 | ||
| 01:00 | AUD | TD Securities Inflation M/M Jul | 0.80% | 0.10% | ||
| 01:30 | AUD | Private Sector Credit M/M Jun | 0.20% | 0.40% | 0.40% | |
| 05:00 | JPY | Housing Starts Y/Y Jun | -4.80% | -0.20% | 3.50% | |
| 05:00 | JPY | Consumer Confidence Index Jul | 37.1 | 37 | 36.2 | |
| 06:00 | EUR | Germany Import Price Index M/M Jun | -0.80% | -1.40% | ||
| 06:00 | EUR | Germany Retail Sales M/M Jun | -0.20% | 0.40% | ||
| 08:00 | EUR | Italy GDP Q/Q Q2 P | 0.00% | 0.60% | ||
| 08:30 | GBP | Mortgage Approvals Jun | 49K | 51K | ||
| 08:30 | GBP | M4 Money Supply M/M Jun | 0.50% | 0.20% | ||
| 09:00 | EUR | Eurozone GDP Q/Q Q2 P | 0.20% | -0.10% | ||
| 09:00 | EUR | Eurozone CPI Y/Y Jul P | 5.30% | 5.50% | ||
| 09:00 | EUR | Eurozone CPI Core Y/Y Jul P | 5.40% | 5.50% | ||
| 13:45 | USD | Chicago PMI Jul | 43.5 | 41.5 |