

Sample Category Title
AUD/USD Technical: Hovering Below 200-day Moving Average as RBA Looms
- AUD underperformed among the major currencies against the USD from 27 to 28 July 2023 ex-post FOMC, ECB, and BoJ.
- Split view among economists and interest rates traders on RBA monetary policy decision today.
- Short-term bearish downside momentum at this juncture as the AUD/USD failed to trade above the 200-day moving average.
- Key short-term resistance on AUD/USD is at 0.6740.
The AUD/USD staged a rebound thereafter and reached an intraday high of 0.6821 on 27 July, just shy of the 0.6835 intermediate before it staged a bearish reversal and shed -198 pips ex-post FOMC, ECB, and BoJ to print an intraday low of 0.6623 on last Friday, 28 July.
The Aussie has underperformed among the major currencies against the US dollar in the last two trading days of last week where the AUD/USD recorded an accumulated loss of -1.68% from 27 July to 28 July versus EUR/USD (-0.63%), GBP/USD (-0.71%), and JPY/USD (-0.65%) over the same period.
The weak performance of the AUD/USD is likely to be attributed to the wishy-washy monetary policy guidance of the Australian central bank, RBA that led to a split forecast among economists and traders for today’s RBA monetary policy decision.
Split view among economists and traders on RBA decision
According to polls, the consensus among economists is calling for a hike of 25 basis points hike to bring the policy cash rate to 4.35% after a pause in the previous meeting in July. In contrast, data from the ASX 30-day interbank cash rate futures as of 31 July 2023 has indicated a patty pricing of only a 14% chance of a 25-bps hike, down significantly from a 41% chance priced a week ago.
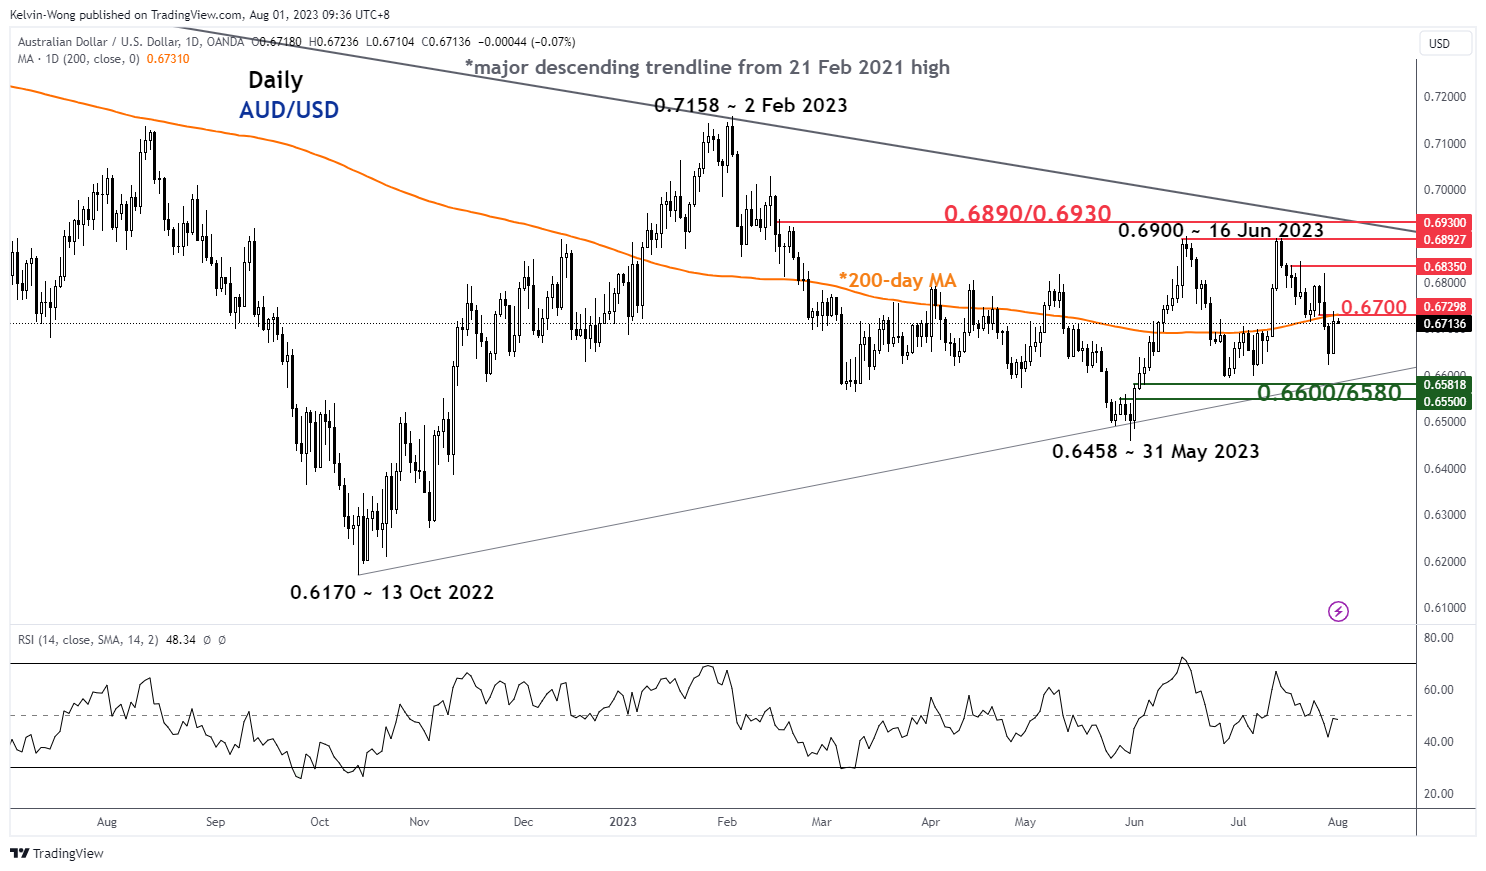
Fig 1: AUD/USD medium-term trend as of 1 Aug 2023 (Source: TradingView, click to enlarge chart)
From a technical analysis standpoint, the price actions of the AUD/USD are still trapped within a major sideway range configuration with its range resistance and support at 0.6930 and 0.6580 respectively.
Short-term momentum has turned bearish
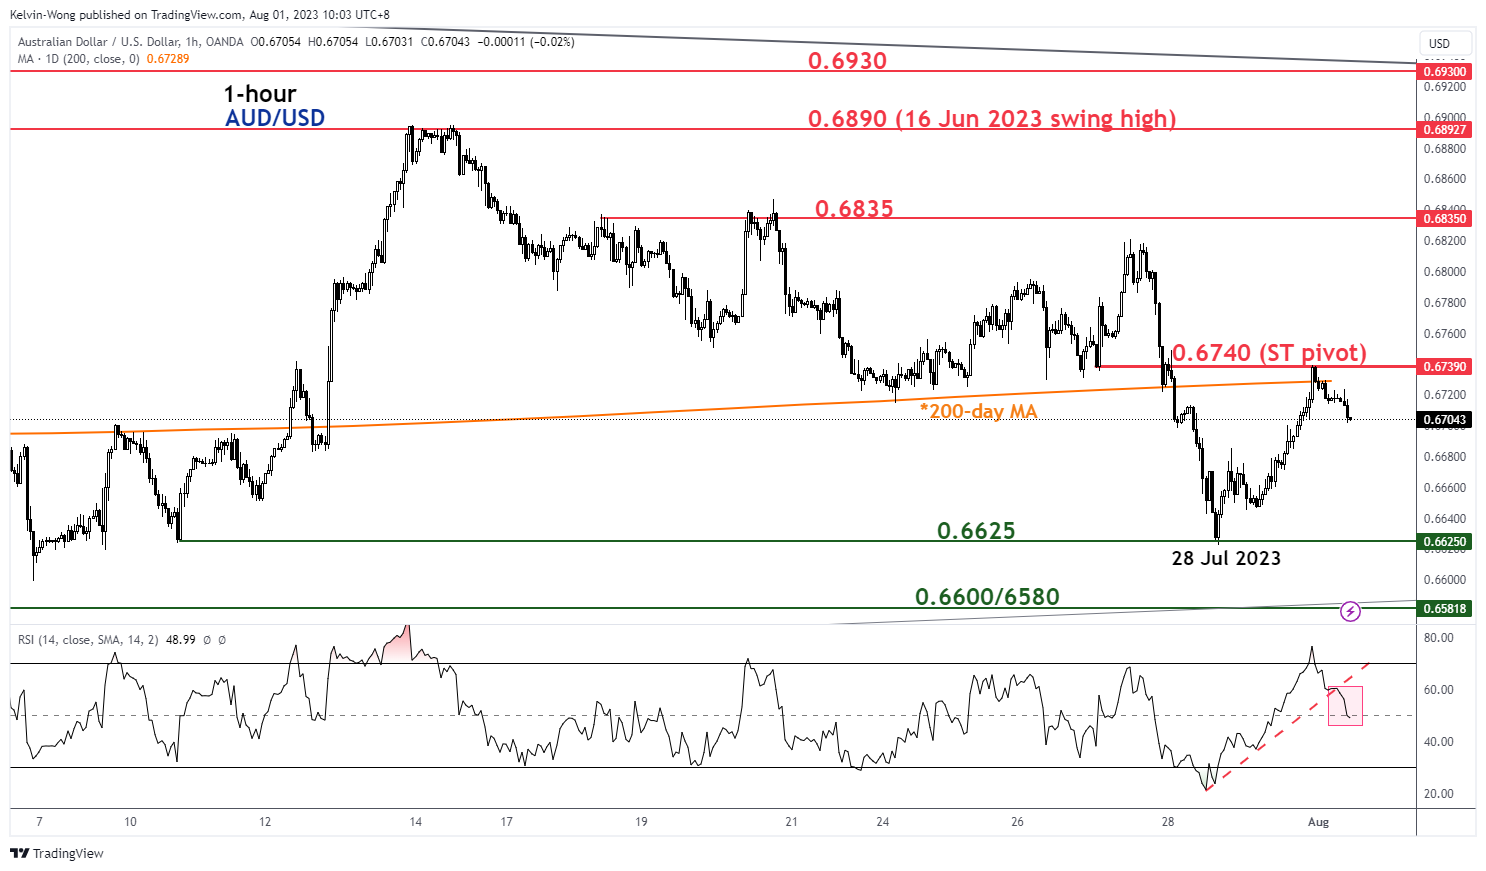
Fig 2: AUD/USD minor short-term trend as of 1 Aug 2023 (Source: TradingView, click to enlarge chart)
The AUD/USD has managed to stage a minor rebound of 117 pips from its last Friday, 28 July intraday low of 0.6622 in conjunction with an oversold reading seen in the hourly RSI oscillator on the same day.
Interestingly, the minor rebound has challenged and retreated at the key 200-day moving average yesterday, 31 July during the US session (printed an intraday high of 0.6739). Right now, the hourly RSI oscillator has broken below its ascending support after it hit an overbought condition yesterday which indicates that short-term momentum has turned bearish.
Watch the 0.6740 key short-term pivotal resistance to maintain the bearish tone, and a break below 0.6625 intermediate support exposes the major range support of 0.6600/6580.
However, a clearance above 0.6740 negates the bearish tone to see the next resistance at 0.6835 in the first step.
GBP/USD at Clear Risk of Further Declines
Key Highlights
- GBP/USD declined below the 1.3000 and 1.2900 levels.
- A connecting bearish trend line is forming with resistance near 1.3020 on the 4-hour chart.
- EUR/USD might struggle to clear the 1.1075 resistance zone.
- The US ISM Manufacturing Index could rise from 46.0 to 46.5 in July 2023.
GBP/USD Technical Analysis
The British started a fresh decline from the 1.3140 zone against the US Dollar. GBP/USD declined below the 1.3000 and 1.2900 support levels.
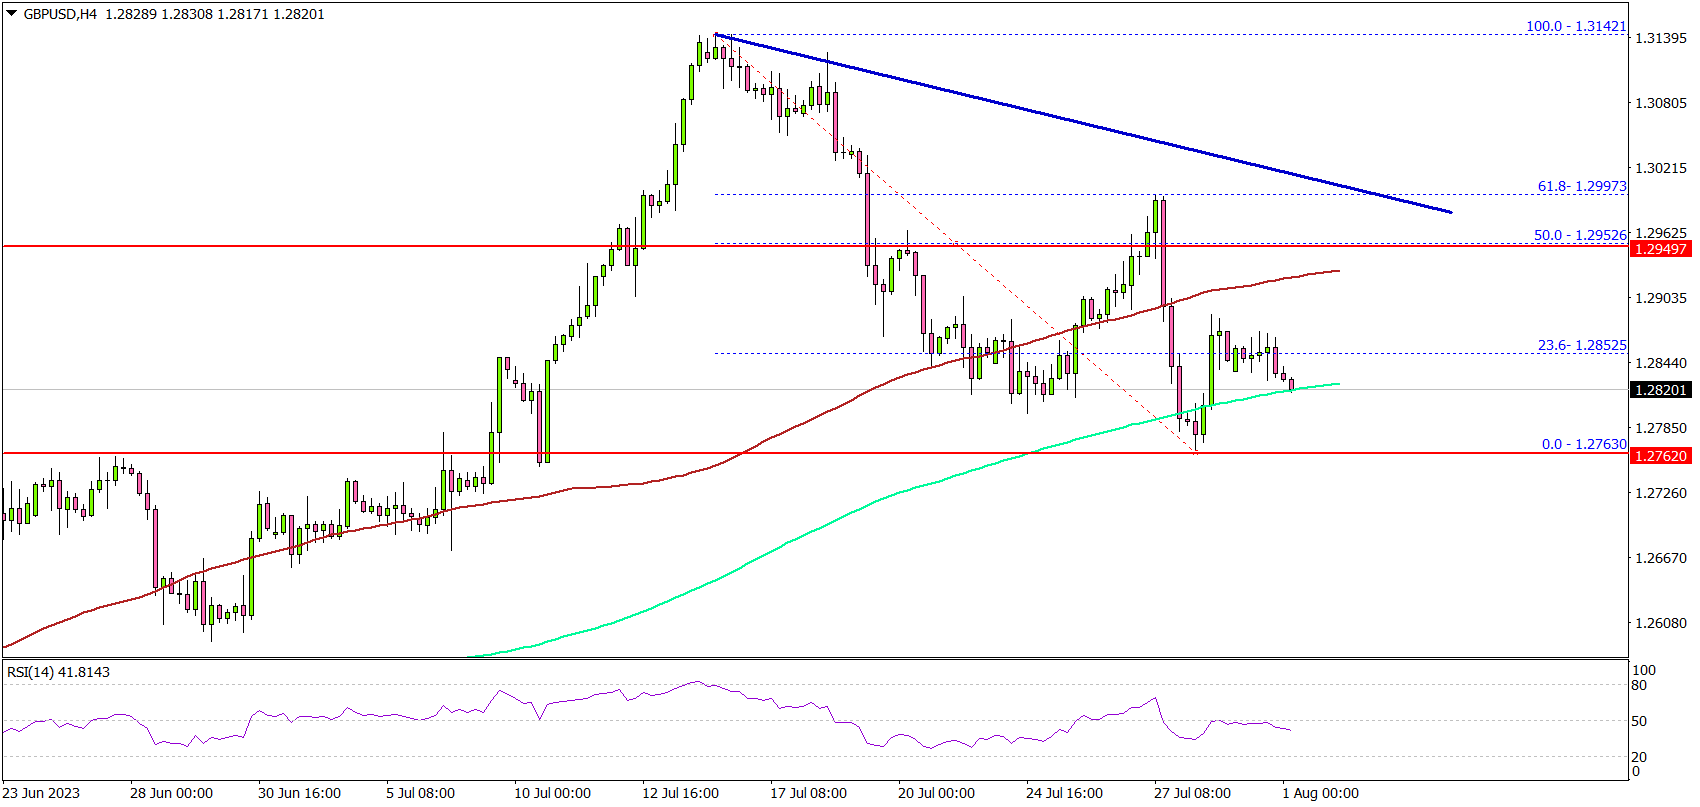
Looking at the 4-hour chart, the pair even traded below the 1.2880 support and the 100 simple moving average (red, 4 hours). Finally, the pair found bids near the 1.2780 zone and the 200 simple moving average (green, 4 hours).
A low is formed near 1.2763 and the pair is now attempting a recovery wave. There was a minor increase above the 1.2840 level.
On the upside, the pair is facing resistance near the 1.2920 level and the 100 simple moving average (red, 4 hours). The first major resistance is near 1.2950. The main resistance could be near the 1.3000 zone.
There is also a connecting bearish trend line forming with resistance near 1.3020 on the same chart. A close above the trend line could set the pace for a fresh increase toward 1.3140.
If not, the pair could start a fresh decline. On the downside, the pair might find bids near the 1.2800 level. The next major support is near 1.2765, below which GBP/USD could slide toward the 1.2660 zone.
Looking at EUR/USD, the pair also attempted a recovery wave but it won’t be easy to settle above the 1.075 resistance zone.
Economic Releases
- Germany’s Manufacturing PMI for July 2023 - Forecast 38.8, versus 38.8 previous.
- Euro Zone Manufacturing PMI for July 2023 – Forecast 42.7, versus 42.7 previous.
- UK Manufacturing PMI for July 2023 – Forecast 45.0, versus 45.0 previous.
- US Manufacturing PMI for July 2023 – Forecast 49.0, versus 49.0 previous.
- US ISM Manufacturing Index for July 2023 – Forecast 46.5, versus 46.0 previous.
GBPNZD Wave Analysis
- GBPNZD reversed from pivotal resistance level 2.090
- Likely to fall to support level 2.050
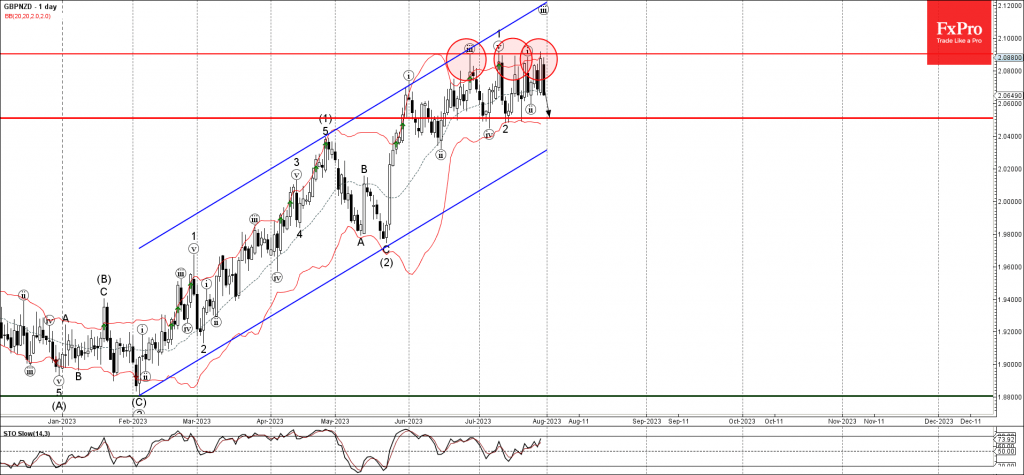
GBPNZD currency pair recently reversed down from the pivotal resistance level 2.090 (which has been steadily reversing the price from the end of June).
The resistance level 2.090 is likely to form today the Bearish Engulfing, strong sell signal for this currency pair – highlighting the strength of this price level.
Given the strength of the resistance level 2.090, GBPNZD currency pair can be expected to fall further toward the next support level 2.050 (which has been reversing the pair from June).
GBPJPY Wave Analysis
- GBPJPY reversed from key support level 179.45
- Likely to rise to resistance level 184.00
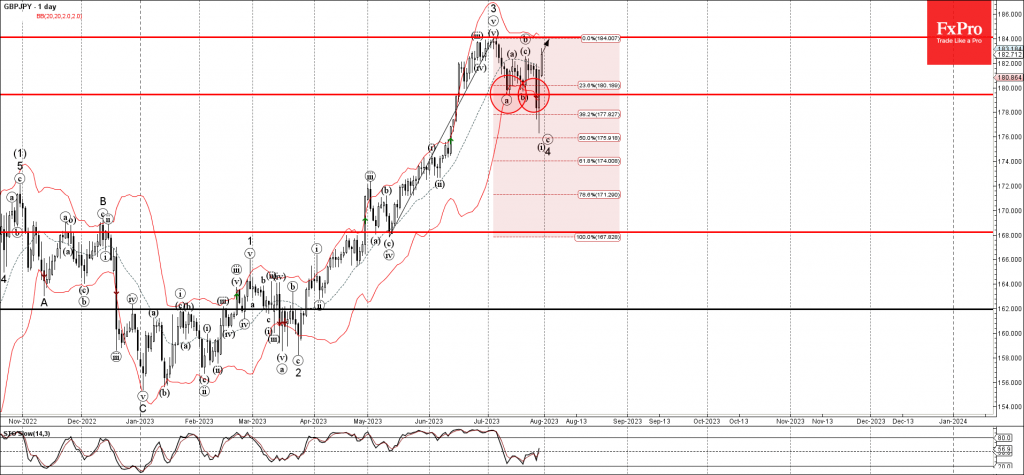
GBPJPY currency pair recently reversed up from the key support level 179.45 (which stopped the previous waves a and b).
The support level 179.45 was strengthened by the lower daily Bollinger Band and by the 38.2% Fibonacci correction of the upward impulse from May.
Given the clear daily uptrend, GBPJPY currency pair can be expected to rise further toward the next resistance level 184.00 (which stopped the previous impulse wave 3).
Eurozone Inflation is a Persistent Challenge
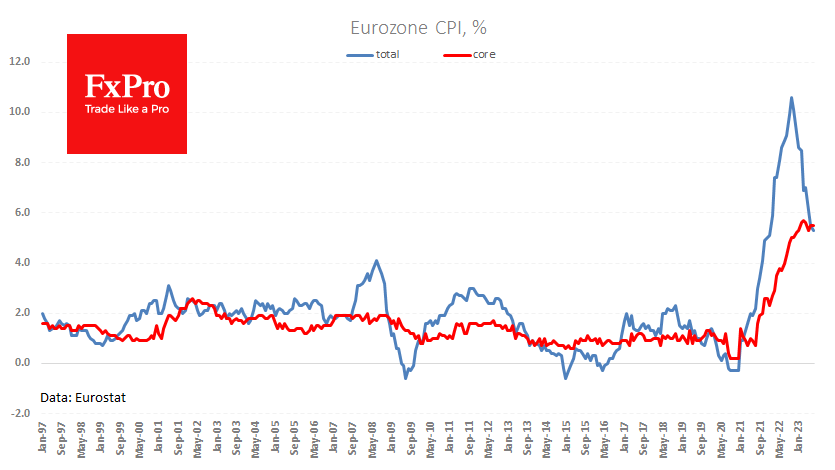
According to Eurostat’s preliminary estimate, eurozone inflation slowed to 5.3% year-on-year in July. This is the lowest rate since January 2022 and aligns with analysts’ expectations.
The core index stood at 5.5%, above the headline rate for the first time since February 2021. The momentum of this core index is coming to the forefront, and so far, there is little good news here, as the data are beating forecasts and not showing as strong a turnaround as we see in producer prices and headline inflation figures. As in the US, the likely reason is growth in the services sector after the coronavirus. The only thing that can change this situation is further tightening by the central bank, which is likely to dampen demand. The latest GDP estimates for the second quarter show that there is still room to work in this direction.
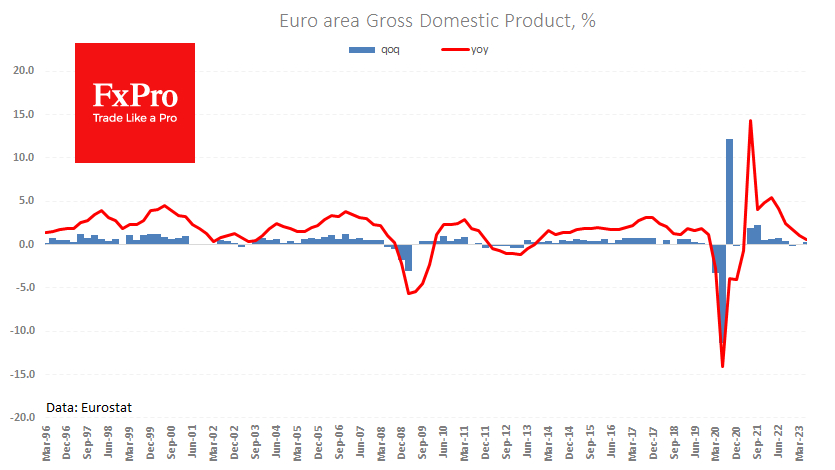
The eurozone economy grew by 0.3% QoQ after two quarters of virtually flat growth. This was despite aggressive interest rate hikes in previous quarters to dampen final demand for credit.
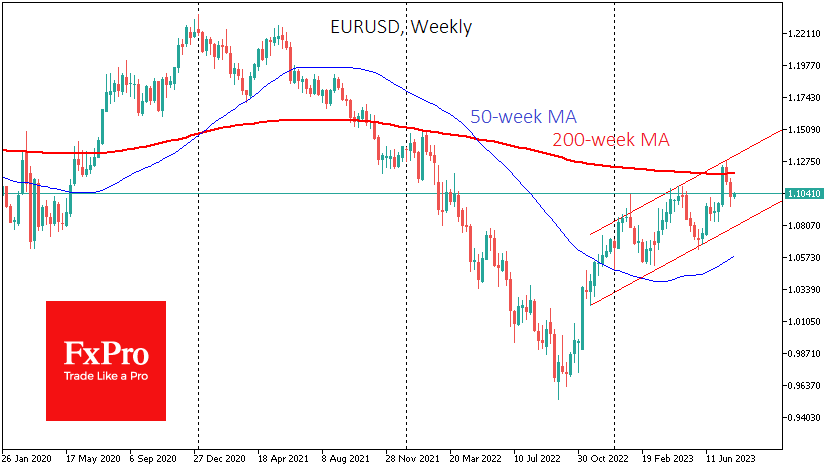
Better-than-expected price and GDP dynamics favour the euro, which rose for a second consecutive day on Monday after Thursday’s sell-off following the ECB press conference. We note that inflationary trends in Europe are more resilient than in the US, reviving speculation that the former will either have to raise rates more or hold them for longer. If this turns out to be the case, the uptrend in EURUSD that has been in place since September 2022 will gain traction in the coming quarters.
Where Crude Oil Prices Could Pop
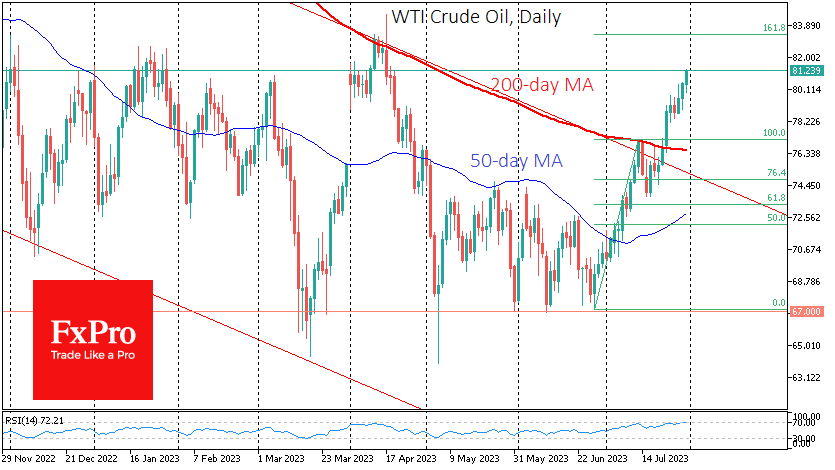
Oil has accelerated its gains over the past week, adding more than 20% to the lows of 28 June, when the latest rally began. Technical factors coming into play and excitement in the markets from robust macro data are adding fuel to the fire.
WTI broke above $81 on Monday and is making new multi-month highs after six weeks of strength. Last Monday, the price bounced sharply off its 200-day moving average, confirming the break of a downtrend that has been in place for more than a year.
The medium-term technical picture now points to a rise to the $83.50 area, centring on the May highs and the 161.8% Fibonacci retracement from the rally’s start to the first touch of the 200-day MA. However, oil’s rally may not stop there and could take it to levels above $90, the double top of October and November last year.
Fundamental factors also support higher prices than we are seeing now. Market investors are cheering lower inflation figures, suggesting that central banks will move more quickly to ease policy, supporting global demand for commodities.
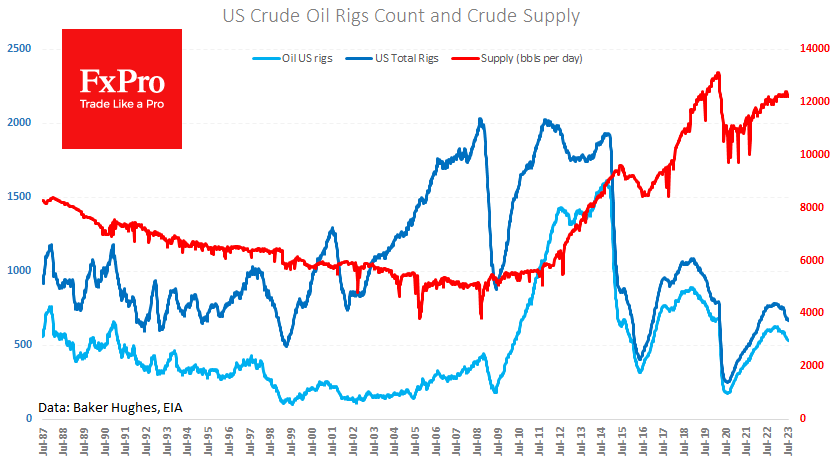
Interestingly, the multi-week price rally has not changed US oil producers’ mood. Oil inventories remained at 12.2M BPD last week – just below the average level since the start of the year, signalling a relatively cautious near-term sentiment. The number of active drillers fell to 528 (-2) for the week, the lowest since March last year.
That’s a sign of long-term pessimism, which is surprising, given the news that oil consumption has surpassed all-time highs and the supply/demand balance moved into deficit in July. On top of that, the US continues adding jobs, and China is ramping up its stimulus to accelerate economic growth.
Yen Slides to 3-Week Low vs Dollar as BoJ Buys JGBs
- BoJ announces JGB purchases
- Japanese yen’s slide continues
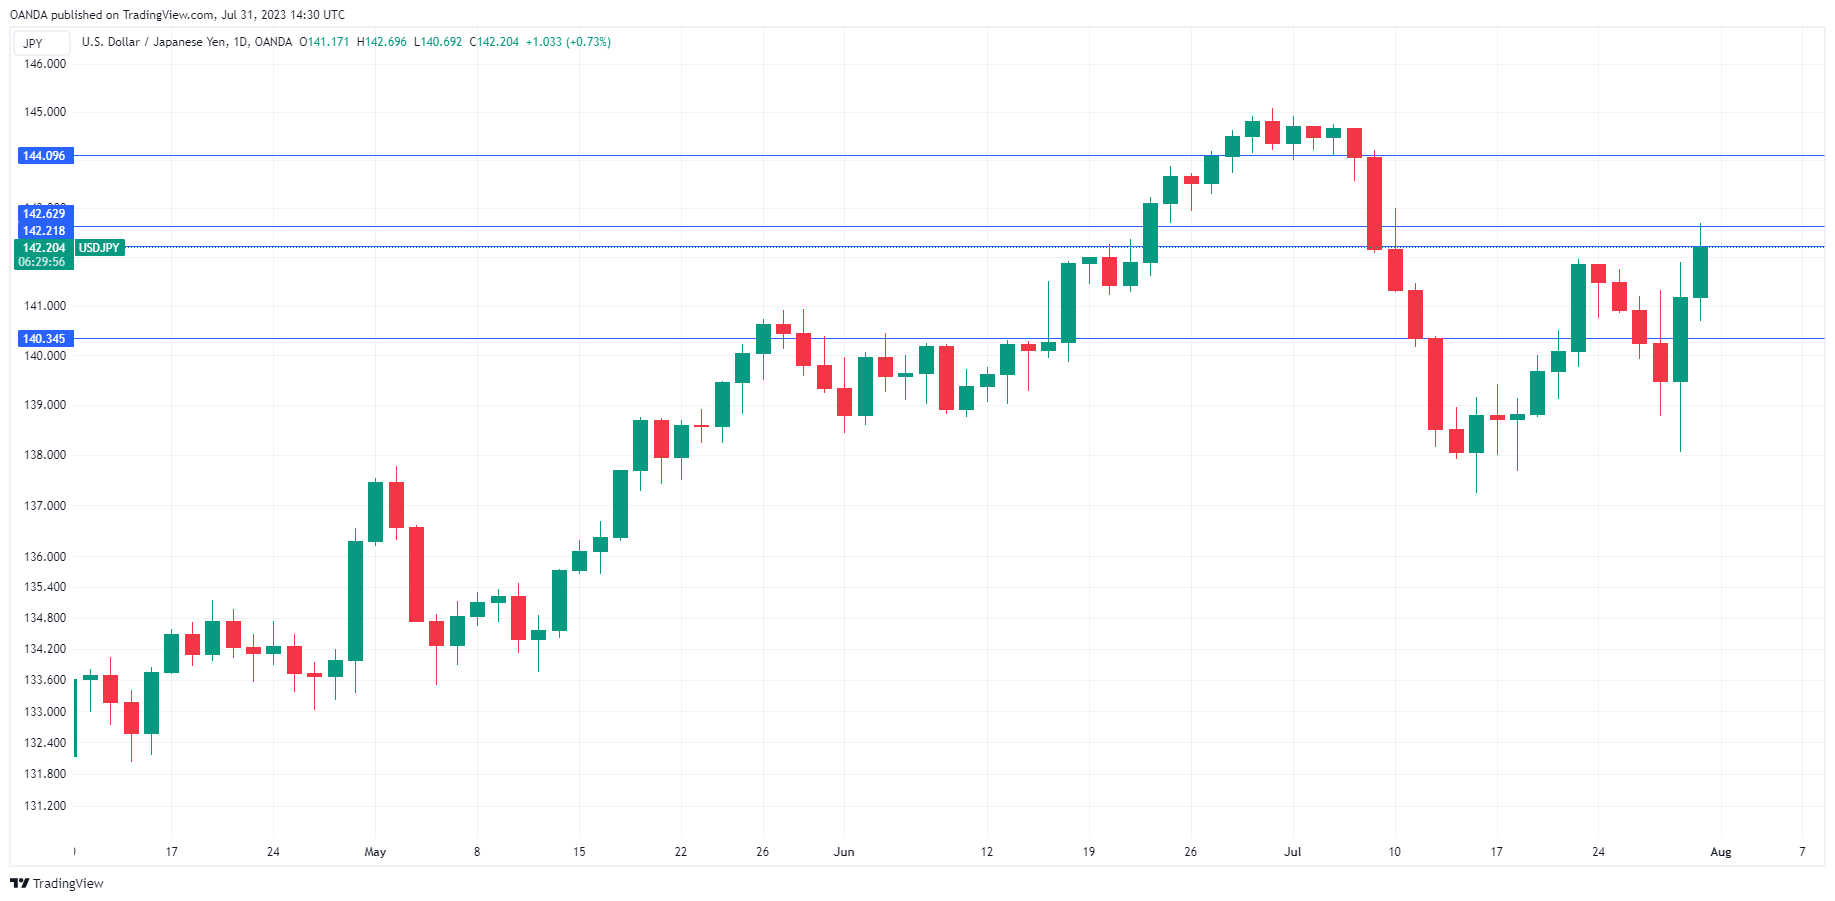
The Japanese yen has extended its slide on Monday and is trading at 142.22, down 0.75% against the US dollar.
BoJ surprises with JGB purchases
The Japanese yen continues to show sharp volatility, which can be attributed directly to moves by the Bank of Japan. On Friday, the BoJ caught the markets by surprise and loosened its yield curve control policy. The BoJ maintained its target for 10-year yields at around zero, but said that the 0.5% ceiling would be a reference point rather than a rigid limit and that it would offer to buy 10-year government bonds at 1%. Effectively, this widens the target band on 10-year bonds by a further 50 basis points.
The BoJ’s easing of yield curve control (YCC) raised speculation that the central bank could shift ultra-accommodative policy and this caused the yen to decline by 1.2% on Friday. Earlier on Monday, the BoJ announced it would buy an unlimited amount of JGBs. The BoJ did not wait for JGBs to hit 1% and decided to intervene in the bond market. The Bank’s intervention was a surprise and extended the yen’s losses, which have amounted to 2% since Thursday.
Governor Ueda tried to downplay the tweaking of yield curve control, saying that it did not mark a normalization of policy. Nevertheless, the move was significant, as the BoJ has diluted its yield cap of 0.50%, which it has heavily defended in the past.
In the US, the manufacturing sector remains in recession and has not shown expansion since October. Manufacturing PMI fell to 46.0 in June its worst showing since May 2020. The July Manufacturing PMI will be released on Tuesday, with a consensus of 46.8 points.
USD/JPY Technical
- USD/JPY is testing resistance at 1.4263. Above, there is resistance at 144.09
- There is support at 142.21 and 1.4035
USD/JPY Retesting Strong Intraday Resistance
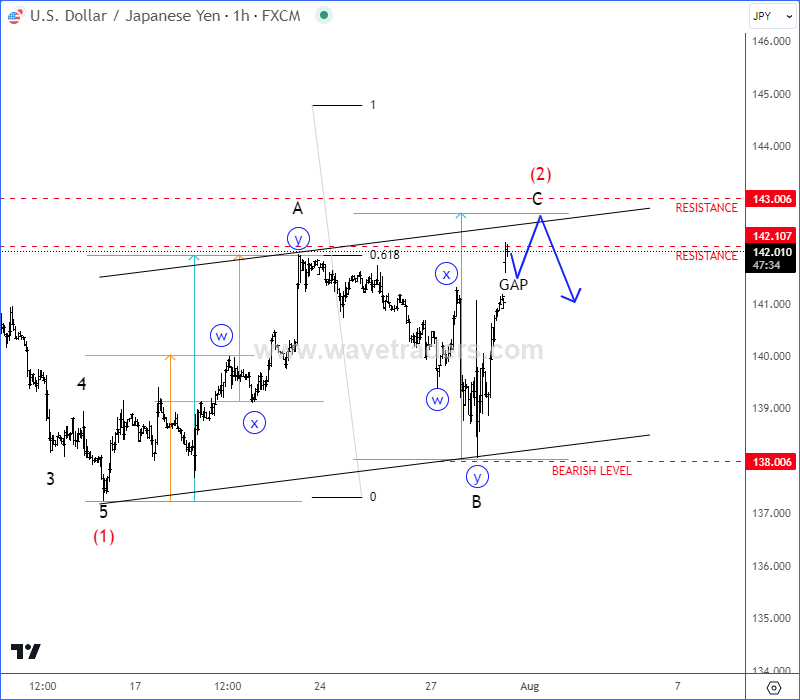
USDJPY is retesting the 142 – 143 resistance zone as a larger 3-3-5 regular A-B-C flat correction, where wave C can be already in final stages. So, still watch out for strong bears, especially if we will get sharp or impulsive intraday reversal down. Bearish confirmation is below 138 level.
Fed’s Goolsbee undecided on Sep FOMC decision
Chicago Fed President Austan Goolsbee, a voting member of this year's monetary policy committee, expressed his ambivalence about the upcoming FOMC meeting in September. In a interview by Yahoo Finance, Goolsbee remarked, "I haven't made up my mind for what should happen in September."
Goolsbee underscored the significance of several key data points that the Fed will have to consider before the September meeting. "We'll get several more major data points before the next meeting," he elaborated, indicating a reliance on these forthcoming data to inform any decisions about the policy rate.
Despite the uncertainty, Fed President is satisfied with the current progress, remarking, "But it's looking like we're walking the line pretty well." Goolsbee also suggested that future actions would need to be responsive to changing conditions, explaining that the Fed will have to "play by ear" on whether the policy rate is sufficiently restrictive.