Sample Category Title
A “Data-Dependent” RBA Does Not Bode Well for Aussie Bulls
- Australia’s central bank, RBA has kept its policy cash rate unchanged at 4.1% for the second consecutive month.
- The tonality of the latest monetary policy implies that RBA is now data-dependent, and indirectly acknowledged the negative adverse lagged effects of higher interest rates towards economic growth.
- Overall, RBA may continue to remain on hold on its policy cash rate at 4.1% for the rest of 2023 which in turn negates any potential major bullish movement of the AUD/USD.
Expectations of interest rates traders were right in line with the Australian central bank, RBA’s latest monetary policy decision (no interest rate hike today) that was in contrast to the 25-basis points hike consensus from the majority of the economists surveyed.
RBA has decided to hold on to its official policy cash rate at 4.1% for the second consecutive month; data from the ASX 30-day interbank cash rate futures as of 31 July 2023 has indicated a patty pricing of only a 14% chance of a 25-bps hike, down significantly from a 41% chance being priced a week ago.
These are the key takeaways from today’s RBA monetary policy statement;
The Board has decided to hold the interest rate steady this month to access the impact of the prior rate increases and monitor the economic outlook.
Risk of below-trend growth for the Australian economy due to weak household consumption growth and dwelling investment.
The labour market has remained tight, with job vacancies and postings at high levels, though labour shortages have lessened. But the unemployment rate is expected to rise gradually from 3.5% to around 4.5% in late 2024.
Even though wage growth has picked up due to the tight labour market and high inflation but wage growth, together with productivity growth remains consistent with the inflation target.
The current growth rate of 6% inflation in Australia is still considered too high. The central forecast expects CPI inflation will decline to around 3.5% by the end of 2024 and revert to the target range of 2% to 3% by late 2025.
The Board may consider further tightening of monetary policy to ensure inflation returns to the target range of 2% to 3% depending on data and evolving risk assessments.
Switched to being “data-dependent” suggests RBA may stand pat on interest rates till end of 2023
The last point as mentioned above stood up starkly, in the previous July’s monetary policy statement, it was noted as “some further tightening of monetary policy may be required to ensure that inflation returns to target in a reasonable timeframe, but that will depend upon how the economy and inflation evolve”.
In today’s monetary policy, it has been stated as “that will depend upon the data and the evolving assessment of risks”. Hence, this latest framing of being data-dependent, and acknowledging the implied negative adverse lagged effects of a higher interest rate environment towards economic growth (risk assessment) seems to portray that if the recent trend of key economic indicators continues their respective trajectories, it is likely the RBA may continue to remain on hold on its policy cash rate at 4.1% for the rest of 2023 while monitoring the global inflationary environment.
Lacklustre sentiment for AUD/USD
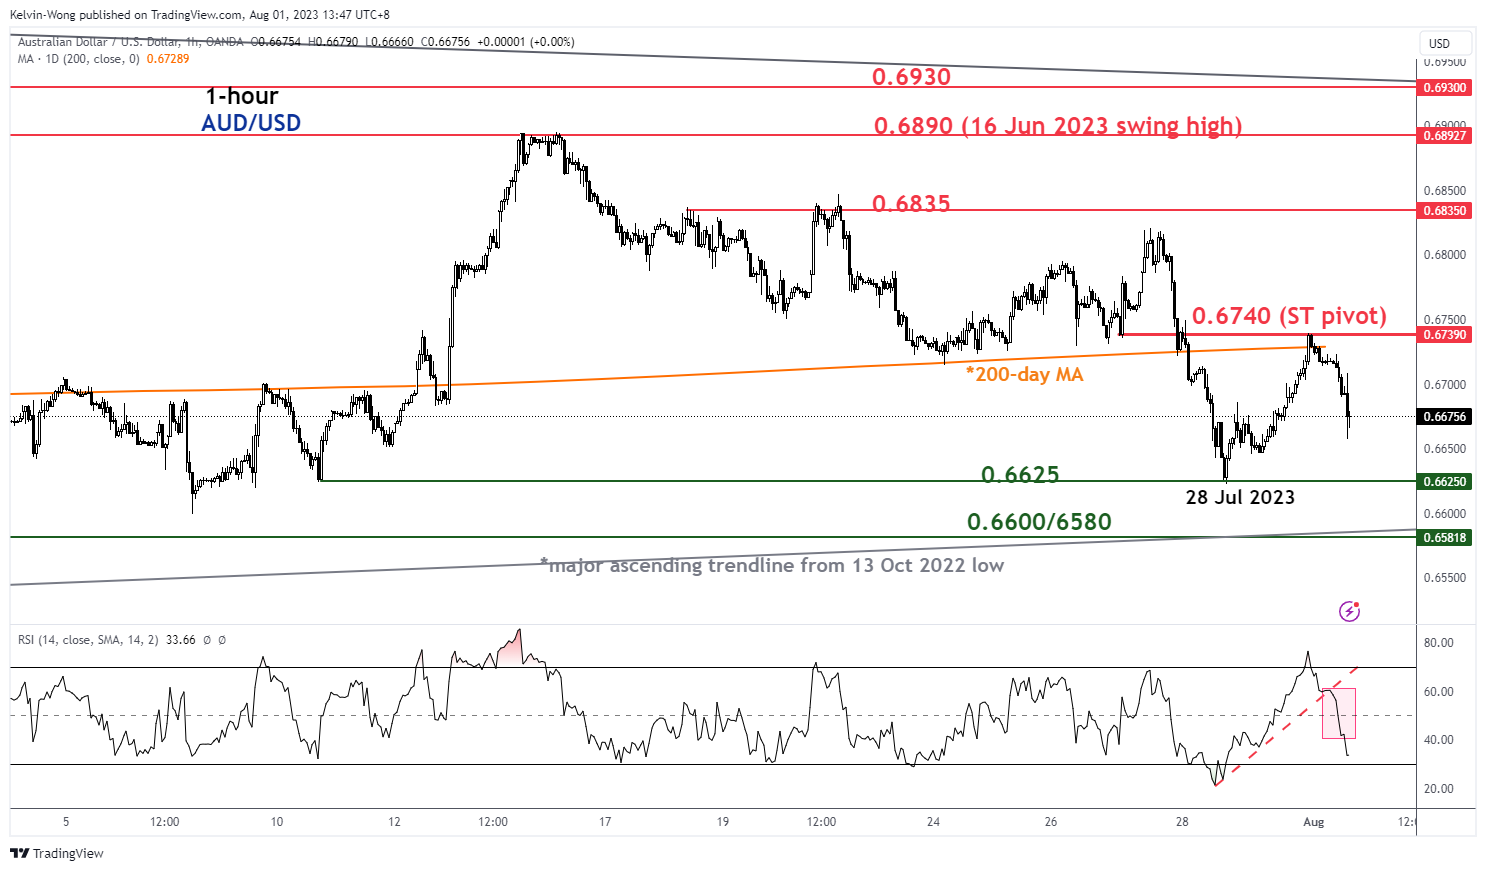
AUD/USD minor short-term trend as of 1 Aug 2023 (Source: TradingView, click to enlarge chart)
A “data-dependent” RBA has knocked out the bullish tone of AUD/USD after a reprieve rebound seen yesterday, 31 July where the pair staged a minor rebound of 117 pips from its last Friday, 28 July intraday low of 0.6622 to an intraday high of 0.6739 during yesterday’s US session.
Right now, it has shed -81 pips to print a current intraday low of 0.6657 at this time of the writing, and the Aussie is the worst performer intraday today, 1 Aug (-0.65%) among the major currencies against the US dollar; EUR (-0.03%), CHF (-0.03%), GBP (-0.07%), CAD (-0.22%), and JPY, (-0.34%).
The Aussie has resumed its underperformance against the US dollar seen in the last two trading days of last week where the AUD/USD recorded an accumulated loss of -1.68% from 27 July to 28 July versus EUR/USD (-0.63%), GBP/USD (-0.71%), and JPY/USD (-0.65%) over the same period ex-post FOMC, ECB, and BoJ.
From a technical analysis standpoint, short-term bearish momentum remains intact as yesterday’s rebound has failed to surpass the 200-day moving average after a re-test on it, now acting as a key short-term pivotal resistance at around 0.6740 with the next major support coming in at 0.6600/6580.
Aussie Trades on Backfoot Following RBA’s Decision
Markets
European (core) inflation and Q2 GDP growth topped expectations and keeps the September ECB meeting a very live one but it caught more attention from market watchers than markets themselves. The Fed’s Senior Loan Officer Opinion Survey showed that past rate increases are still working through the economy, curbing both credit demand and supply. Chair Powell had the SLOOS already at his disposal during the policy meeting last week. Core bonds started on weaker footing in Asian and early European dealings but soon found their composure. Eventual changes amounted to no more than -1.3 (2-)y to +0.1 (30-y) bps in Germany and moves of less than 1 bp across the US curve. European stocks inched marginally higher as did Wall Street, thanks to an end-of-session jump. The dollar showed no clear directional trend on FX markets. EUR/USD in the end closed a tad lower in the 1.10 area. EUR/GBP went nowhere in the upper 0.85/86 half. The Japanese yen was a notable underperformer following the BoJ’s unscheduled bond-buying operation. USD/JPY finished comfortably above 142, EUR/JPY north of 156. Cyclicals and commodity driven currencies including the Norwegian krone, Aussie and kiwi dollar topped the G10 leader bord. Brent oil extended its recent advance yesterday to close above $85/b for the first time since mid-April.
Stocks in the Asian-Pacific region kick off the new month in a mildly constructive risk setting. China marks an exception. The private Caixin manufacturing PMI unexpectedly fell into contraction territory (49.2 from 50.5). The dollar ekes out a small gain while the Aussie trades on the backfoot following the RBA’s decision to hold steady. Japan’s yen is still in the defensive though losses remain contained. Yet another stronger-than-expected PBOC fixing of China’s yuan doesn’t result in follow-up gains after a strong July month for the currency. USD/CNY fills bids in the 7.166 region. Core bond markets trade with a minor upward bias as we go into early European dealings. There’s not much to be seen there in terms of economic data though. We have to wait until the US opens with the JOLT job openings and July manufacturing ISM scheduled for release. The former is expected to ease to a still-elevated 9600k. Consensus for the latter is for a potential bottoming out of the indicator, from 46 to 46.9 but analysts were hoping something similar last month too. This time around, several regional indicators as well as the July PMI’s suggest it may finally happen. That could put a bottom below core/US bond yields and the dollar, although we do not expect a sharp market reaction as other key data points are still due later this week.
News and views
The Reserve Bank of Australia this morning kept its policy rate unchanged at 4.1%. The decision surprised the average analyst (expectations for a 25 bps) but not so much markets, who only saw a 20% chance of another tightening move. The RBA’s hold comes amid uncertainty of the passthrough of its previous 400 bps rate hikes on household consumption, the labour market and the economy in general. Inflation is declining but is still too high at 6% with especially persistent services inflation a point of worry. CPI should decline further but may only reach the 2- 3% target range in late 2025. The economy meanwhile is growing below trend as household consumption weakened as did dwelling investment. A tight labour market is showing further signs of some easing. Wages continue to grow however. The pace is considered to be consistent with the inflation target provided that productivity growth picks up. The RBA keeps the possibility of more tightening on the table but it depends on how the data evolves. Today’s halt provides the opportunity of a more thorough assessment by the next meeting September 5. Australian money markets currently only attach a 50% probability of one more hike later this year to 4.35%. Swap yields drop up to 6 bps at the front end of the curve while the Aussie dollar loses moderate ground. AUD/USD declines from 0.672 to 0.667.
UK shop prices for the first time in two years actually fell in July, dropping 0.1% m/m compared to June. That brought the annual rate from 8.4% to 7.6%, the second drop straight after hitting a series high of 9% in May this year. It is another potential sign of inflation easing further in the country, even though the rate is still much too high. June CPI numbers two weeks ago also came in lower than expected after four consecutive (strong) beats. The data is undoubtedly welcomed by the Bank of England. The central bank meets on Thursday. A hike is all but certain though the jury is still out on the size (25 vs 50 bps).
DAX Higher High Sequence Supports More Upside
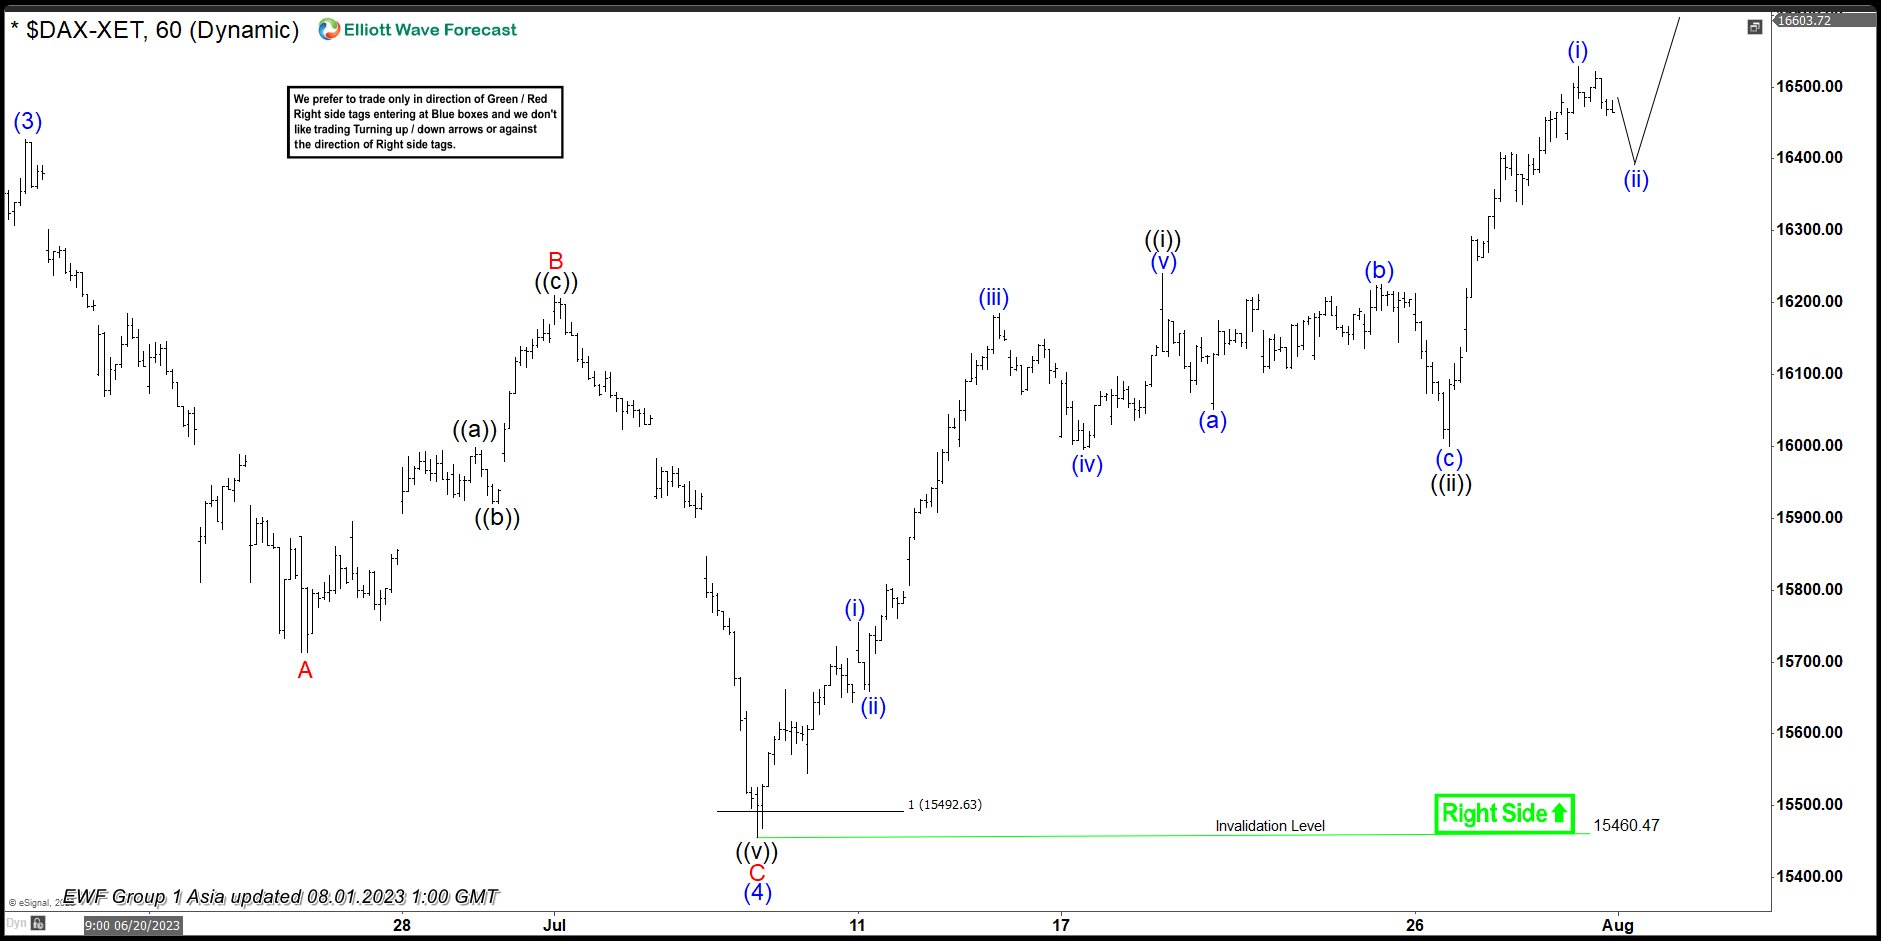
Short Term Elliott Wave view in DAX suggests that a index ended wave (3) at 16427.42 high. Down from there, the index made a pullback in wave (4). The internals of that pullback unfolded as a zigzag correction where wave A ended at 15713.70 low. Up from there, the wave B bounce ended at 16209.29 high in a lesser degree 3 wave. And started the C leg lower towards 15494.55- 15054.13 extreme area. From there, the index started the next extension higher & now showing an incomplete sequence within the cycle from the 7.07.2023 low supporting more upside.
The index ended wave (4) at 15460.47 low and above from there already made a new high above 16427.42 high confirming the next extension higher. While the initial rally to 16240.79 high ended the impulse rally in wave ((i)) in a lesser degree 5 waves sequence. Below from there, the index made a 3 wave pullback in wave ((ii)) as a lesser degree zigzag structure. When small wave (a) ended at 16050.98 low. Then small wave (b) bounce ended at 16225.89 high and wave (c) ended at 16000.04 low. Then index started the next leg higher suggesting a possible nesting higher. Near-term, as far as dips remain above $16000.04 low and more importantly above 16427.42 low the index is expected to remain supported in 3, 7 or 11 swings looking for more upside towards 16785- 17272 area..
DAX 1 Hour Elliott Wave Chart From 8.01.2023
DAX Elliott Wave Video
https://www.youtube.com/watch?v=TsG8X6qsTIQ
Technical Outlook and Review
DXY:
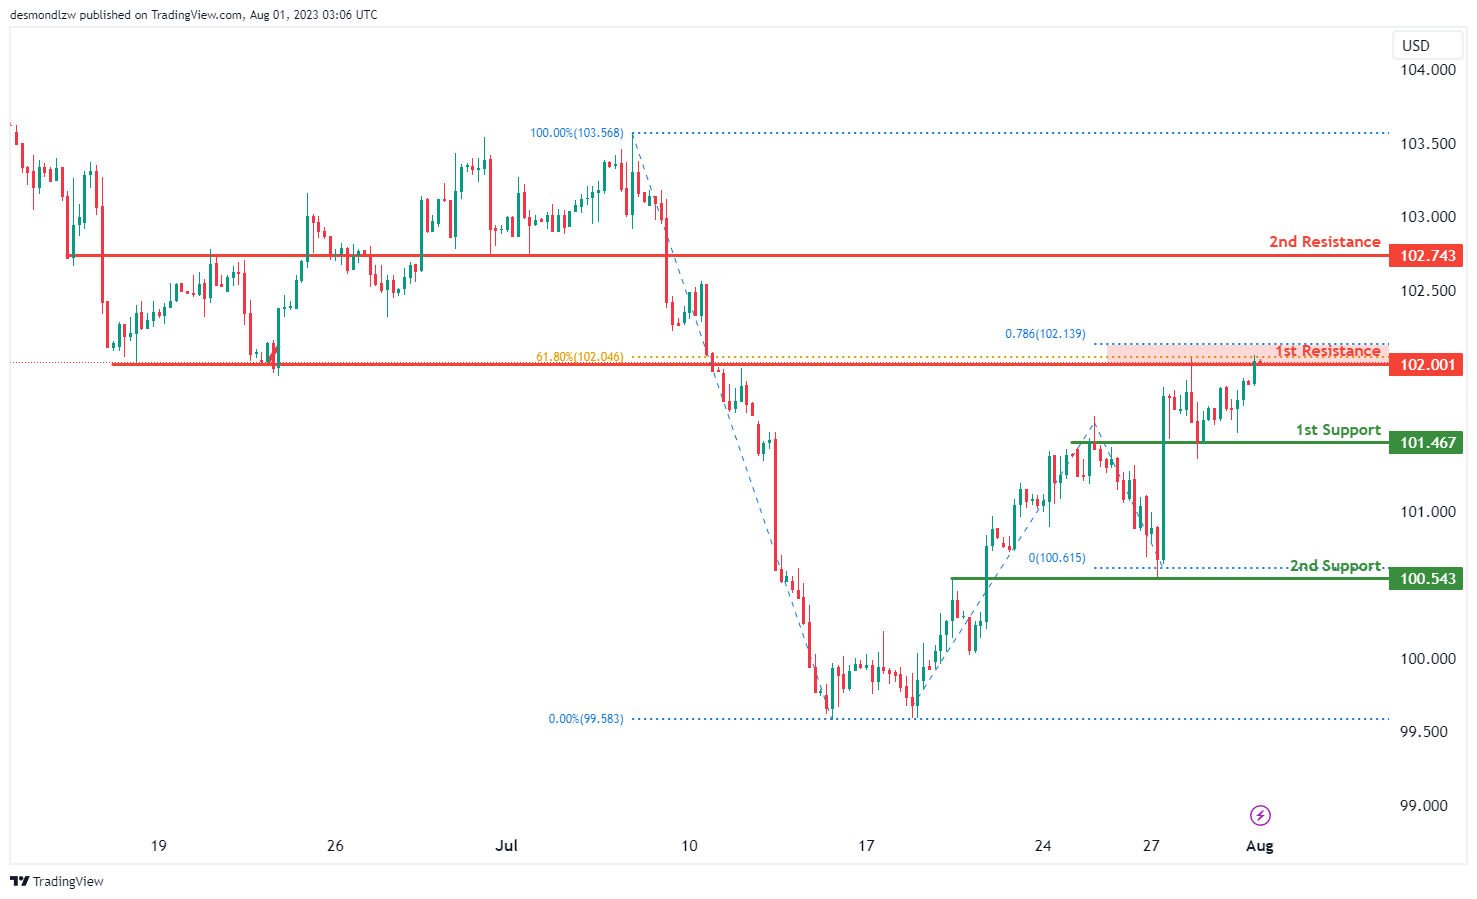
The DXY is showing a bearish trend, with the possibility of a bearish reaction off the 1st resistance level at 102.00 that could lead the price to drop towards the 1st support level at 101.46. This resistance level is significant due to its role as an overlap resistance and its alignment with the 61.80% Fibonacci retracement and 78.60% Fibonacci projection levels, suggesting a Fibonacci confluence.
The 1st support level is considered strong due to its role as an overlap support. Should the price fall below this level, the 2nd support at 10.53, another overlap support, could halt further decline.
On the flip side, if the price increases, it would meet the 2nd resistance level at 102.74, which has functioned as a pullback resistance in the past and aligns with the 50% Fibonacci retracement level. This level could pose a challenge to the price movement.
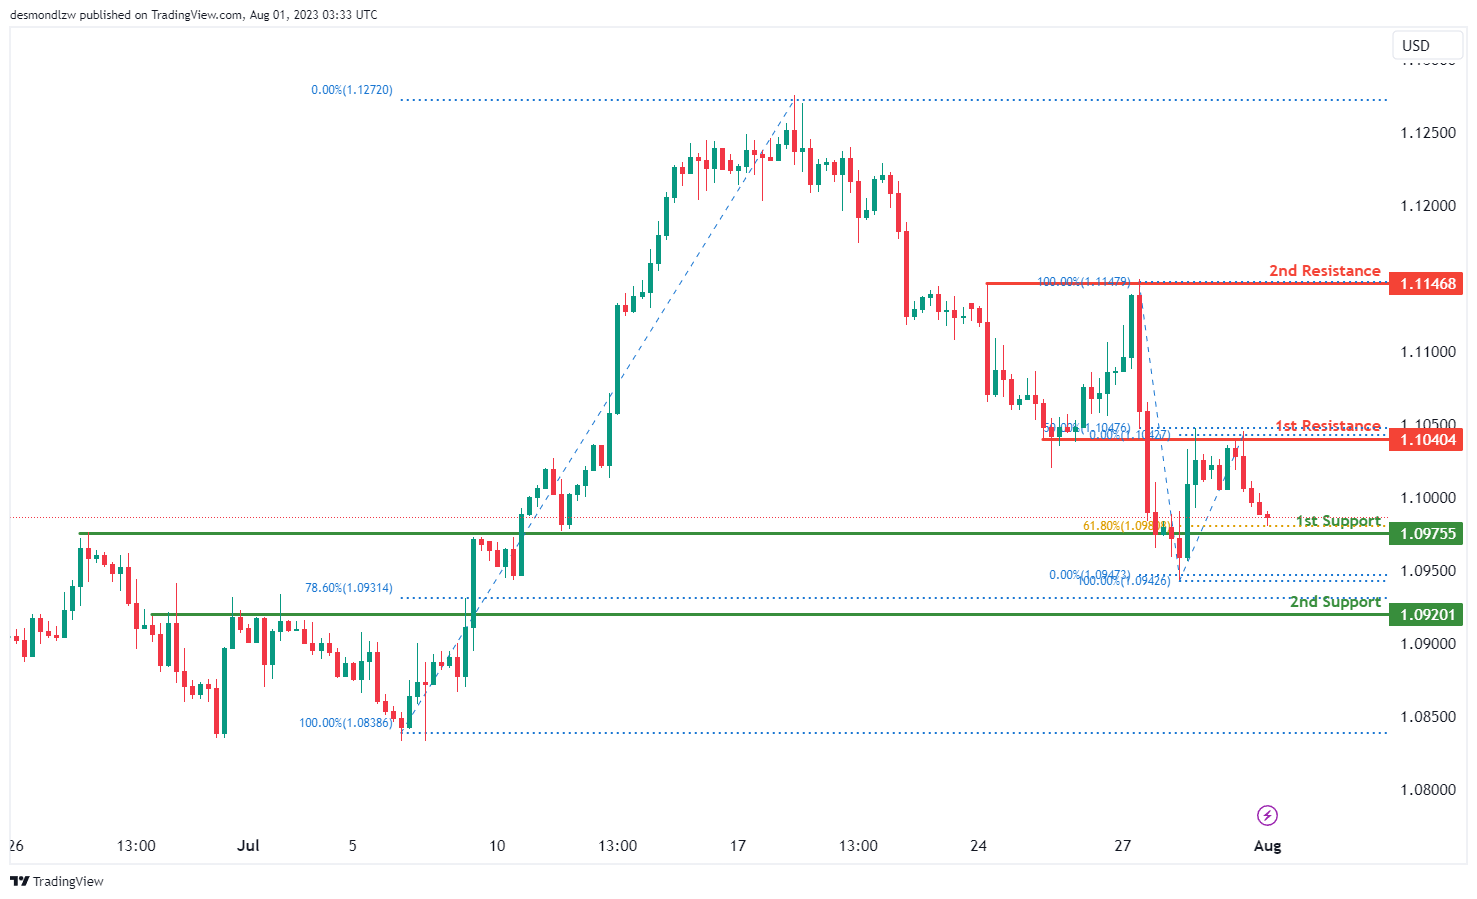
EUR/USD:
The EUR/USD pair is displaying a bullish trend, with the potential to make a bullish bounce off the 1st support level at 1.0975 and move towards the 1st resistance level at 1.1040. The 1st support level is significant due to its role as a pullback support and its alignment with the 61.80% Fibonacci retracement level.
If the price falls further, the 2nd support level at 1.0920, another pullback support aligning with the 78.60% Fibonacci retracement level, could prevent further price decline.
On the upside, the 1st resistance level is notable for its role as an overlap resistance and alignment with the 50% Fibonacci retracement level. If the price moves past this level, the 2nd resistance level at 1.1146, known as a swing high resistance, could pose a challenge for further price increase.
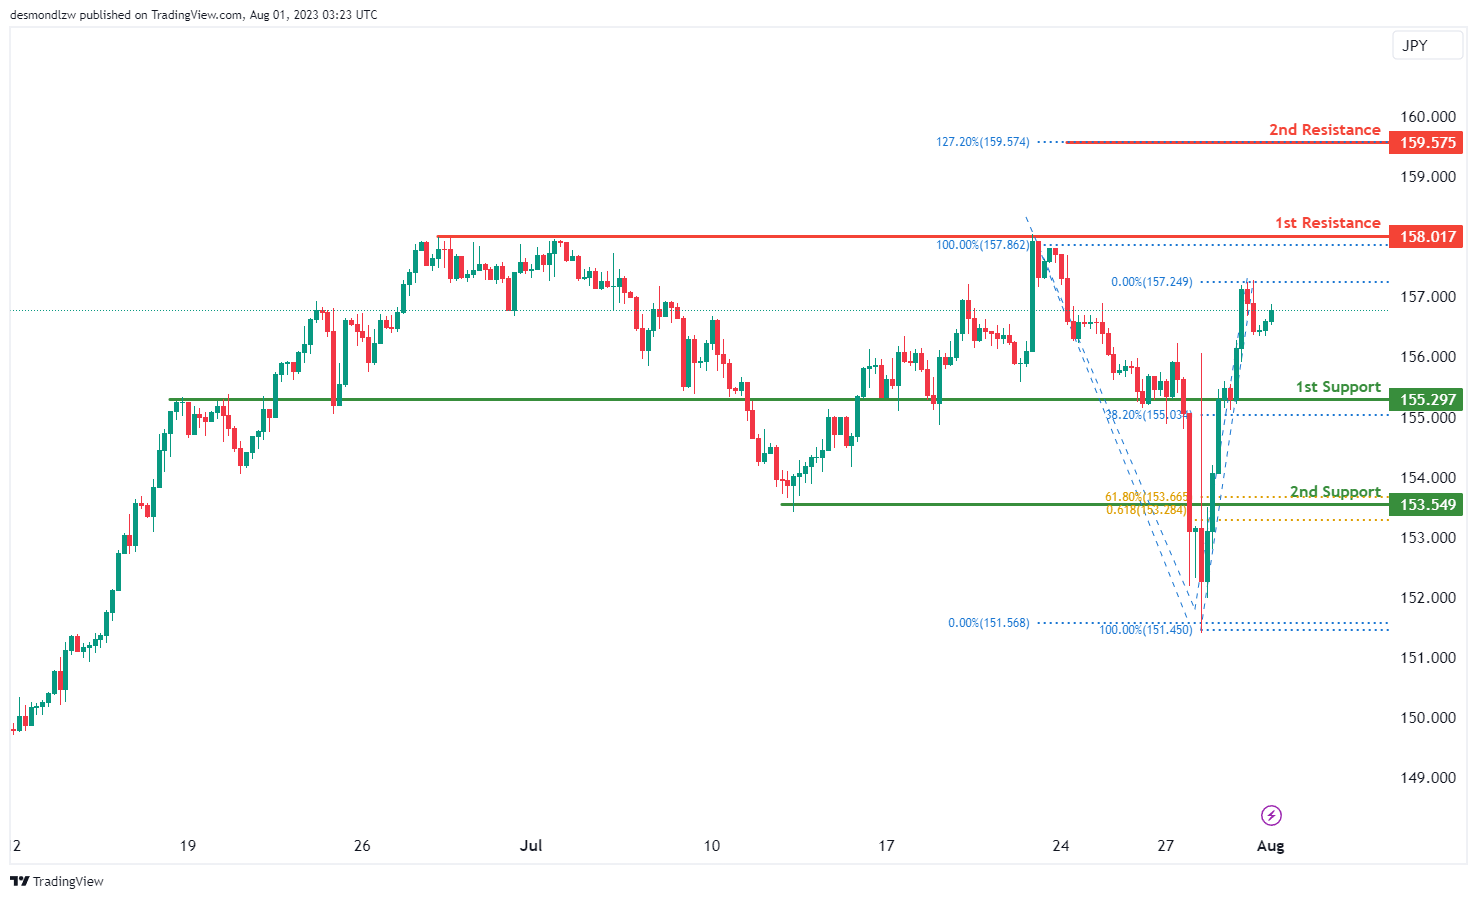
EUR/JPY:
The EUR/JPY chart shows a neutral momentum, suggesting the potential for price to fluctuate between the 1st resistance and 1st support levels.
The 1st support at 155.30 is considered a significant level as it coincides with the 38.20% Fibonacci retracement, making it a relevant area for potential bounce or reversal.
Furthermore, the 2nd support at 153.54 is an important level to watch as it aligns with both the 61.80% Fibonacci retracement and the 78.60% Fibonacci projection, indicating a Fibonacci confluence that may act as strong support.
On the upside, the 1st resistance at 158.01 represents a multi-swing high resistance, which could potentially cap the price’s upward movement.
Additionally, the 2nd resistance at 159.57 corresponds to the 127.20% Fibonacci retracement, providing another key level to observe for potential resistance.
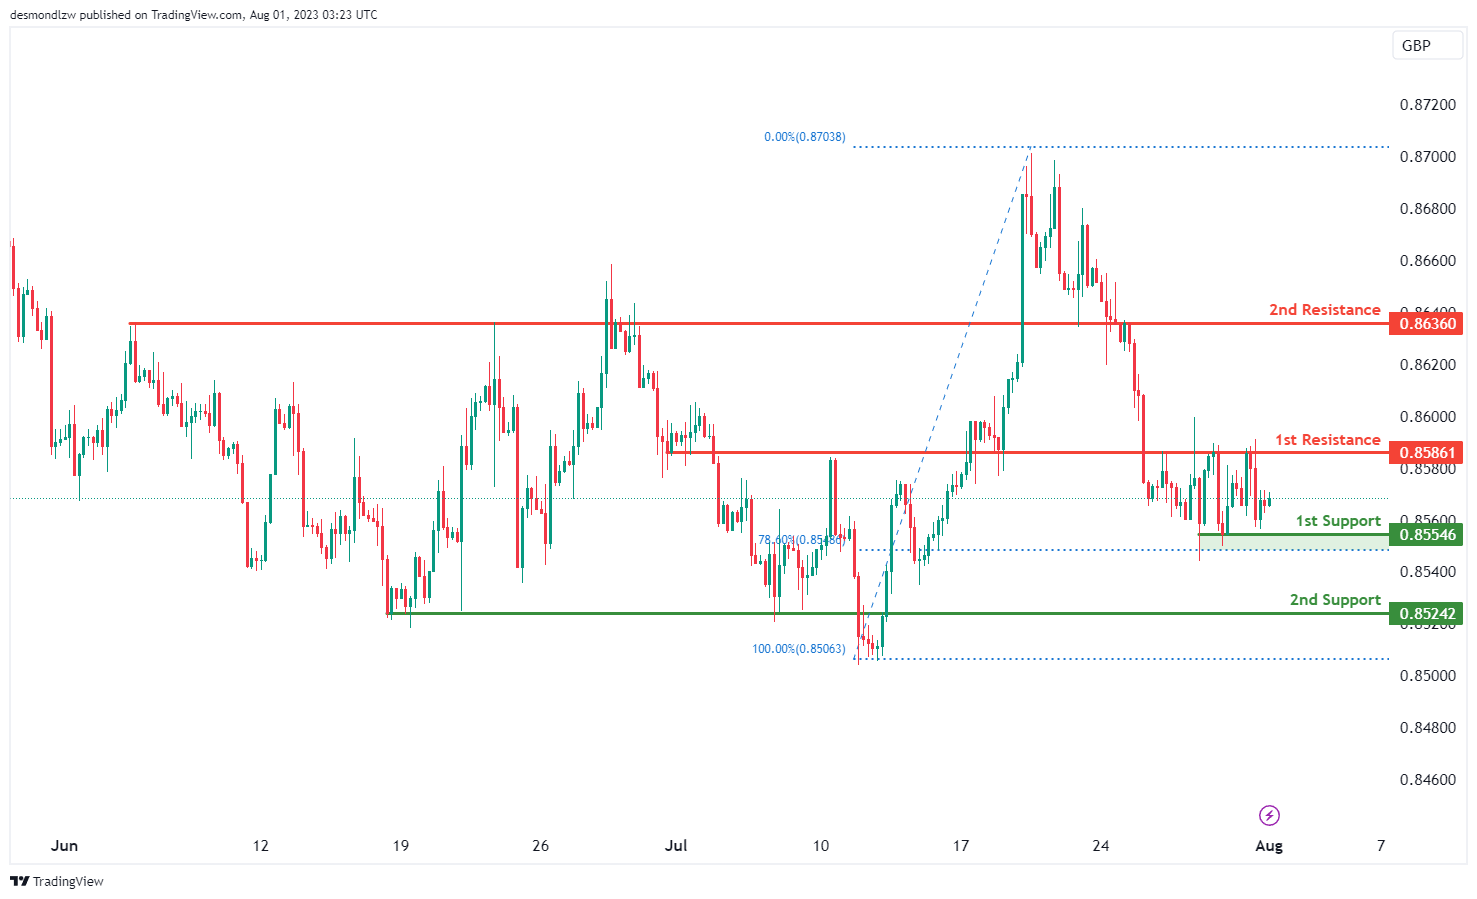
EUR/GBP:
The EUR/GBP chart displays a neutral momentum, suggesting the potential for price to fluctuate between the 1st resistance and 1st support levels.
The 1st support at 0.8554 is an essential level as it corresponds to multi-swing high resistance, indicating its significance as a potential bounce area.
Similarly, the 2nd support at 0.8524 is another key level as it is an overlap support, making it a relevant area for potential price reversals.
On the upside, the 1st resistance at 0.8586 represents another multi-swing high resistance, which could limit the price’s upward movement.
Furthermore, the 2nd resistance at 0.8636 is identified as an overlap resistance, providing another significant level to watch for potential price reactions.
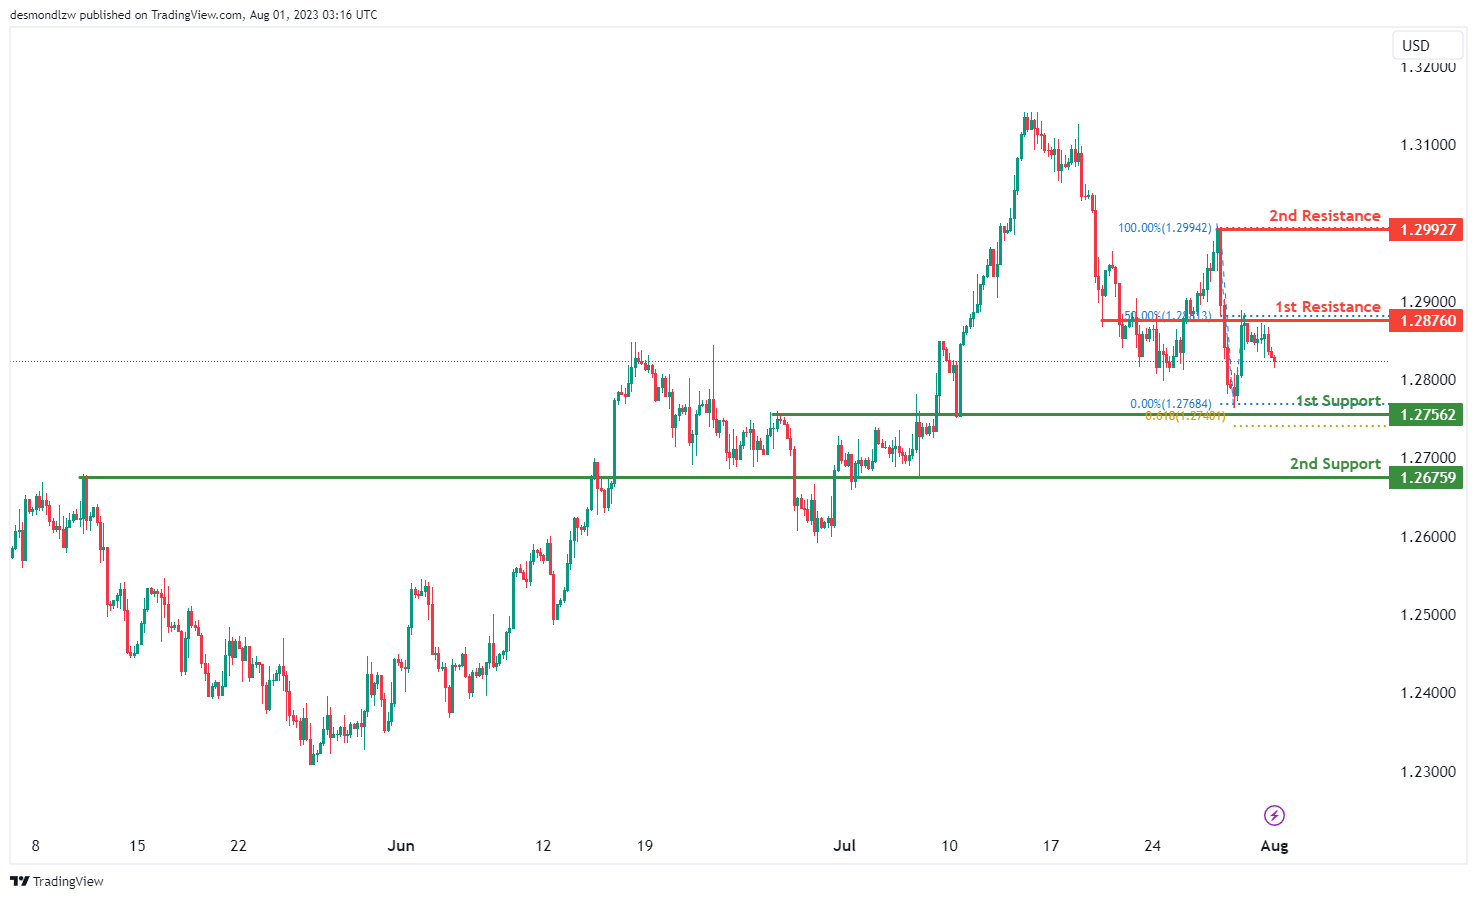
GBP/USD:
The GBP/USD pair currently exhibits a bearish trend, with a potential scenario of a bearish reaction off the 1st resistance level at 1.2876 and a subsequent fall towards the 1st support level at 1.2756. The 1st support level is notable due to its role as an overlap support and alignment with the 61.80% Fibonacci projection level.
If the price drops further, the 2nd support level at 1.2675, another overlap support, could prevent further downward movement.
On the bearish side, the 1st resistance level is significant for its role as an overlap resistance and alignment with the 50% Fibonacci retracement level. If the price breaks through this level, the 2nd resistance level at 1.2992, which has served as a swing high resistance in the past, could hinder further price decline.
GBP/JPY:
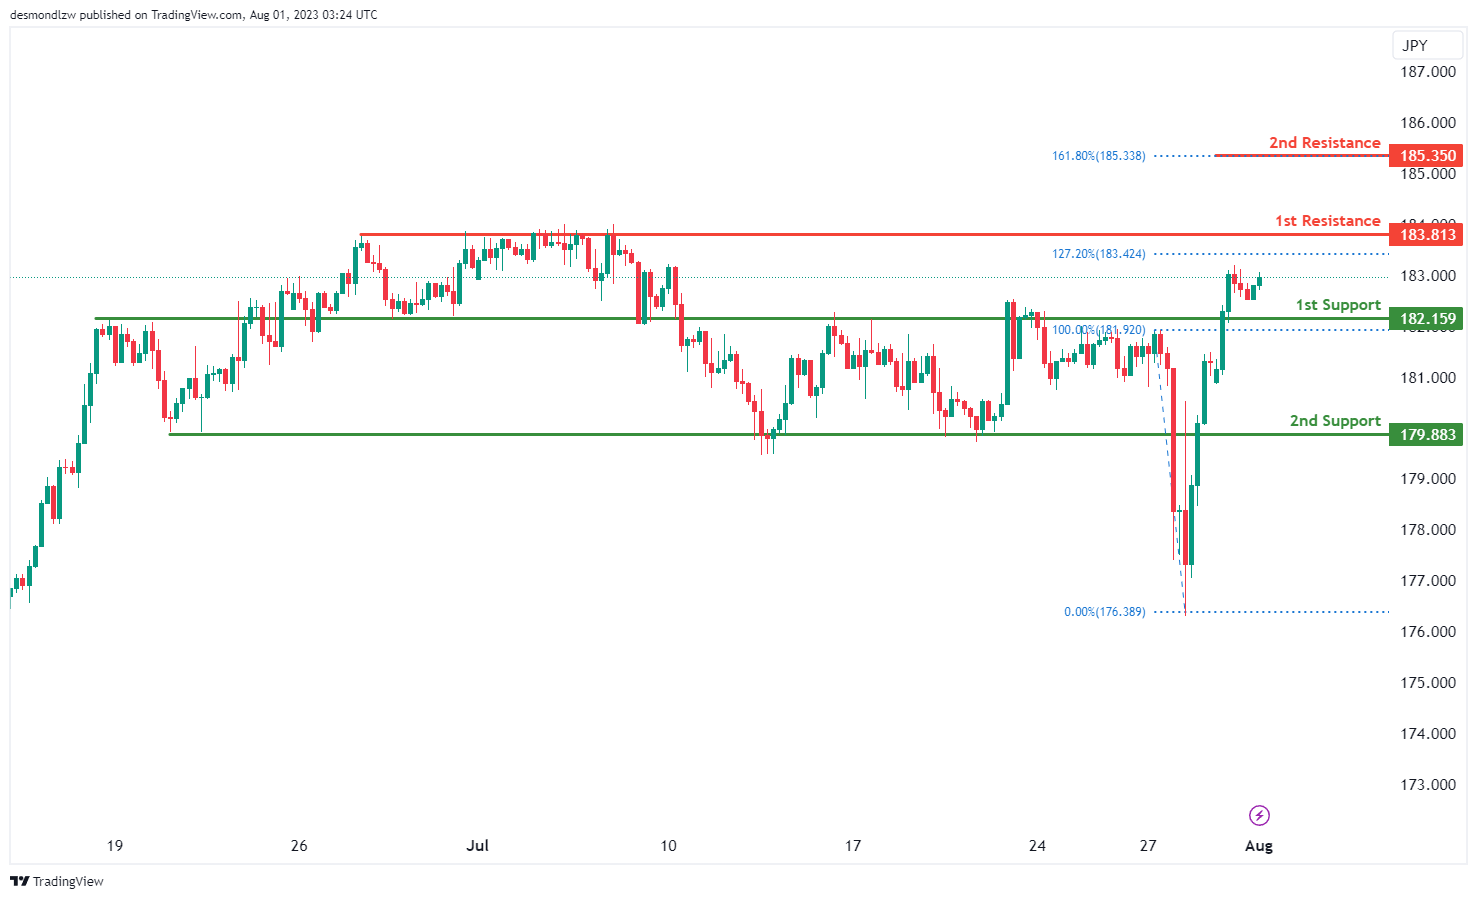
The GBP/JPY chart exhibits a bullish momentum, indicating the potential for a bullish continuation towards the 1st resistance level at 183.81. This resistance level is significant as it aligns with multi-swing high resistance and also coincides with the 127.20% Fibonacci Extension level, suggesting its importance in potential price movements.
For potential downward movements, the chart has 1st and 2nd support levels at 182.15 and 179.88, respectively. Both of these support levels are recognized as overlap supports, indicating their potential significance in providing a bounce for the price.
On the upside, the 2nd resistance at 185.35 represents another relevant level as it is an overlap resistance and corresponds to the 161.80% Fibonacci Extension level, adding to its importance as a possible barrier for further upward movement.
USD/CHF:
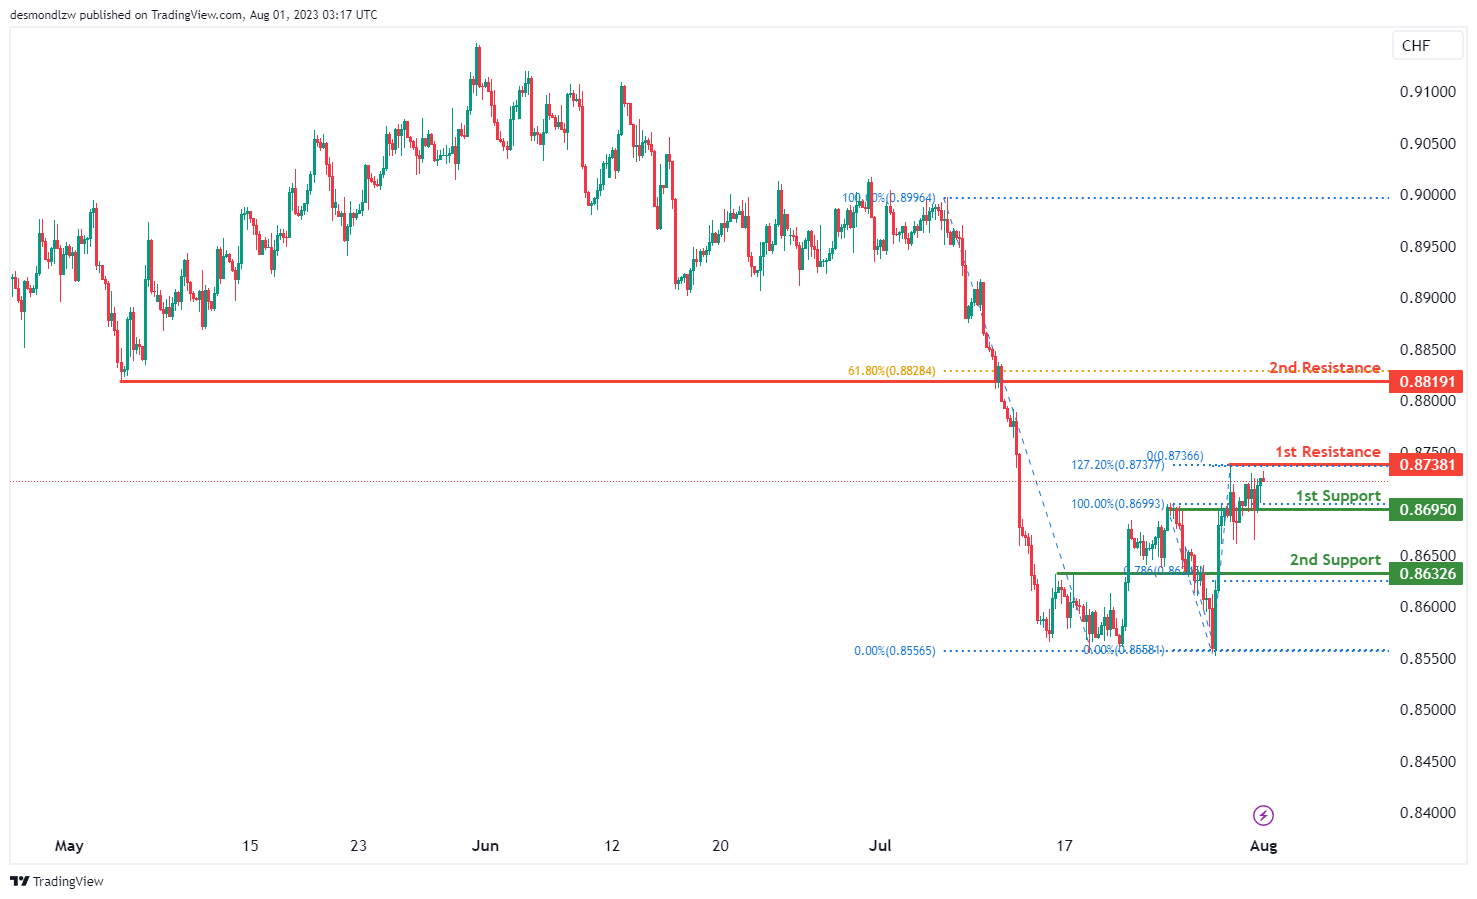
The USD/CHF pair currently indicates a bearish trend, with potential for a bearish reaction off the 1st resistance level at 0.8738, which could cause the price to drop towards the 1st support level at 0.8695. This support level is significant due to its role as an overlap support.
If the price declines further, the 2nd support level at 0.8632, which acts as a pullback support, could play a crucial role in halting further downward movement.
On the bearish side, the 1st resistance level is noteworthy for its role as a swing high resistance and its alignment with the 127.20% Fibonacci Extension. If the price attempts to rise above this level, the 2nd resistance level at 0.8819, which has served as a pullback resistance and aligns with the 61.80% Fibonacci retracement, could hinder further price progression.
USD/JPY:
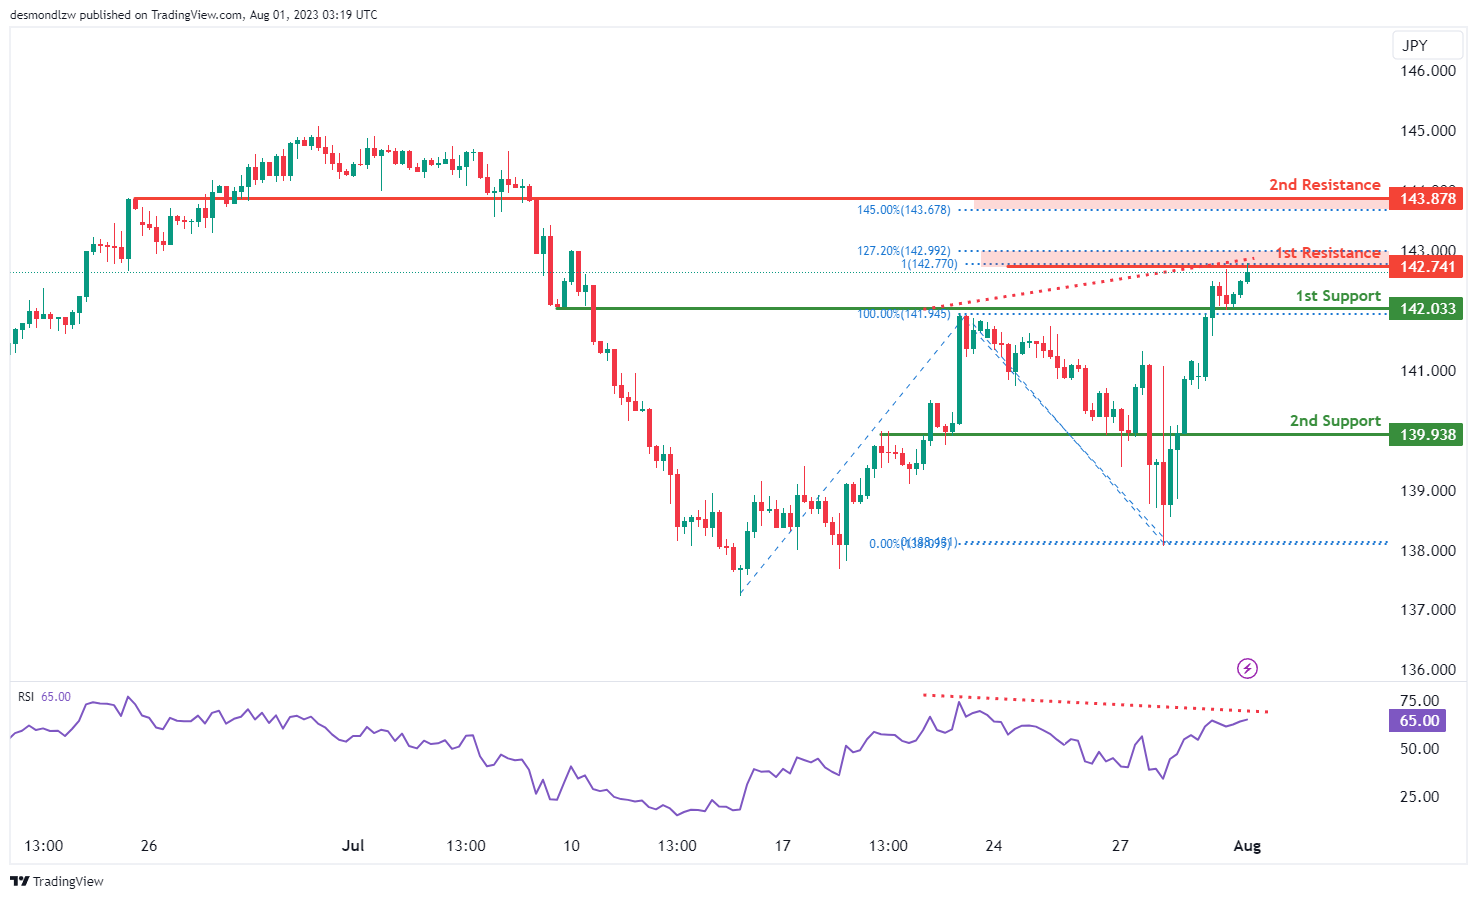
The USD/JPY pair is presently indicating a bearish momentum, with the potential for a bearish reaction off the 1st resistance level at 142.74. This could cause the price to drop towards the 1st support level at 142.03, a significant area due to its role as an overlap support.
If the price decreases further, the 2nd support level at 139.93, functioning as a pullback support, could serve as a key level to halt further bearish movement.
On the resistance side, the 1st resistance level at 142.74 is notable for its role as a swing high resistance and its alignment with the 127.20% Fibonacci Extension and 100% Fibonacci Projection, suggesting a Fibonacci confluence. If the price attempts to break past this level, the 2nd resistance level at 143.87 could present a challenge. This level has acted as a pullback resistance and aligns with the 145.00% Fibonacci Extension.
In addition to these levels, the Relative Strength Index (RSI) is showing bearish divergence compared to the price, suggesting that a reversal may occur soon.
USD/CAD:
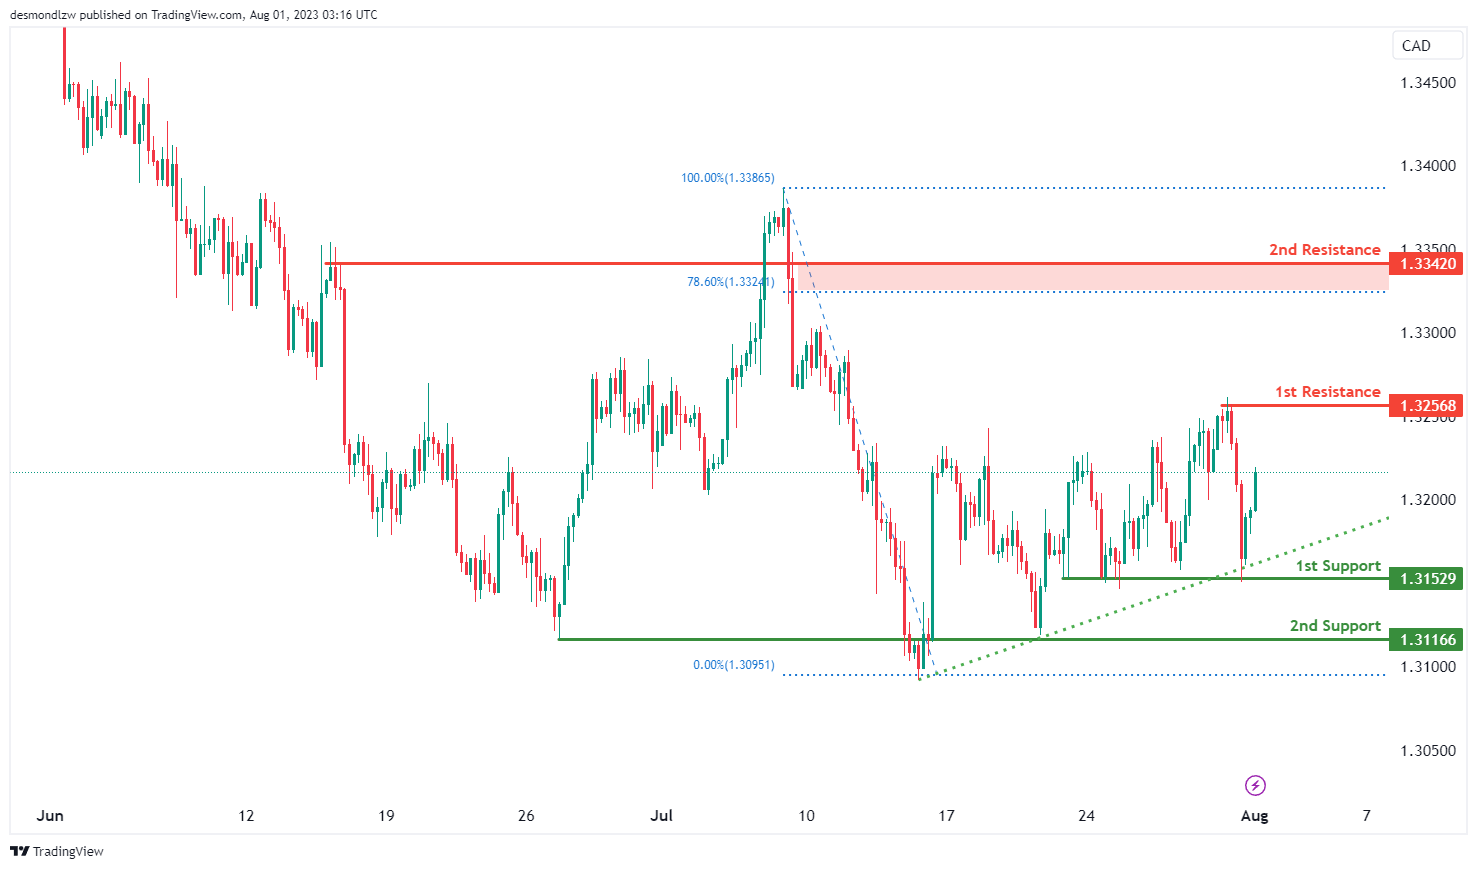
The USD/CAD chart displays a bullish momentum, supported by the fact that the price is above a major ascending trend line, suggesting the potential for further upward movement.
A possible scenario indicates a potential bullish continuation towards the 1st resistance level at 1.3257. This resistance is considered significant as it represents a swing high resistance. Additionally, the 2nd resistance at 1.3342 serves as another crucial area of potential price resistance. It corresponds to an overlap resistance and coincides with the 78.60% Fibonacci retracement level.
On the downside, the 1st support at 1.3153 and the 2nd support at 1.3117 are both identified as important overlap areas providing support to the price.
AUD/USD:
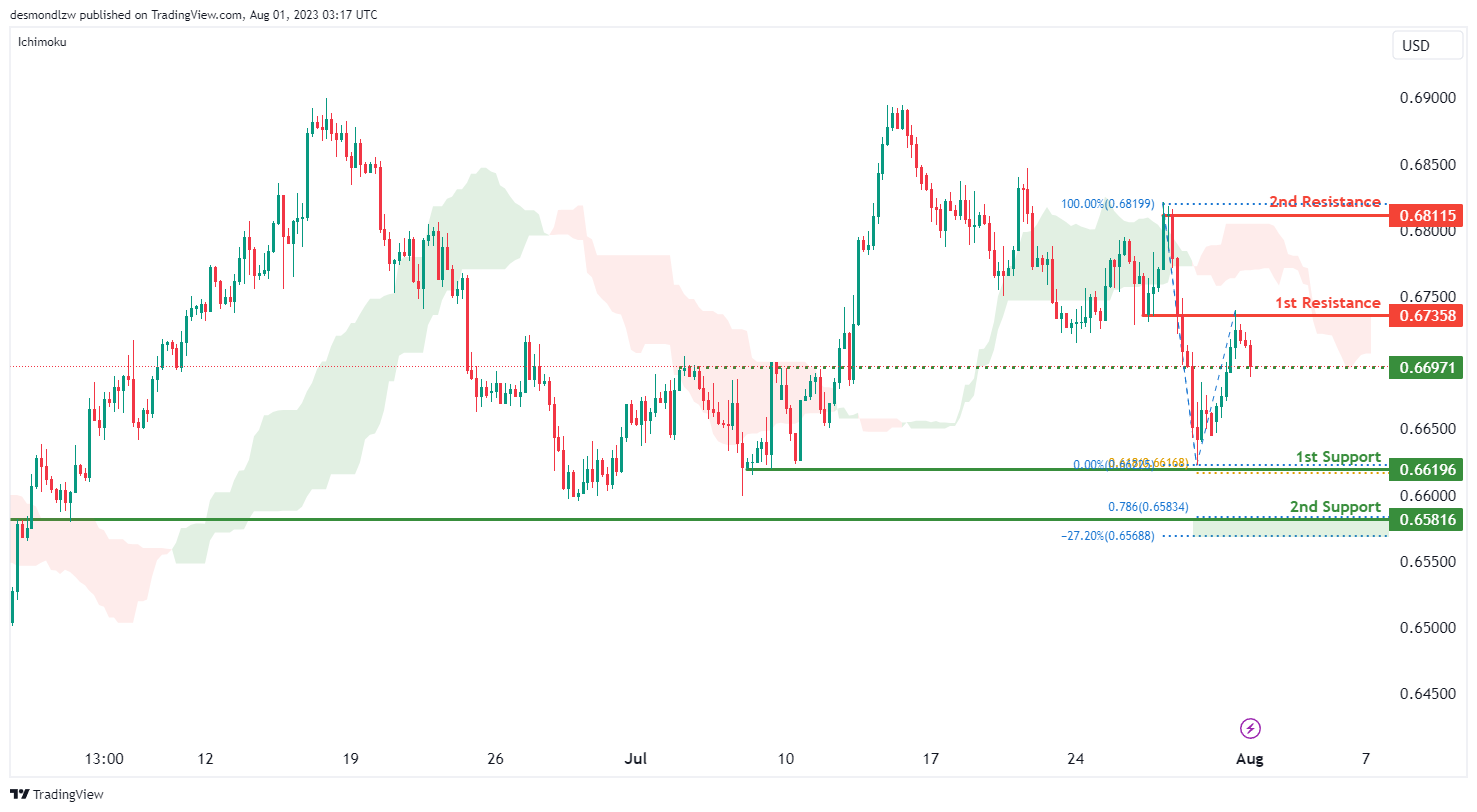
The AUD/USD chart indicates a bearish momentum, supported by the fact that the price is below the bearish Ichimoku cloud. A potential scenario suggests a bearish continuation towards the 1st support level at 0.6619, should price break below the intermediate support at 0.6697.
The 1st support level is considered significant as it represents an overlap support and coincides with the 61.80% Fibonacci projection level. Furthermore, the 2nd support at 0.6582 is another important area, providing additional support to the price. This level aligns with an overlap support that represents a confluence of Fibonacci levels i.e. the 78.60% projection and the -27% expansion levels.
On the upside, the 1st resistance at 0.6736 serves as a crucial area of potential price resistance, while the 2nd resistance at 0.6812 represents a significant swing high resistance.
NZD/USD
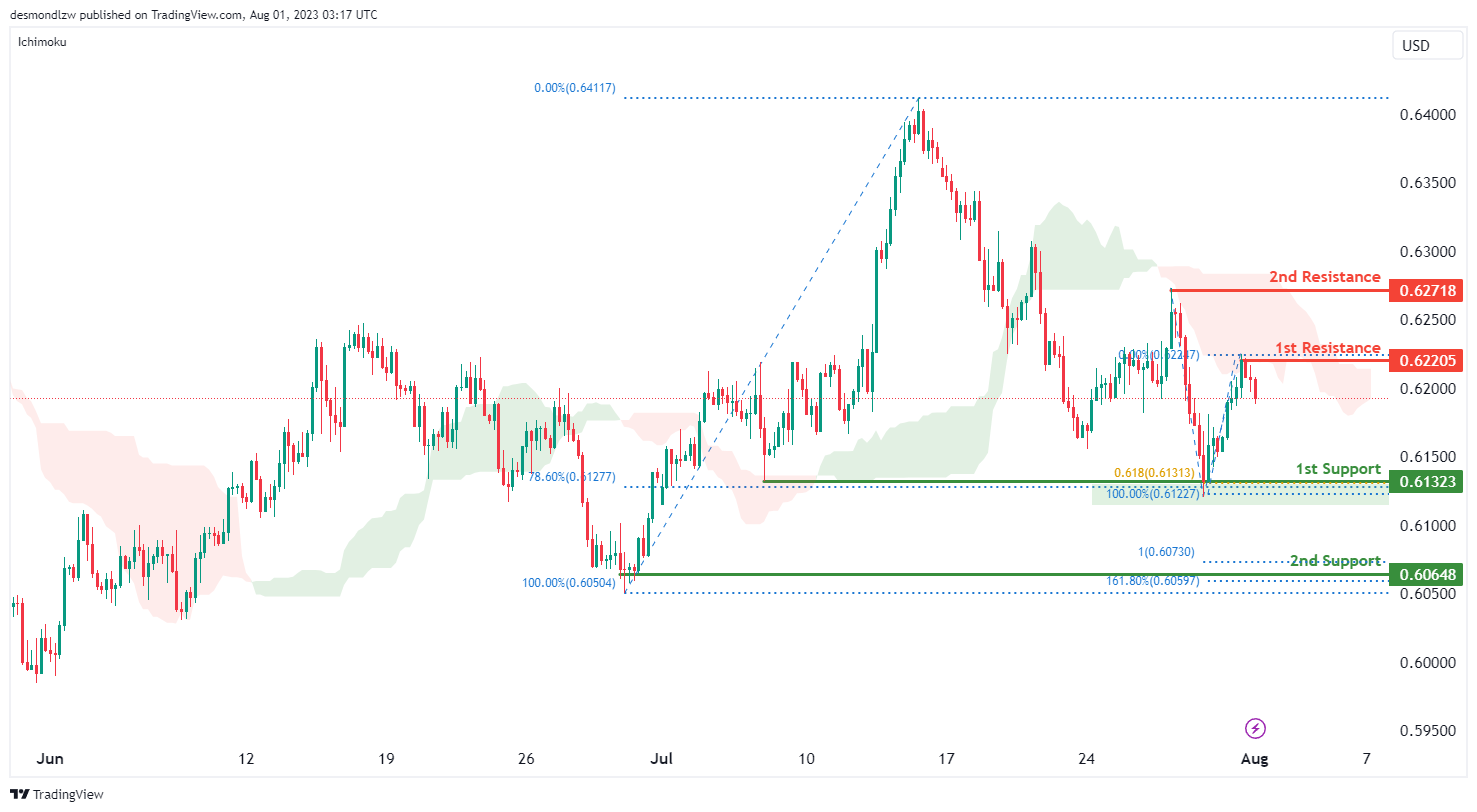
The NZD/USD chart displays a bearish momentum, as the price remains below the bearish Ichimoku cloud.
A potential scenario indicates a bearish continuation towards the 1st support level at 0.6132, which holds significant importance as it aligns with an overlap support as well as with the 61.80% Fibonacci projection and the 78.60% Fibonacci retracement levels, suggesting Fibonacci confluence.
Moreover, the 2nd support at 0.6065 is another critical area, providing substantial support to the price. This level corresponds to an overlap support, the 100% Fibonacci projection, and the 161.80% Fibonacci extension levels, indicating Fibonacci confluence.
On the upside, the 1st resistance at 0.6221 represents a notable area of potential price resistance, while the 2nd resistance at 0.6272 serves as a significant swing high resistance.
DJ30:
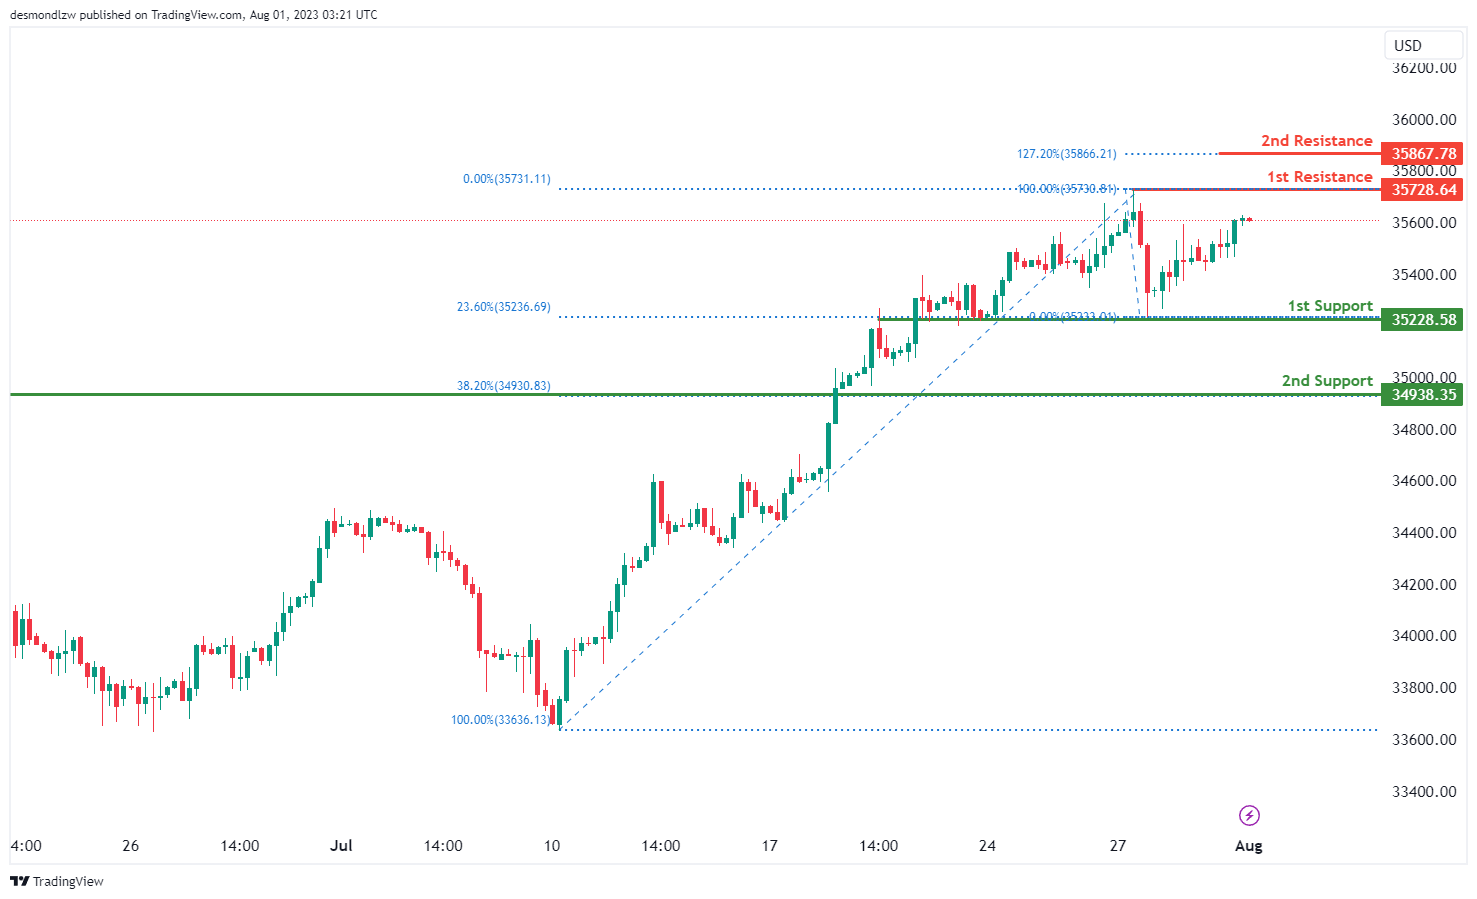
The DJ30 chart indicates a bullish momentum, suggesting a potential bullish continuation towards the 1st resistance level.
For this scenario, the 1st support at 35228.58 is a significant area as it coincides with the 23.60% Fibonacci retracement, serving as an overlap support. Additionally, the 2nd support at 34938.35 acts as a pullback support, corresponding to the 38.20% Fibonacci retracement.
On the upside, the 1st resistance at 35728.64 represents a crucial swing high resistance. Furthermore, the 2nd resistance at 35867.78 is identified as the 127.20% Fibonacci extension, potentially acting as another significant level.
GER30:
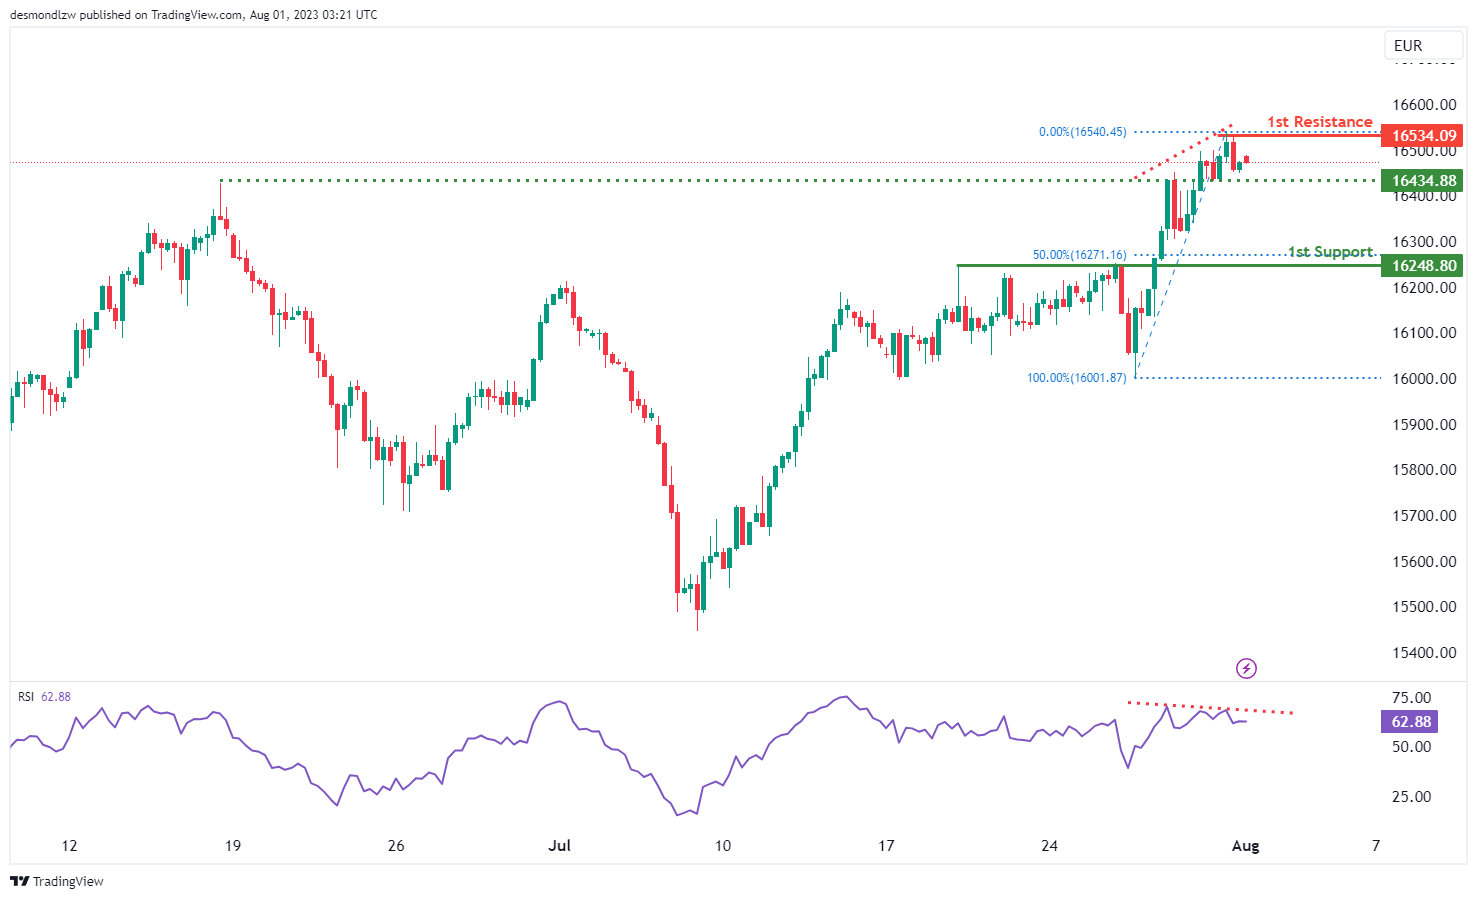
The GER30 chart shows a bearish momentum, with potential factors contributing to this decline not specified in the provided text. However, the text suggests a potential scenario where the price could have a bearish reaction off the 1st resistance and drop towards the 1st support.
For this scenario, the 1st support at 16248.80 is considered a pullback support, aligning with the 50% Fibonacci retracement. Additionally, there is mention of a 2nd support level, but the value is not provided in the text.
On the upside, the 1st resistance at 16534.09 is identified as a significant swing high resistance.
Moreover, the text mentions that the RSI is displaying bearish divergence versus price, indicating a potential reversal might occur soon.
US500
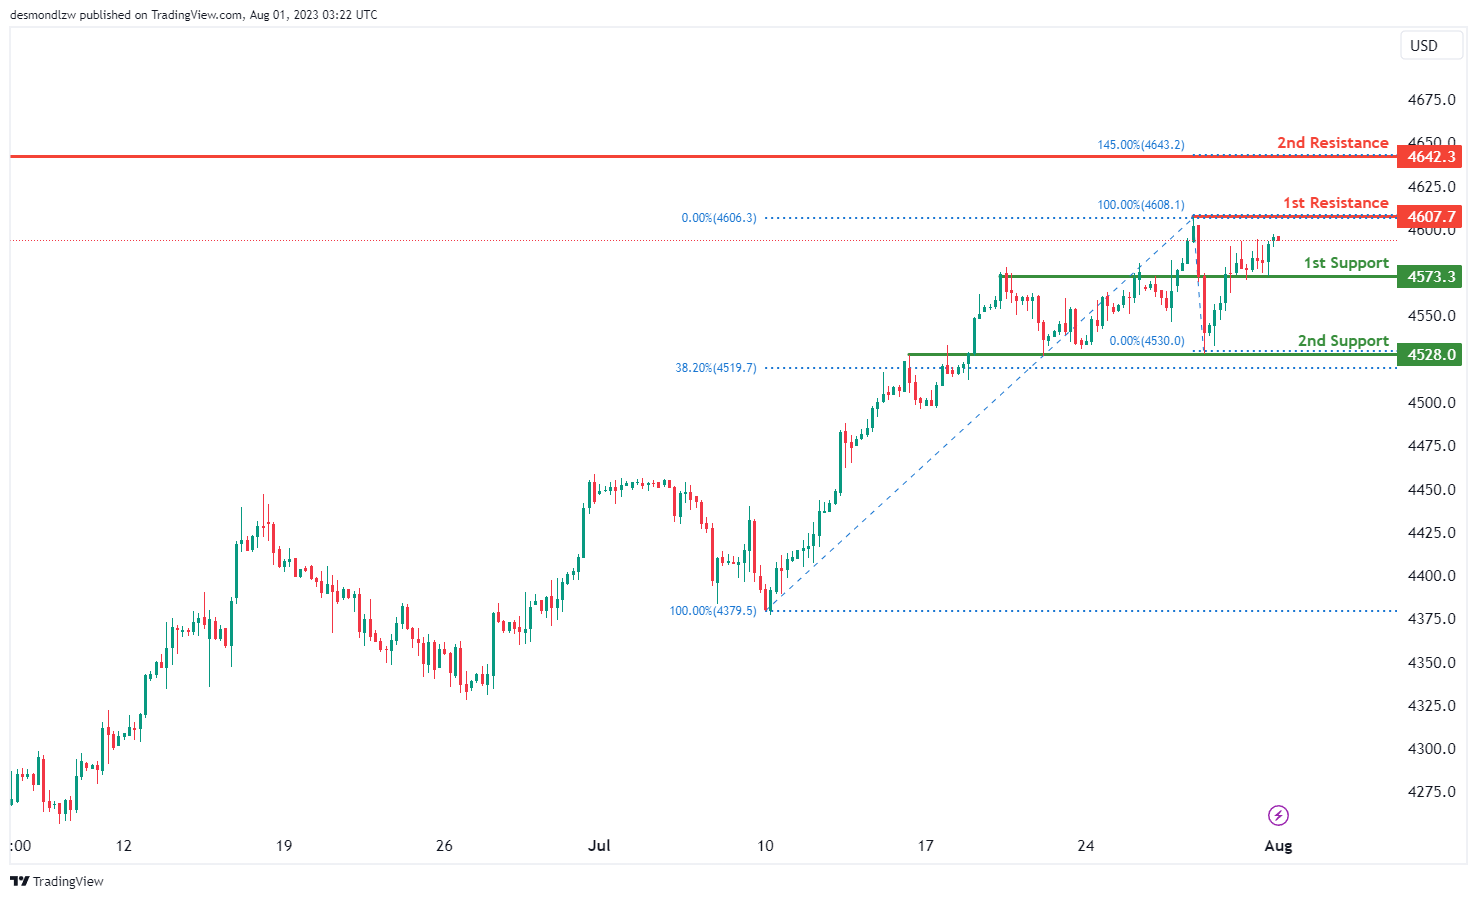
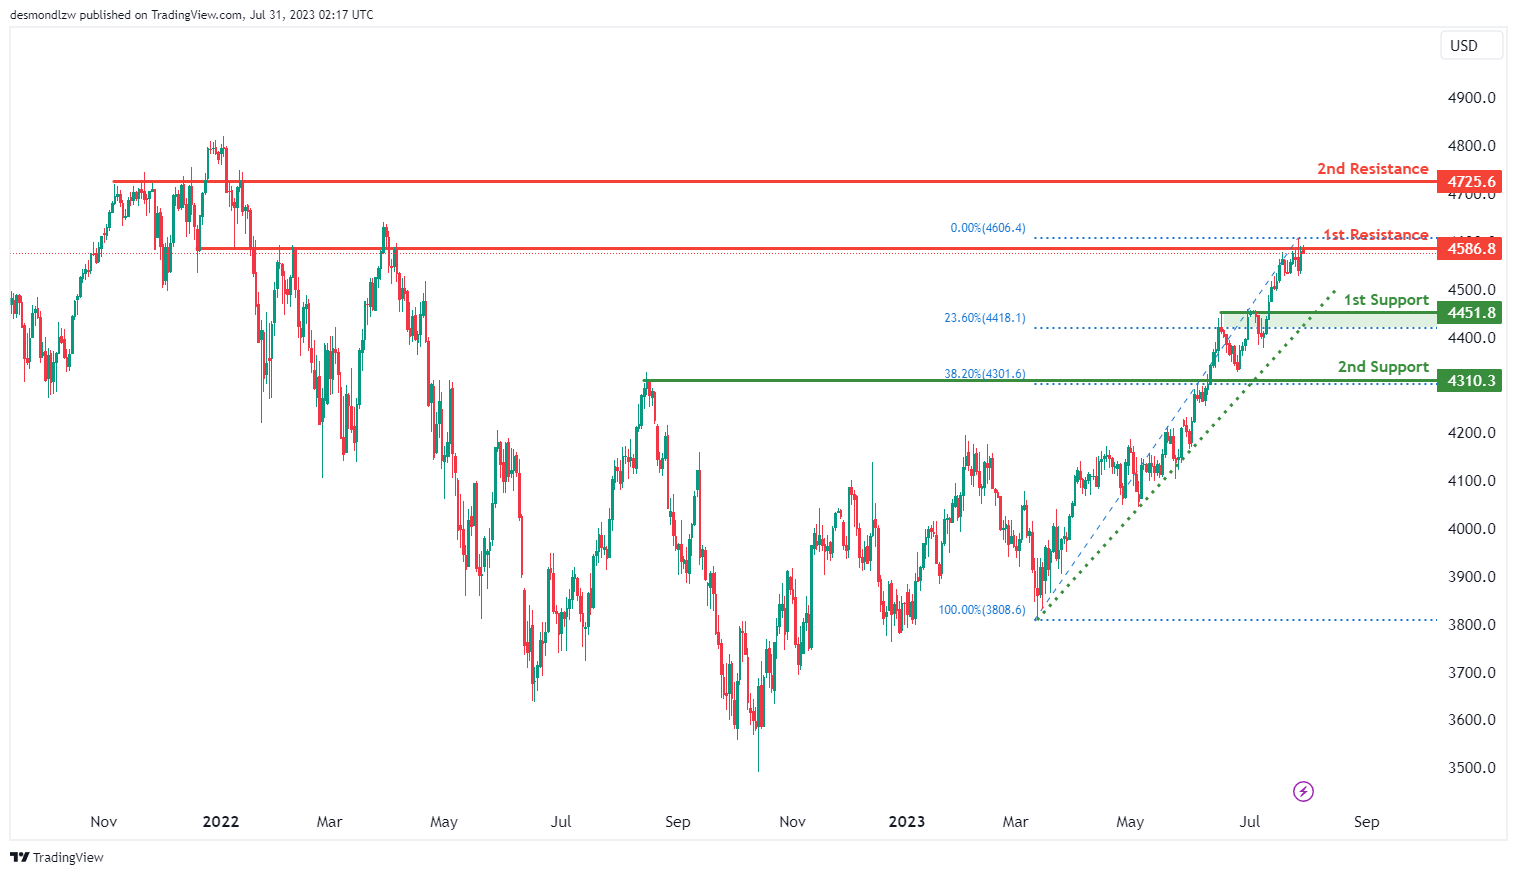
The US500 chart exhibits a bullish momentum, indicating the potential for a bullish break through the 1st resistance level at 4608, which is a significant swing high resistance. Should the break occur, the price could rise towards the 2nd resistance at 4642, which is identified as another swing high resistance and corresponds to the 145.00% level.
For potential downward movements, the chart has 1st and 2nd support levels at 4573 and 4528, respectively. These support levels are recognized as pullback supports, with the 2nd support coinciding with the 38.20% Fibonacci retracement.
The overall bullish momentum suggests a positive sentiment in the market, and traders might be closely monitoring the potential breakout above the 1st resistance level for the price to move towards the 2nd resistance.
BTC/USD:
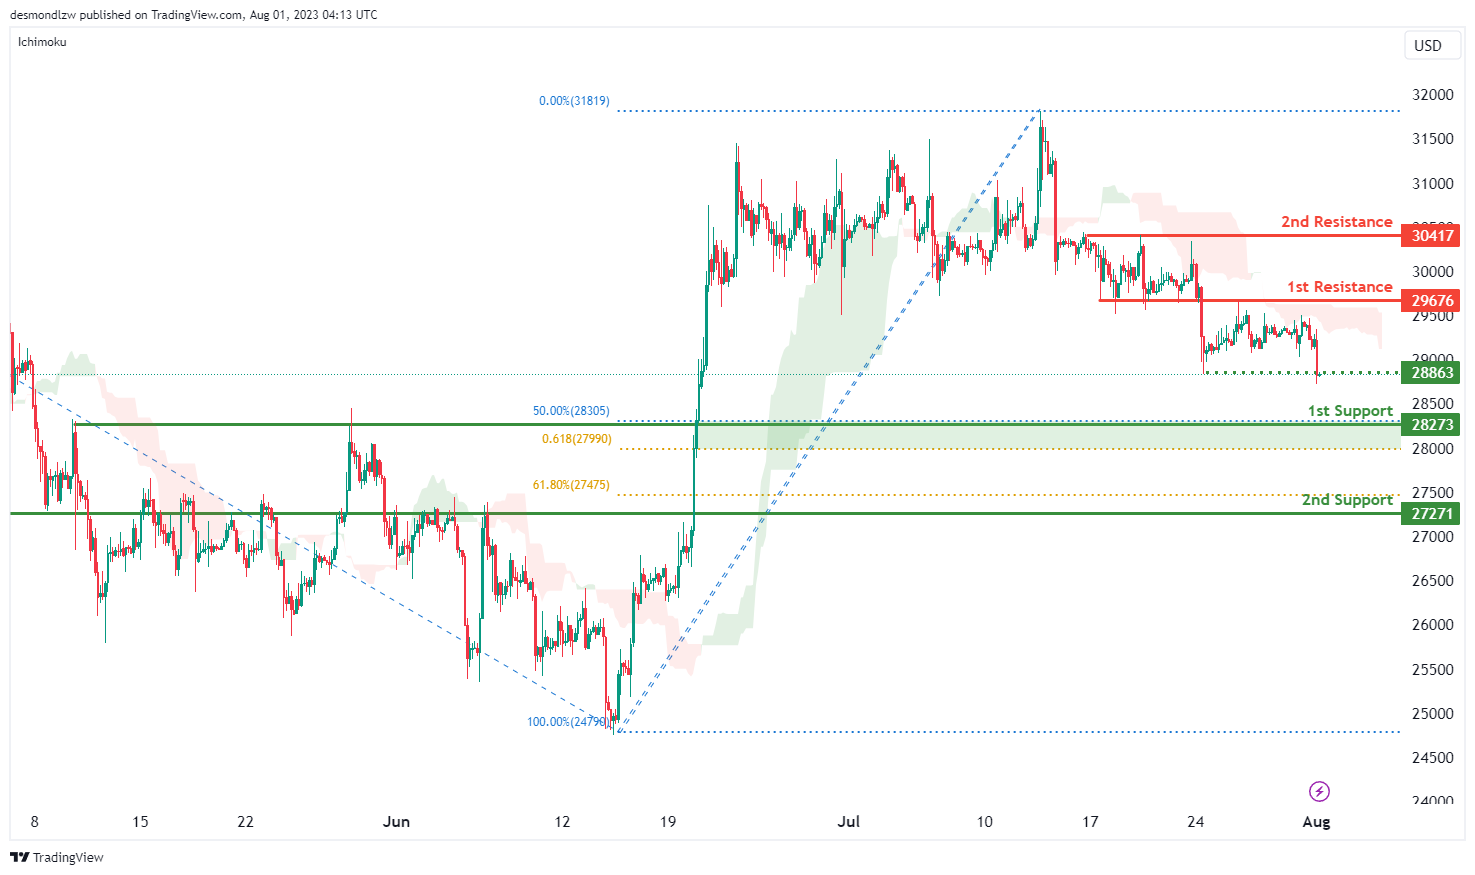
The BTC/USD chart indicates a bearish momentum, as the price is currently below the bearish Ichimoku cloud.
A possible scenario suggests a bearish continuation towards the 1st support level at 28273. This support level is considered significant as it coincides with the 50% Fibonacci retracement and the 61.80% Fibonacci projection, indicating Fibonacci confluence.
Additionally, there is a 2nd support at 27271, which serves as another relevant area, corresponding to the 61.80% Fibonacci retracement.
On the upside, the 1st resistance at 29676 is identified as a pullback resistance. Furthermore, there is a 2nd resistance at 30417, representing a multi-swing high resistance.
ETH/USD:
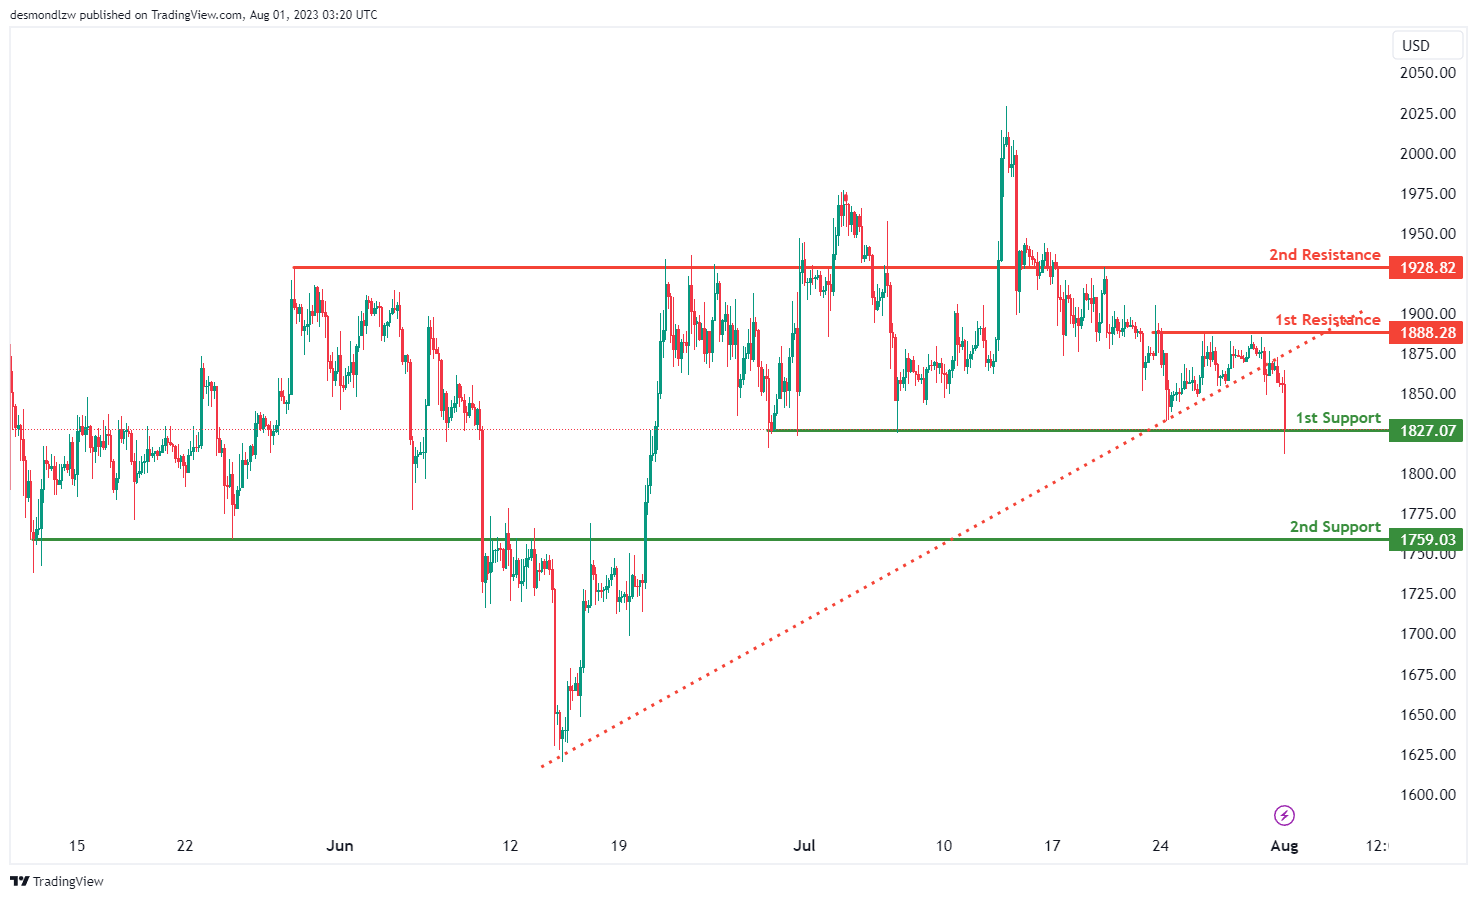
The ETH/USD chart exhibits a bearish momentum, primarily attributed to the break below an ascending support line, triggering a potential bearish move.
A possible scenario indicates a bearish break off the 1st support level at 1827.07, which is a significant multi-swing low support, leading the price towards the 2nd support at 1759.03. This support level is recognized as an overlap support.
On the upside, the 1st resistance at 1888.28 represents a multi-swing high resistance, while the 2nd resistance at 1928.82 is identified as an overlap resistance.
WTI/USD:
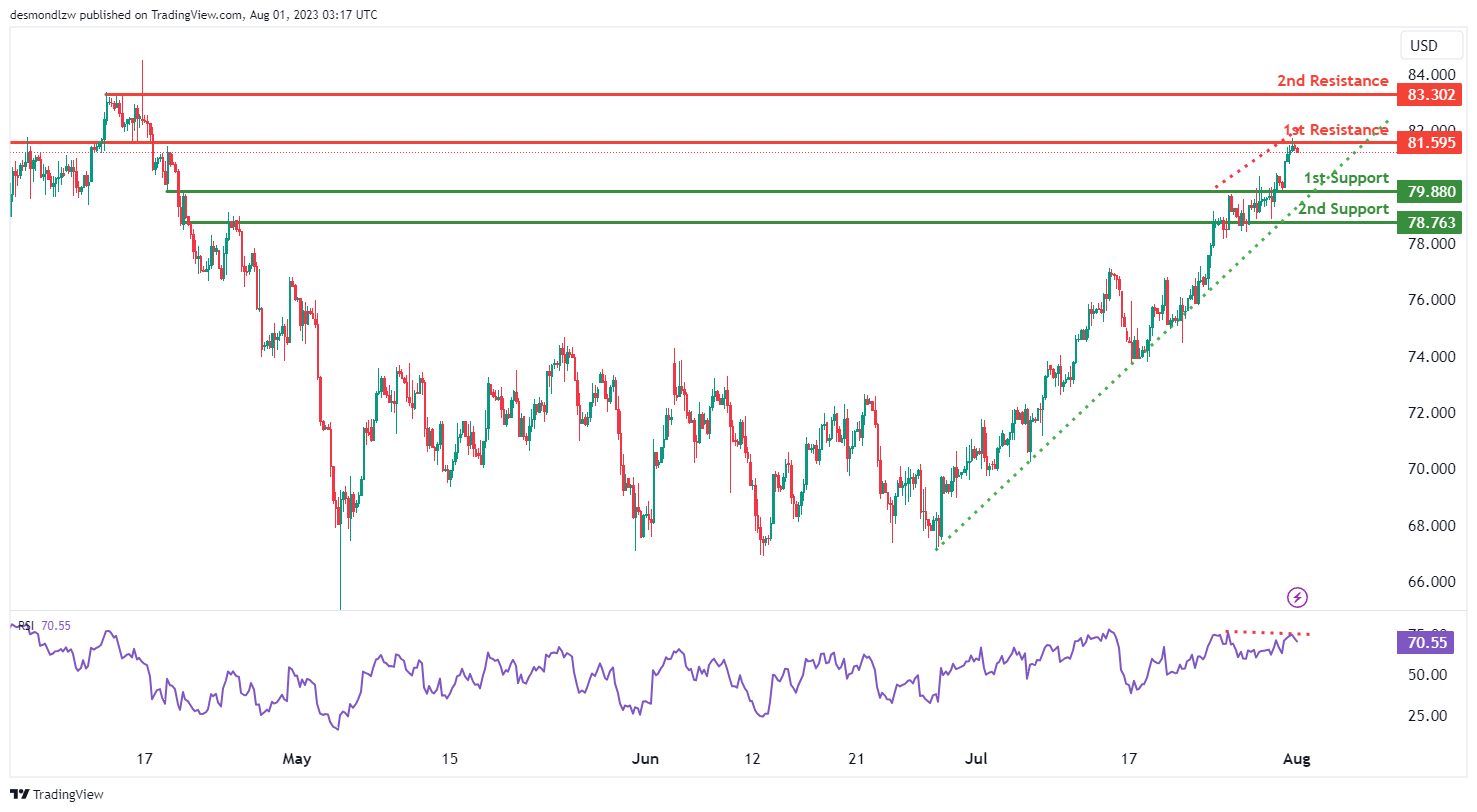
The WTI/USD chart exhibits a bearish momentum, indicating a potential bearish continuation towards the 1st support level at 79.88. This support is considered significant as it represents an overlap support. Additionally, the 2nd support at 78.76 serves as another important area of potential price stabilization, acting as an overlap support.
On the upside, the 1st resistance at 81.59 is recognized as a relevant area of potential price resistance, identified as an overlap resistance. Furthermore, the 2nd resistance at 83.30 represents another critical level of resistance, functioning as an overlap resistance.
It is worth noting that the RSI is displaying bearish divergence compared to the price, suggesting a potential reversal might occur soon.
XAU/USD (GOLD):
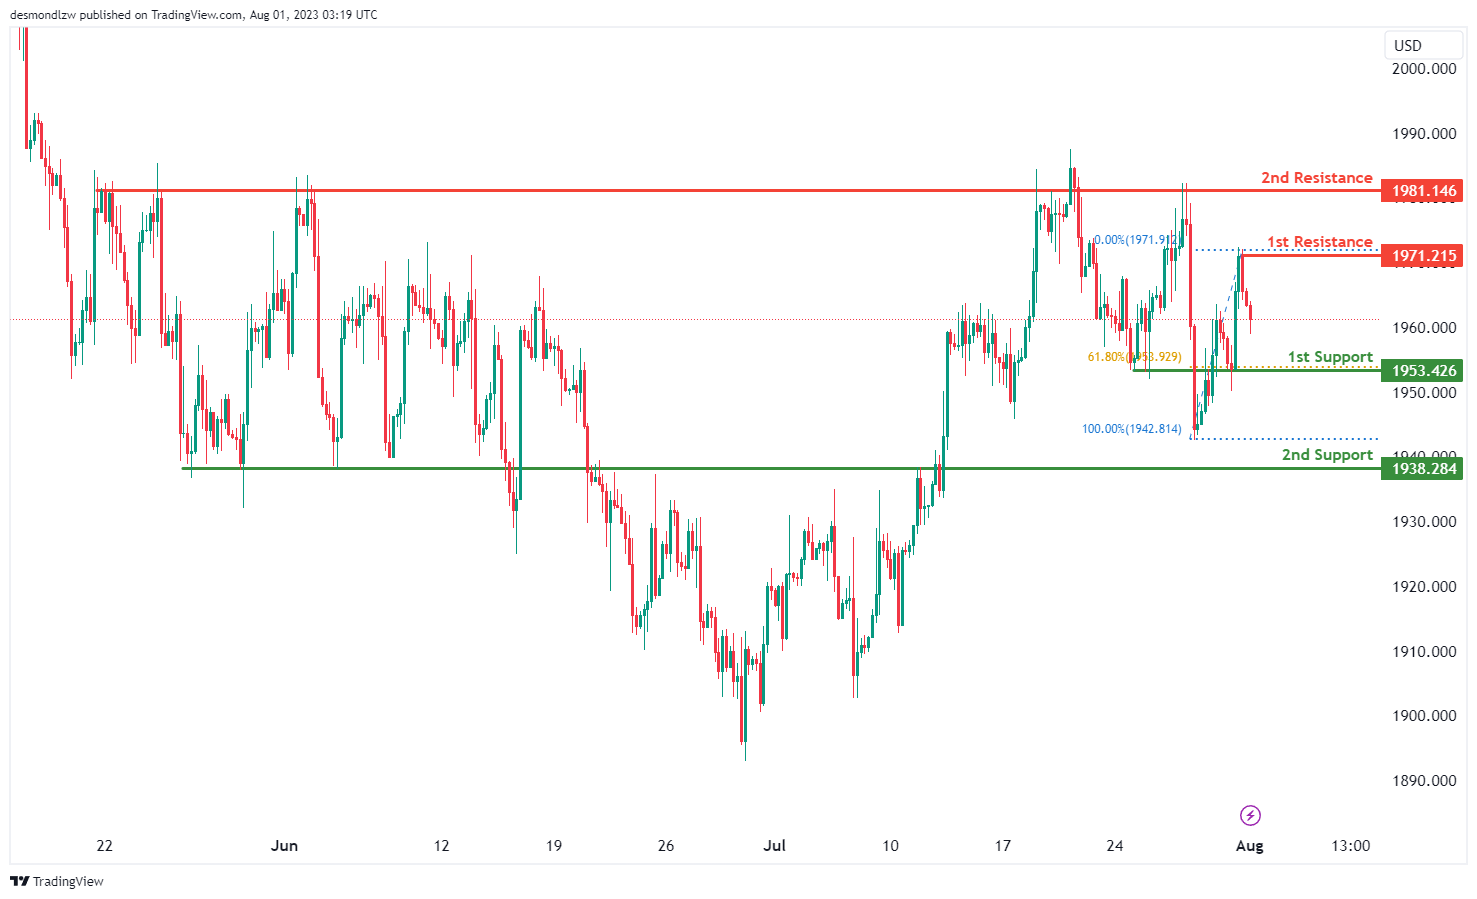
The XAU/USD pair is currently on a bearish trend, suggesting a possible continuation of this trend towards the 1st support level at 1953.42. This level is seen as key due to its function as an overlap support and its association with the 61.80% Fibonacci retracement level.
Should the price drop further, the 2nd support level at 1938.28, acting as a pullback support, may serve as a critical stop for the bearish movement.
On the upside, the 1st resistance level is found at 1971.21, having served as a swing high resistance in the past. If the price manages to ascend beyond this level, the 2nd resistance at 1981.14 could present a significant hurdle, as it has been a multi-swing high resistance previously.
Aussie Slips after RBA But Downside Limited, Dollar Firmer Ahead of ISM Manufacturing
Australian Dollar is trading broadly lower after RBA opted to keep interest rates on hold. However, the currency's losses remain contained was not too much out of expectations. RBA's continued bias towards tightening, albeit arguably less emphatic than before, is currently helping to limit Aussie's downside, keeping it within Monday's trading range, waiting for a potential breakout. The New Zealand Dollar is also trending weaker, closely following its Australian counterpart.
Meanwhile, Japanese Yen is extending its recent downward trajectory, despite 10-year JGB yield hovering around 0.6% mark. Positive investor sentiment in Japan, buoyed by Nikkei's post-BoJ rally, continues to weigh on the Yen. The focus now shifts to which Yen cross might break out of its recent range first.
On the other side of the coin, Dollar is today's strongest performer, trailed by British Pound and Swiss Franc. The greenback's path could be influenced by today's ISM manufacturing index, although the primary market-moving event is likely to be Friday's non-farm payrolls report.
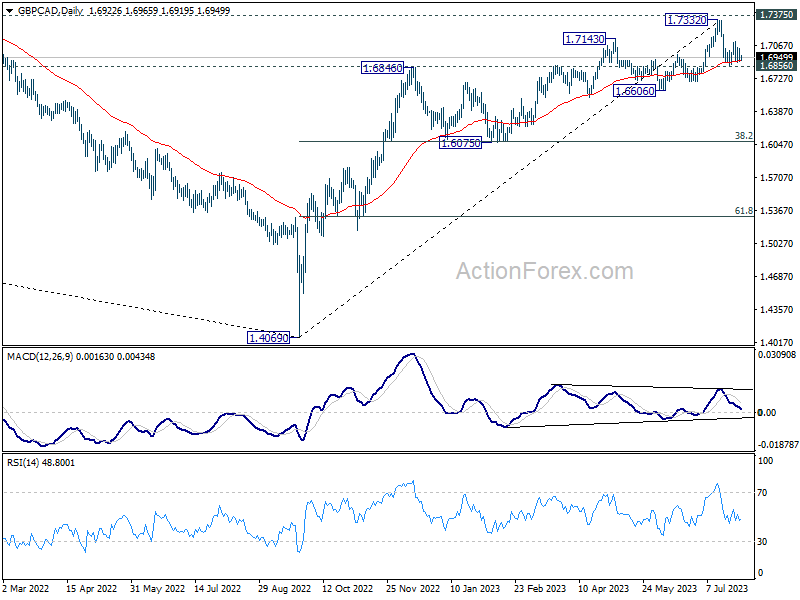
Technically, GBP/CAD now gyrating in tight range just above 55 D EMA (now at 1.6911). Medium term momentum as been diminishing somewhat as seen in D MACD. Risk of a major pull back is increasing considering that it's also in proximity to 1.7375 long term structural resistance. Firm break of 1.6856 could set up a medium term corrective fall through 1.6606 support, with prospect of falling to as low as 1.6075 cluster support (38.2% retracement of 1.4069 to 1.7332 at 1.6086. This week's BoE rate decision and Canada employment data could be the trigger of the start of this down move.
In Asia, at the time of writing, Nikkei is up 0.79%. Hong Kong HSI is down -0.35%. China Shanghai SSE is down -0.11%. Singapore Strait Times is up 0.00%. Japan 10-year JGB yield is down -0.0010 at 0.602. Overnight, DOW rose 0.28%. S&P 500 rose 0.15%. NASDAQ rose 0.21%. 10-year yield dropped -0.010 to 3.959.
RBA on hold, keeps tightening bias
RBA kept its cash rate target at 4.10%, retaining a hawkish bias. The bank noted, "Some further tightening of monetary policy may be required to ensure that inflation returns to target in a reasonable timeframe." However, RBA underscored that any future decision will be data-dependent and based on an "evolving assessment of risks."
Explaining the decision to hold rates, RBA stated that "higher interest rates are working to establish a more sustainable balance between supply and demand in the economy and will continue to do so." Amidst "uncertainty" surrounding the economic outlook, maintaining the current rate provides "further time" to assess the impact of previous hikes.
While the central bank anticipates recent data to be "consistent" with an inflation return to its 2-3% target over the forecast horizon, it warned of "significant uncertainties".
RBA expressed concerns about the surprising persistence of services price inflation overseas, which could potentially reflect in Australia. Additionally, it mentioned uncertainties about "how firms' pricing decisions and wages will respond to the slowing in the economy at a time when the labour market remains tight." Also, it stated that "the outlook for household consumption is also an ongoing source of uncertainty."
Japan PMI manufacturing finalized at 49.6, but business optimism elevated
Japan PMI Manufacturing was finalized at 49.6 in July, down from June's 49.8. That also marked the second month of concurrent decline in output and new orders. Usamah Bhatti at S&P Global Market Intelligence highlighted the significant role of "quicker deterioration in new order inflows" and also "sustained" decline in production.
Despite these struggles, inflationary pressures showed signs of abating as the rate of input cost inflation was the slowest since February 2021. However, selling price inflation was "unchanged" and "sharp overall" as Japanese manufacturers passed on a portion of higher cost burdens to clients.
The industry displayed robust optimism about the future, with the second-highest positive sentiment recorded in the last 18 months, driven by expectations of a boost in domestic and international demand owing to new product launches and the ongoing mitigation of COVID-19 and inflation-related influences.
China Caixin PMI manufacturing down to 49.2, first contraction in three months
China's Caixin PMI Manufacturing index slipped from 50.5 to 49.2 in July, marking the first contraction in three months and falling below the expected 50.3. According to Caixin, there was a marginal contraction in output, and total sales plummeted due to a more pronounced decline in new export orders. Additionally, both input costs and output charges saw a decrease.
Senior Economist at Caixin Insight Group, Wang Zhe, highlighted the deteriorating situation, stating, "Overall, manufacturing conditions contracted in July, with supply, demand, exports, and employment all deteriorating. Prices continued to decline, inventories rose without companies adjusting them, and logistics times increased." He noted that manufacturers' optimism remained, but it had weakened.
Wang further explained, "China's economic recovery in the first quarter exceeded expectations, but the momentum weakened in the second. Although the data for industrial production and investment in June showed some signs of recovery, macroeconomic growth remained sluggish, and considerable downward pressure on the economy persisted."
Looking ahead
Eurozone PMI manufacturing final and unemployment rate, Germany unemployment, UK PMI manufacturing final will be released in European session. Later in the day, US ISM manufacturing will be the highlight, construction spending will also be released.
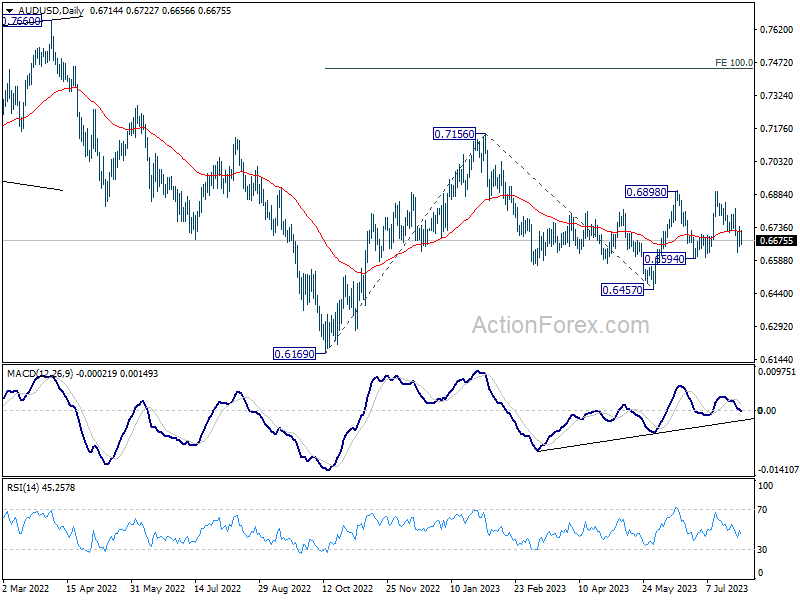
AUD/USD Daily Report
Daily Pivots: (S1) 0.6663; (P) 0.6701; (R1) 0.6755; More...
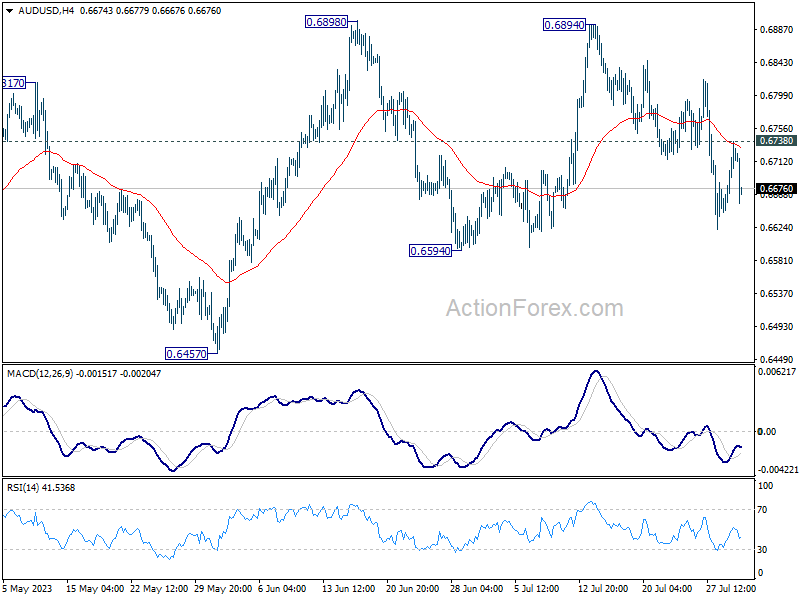
AUD/USD's recovery was rejected by 55 4H EMA and retreated sharply since then. Intraday bias remains neutral first. While deeper fall cannot be ruled out, strong support should be seen from 0.6594 to complete to corrective pattern from 0.6898. On the upside, break of 0.6738 resistance will turn bias back to the upside for retesting 0.6894/8 resistance zone. However, sustained break of 0.6594 will dampen this view and bring deeper fall towards 0.6457.
In the bigger picture, outlook is mixed for now as AUD/USD failed to sustain above both 55 D EMA (now at 0.6720) and 55 W EMA (now at 0.6784). On the upside, break of 0.65898 resistance will solidify the case that down trend from 0.8006 (2021 high) has already completed, and target 0.7156 resistance for confirmation. However, break of 0.6457 will likely resume the down trend through 0.6169 (2022 low).
Economic Indicators Update
| GMT | Ccy | Events | Actual | Forecast | Previous | Revised |
|---|---|---|---|---|---|---|
| 22:45 | NZD | Building Permits M/M Jun | 3.50% | -2.20% | -2.30% | |
| 23:01 | GBP | BRC Shop Price Index Y/Y Jun | 7.60% | 8.40% | ||
| 23:30 | JPY | Unemployment Rate Jun | 2.50% | 2.60% | 2.60% | |
| 00:30 | JPY | Manufacturing PMI Jul F | 49.6 | 49.4 | 49.4 | |
| 01:30 | AUD | Building Permits M/M Jun | -7.70% | -7.90% | 20.60% | |
| 01:45 | CNY | Caixin Manufacturing PMI Jul | 49.2 | 50.3 | 50.5 | |
| 04:30 | AUD | RBA Interest Rate Decision | 4.10% | 4.35% | 4.10% | |
| 07:45 | EUR | Italy Manufacturing PMI Jul | 43.9 | 43.8 | ||
| 07:50 | EUR | France Manufacturing PMI Jul F | 44.5 | 44.5 | ||
| 07:55 | EUR | Germany Unemployment Change Jun | 15K | 28K | ||
| 07:55 | EUR | Germany Unemployment Rate Jun | 5.70% | 5.70% | ||
| 07:55 | EUR | Germany Manufacturing PMI Jul F | 38.8 | 38.8 | ||
| 08:00 | EUR | Italy Unemployment Rate Jun | 7.70% | 7.60% | ||
| 08:00 | EUR | Eurozone Manufacturing PMI Jul F | 42.7 | 42.7 | ||
| 08:30 | GBP | Manufacturing PMI Jul F | 45 | 45 | ||
| 09:00 | EUR | Eurozone Unemployment Rate Jun | 6.50% | 6.50% | ||
| 13:30 | CAD | Manufacturing PMI Jul | 48.9 | 48.8 | ||
| 13:45 | USD | Manufacturing PMI Jul F | 49 | 49 | ||
| 14:00 | USD | ISM Manufacturing PMI Jul | 46.5 | 46 | ||
| 14:00 | USD | ISM Manufacturing Employment Index Jul | 42.3 | 48.1 | ||
| 14:00 | USD | ISM Manufacturing Prices Paid Jul | 41.8 | |||
| 14:00 | USD | Construction Spending M/M Jun | 0.60% | 0.90% |
AUD/USD Daily Report
Daily Pivots: (S1) 0.6663; (P) 0.6701; (R1) 0.6755; More...
AUD/USD's recovery was rejected by 55 4H EMA and retreated sharply since then. Intraday bias remains neutral first. While deeper fall cannot be ruled out, strong support should be seen from 0.6594 to complete to corrective pattern from 0.6898. On the upside, break of 0.6738 resistance will turn bias back to the upside for retesting 0.6894/8 resistance zone. However, sustained break of 0.6594 will dampen this view and bring deeper fall towards 0.6457.
In the bigger picture, outlook is mixed for now as AUD/USD failed to sustain above both 55 D EMA (now at 0.6720) and 55 W EMA (now at 0.6784). On the upside, break of 0.65898 resistance will solidify the case that down trend from 0.8006 (2021 high) has already completed, and target 0.7156 resistance for confirmation. However, break of 0.6457 will likely resume the down trend through 0.6169 (2022 low).
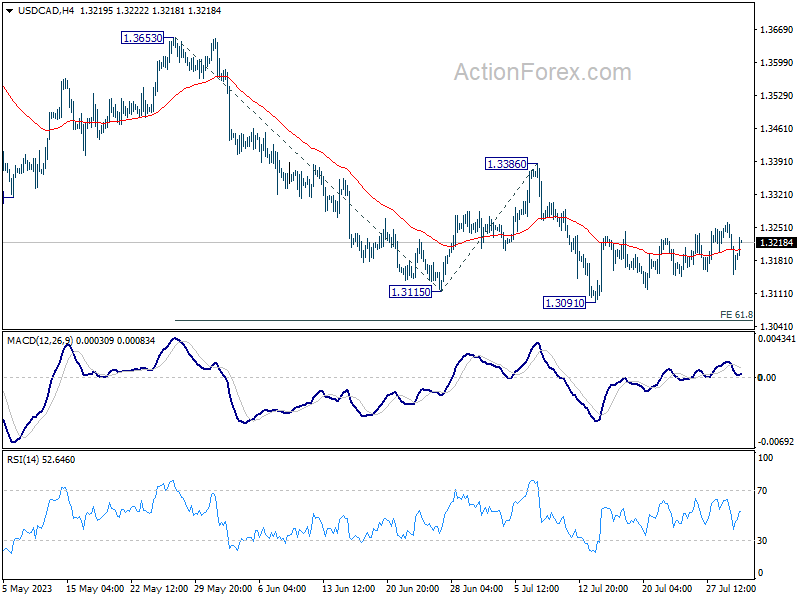
USD/CAD Daily Outlook
Daily Pivots: (S1) 1.3139; (P) 1.3201; (R1) 1.3250; More....
USD/CAD is staying in sideway consolidation from 1.3091 and intraday bias remains neutral. Outlook stays bearish for further decline with 1.3385 resistance intact. On the downside, break of 1.3091 will resume larger fall and target 61.8% projection of 1.3653 to 1.3115 from 1.3386 at 1.3054. However, firm break of 1.3386 will indicate near term reversal and turn outlook bullish.
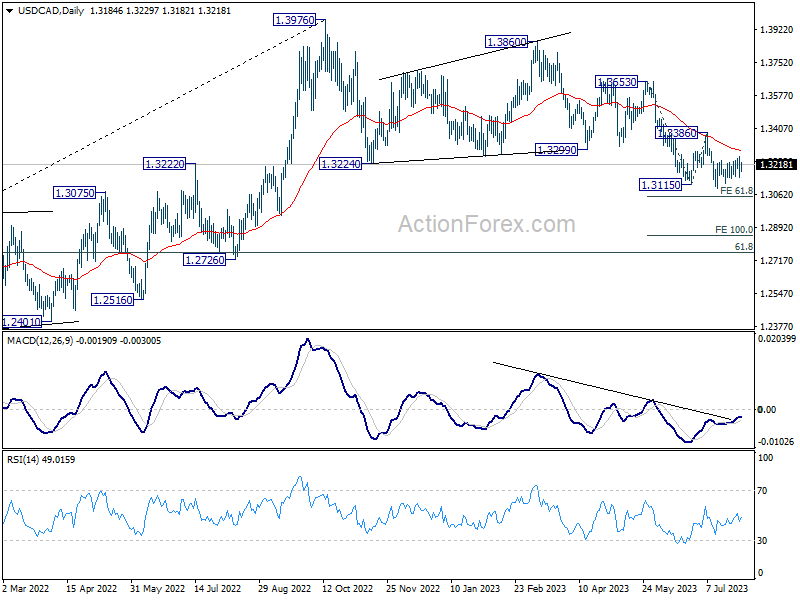
In the bigger picture, price actions from 1.3976 are viewed as a correction to up trend from 1.2005 (2021 low) only. But even so, deeper decline is expected as long as 1.3386 resistance holds. Further fall could be seen to 61.8% retracement of 1.2005 to 1.3976 at 1.2758. Meanwhile, break of 1.3386 will be a sign that the correction has completed and bring stronger rally back to retest 1.3976.
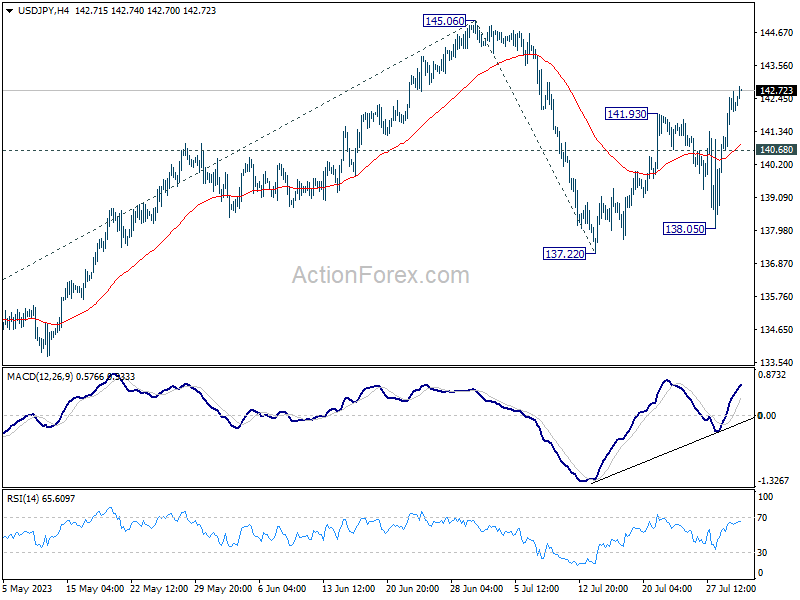
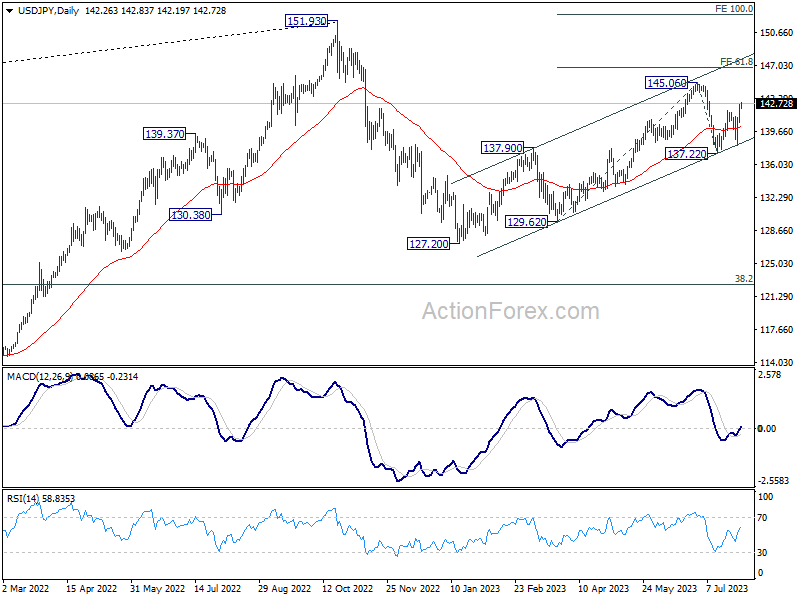
USD/JPY Daily Outlook
Daily Pivots: (S1) 141.09; (P) 141.88; (R1) 143.07; More...
Intraday bias in USD/JPY stays on the upside at this point. Further rally would be seen to retest 145.60 resistance first. Firm break there will resume whole rally from 172.20. Next target is 61.8% projection of 129.62 to 145.06 from 137.22 at 146.76. On the downside, below 140.68 minor support will mix up the outlook and turn intraday bias neutral first.
In the bigger picture, overall price actions from 151.93 (2022 high) are views as a corrective pattern. Rise from 127.20 is seen as the second leg of the pattern and could still be in progress. But even in case of extended rise, strong resistance should be seen from 151.93 to limit upside. Meanwhile, break of 137.22 support should confirm the start of the third leg to 127.20 (2023 low) and below.
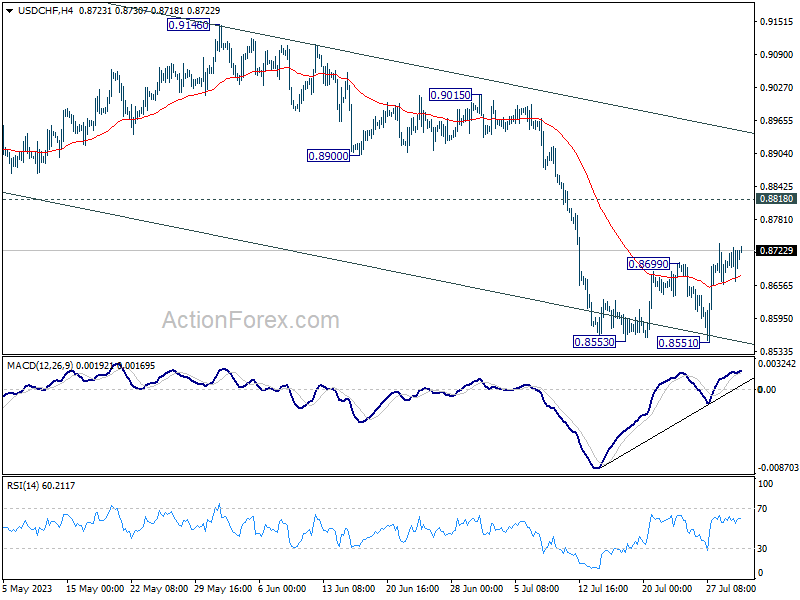
USD/CHF Daily Outlook
Daily Pivots: (S1) 0.8679; (P) 0.8705; (R1) 0.8743; More....
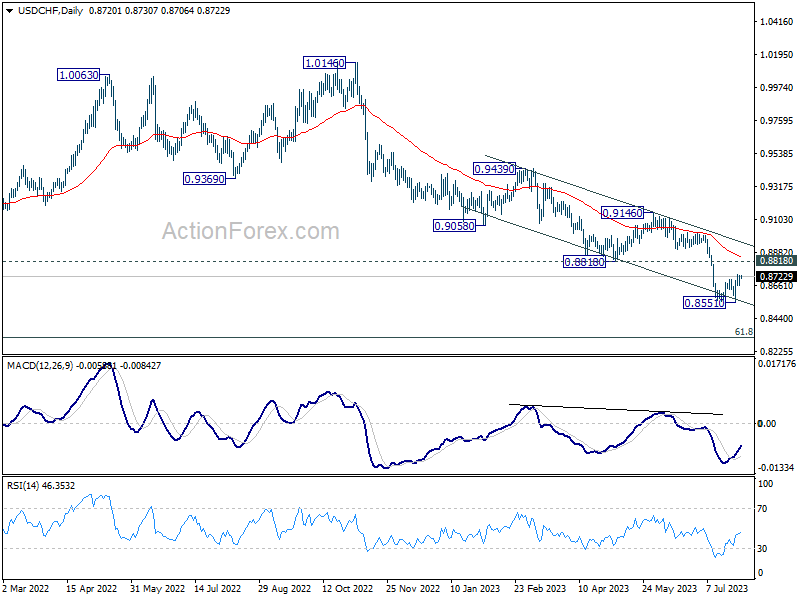
Intraday bias in USD/CHF stays mildly on the upside as rebound from 0.8551 would extend higher. But strong resistance could be seen from 0.8818 support turned resistance to complete the recovery and bring down trend resumption. On the downside, firm break of 0.8551 will resume larger down trend from 1.0146, targeting 0.8317 fibonacci level.
In the bigger picture, down trend from 1.0146 is seen as in progress as long as 0.8188 support turned resistance holds. Next target is 61.8% retracement of 0.7065 (2011 low) to 1.0342 (2016 high) at 0.8317. However, sustained break of 0.8818 will be the first sign of medium term bottoming, and turn focus back to 0.9146 resistance for confirmation.
GBP/USD Daily Outlook
Daily Pivots: (S1) 1.2818; (P) 1.2845; (R1) 1.2863; More...
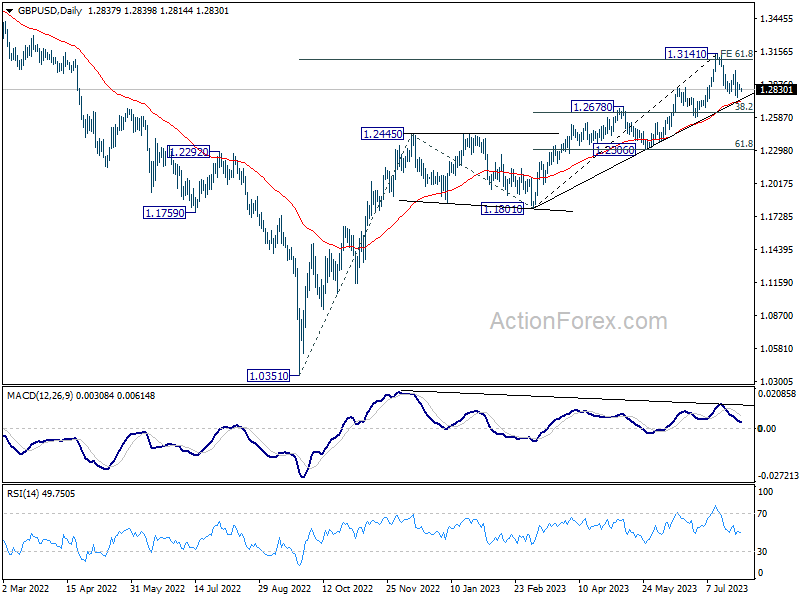
GBP/USD is staying in consolidation above 1.2761 and intraday bias remains neutral at this point. Further decline is in favor as long as 1.2994 resistance holds. Break of 1.2761 will 38.2% retracement of 1.1801 to 1.3141 at 1.2629. Nevertheless, on the upside, break of 1.2994 resistance will argue that the pull back has completed, and bring retest of 1.3141 high.
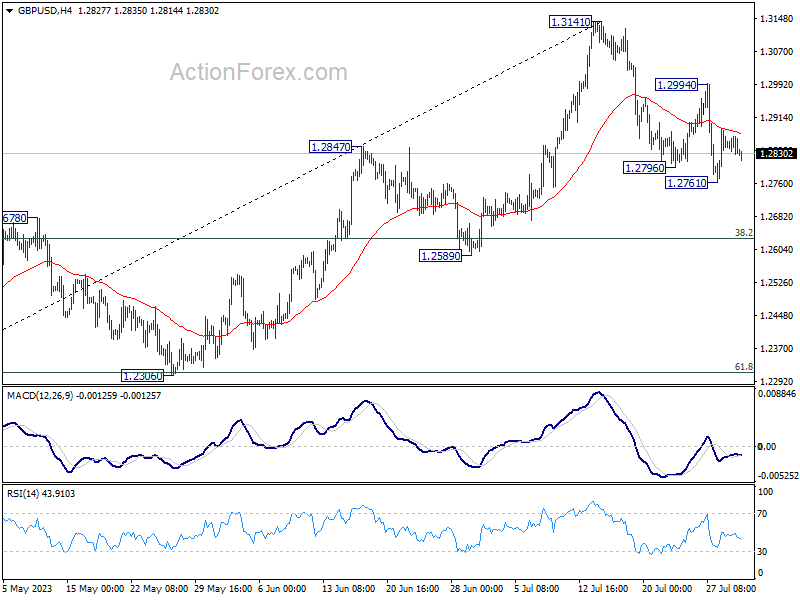
In the bigger picture, as long as 1.2678 resistance turned support holds, rise from 1.0351 (2022 low) is expected to continue. Next target is 100% projection of 1.0351 to 1.2445 from 1.1801 at 1.3895. However, sustained break of 1.2678 will argue that it's at least correcting this rally, with risk of bearish reversal.