Sample Category Title
AUD/USD Rebounds on Stronger Inflation Release
- Australian MI Inflation gauge jumps 0.8%
- AUD/USD climbs 0.80%
- RBA expected to pause rates on Tuesday
The Australian dollar has started the week with strong gains. In the European session, AUD/USD is trading at 0.6700, up 0.80%. The Aussie has rebounded after falling 1.25% last week.
RBA expected to pause rates
The Reserve Bank of Australia meets on Tuesday and is expected to maintain the cash rate at 4.10%. The past two rate meetings have been close calls and that could be the case at Tuesday’s meeting. The money markets, however, are squarely leaning towards a pause, with only a 14% chance of a hike, according to the ASX RBA Rate Tracker.
Investors are basing expectations for a second straight pause on lower inflation and weaker retail sales. Both headline and core CPI eased in the second quarter, as inflation appears to be heading in the right direction. Retail sales surprised on the downside with a -0.8% reading in June, erasing the 0.8% gain in May and missing the consensus estimate of 0.0%.
The RBA could surprise the markets with a hike, as inflation has fallen to 6% but is double the RBA’s upper band of its 1%-3% range. As well, the labour market remains tight and the central bank is concerned that could lead to higher wages which means an increase in inflation. Tuesday’s meeting will be the second to last for Governor Lowe, who may want to deliver another hike or two before his watch ends, in a bid to push inflation closer to the RBA’s target. The RBA will release updated economic forecasts at the meeting, and investors will be especially interested in the inflation projections.
The Melbourne Institute Inflation Gauge jumped 0.8% in July, rebounding from 0.1% in June and beating the consensus estimate of 0.5%. The upswing was somewhat surprising given last week’s inflation report which showed a significant slowdown in inflation. The Australian dollar has moved sharply higher following the release.
AUD/USD Technical
- AUD/USD is testing support at 0.6767. Below, there is support at 0.6687
- There is resistance at 0.6811 and 0.6891
Bitcoin Avoids Sharp Moves. Unlikely for Long
Market picture
Crypto market capitalisation fell by 0.5% over the week, gradually recovering from last Monday’s dip. The Crypto Market Sentiment Index fell 5 points to 50, firmly in the middle of the scale.
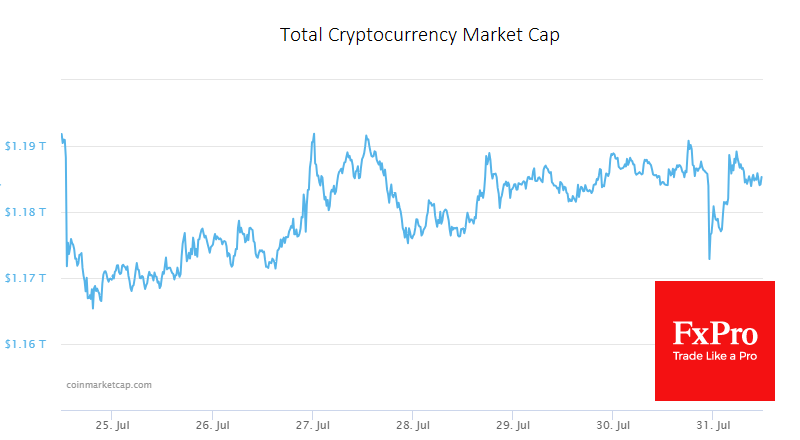
For the week, bitcoin lost 1.2%, Ethereum lost 0.2%, and the top altcoins ranged from -5.7% (Polygon) to +10% (Dogecoin).
Bitcoin continues to move strictly to the right, with decreasing intraday volatility and passively closing slightly below its 50-day moving average, which is pointing up. In theory, this is a signal of a medium-term trend change. In practice, however, it may simply be market noise.
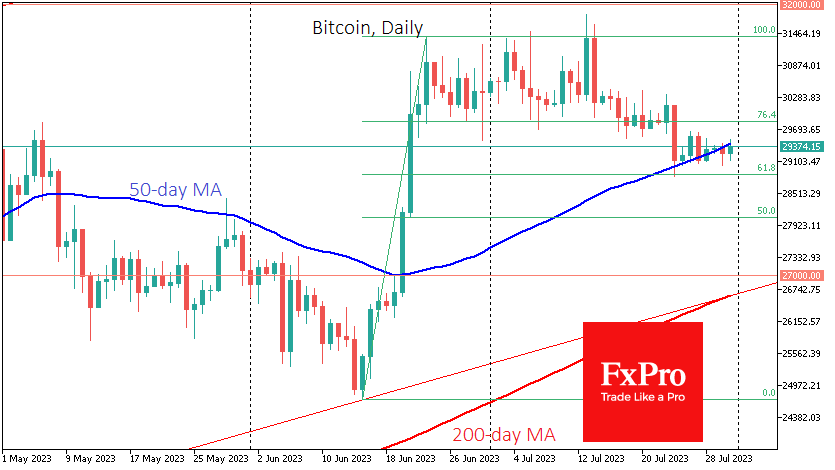
In such conditions, waiting for a significant impulse in any direction makes sense, assuming further movement in the same direction. In numerical terms, a return above $30.1K opens the way to $31.4K with a long-term target of $35.5K. A break below $29K would drop the main scenario to the near-term target of $28K and the long-term target of $27K.
News background
Well-known trader and financial industry veteran Peter Brandt believes Bitcoin will eventually become a leading investment asset. According to him, US regulators are sure to approve the launch of spot bitcoin ETFs, but this could put pressure on BTC.
Gary Gensler, head of the US SEC, said the crypto market is “rife with scammers and peddlers”. Investors starting in crypto assets should be warned that no protections exist.
The SEC has adopted new rules requiring cryptocurrency companies to disclose significant cybersecurity incidents. According to the document, companies will have four days to provide the agency with “significant” hacks details.
Despite the drop in trading volumes in the crypto market, the volume of Bitcoin and Ethereum futures transactions on the Chicago Mercantile Exchange (CME) reached record highs in January 2022.
According to CME research, tech-heavy Nasdaq 100 index fluctuations tend to affect Ethereum more than Bitcoin.
Eurozone GDP grew 0.3% qoq in Q2, EU flat
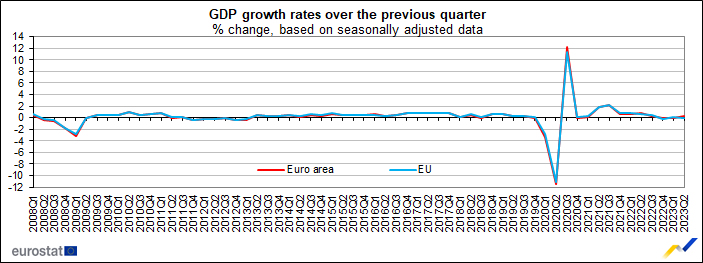
Eurozone GDP grew 0.3% qoq in Q2, above expectation of 0.2% qoq. EU GDP was flat at 0.0% qoq.
Among the Member States for which data are available, Ireland (+3.3%) recorded the highest increase compared to the previous quarter, followed by Lithuania (+2.8%). Declines were recorded in Sweden (-1.5%), in Latvia (-0.6%), in Austria (-0.4%) and in Italy (-0.3%).
The growth rates compared to the same quarter of the previous year were positive for seven countries, with the highest values observed for Ireland (+2.8%), Portugal (+2.3%) and Spain (+1.8%). The highest declines were recorded for Sweden (-2.4%), Czechia (-0.6%) and Latvia (-0.5%).
Eurozone CPI slowed to 5.3.% in Jul, core unchanged at 5.5%
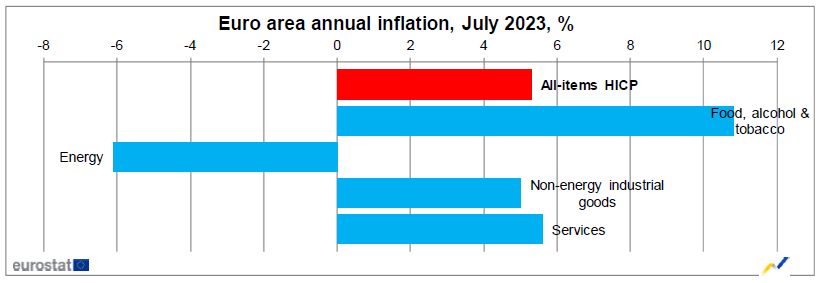
Eurozone CPI slowed from 5.5% yoy to 5.3% yoy in July, matched expectations. CPI core (excluding energy, food, alcohol & tobacco) was unchanged at 5.5% yoy, above expectation of 5.4% yoy.
Looking at the main components, food, alcohol & tobacco is expected to have the highest annual rate in July (10.8%, compared with 11.6% in June), followed by services (5.6%, compared with 5.4% in June), non-energy industrial goods (5.0%, compared with 5.5% in June) and energy (-6.1%, compared with -5.6% in June).
USD/JPY Daily Outlook
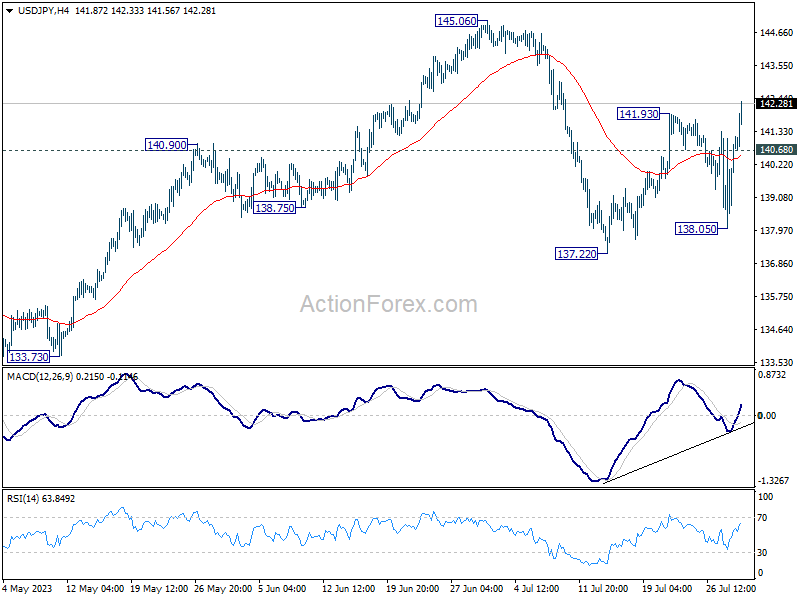
Daily Pivots: (S1) 139.10; (P) 140.14; (R1) 142.21; More...
Break of 141.93 resistance confirms resumption of rebound from 137.22 in USD/JPY. Intraday bias is back on the upside for retesting 145.06 first. Firm break there will resume whole rise from 172.20. On the downside, below 140.68 minor support will turn intraday bias neutral first.
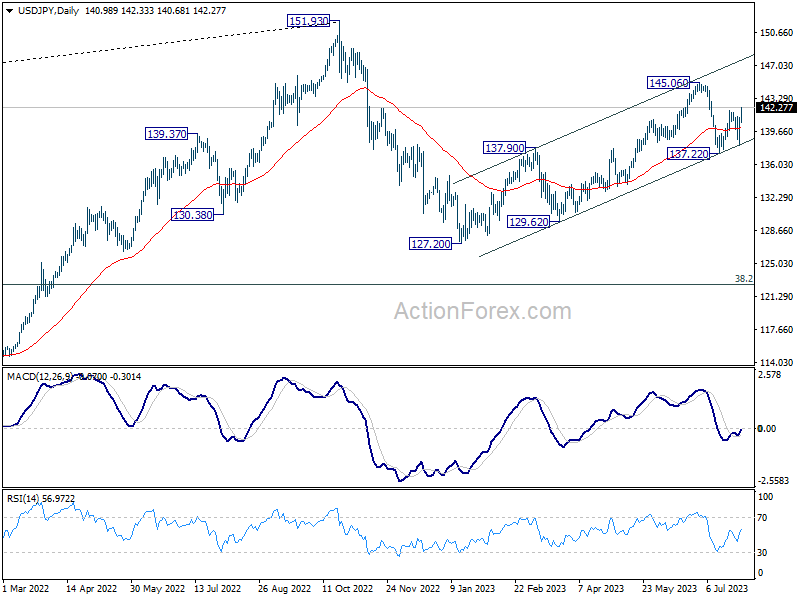
In the bigger picture, overall price actions from 151.93 (2022 high) are views as a corrective pattern. Rise from 127.20 is seen as the second leg of the pattern and could still be in progress. But even in case of extended rise, strong resistance should be seen from 151.93 to limit upside. Meanwhile, break of 137.22 support should confirm the start of the third leg to 127.20 (2023 low) and below.
USD/CHF Daily Outlook
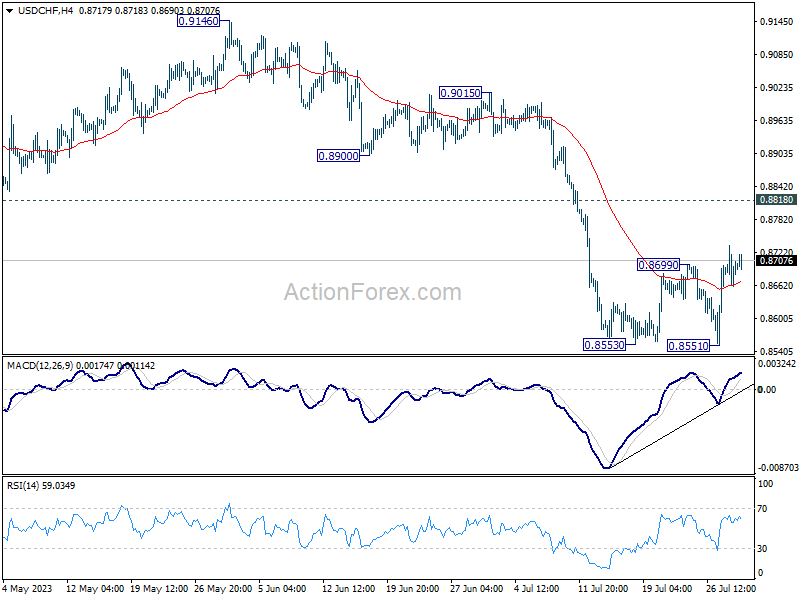
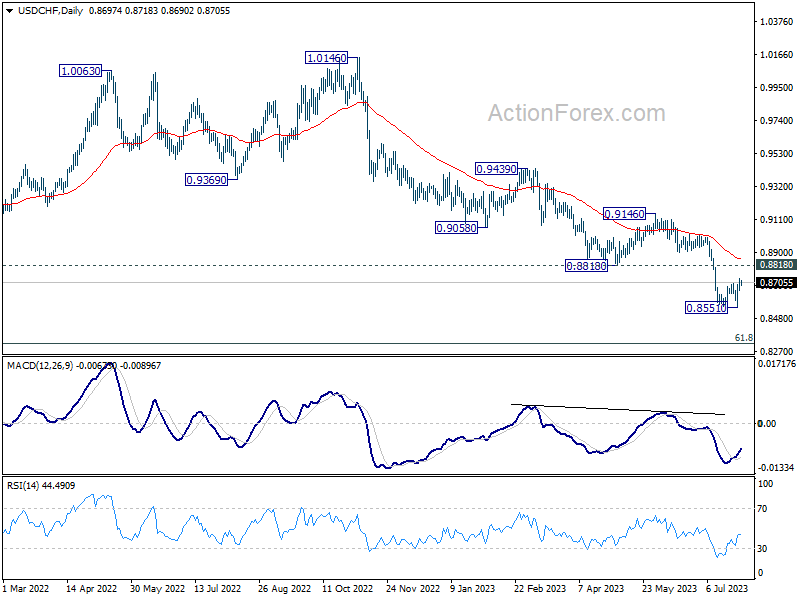
Daily Pivots: (S1) 0.8665; (P) 0.8701; (R1) 0.8740; More....
Intraday bias in USD/CHF stays mildly on the upside at this point. Rebound from 0.8851 would extend higher towards 0.8818 support turned resistance. Strong resistance could be seen there to complete the recovery and bring down trend resumption. On the downside, firm break of 0.8551 will resume larger down trend from 1.0146, targeting 0.8317 fibonacci level.
In the bigger picture, down trend from 1.0146 is seen as in progress as long as 0.8188 support turned resistance holds. Next target is 61.8% retracement of 0.7065 (2011 low) to 1.0342 (2016 high) at 0.8317. However, sustained break of 0.8818 will be the first sign of medium term bottoming, and turn focus back to 0.9146 resistance for confirmation.
GBP/USD Daily Outlook
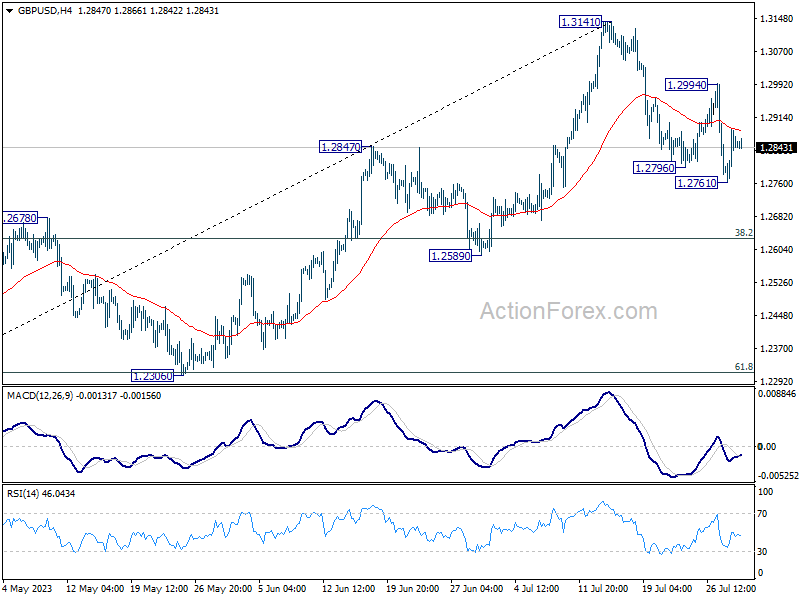
Daily Pivots: (S1) 1.2780; (P) 1.2834; (R1) 1.2904; More...
Intraday bias in GBP/USD remains neutral for the moment. Further decline is in favor as long as 1.2994 resistance holds. Break of 1.2761 will target 55 D EMA (now at 1.2720) and below. Nevertheless, on the upside, break of 1.2994 resistance will argue that the pull back has completed, and bring retest of 1.3141 high.
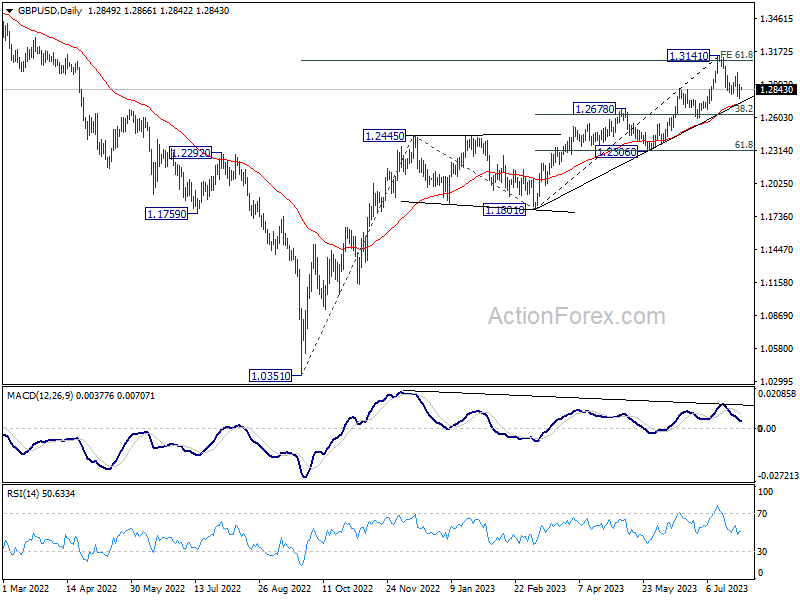
In the bigger picture, as long as 1.2678 resistance turned support holds, rise from 1.0351 (2022 low) is expected to continue. Next target is 100% projection of 1.0351 to 1.2445 from 1.1801 at 1.3895. However, sustained break of 1.2678 will argue that it's at least correcting this rally, with risk of bearish reversal.
EUR/USD Daily Outlook
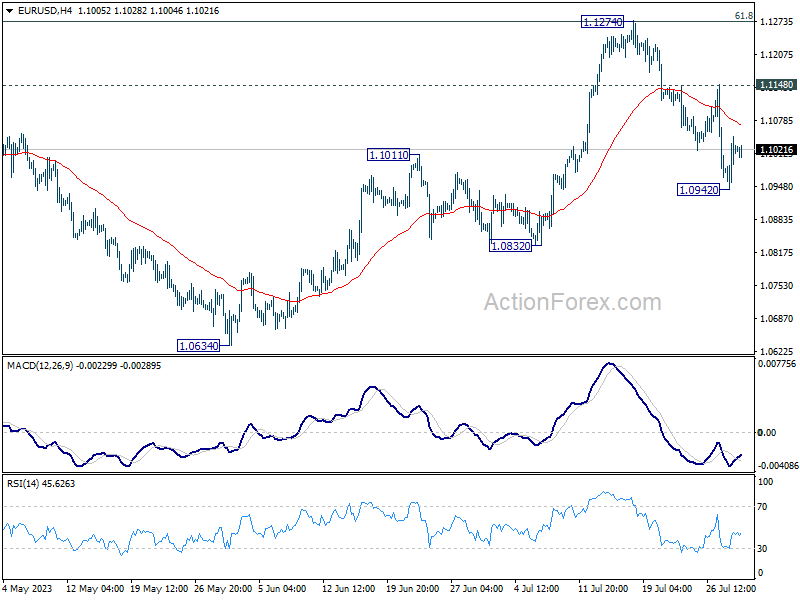
Daily Pivots: (S1) 1.0958; (P) 1.1003; (R1) 1.1061; More...
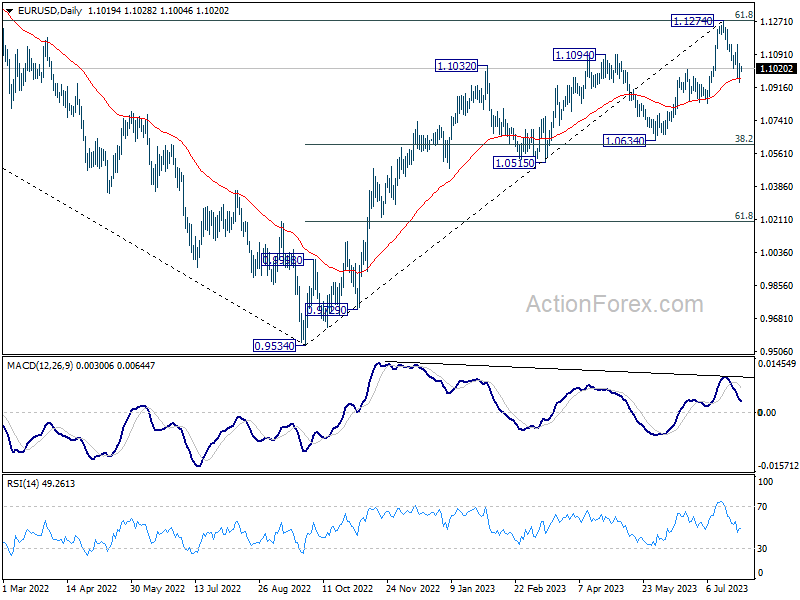
Intraday bias in EUR/USD stays neutral for the moment. Further fall is expected as long as 1.1148 resistance holds. Below 1.0942 will target 1.0832 support next. Nevertheless, break of 1.1148 will argue that the decline has completed and bring retest of 1.1274 high.
In the bigger picture, a medium term top could be formed at 1.1274, after failing to break through 61.8% retracement of 1.2348 (2021 high) to 0.9534 at 1.1273 decisively, on bearish divergence condition in D MACD. Sustained trading below 55 D EMA (now at 1.0963) will bring deeper correction to 1.0634 cluster support (38.2% retracement of 0.9534 to 1.1274 at 1.0609). Strong support could be seen there, at least on first attempt, to set the range for consolidation.
GBP/USD Attempts Fresh Increase While EUR/GBP Faces Hurdle
GBP/USD is attempting a fresh increase from the 1.2770 region. EUR/GBP is consolidating and remains at risk of more downsides below 0.8545.
Important Takeaways for GBP/USD and EUR/GBP Analysis Today
- The British Pound started a steady increase above the 1.2805 resistance.
- There is a short-term contracting triangle forming with resistance near 1.2860 on the hourly chart of GBP/USD at FXOpen.
- EUR/GBP declined below the 0.8600 and 0.8580 support levels.
- There is a key breakout pattern forming with support near 0.8560 on the hourly chart at FXOpen.
GBP/USD Technical Analysis
On the hourly chart of GBP/USD at FXOpen, the pair started a fresh decline from the 1.3000 zone. As mentioned in the previous analysis, the British Pound would remain at risk of more downsides if it cleared the 1.2840 and 1.2805 levels against the US Dollar.
The pair extended its decline and tested the 1.2770 zone. A low is formed near 1.2762, and the pair is now attempting a fresh increase. There was a move above the 23.6% Fib retracement level of the downward move from the 1.2995 swing high to the 1.2762 low.
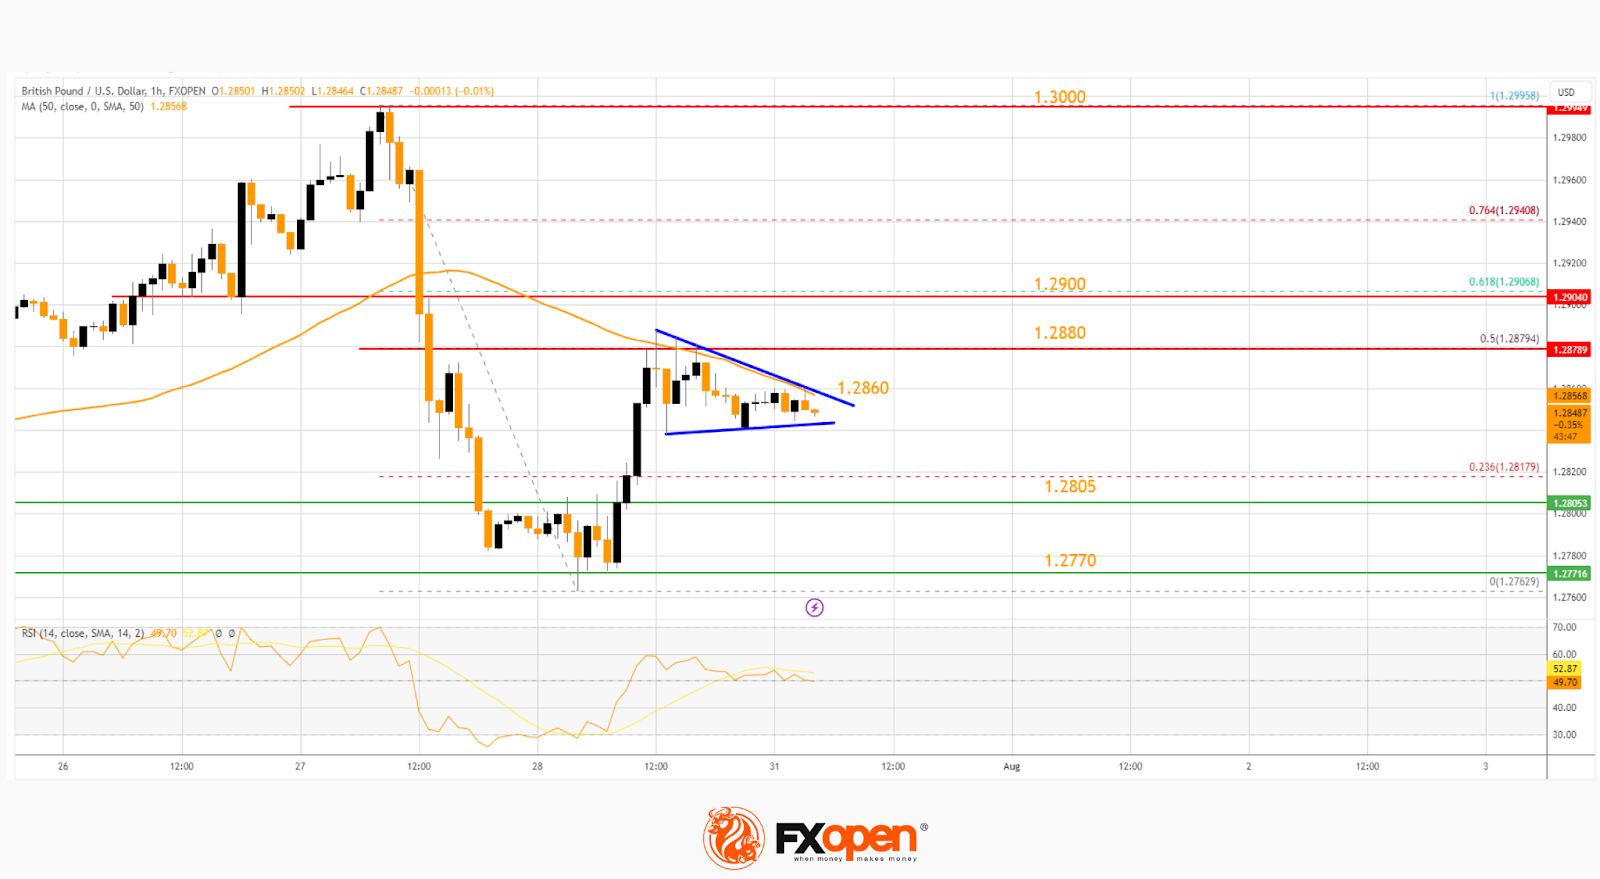
The pair is now consolidating below the 50-hour simple moving average. The GBP/USD chart indicates that the pair is facing resistance near a short-term contracting triangle at 1.2860.
The next major resistance is near the 50% Fib retracement level of the downward move from the 1.2995 swing high to the 1.2762 low at 1.2880. The main breakout zone could be 1.2900. If the RSI moves above 60 and the pair climbs above 1.2900, there could be another rally. In the stated case, the pair could rise toward the 1.3000 level or even 1.3050.
On the downside, there is a major support forming near 1.2805. If there is a downside break below it, the pair could accelerate lower.
The next major support is near the 1.2770 zone, below which GBP/USD could test 1.2740. Any more losses could lead the pair toward 1.2650.
EUR/GBP Technical Analysis
On the hourly chart of EUR/GBP at FXOpen, the pair started a fresh decline from the 0.8640 resistance. The Euro traded below the 0.8600 support and moved into a bearish zone against the British Pound.
The EUR/GBP chart suggests that the pair settled below the 50-hour simple moving average and 0.8580. A low is formed near 0.8545, and the pair is now consolidating losses. The RSI is stuck near 50.
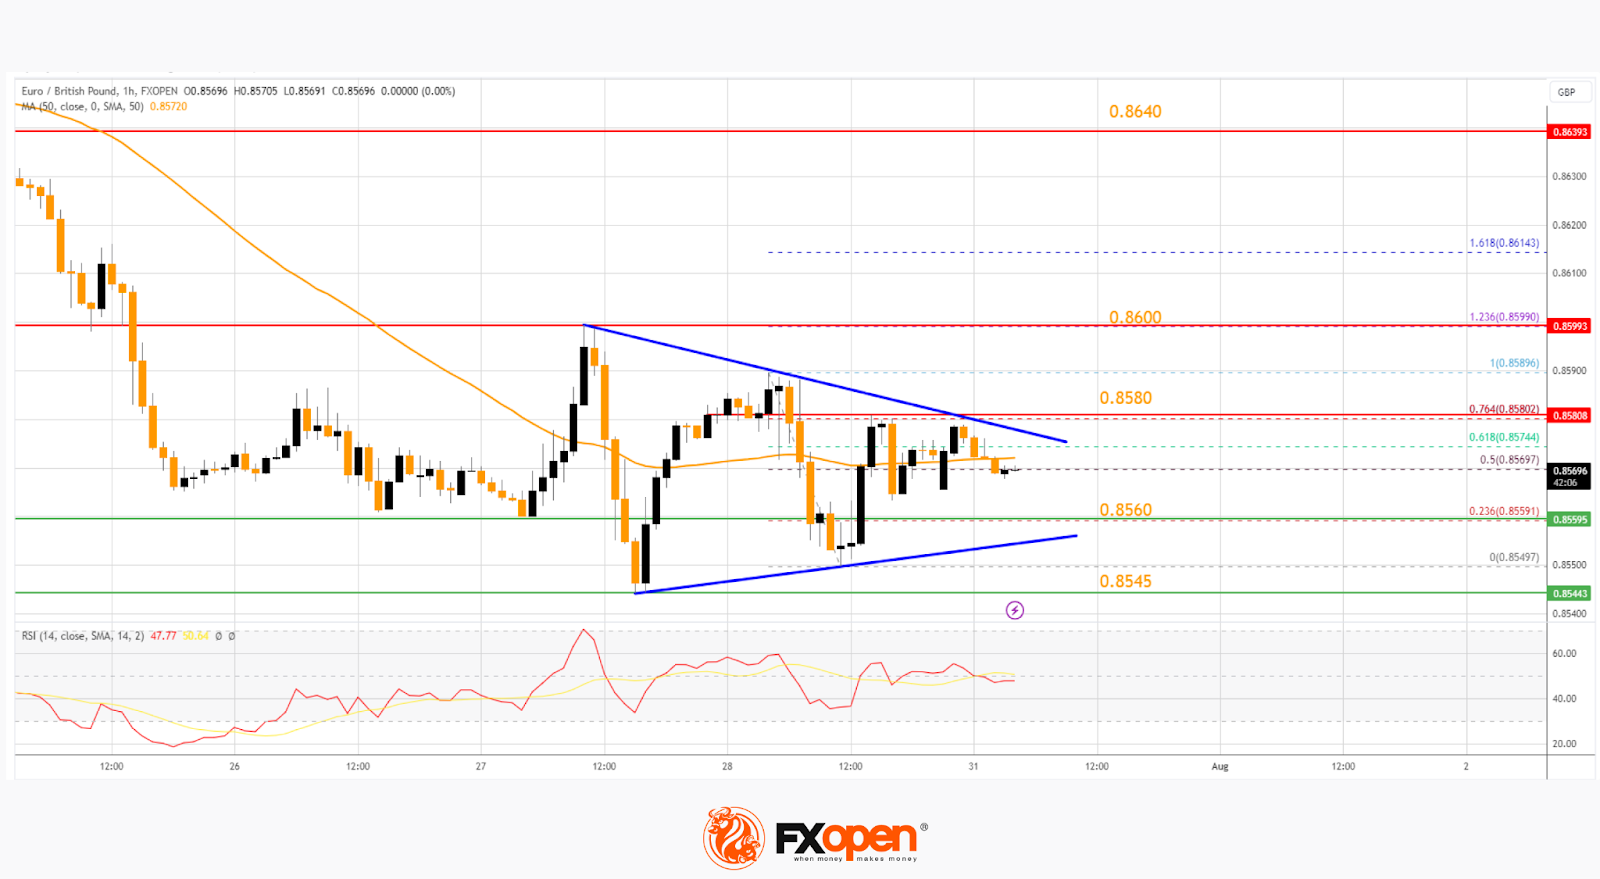
Immediate resistance is near a key breakout pattern at 0.8575. It coincides with the 61.8% Fib retracement level of the downward move from the 0.8599 swing high to the 0.8549 low.
The next major resistance for the bulls is near the 76.4% Fib retracement level of the downward move from the 0.8599 swing high to the 0.8549 low at 0.8580. A close above the 0.8580 level might accelerate gains.
In the stated case, the bulls may perhaps aim for a test of 0.8600. Any more gains might send the pair toward the 0.8640 level.
If there is no move below 0.8580, EUR/GBP could continue to move down. Immediate support sits at 0.8560. The next major support is near 0.8545. A downside break below 0.8545 might call for more downsides. In the stated case, the pair could drop toward the 0.8500 support level.
AUD/USD Daily Report
Daily Pivots: (S1) 0.6664; (P) 0.6742; (R1) 0.6787; More...
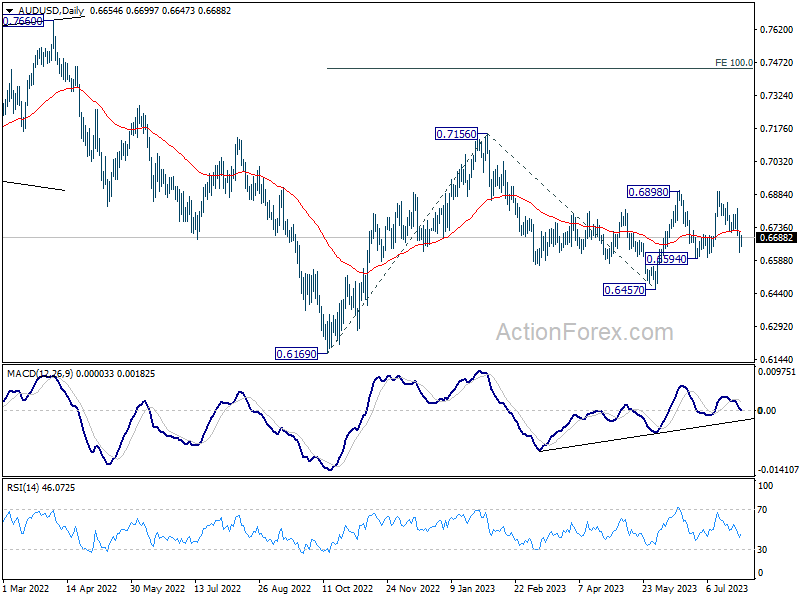
Intraday bias in AUD/USD is turned neutral with current recovery. While deeper fall cannot be ruled out, strong support should be seen from 0.6594 to complete to corrective pattern from 0.6898. On the upside, break of 0.6714 support turned resistance will turn bias back to the upside for retesting 0.6894/8 resistance zone. However, sustained break of 0.6594 will dampen this will and bring deeper fall towards 0.6457.
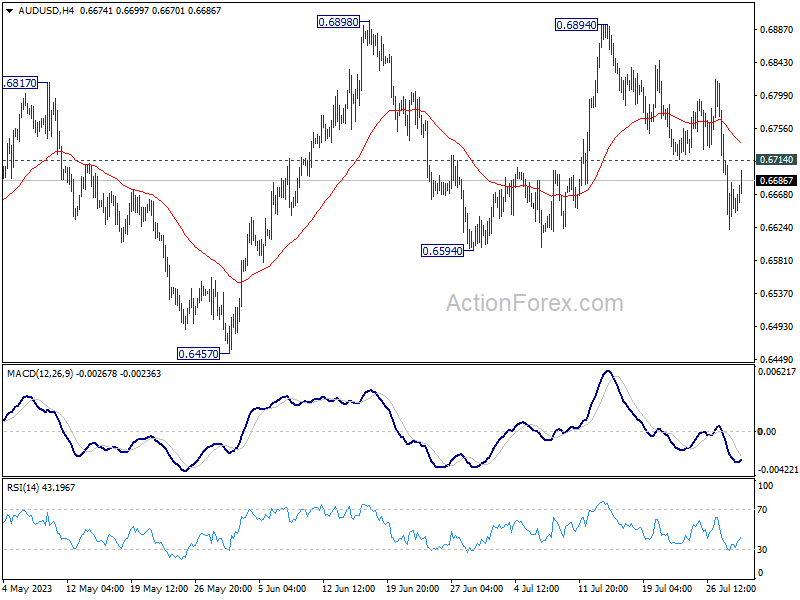
In the bigger picture, outlook is mixed for now as AUD/USD failed to sustain above both 55 D EMA (now at 0.6720) and 55 W EMA (now at 0.6784). On the upside, break of 0.65898 resistance will solidify the case that down trend from 0.8006 (2021 high) has already completed, and target 0.7156 resistance for confirmation. However, break of 0.6457 will likely resume the down trend through 0.6169 (2022 low).