Sample Category Title
China Stimulus Hopes Lift Sentiment But Caution Lingers
The mood across Asian markets brightened on Tuesday as China’s pledge to shore up its weak economy lifted sentiment and boosted Chinese shares.
European markets opened on a steady note, drawing support from Asia but investors remain cautious ahead of another week jampacked with risk events. US futures are currently flat, but Wall Street could see heightened volatility this week due to earnings from big tech titans including Microsoft, Alphabet, and Meta. In the currency space, the US dollar edged lower against other G10 currencies ahead of the pivotal Federal Reserve policy meeting on Wednesday. Elsewhere, gold is flirting around $1960 supported by a softer dollar, while oil is holding near a three-month high amid China stimulus optimism.
Dollar outlook hinges on Fed meeting
The Federal Reserve rate decision on Wednesday is likely to influence the dollar’s medium to longer-term outlook. Markets widely expect the central bank to raise interest rates by 25 basis points, taking the Fed funds range 5.25 to 5.5%. However, the question is whether this will be the hike that draws the curtains on the central bank's aggressive hiking campaign. Given the mixed US economic data over the past few weeks, all eyes will be on Fed Chair Jerome Powell’s press conference for clues on future monetary policy moves.
If Powell strikes a hawkish stance and signals more rate hikes down the line, this could boost the dollar. Alternatively, a cautious sounding Powell who hints that the Fed is done with hiking rates could send the dollar tumbling across the board. Traders are currently pricing in a 97% probability of a 25-basis point hike on Wednesday, with the chance of another 25-basis point hike by November’s meeting currently around 38%, according to Fed funds futures.
The dollar has recently been in corrective mode after a rough month in which it has depreciated against every single G10 currency. Looking at the charts, the US dollar Index has pushed back above the 100.70 level, taking prices back within the previous range. The events of this week will most likely dictate whether prices can keep above 100.70 or sink back below 100.
Commodity spotlight – Gold
This could be an explosively volatile week for gold due to the Federal Reserve rate decision and incoming key US economic data. Bulls are already lurking in the vicinity, with prices pressing above the sticky $1960 as of writing. Whatever the outcome of the Fed decision, it is likely to rock zero-yielding gold on Wednesday.
It will also be wise to keep a close eye on the key US Q2 GDP, initial jobless claims, durable goods and June PCE data in the second half of the week. When factoring in how these key releases may impact Fed hike expectations beyond July’s policy meeting, this could translate to heightened volatility for gold.
A solid breakout above $1970 could trigger a push towards $1985 and $2000, respectively. Should prices slip back below the 50-day Simple Moving Average around $1947, bears may target $1940 and $1932.
USD/JPY: Bulls Pausing Ahead of Fed’s Decision
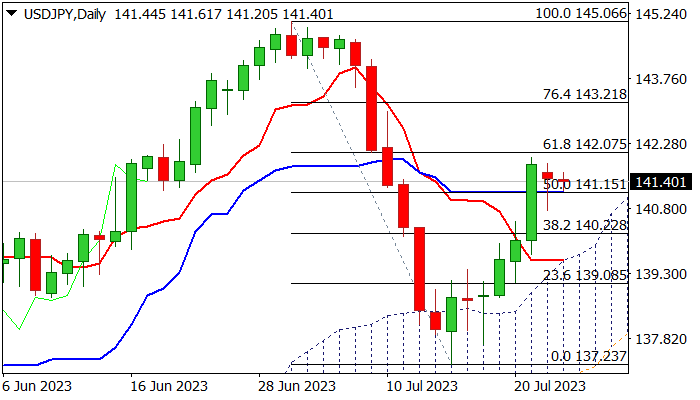
Near-term action is holding in a sideways mode for the second consecutive day, after 2.1% acceleration of last Wed/Thu/Fri ran out of steam on approach to 142.00 zone (psychological / Fibo 61.8% of 145.06/137.23 fall).
Still strong bids limited Monday’s dip, with close above broken daily Kijun-sen (141.15), keeping near-term bias with bulls.
The action remains underpinned by rising daily cloud, but overall picture is still bearishly aligned as 14-d momentum is deeply in the negative territory and stochastic is overbought, keeping the downside vulnerable.
Quiet mode is likely to extend as the US Federal Reserve starts its two-day policy meeting today.
The US central bank is widely expected to raise interest rates by additional 25 basis points, but traders will be focusing on signals about Fed’s next steps.
Initial message that July’s hike would be the last one in sharp tightening cycle, is questioned by the latest signals of possible extension of tightening phase as the US economy is in better condition than expected, despite high borrowing cost.
Loss of initial support at 141.15 will generate initial bearish signal and risk test of key supports at 140 zone (broken Fibo 38.2% and 140.22; psychological/daily cloud top at 139.73).
Conversely, firm break through 142.00 resistance zone will signal continuation of bull-leg from 137.23 (July 14 trough).
Res: 142.07; 142.49; 143.00; 143.21.
Sup: 141.15; 140.91; 140.22; 140.00.
Several Ways Euro Could Get Disappointed at Thursday’s ECB Meeting
It is probably the most important week yet this year as the ECB, the Fed and the BoJ are holding their last rate-setting meetings before the summer lull. The market is confident for another 25bps hike from the ECB but what about September? Also, could Thursday’s meeting act as a tailwind for the euro against the pound, the best performing currency of 2023?
Where are we now?
The ECB Governing council is expected to have a full-on discussion at the 2-day meeting commencing on Wednesday, with the announcements coming at 12:15pm GMT on Thursday and the usual press conference held 30 minutes later. The market is currently pricing in 46bps of rate hikes until the December 2023 meeting. As a comparison, the Fed is seen hiking in July with a small chance (around 30%) of another 25bps increase in November 2023. However, it all goes downhill from there as around 100bps of rate cuts are priced in by November 2024.
The market’s mind is on two issues regarding this week’s ECB gathering. The first one is whether the ECB will confirm the market expectations and announce a 25bps rate hike. President Lagarde essentially pre-announced this move at the June meeting, but the recent economic releases are causing concern. In particular, the business surveys continue to point to an extremely weak growth period, which in the case of Germany could mean the third consecutive quarter with negative growth. Consequently, the ECB doves are becoming much more vocal as they are trying to affect the outcome of this meeting but mostly dictate the discussion for September.
What about the September meeting?
This brings us to the second and more pressing issue for Thursday’s press conference. Will Lagarde repeat the usual “we still have ground to cover” phrase, which has been her motto lately? Up to now, the doves have been accepting a slower asset reduction pace for the various ECB purchase programmes that are currently in place in exchange for rate hikes, but they now seem ready to put up a proper fight. With the next staff projections coming at the September meeting, the doves are desperate to avoid any pre-commitment from Lagarde, even if it is sugar-coated with the usual “data-dependency” watchword.
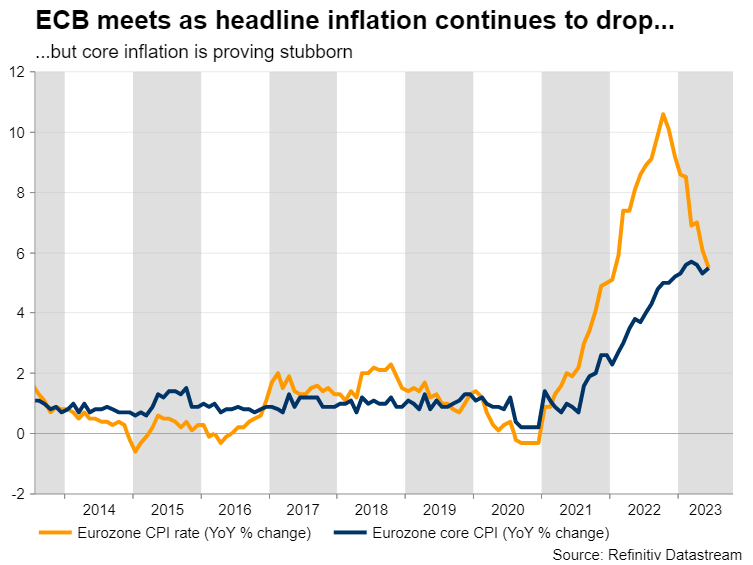
From an economic perspective, the headline inflation rate continues its drop, but the core component is proving very stubborn. Some central bankers have argued against the usefulness of the core indicator in predicting future headline inflation, but Lagarde’s focus on this component at the June press conference means that the ECB is monitoring it very closely. Interestingly, the preliminary German CPI print for July, and the first estimates of GDP growth for the second quarter of 2023 from both France and Spain are scheduled to be released on Friday morning. It is only fair to assume that these figures will be at the ECB members’ disposal during the 2-day gathering.
When chairing the press conferences, Lagarde expresses the majority opinion of the ECB Governing council and hence her comments should reveal the true behind-doors discussion regarding the guidance for the September meeting. She will clearly have to be on top of her game on Thursday so as to please both two sides at the ECB and to avoid displeasing the markets. Fortunately for ECB members, they will have the luxury of watching the Fed press conference on Wednesday evening and evaluating the associated market reaction. And to a certain extent, they may be able to adjust their message to limit the possibility of the market misinterpreting their announcements.
Therefore, a failure by Lagarde to repeat the aforementioned motto would clearly be seen as the key message that the ECB is indeed close or already at its terminal rate, with the market quickly pricing in aggressive rate cuts, even during the fourth quarter of 2023. On the other hand, if Lagarde repeats her motto the market would get excited, but the weakening data releases will probably stop it from behaving exuberantly.
Euro/pound pair below a key trendline
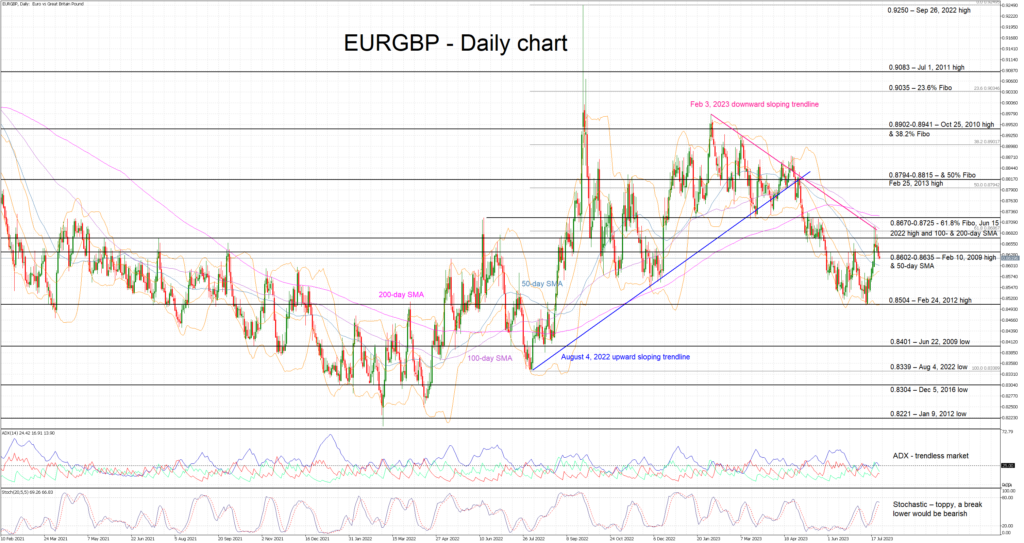
It has been a one-way street move in euro/pound during 2023 with the pair registering a new 2023 low of 0.8503 on July 11. The euro bulls managed to stage a recovery until they found significant resistance at the February 3, 2023 downward sloping trendline. With the overall technical picture in favor of the euro, the next leg rests on the hands of the ECB.
As the market feels strongly about this meeting, there is an increasing scope for disappointment if the ECB does not deliver the 25bps hike and/or Lagarde fails to appear hawkish at the press conference. In this case, disappointment should push euro/pound aggressively lower towards the 0.8500 area. On the flip side, should the press conference prove to be a carbon copy of the June one, the euro bulls would entertain the idea of a move above the busy 0.8670-0.8725 that would challenge the prevailing bearish trend.
Will GBPUSD Repeat July’s Bull Race?
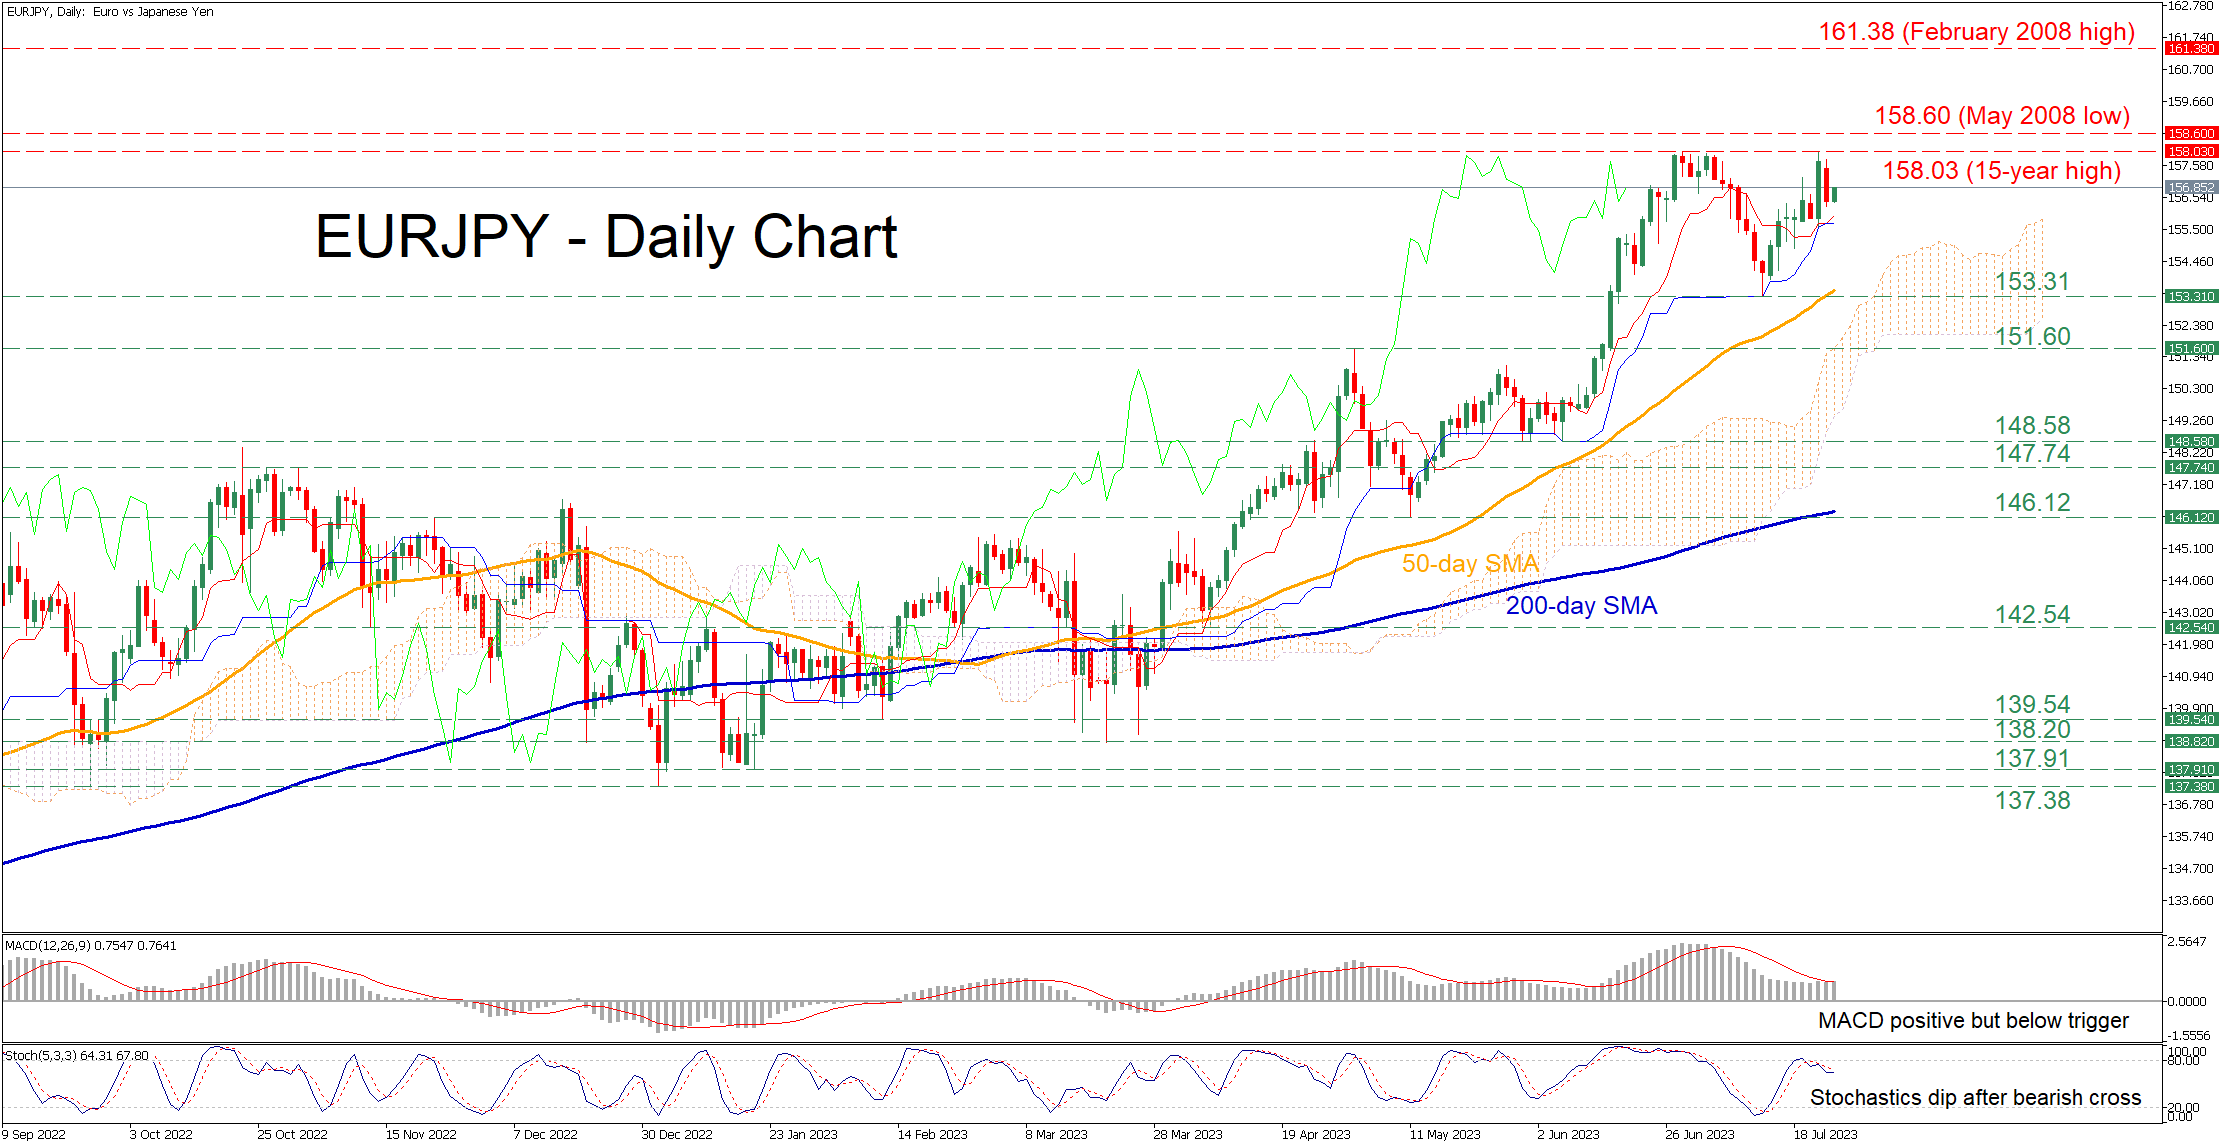
GBPUSD is having a déjà vu of its trendline bounce on June 30, which helped the pair to advance towards a 15-year high of 1.3141 after a tick below the 20-day simple moving average (SMA).
The pair paused its latest bear run near the short-term support trendline from June, but again the technical indicators cannot guarantee a sustained rebound. The RSI has extended its downtrend towards its 50 neutral mark and the MACD remains negatively charged below its red signal line. Hence, although the stochastic oscillator suggests overselling, there's no proof the bearish correction is done.
The bulls need the price to rise above 1.2850 and then break through the 1.2935-1.3000 zone, which includes two resistance lines and the 61.8% Fibonacci retracement of the 2021-2022 downtrend. A successful penetration of this boundary could clear the way towards July’s top of 1.3140, while higher, the uptrend could stretch as high as 1.3300, last seen in March 2022. This is where the tentative ascending line from June is located as well.
Alternatively, a close below the support trendline at 1.2800 may lead the pair towards its 50-day SMA at 1.2670 and the medium-term ascending line from March. If sellers claim the previous low of 1.2590 too, fears of a negative trend reversal could squeeze the price to 1.2400. Even lower, the spotlight will fall on the 200-day SMA and the 50% Fibonacci of 1.2285.
All in all, GBPUSD maintains a positive trajectory in the short and long-term picture, though whether it will preserve its current bullish momentum remains to be seen.
Germany’s Ifo business climate fell to 87.3, economy turning bleaker
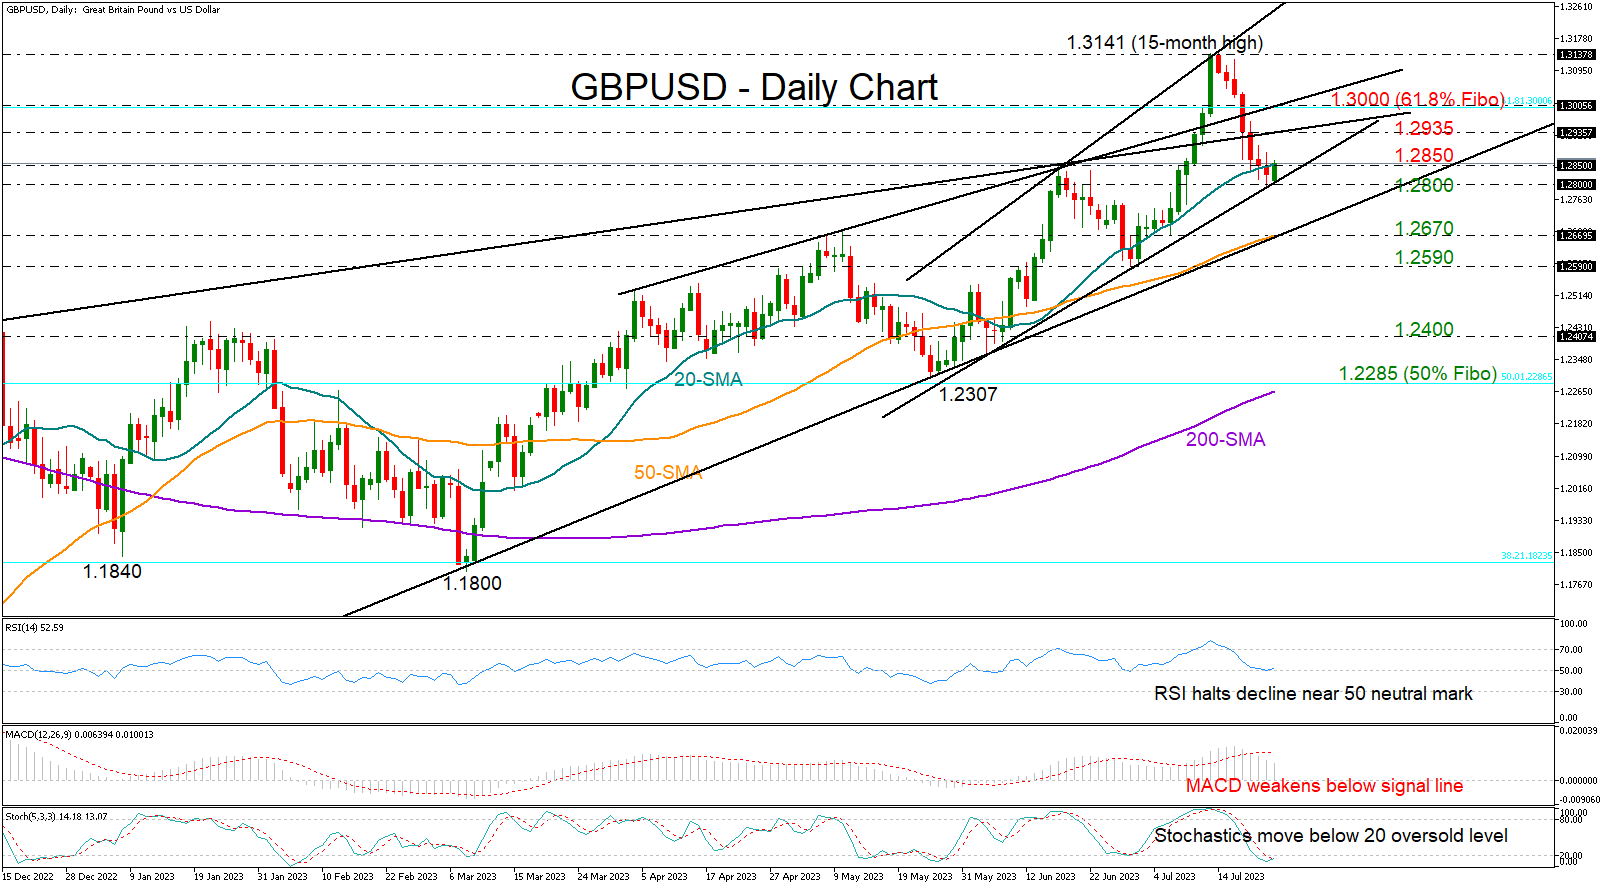
Germany's Ifo Business Climate Index has fallen for the third consecutive month in July, from 88.6 to 87.3, slightly missing expectation of of 88.0. Both the Current Assessment Index and Expectations Index noted a drop, signaling a potential slowdown in Europe's largest economy.
Current Assessment Index, which measures the present business conditions, dropped from 93.7 to 91.3, falling short of the expected 93.0. Meanwhile, Expectations Index, which gauges future business prospects, slipped from 83.8 to 83.5, although it managed to outperform the expectation of 83.0.
Ifo, the institute that conducts the survey, delivered a grim prognosis for the German economy. "The situation in the German economy is turning bleaker," they said in their statement.
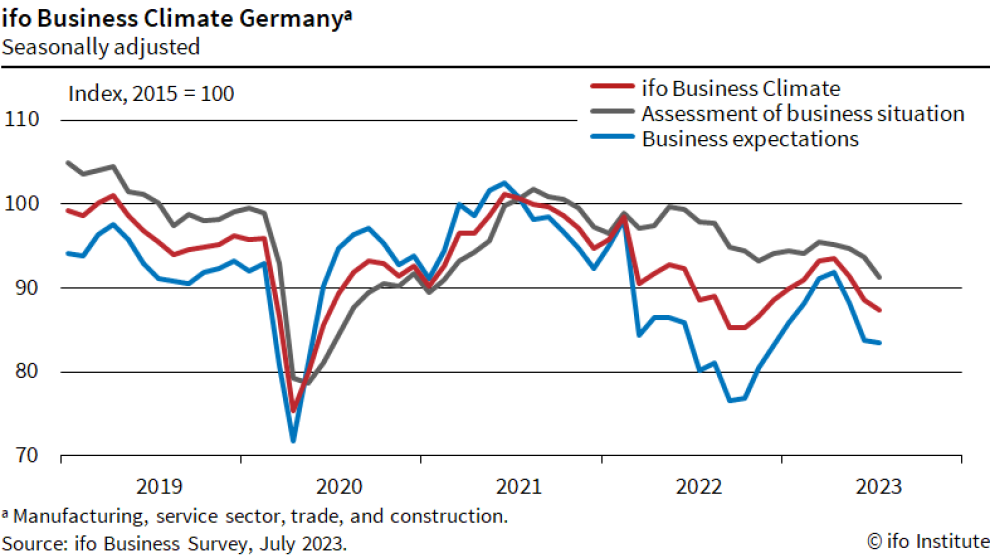
A breakdown by sectors shows a similar trend, with all reporting lower figures. Manufacturing took a hit, dropping from -9.7 to -14.2. Services sector also posted a decline, falling from 2.7 to 0.9. Trade sector suffered a fall from -20.2 to -23.7, and construction, too, saw a downturn, from -20.5 to -24.0.
EURJPY Retreats After Testing 15-year High
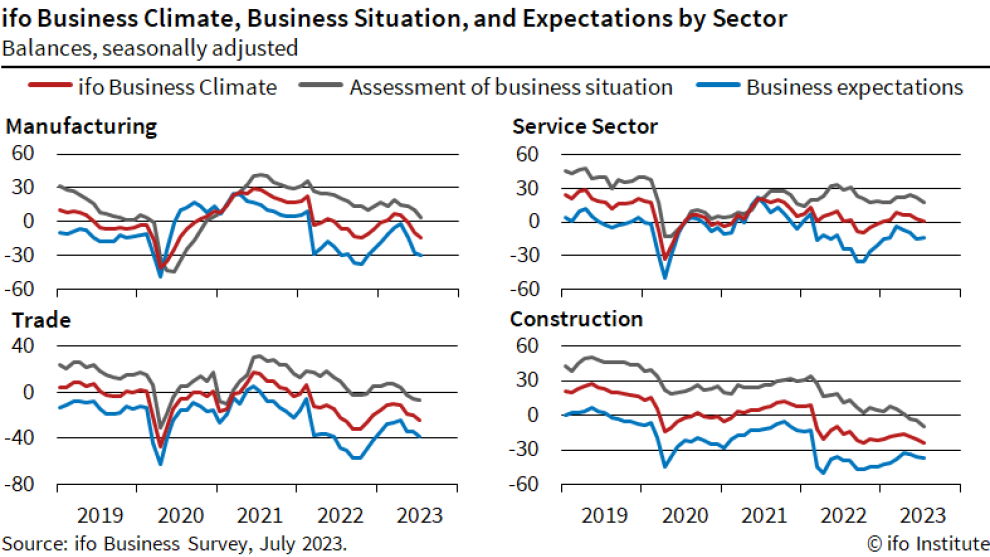
EURJPY has been in a strong uptrend since the beginning of the year, posting consecutive multi-year peaks. In the near term, the pair is experiencing some weakness after getting rejected at the 15-year high near the 158.00 region, potentially forming a double top pattern.
The momentum indicators currently suggest a cautiously bearish near-term bias. Specifically, the MACD is holding below its red signal line in the positive territory, while the stochastics are descending after posting a bearish cross.
Should the selling interest intensify, the pair could retreat to test the 153.31 support, which overlaps with the 50-day simple moving average (SMA). A break below that region could pave the way for the May resistance of 151.60, which might serve as support in the future. Failing to halt there, the price may decline towards the June bottom of 148.58.
On the flipside, if the price reverses back higher, the recent 15-year high of 158.03 could cap initial advances. Conquering this barricade, the bulls might propel the price towards fresh multi-year highs, where the May 2008 low of 158.60 may act as a strong ceiling. Further upside attempts could then stall around the February 2008 peak of 161.38.
In brief, it seems that EURJPY is facing some downside pressure due to its failure to claim the recent 15-year peak. However, to confirm a broader downside correction, the pair needs to pierce through the 50-day SMA.
BTC/USD Analysis: Breakdown of July Support
Yesterday, the price of BTC/USD fell below the level of 29,700, a support that has been in place for about a month.
What are the reasons for the decline? CNBC writes about:
- strengthening of the USD on the eve of the Fed's meeting on the interest rate, which puts pressure on the price of bitcoin, denominated in US dollars;
- an article in the WSJ raising concerns for the crypto industry in light of the pending SEC lawsuit against Binance.
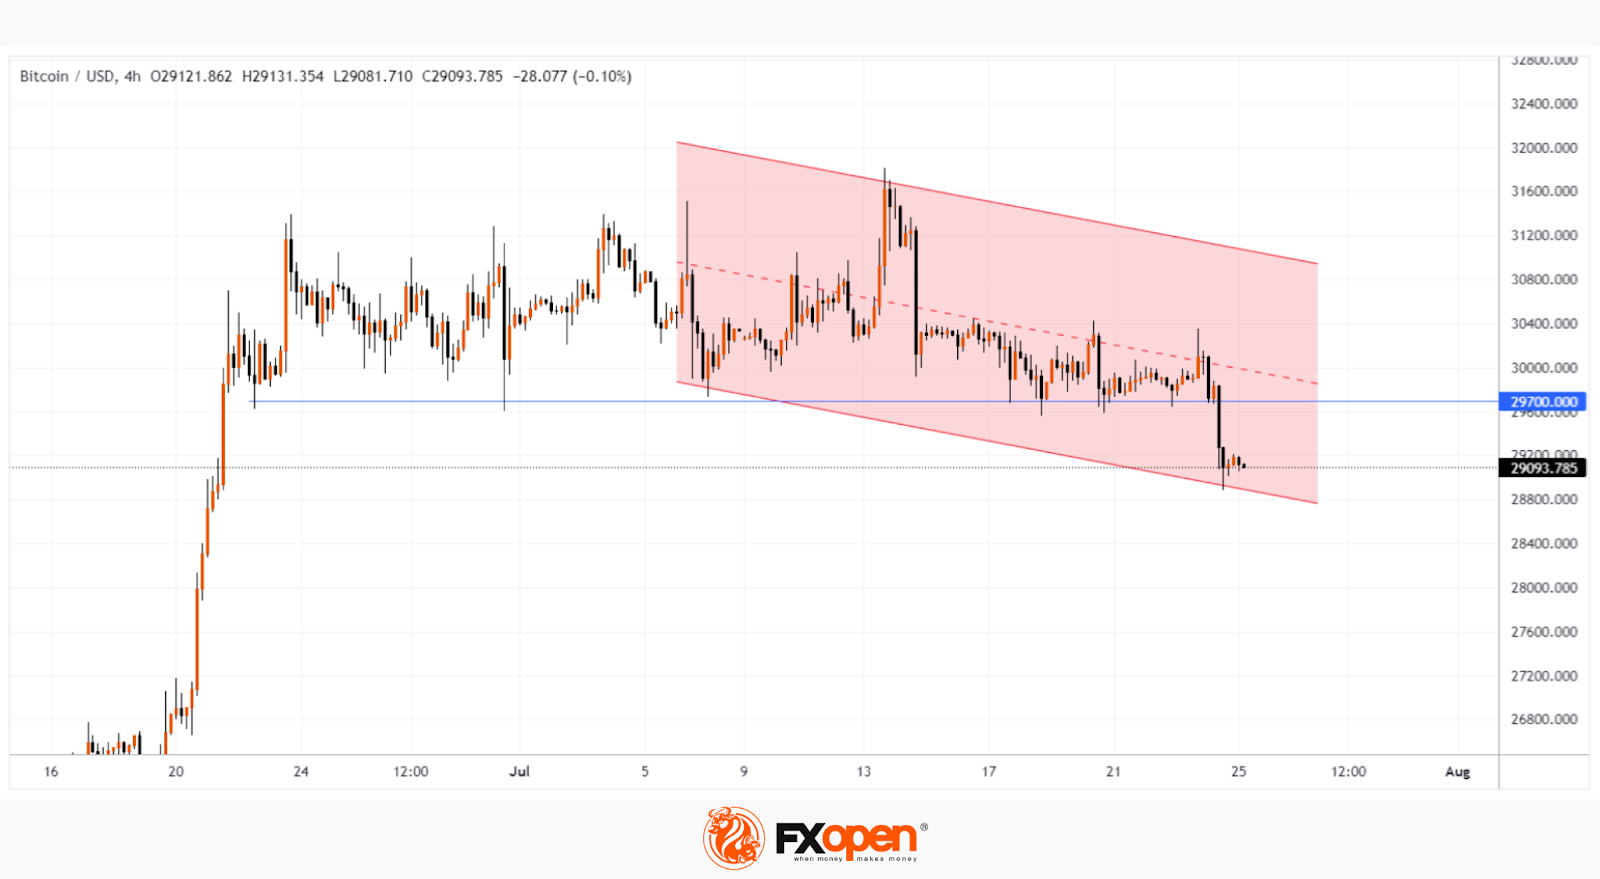
Note that in our previous post, we pointed out a sign of weakness, which manifested itself in the inability of the bulls to take advantage of the positive from Ripple Labs' victory in court with the SEC, and also built a downward channel (shown in red). Yesterday, on the chart, the price of BTC/USD reached its lower limit, where it found support.
Will the price of bitcoin continue to develop dynamics within this channel? A lot depends on the Fed. The decision on the key interest rate will be announced tomorrow at 21:00 GMT+3. And at 21:30 Powell will hold a press conference.
We also draw attention to the fact that:
- news on the interest rate from the ECB will be released on Thursday at 15:15 GMT+3;
on Friday at 06:00 GMT+3, a similar event from the Bank of Japan. - Be prepared for bursts of volatility, including in the BTC/USD market.
FXOpen offers the world's most popular cryptocurrency CFDs*, including Bitcoin and Ethereum. Floating spreads, 1:2 leverage, 30% margin call, 0.01 lot minimum transaction size with no maximum — at your service. Open your trading account now or learn more about crypto CFD trading with FXOpen.
*At FXOpen UK and FXOpen AU, Cryptocurrency CFDs are only available for trading by those clients categorised as Professional clients under FCA Rules and Professional clients under ASIC Rules respectively. They are not available for trading by Retail clients.
This article represents the opinion of the Companies operating under the FXOpen brand only. It is not to be construed as an offer, solicitation, or recommendation with respect to products and services provided by the Companies operating under the FXOpen brand, nor is it to be considered financial advice.
CHFJPY Strong Rally From The Elliott Wave Blue Box Area
In this technical blog, we will look at the past performance of the 1-hour Elliott Wave Charts of CHFJPY. In which, the rally from 13 January 2023 low unfolded as an impulse sequence and showed a higher high sequence. Therefore, we knew that the structure in CHFJPY is incomplete to the upside & should see another leg higher to complete the impulse rally. So, we advised members not to sell the pair & buy the dips in 3, 7, or 11 swings at the blue box areas. We will explain the structure & forecast below:
CHFJPY 1-Hour Elliott Wave Chart From 7.12.2023
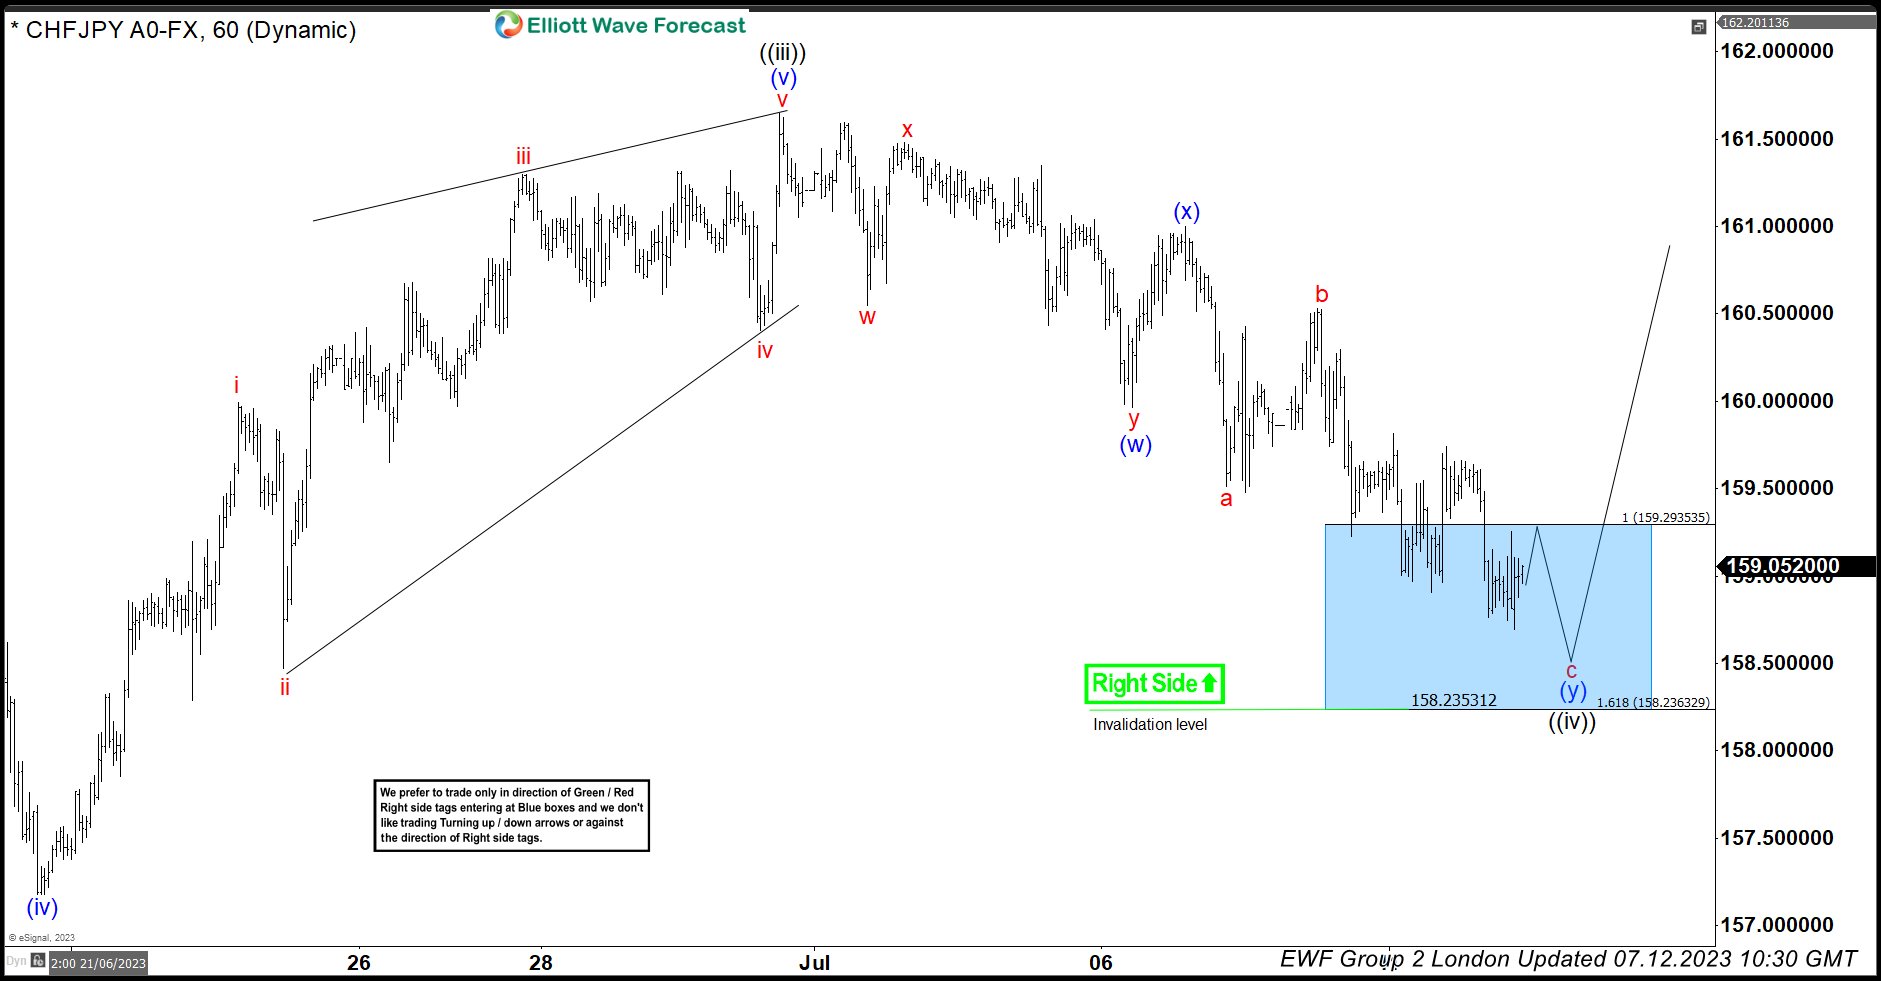
Here’s the 1hr Elliott wave Chart from the 7/12/2023 update. In which, the rally to 161.64 high ended wave ((iii)) & made a pullback in wave ((iv)). The internals of that pullback unfolded as Elliott wave double three correction where wave (w) ended in 3 swings at 159.96 low. Then a bounce to 160.99 high ended wave (x) & started the next leg lower in wave (y) towards 159.29- 158.23 blue box area. From there, buyers were expected to appear looking for new highs ideally or for a 3 wave bounce minimum.
CHFJPY Latest 1-Hour Elliott Wave Chart from 7.25.2023
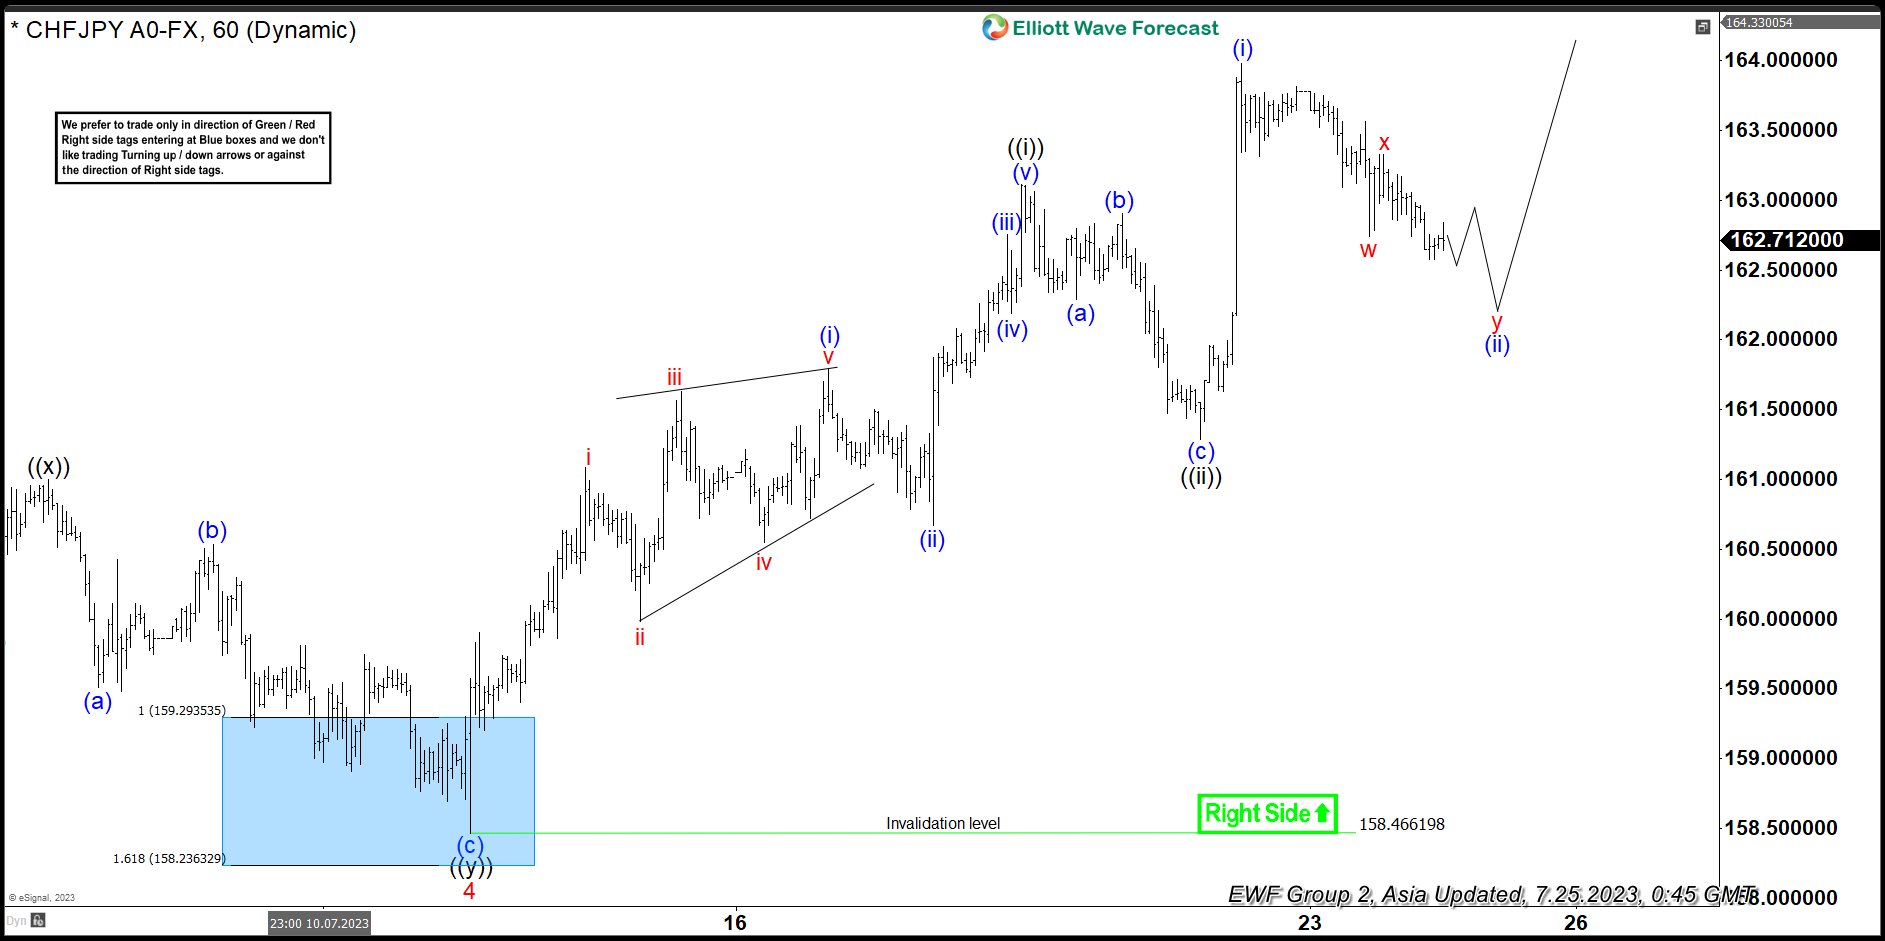
This is the latest 1hr Elliott wave Chart from the 7/25/2022 Asia update. In which the pair is showing a strong reaction higher taking place, right after ending the double correction within the blue box area. Allowed members to create a risk-free position shortly after taking the long position at the blue box area. Since then the pair has already made new highs supporting some more upside. Note, with further data, we were able to adjust the degree into wave 5 higher.
USD/CAD Daily Outlook
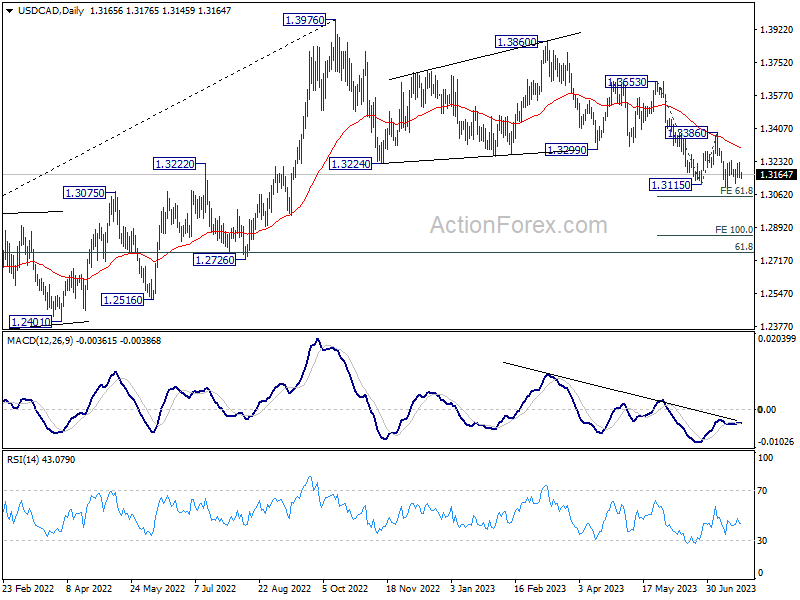
Daily Pivots: (S1) 1.3136; (P) 1.3182; (R1) 1.3215; More....
Range trading continues in USD/CAD and intraday bias remains neutral for the moment. Further decline is expected as long as 1.3386 resistance holds. Break of 1.3091 will resume larger fall and target 61.8% projection of 1.3653 to 1.3115 from 1.3386 at 1.3054. However, firm break of 1.3386 will indicate near term reversal and turn outlook bullish.
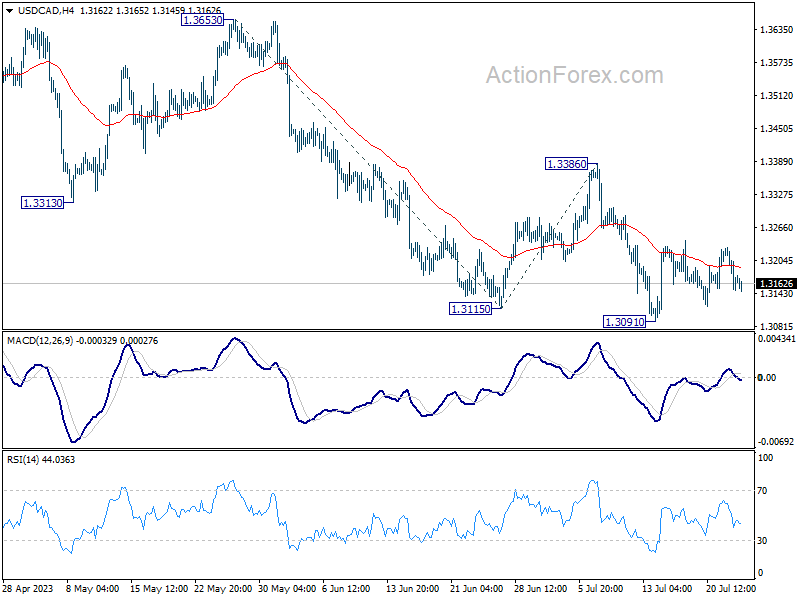
In the bigger picture, price actions from 1.3976 are viewed as a correction to up trend from 1.2005 (2021 low) only. But even so, deeper decline is expected as long as 1.3386 resistance holds. Further fall could be seen to 61.8% retracement of 1.2005 to 1.3976 at 1.2758. Meanwhile, break of 1.3386 will be a sign that the correction has completed and bring stronger rally back to retest 1.3976.
AUD/USD Daily Report
Daily Pivots: (S1) 0.6718; (P) 0.6737; (R1) 0.6759; More...
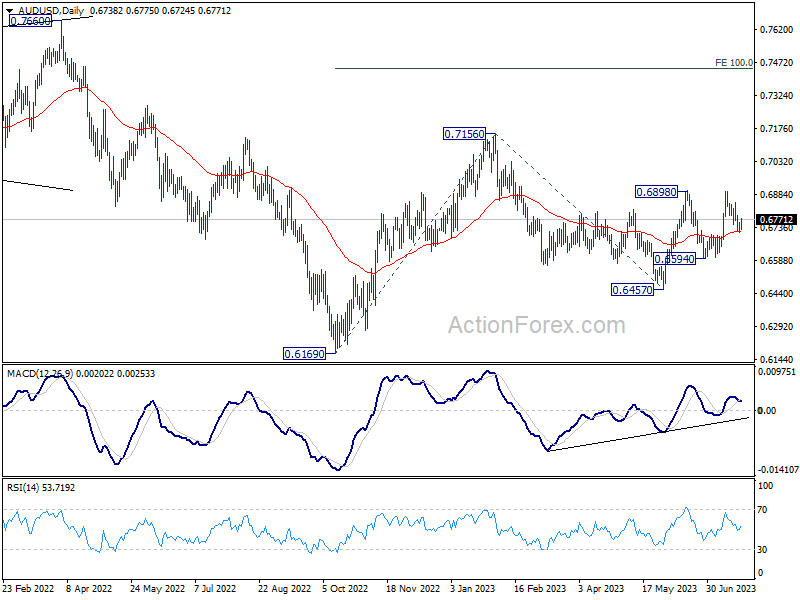
Intraday bias in AUD/USD is turned neutral with current recovery On the downside below 0.6714 will resume the fall from 0.6894, as the third leg of the corrective pattern from 0.6898. But downside should be contained above 0.6594 support to bring rebound. On the upside, above 0.6845 will bring retest of 0.6898 resistance. Decisive break there will resume rise from 0.6457.
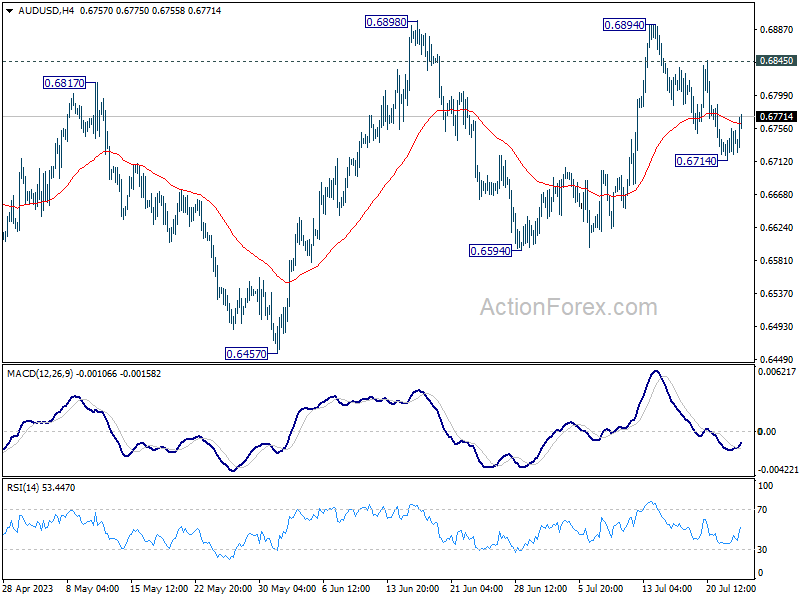
In the bigger picture, price actions from 0.7156 are seen as a correction to the rebound from 0.6169 (2022 low). Break of 0.6898 resistance will argue that rise from 0.6169 is ready to resume through 0.7156. Next target will be 100% projection of 0.6169 to 0.7156 from 0.6457 at 0.7444. For now, this will be the favored case as long as 55 D EMA (now at 0.6715) holds.