

Sample Category Title
EUR/CHF Daily Outlook
Daily Pivots: (S1) 0.9798; (P) 0.9828; (R1) 0.9857; More...
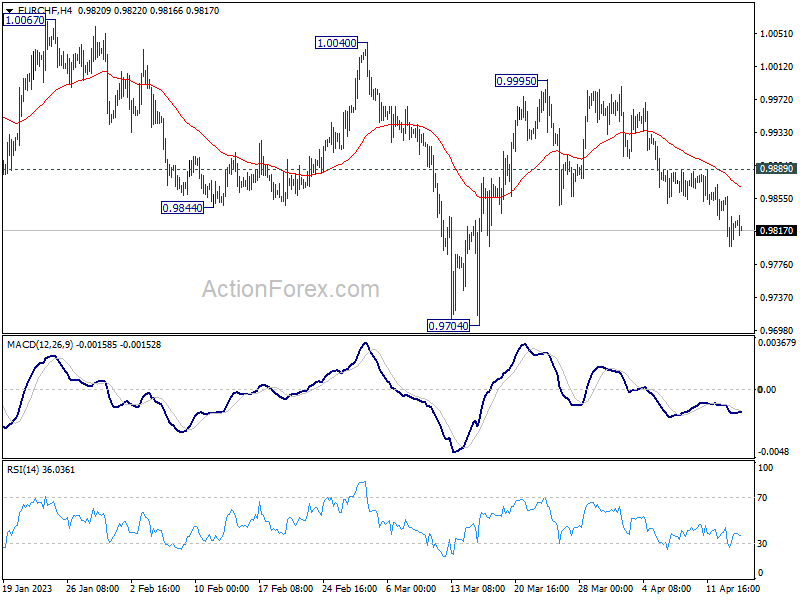
Intraday bias in EUR/CHF remains on the downside for the moment. Fall from 0.9995 is possibly another leg of the whole corrective pattern from 1.0067. Deeper decline would be seen to 0.9074, and possibly below. On the upside, though, break of 0.9889 minor resistance will turn intraday bias back to the upside for stronger rebound.
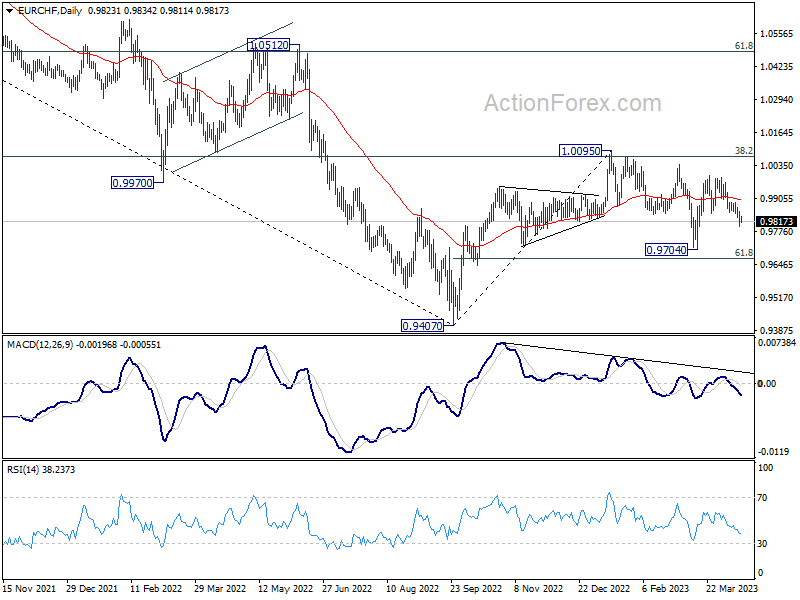
In the bigger picture, prior rejection by 55 week EMA (now at 1.1002) and 38.2% retracement of 1.1149 to 0.9407 at 1.0072 suggests that medium term outlook is staying bearish. That is, down trend from 1.2004 is not completed yet and is in favor to resume through 0.9407 at a later stage. However, decisive break of 1.0095 resistance will raise the chance of bullish trend reversal. Rise from 0.9407 should then target 1.0505 cluster resistance (2020 low at 1.0505, 61.8% retracement of 1.1149 to 0.9407 at 1.1484).
EUR/USD Daily Outlook
Daily Pivots: (S1) 1.0993; (P) 1.1031; (R1) 1.1084; More...
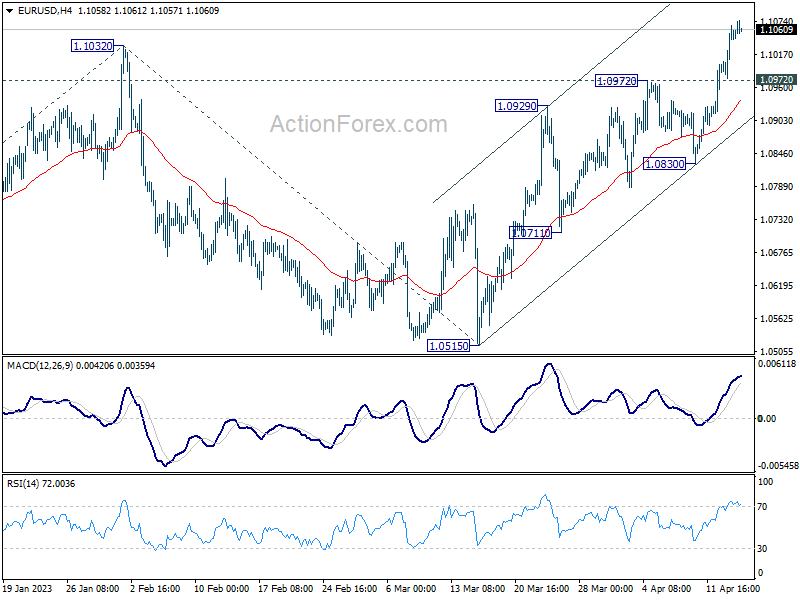
Intraday bias in EUR/USD remains on the upside for the moment. Up trend from 0.9534 is in progress for 1.1273 fibonacci level. Break there will target 61.8% projection of 0.9534 to 1.1032 from 1.0515 at 1.1441. On the downside, below 1.0972 support will turn intraday bias neutral and bring consolidations first. But near term outlook will stay bullish as long as 1.0830 support holds.
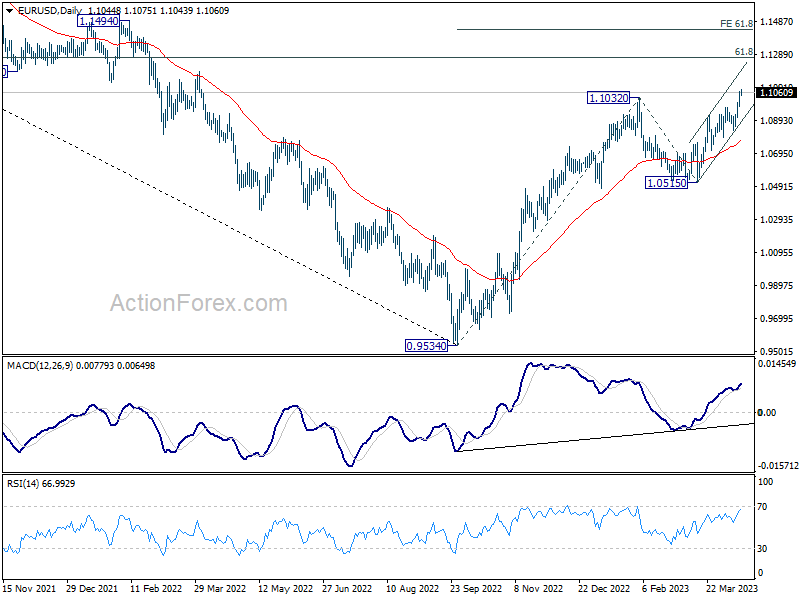
In the bigger picture, rise from 0.9534 (2022 low) is in progress for 61.8% retracement of 1.2348 (2021 high) to 0.9534 at 1.1273. Sustained break there will solidify the case of bullish trend reversal and target 1.2348 resistance next (2021 high). This will now remain the favored case as long as 1.0515 support holds, even in case of deeper pull back.
GBP/USD Daily Outlook
Daily Pivots: (S1) 1.2489; (P) 1.2513; (R1) 1.2547; More...
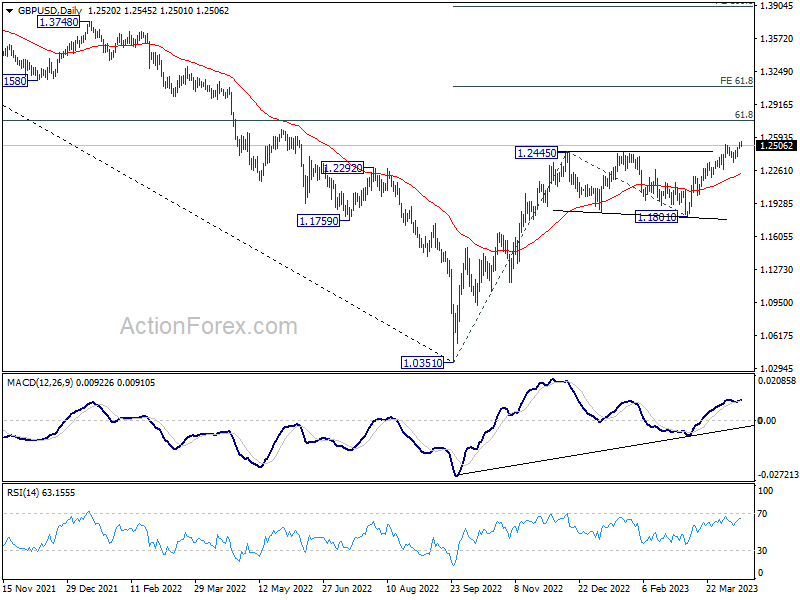
Intraday bias in GBP/USD remains on the upside at this point. Current up trend from 1.0351 should target 1.2759 fibonacci level first. Firm break there will target 61.8% projection of 1.0351 to 1.2445 from 1.1801 at 1.3095. For now, outlook will remain bullish as long as 1.2343 support holds, in case of retreat.
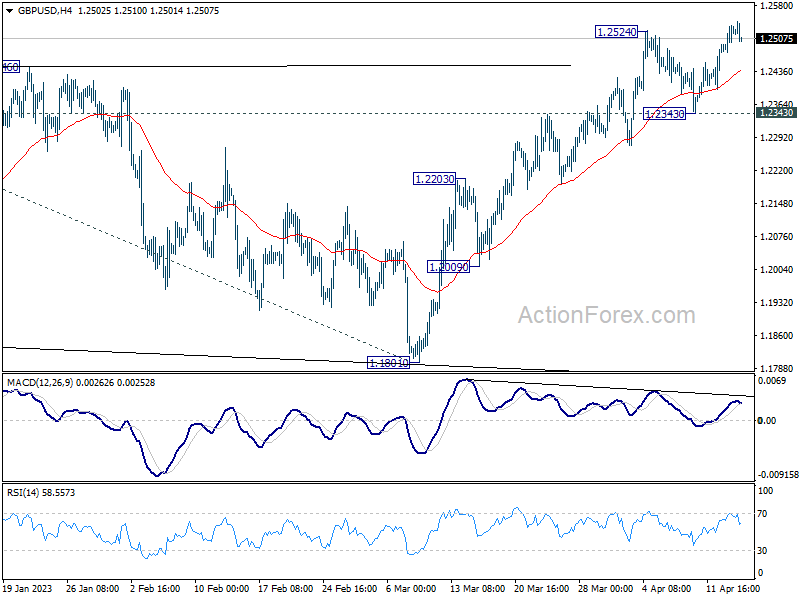
In the bigger picture, the rise from 1.0351 medium term term bottom (2022 low) is in progress for 61.8% retracement of 1.4248 (2021 high) to 1.0351 at 1.2759. Sustained break there will add to the case of long term bullish trend reversal. Further break of 61.8% projection of 1.0351 to 1.2445 from 1.1801 at 1.3095 could prompt upside acceleration to 100% projection at 1.3895. For now, this will remain the favored case as long as 1.1801 support holds, even in case of deep pull back.
USD/CHF Daily Outlook
Daily Pivots: (S1) 0.8845; (P) 0.8910; (R1) 0.8960; More...
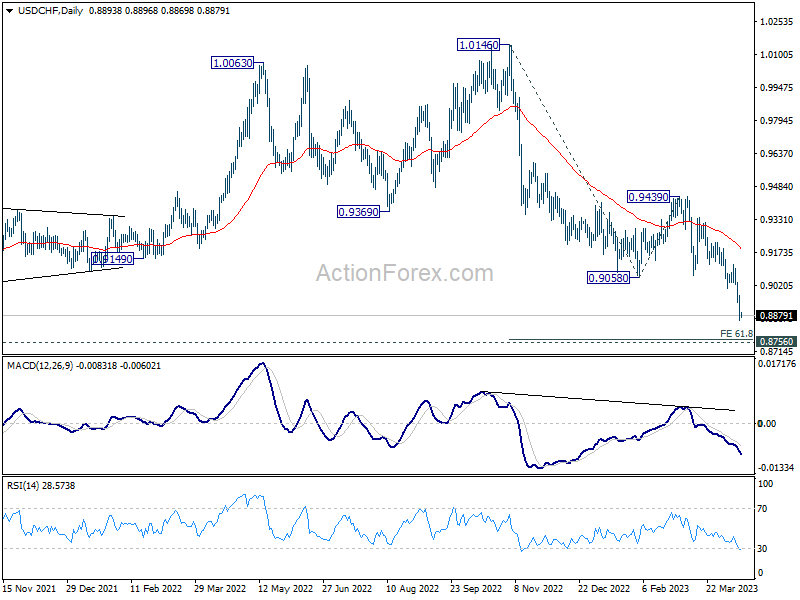
USD/CHF's decline is still in progress and intraday bias stays on the downside. Current down trend from 1.0146 should target 61.8% projection of 1.0146 to 0.9058 from 0.9439 at 0.8767, which is close to 0.8756 long term support. Strong support is expected there to bring rebound, at least on first attempt. On the upside, above 0.0973 minor resistance will turn intraday bias neutral first.
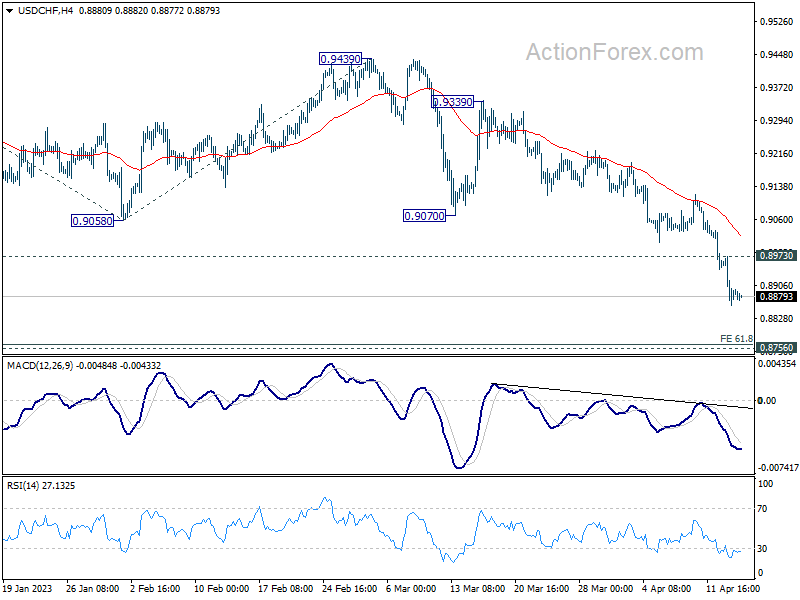
In the bigger picture, fall from 1.1046 (2022 high) is in progress for 0.8756 support (2021 low). But overall, this fall is still as a leg in the long term range pattern from 1.0342 (2016 high). So, downside should be contained by 0.8756 to bring reversal. Sustained break of 0.9058 support turned resistance will be the first sign of medium term bottoming. However, decisive break of 0.8756 will carry larger bearish implications.
USD/JPY Daily Outlook
Daily Pivots: (S1) 131.94; (P) 132.66; (R1) 133.31; More...
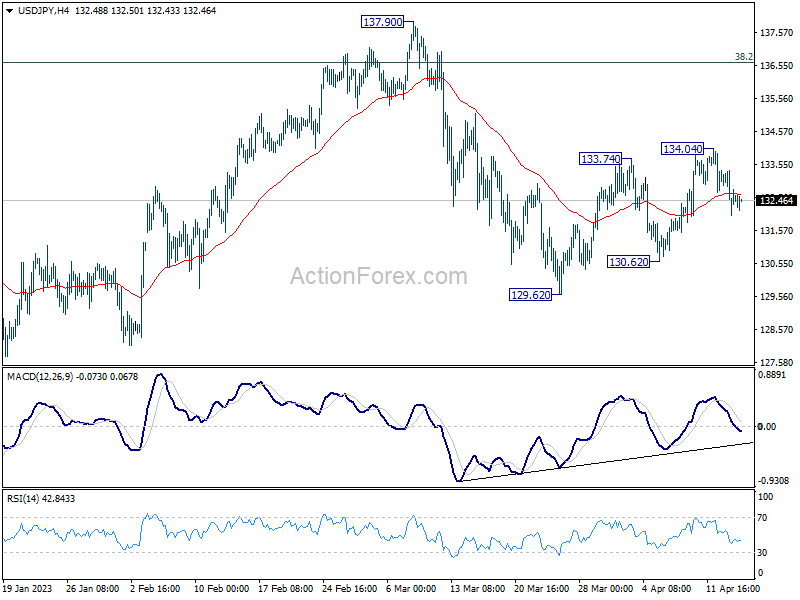
No change in USD/JPY's outlook as range trading continues. Intraday bias remains neutral for the moment. On the upside, break of 134.04 will resume the rebound from 129.62 towards 137.90 resistance again. On the downside, break of 130.62 should resume the fall from 137.90 through 129.62 to retest 127.20 low.
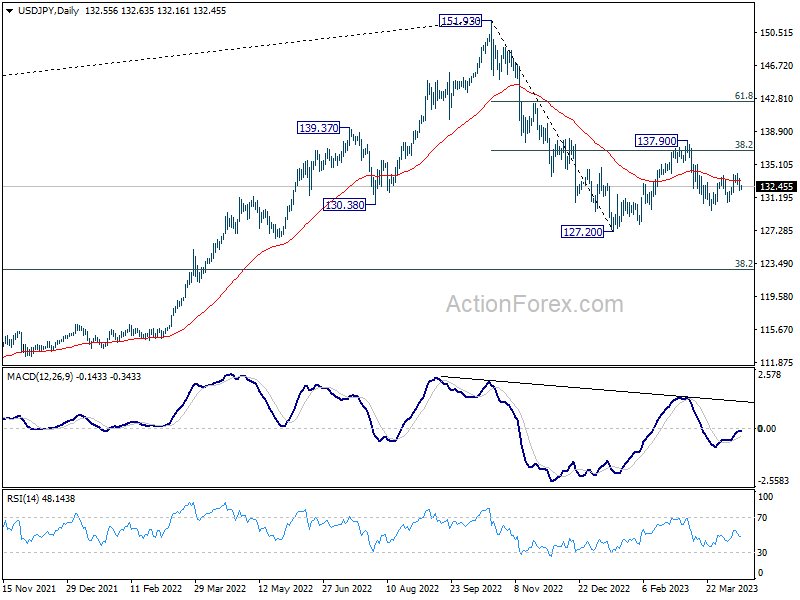
In the bigger picture, corrective pattern from 127.20 might be extending. But after all, down trend from 151.93 is expected to resume at a later stage. Break of 127.20 will resume this down trend and target 61.8% projection of 151.93 to 127.20 from 137.90 at 122.61. This will now be the favored case as long as 137.90 resistance holds.
AUD/USD Daily Report
Daily Pivots: (S1) 0.6713; (P) 0.6755; (R1) 0.6825; More...
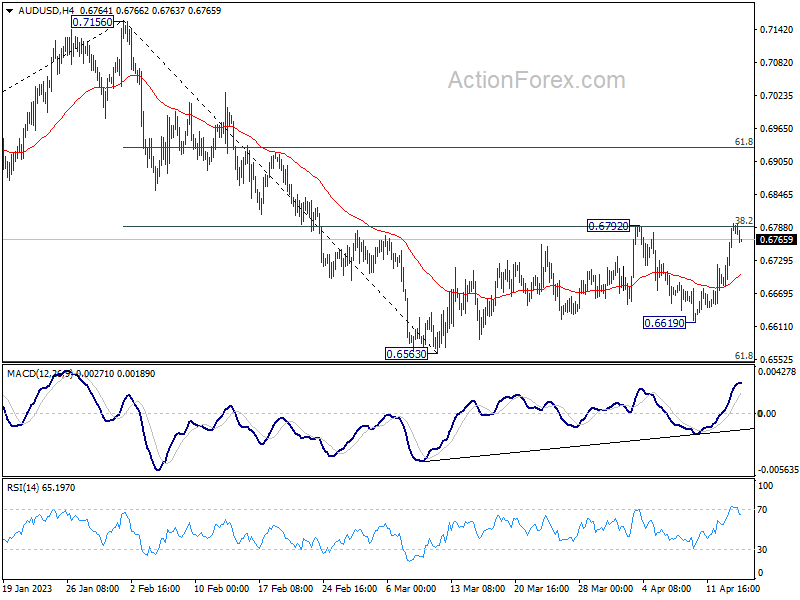
Immediate focus is now on 0.6792 resistance in AUD/USD. Decisive break there will resume the whole rebound from 0.6563 and target 0.7156 to 61.8% projection of 0.7156 to 0.6563 at 0.6929. Nevertheless, rejection by 0.6792 will maintain near term bearishness for another fall through 0.6563, to resume whole decline from 0.7156.
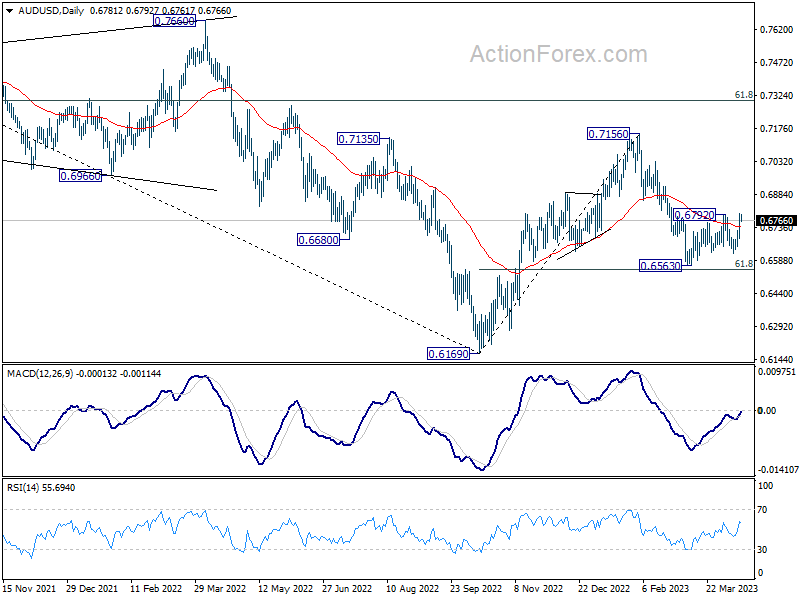
In the bigger picture, as long as 61.8% retracement of 0.6169 to 0.7156 at 0.6546 holds, the decline from 0.7156 is seen as a correction to rally from 0.6169 (2022 low) only. Another rise should still be seen through 0.7156 at a later stage. However, sustained break of 0.6546 will raise the chance of long term down trend resumption through 0.6169 low.
BTCUSD Elliott Wave: Forecasting The Rally From Intraday Equal Legs Area
Hello fellow traders. In this technical article we’re going to take a quick look at the Elliott Wave charts of Bitcoin BTCUSD . As our members know, BTCUSD is showing impulsive bullish structure in the cycle 15431 low. We have been calling for the rally in the cryptocurrency after 3 waves pull back. Our team recommended members to avoid selling Bitcoin , while keep favoring the long side. In the further text we are going to explain the Elliott Wave Forecast.
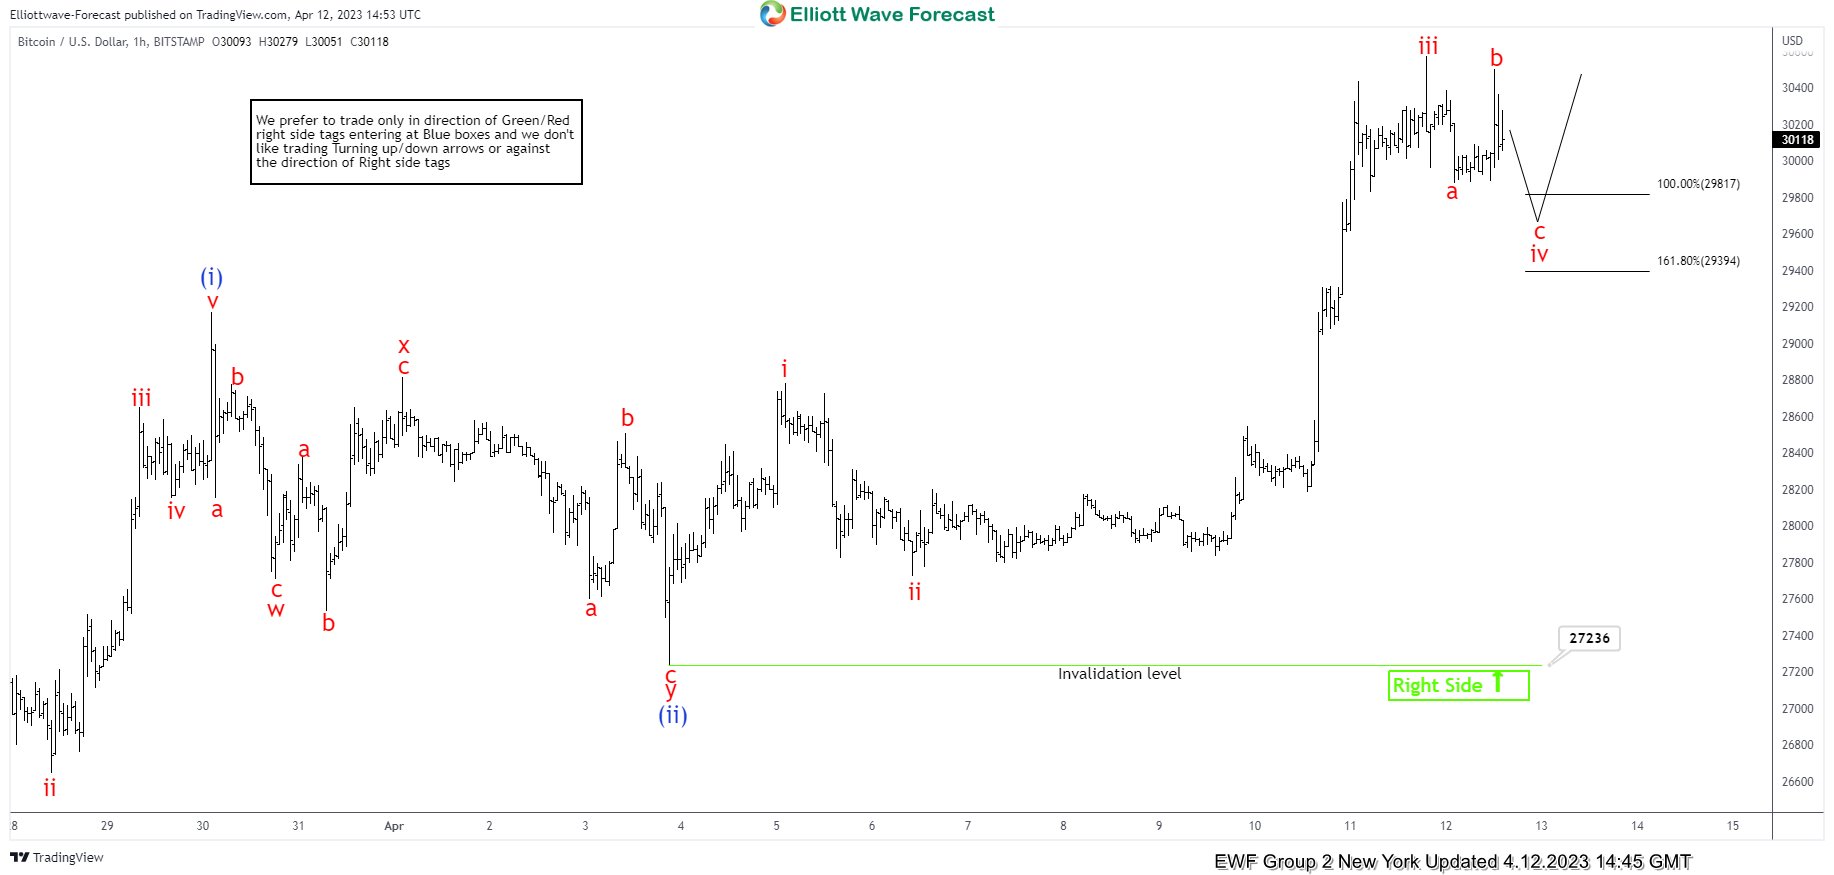
Bitcoin ( BTCUSD ) Elliott Wave 1 Hour Chart 4.12.2023
Cycle from the 27236 low looks impulsive, however as of right now we see only 3 waves up. We assume wave iv red pull back is still in progress. Once correction completes BTCUSD should ideally see another leg up to complete the proposed short term cycle as 5 waves. At the moment structure of the pull back looks incomplete. We are calling for another leg down toward 29817-29394 ( buyers area). We don’t recommend selling it and prefer the long side. The crypto is expected to find buyers in 3,7,11 swings. We expect to see at least 3 waves bounce from that zone or further rally toward new highs ideally.
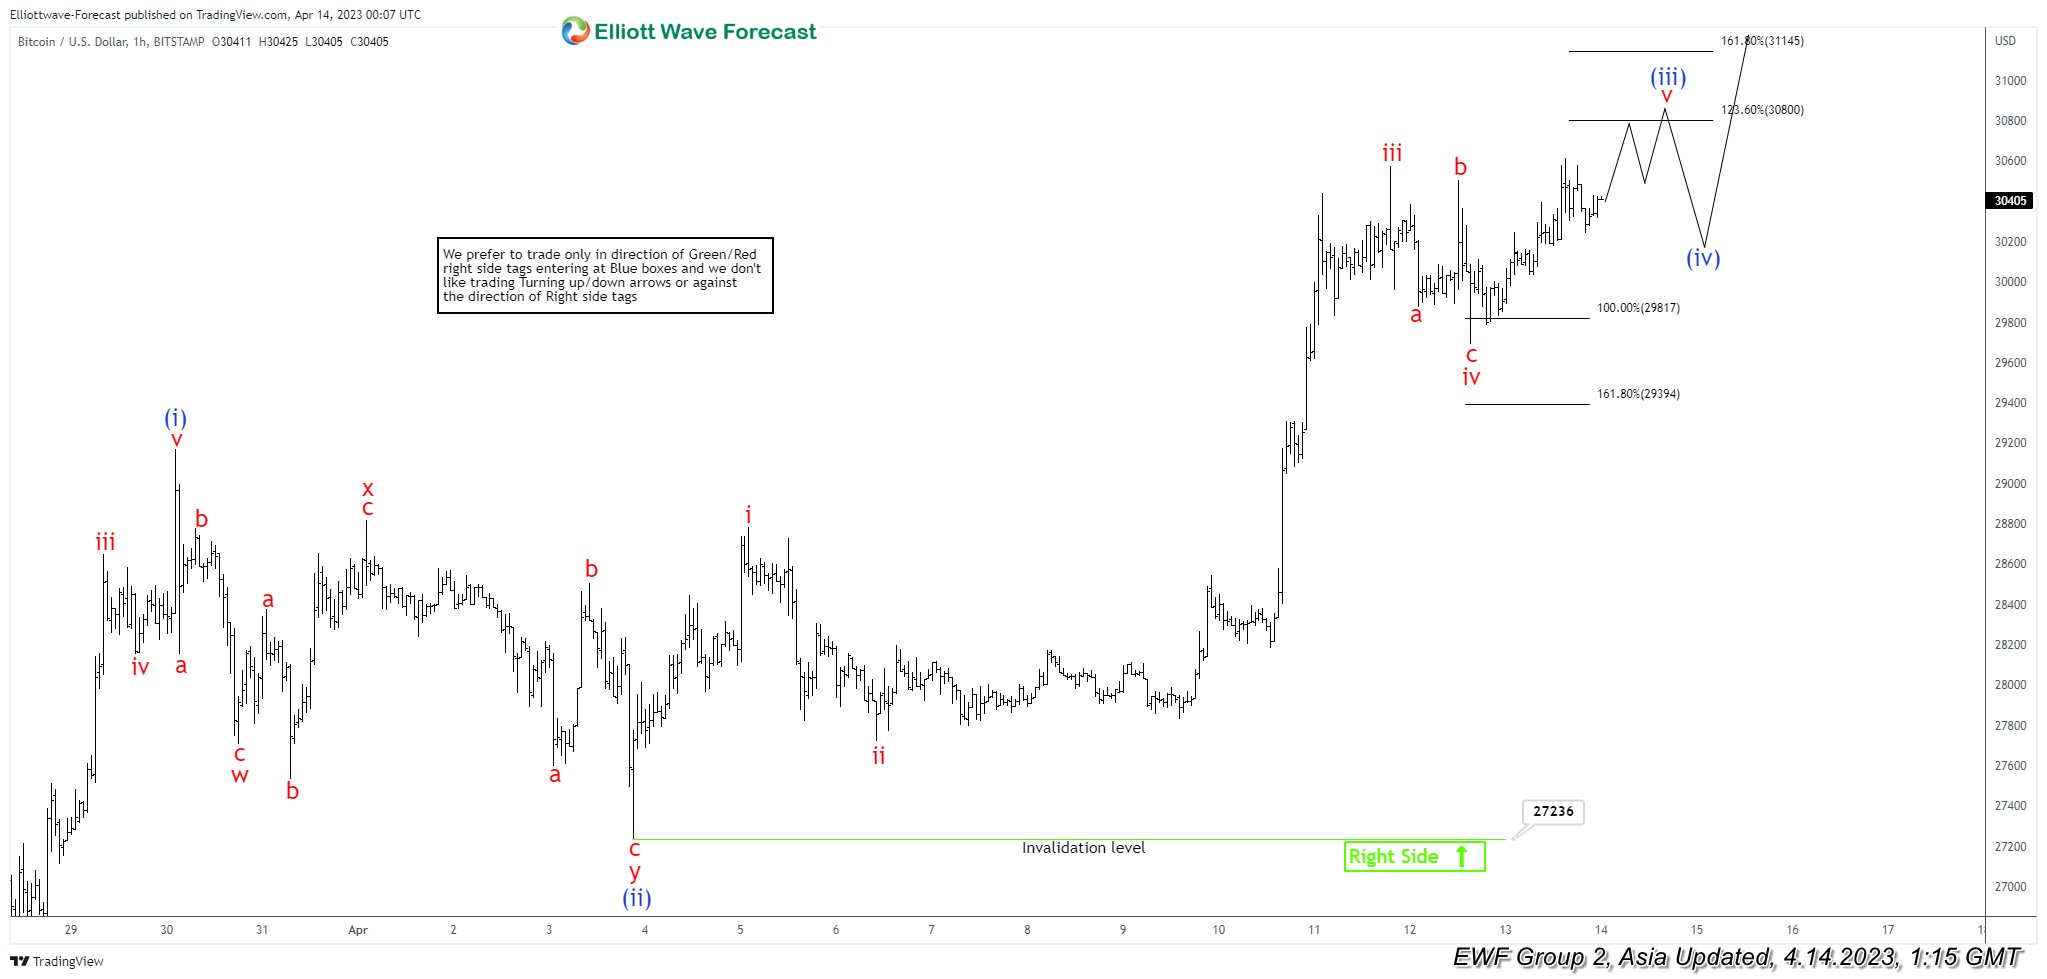
Bitcoin ( BTCUSD ) Elliott Wave 1 Hour Chart 4.14.2023
BTCUSD made the decline toward marked equal legs area : 29817-29394. Bitcoin found buyers and we are getting good reaction from there. It broke previous peak already, confirming v red of (iii) blue is in progress toward 30800-31145 area.
USD/JPY: Increased Downside Risk Under Daily Cloud
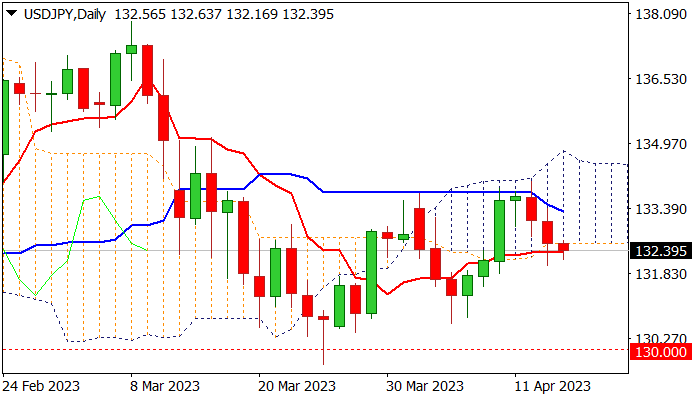
Near-term action holds in red for the third consecutive day, as bears regained control after a triple upside rejection at daily Ichimoku cloud top.
Today’s extension below daily cloud base (132.56) and daily Tenkan-sen (132.33) adds to downside risk, with close below these levels needed to confirm scenario.
South-heading indicators on daily chart and weekly momentum about to break into negative territory, contribute to negative near-term outlook, along with long upper shadow on weekly candle which also points to increased pressure.
Fundamentals are also negative for the dollar, as weaker than expected recent economic data suggest that the Fed may take a breather in hiking rates and also warn that economy may enter a mild recession.
Sustained break below daily cloud base would increase risk of retest of pivotal support at 130.62 (Apr 5 trough), loss of which will signal a double top at 133.80 zone and open way for acceleration through key supports at 130.00/129.64 (psychological / Mar 24 spike low).
Caution on repeated failure to clear daily cloud base which would sideline immediate downside risk but keep bears in play while the action stays below daily Kijun-sen (133.31).
Lift above 133.80 platform and daily cloud top will be a game changer.
Res: 133.06; 133.31; 133.80; 134.78.
Sup: 132.01; 131.30; 130.62; 130.00.
GBPJPY Storms to Fresh 3-Month High
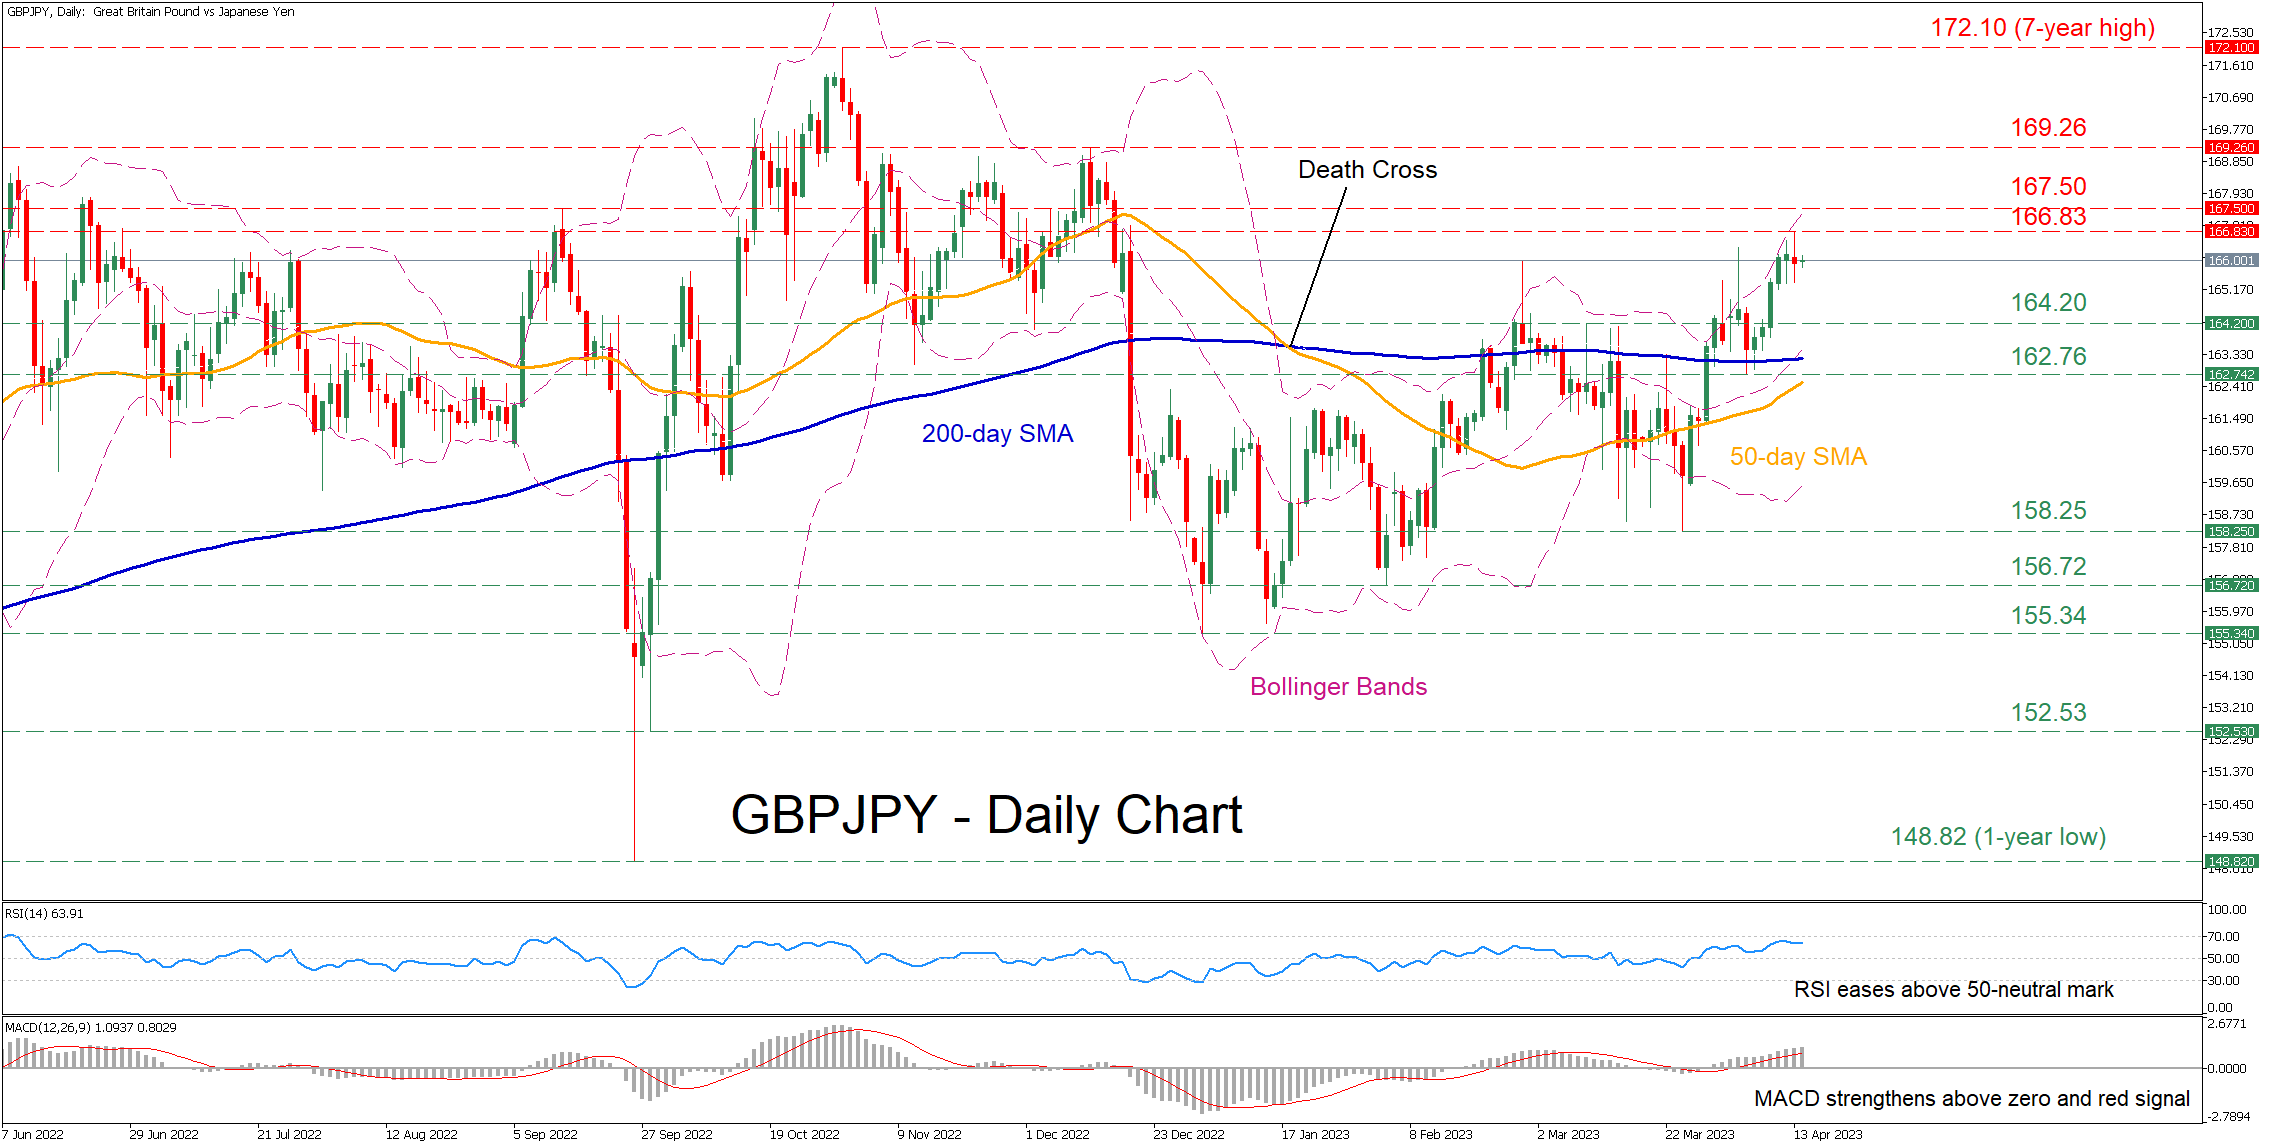
GBPJPY has been edging higher in the short term, posting a fresh three-month high of 167.50 on Thursday. Moreover, the ascending 50-day simple moving average (SMA) is positively closing the gap with the 200-day SMA, where a potential golden cross may help the pair extend its advance.
The momentum indicators are endorsing a bullish near-term bias. Specifically, the RSI has flatlined above its 50-neutral mark, while the MACD histogram is strengthening above both zero and its red signal line. However, the pair is currently trading near its upper Bollinger band, hinting that this recent rally might have reached overbought conditions.
If buying pressures persist, the bulls could initially attempt to propel the price above the recent three-month high of 166.83. Surpassing that zone, the pair could ascend towards the September peak of 167.50 or higher to challenge the December resistance zone of 169.26. A violation of the latter might open the door for the seven-year high of 172.10.
On the flipside, if the positive momentum fades and the price reverses lower, the 164.20 region, which previously served as resistance, could now act as support. Should that floor collapse, the price could test the April support of 162.76 before the March bottom of 158.25 appears on the radar. Further declines could then cease at the 156.72 hurdle.
In brief, GBPJPY has been exhibiting some strength lately, jumping to its highest levels since December 2022. Moving forward, the pair is likely to adopt a sideways pattern until the completion of a golden cross between its SMAs enables it to move even higher.
Ether Accelerates After the Hard Fork
Market Picture
The cryptocurrency’s market capitalisation rose 4.3% in the last 24 hours, hitting $1.29 trillion. Ether’s rally is successfully pulling most of the market with it.
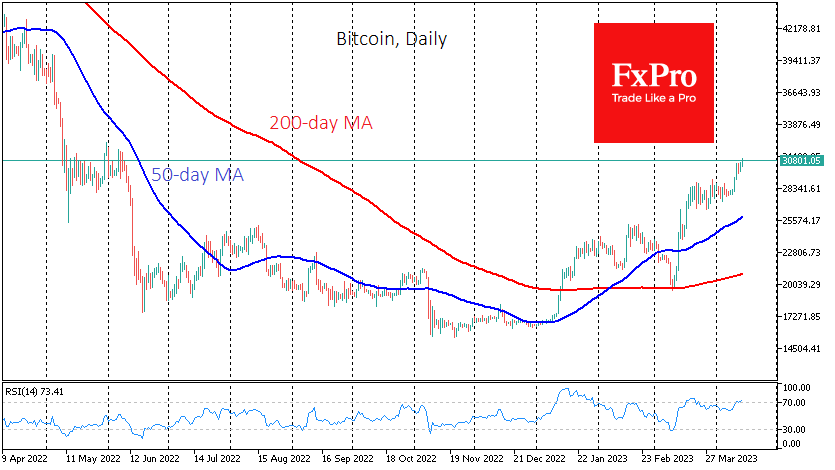
Bitcoin is up 2.4% overnight, underperforming the market but revisiting last June’s highs near $30.8K.
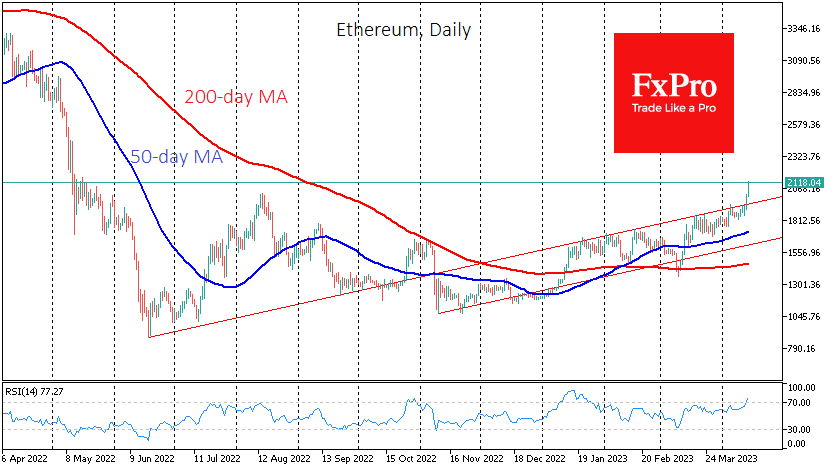
Ethereum is up more than 10% overnight, trading above $2100. This is its highest level since last May. The successful activation of the Shapella hard fork triggered the rally. The update was activated on the night of the 12th at 22:30 GMT, allowing withdrawal from the stacking. Contrary to fears, this did not pressure the ETH exchange rate but accelerated the upward trend in December.
According to Nansen, complete withdrawals are available for 7,948 validators with a total of 284,622 ETH (more than $546 million) in their balances. The total assets in the stack exceed 18 million ETH. However, 56% of the validators’ addresses need the 0x01 prefix required to unlock assets.
News background
Attorney John Deaton, who defends the interests of XRP cryptocurrency owners, believes that after the Ethereum network switches to the PoS consensus algorithm, officials may recognise ETH as security.
Web3 attorney Jess Hynes said that the SEC would continue to tighten regulation of cryptocurrencies in the US. In his opinion, such measures are still necessary to protect investors.
Warren Buffett, the famous investor and head of Berkshire Hathaway, once again criticised Bitcoin, calling it an asset with no intrinsic value and suitable for gamblers.