

Sample Category Title
Elliott Wave Analysis: Lower Inflation Boosts Stocks and EUR/USD Upside Potential
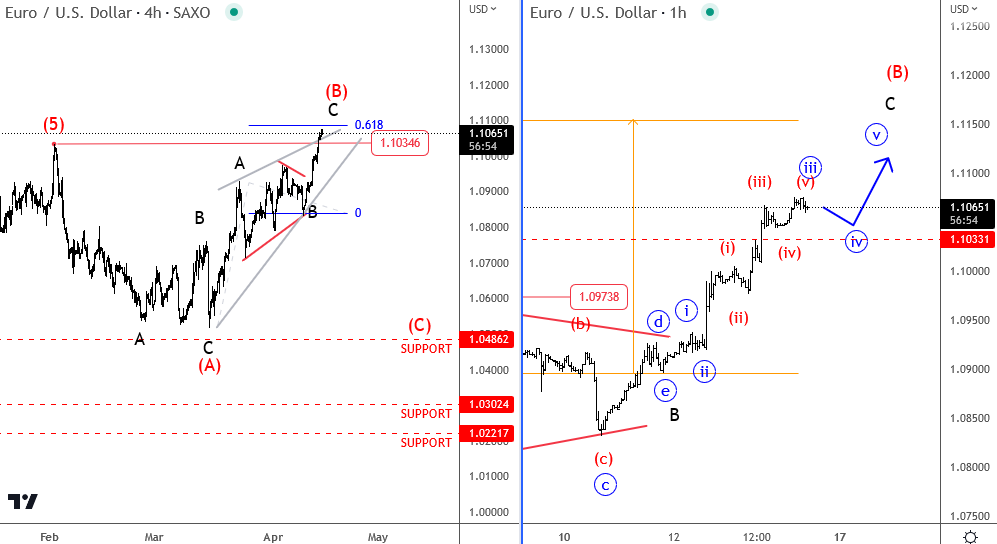
PPI figures fell in the US as reported yesterday so lower inflation helped stocks to found buyers while USD is coming down. However, US yields are not that volatile yet, mostly just sideways. But as long as stocks are up, USD can be headed even lower, especially vs the EUR where higher rates can still be needed to bring down inflation. Looking at the EURUSD pair, we see it trading at new 2023 highs. possibly still in C wave but with room for more upside to complete a five wave rise from 1.090, possibly near 1.11-1.1150 area. Any drop back below 1.0973 can be an indication for a temporary top.
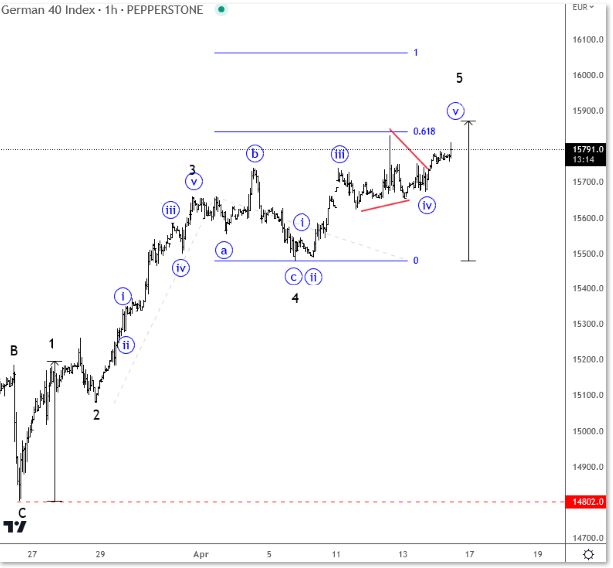
DAX is bullish, but approaching to fifth wave resistance
Gold Price Inches Higher While WTI Crude Oil Aims Fresh Increase
Gold price is rising and trading above the $2,030 resistance. WTI is consolidating and might aim for a fresh increase above $83.25.
Important Takeaways for Gold and Oil
- Gold price started a fresh increase above the $2,020 resistance against the US Dollar.
- A key bullish trend line is forming with support near $2,030 on the hourly chart of gold at FXOpen.
- Crude oil price also gained pace and was able to climb above the $82.00 resistance.
- There is a key contracting triangle forming with support near $82.00 on the hourly chart of XTI/USD at FXOpen.
Gold Price Technical Analysis
On the hourly chart of gold at FXOpen, the price formed a base above the $1,990 support zone against the US Dollar. The price started a decent increase and was able to clear the $2,000 resistance zone.
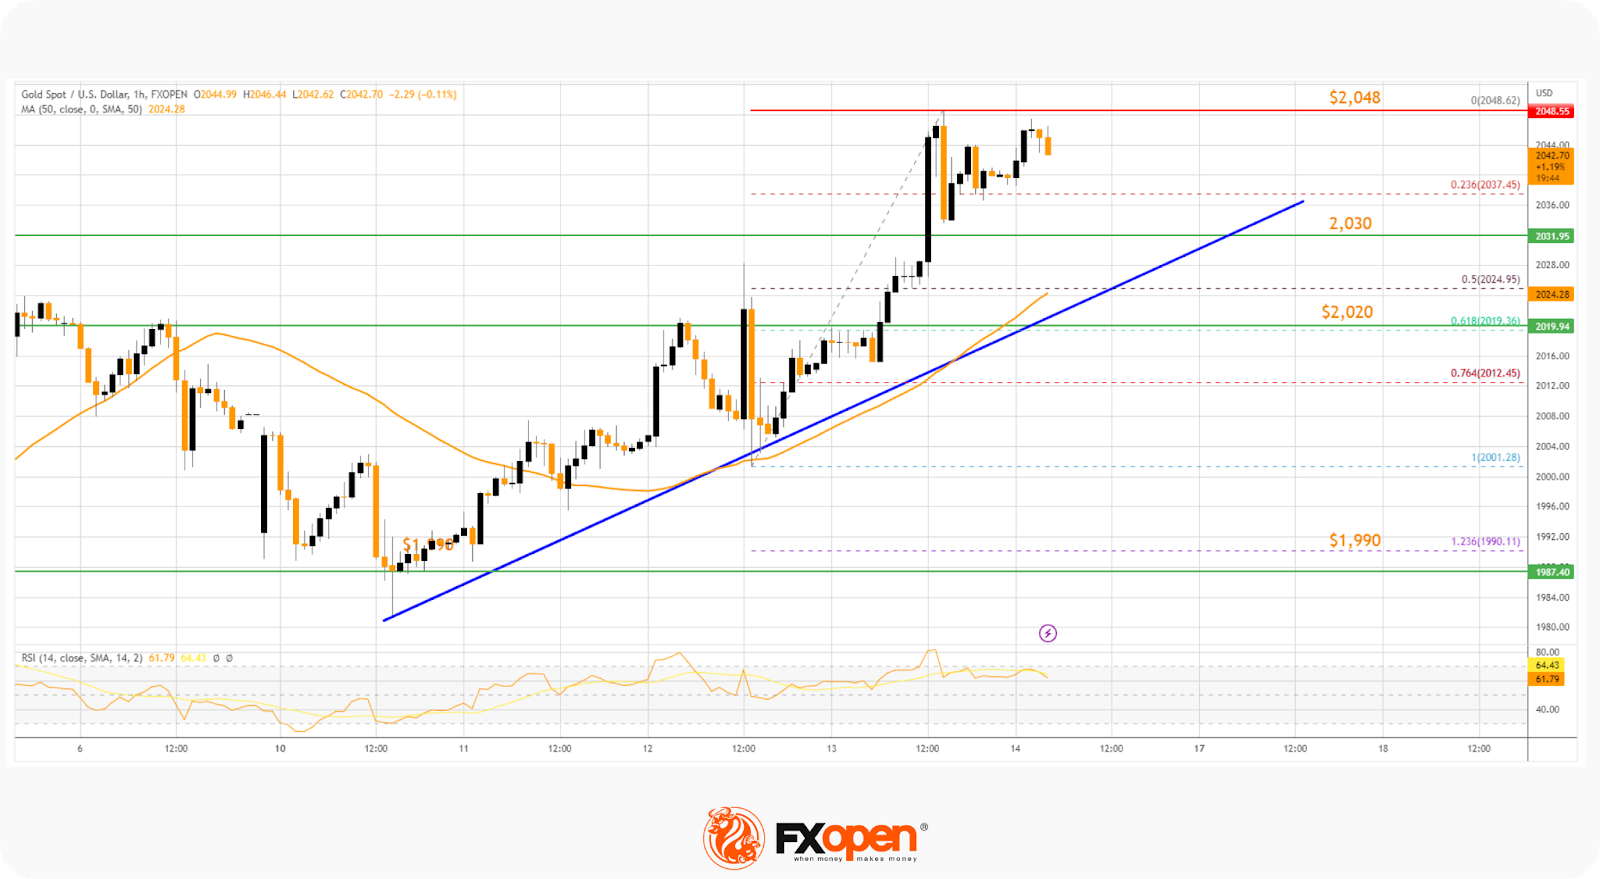
The upward move gained pace above the $2,020 and $2,030 resistance levels. Finally, the bears appeared near $2,050. A high is formed at $2,048, and the price is now consolidating gains.
Initial support on the downside is near the 23.6% Fib retracement level of the recent increase from the $2,001 swing low to the $2,048 high. The first major support is forming near a key bullish trend line at $2,030.
If there is a downside break below the trend line, the price might slide toward the 50-hour simple moving average at $2,025. The next major support is near the 61.8% Fib retracement level of the recent increase from the $2,001 swing low to the $2,048 high at $2,020.
On the upside, the bulls are facing resistance near $2,048. An upside break above the $2,048 resistance could send the price toward $2,060. Any more gains may perhaps set the pace for an increase toward the $2,080 level.
Oil Price Technical Analysis
On the hourly chart of XTI/USD at FXOpen, the price gained pace above the $81.00 resistance zone against the US Dollar. The price climbed above the $82.00 resistance to move into a positive zone.
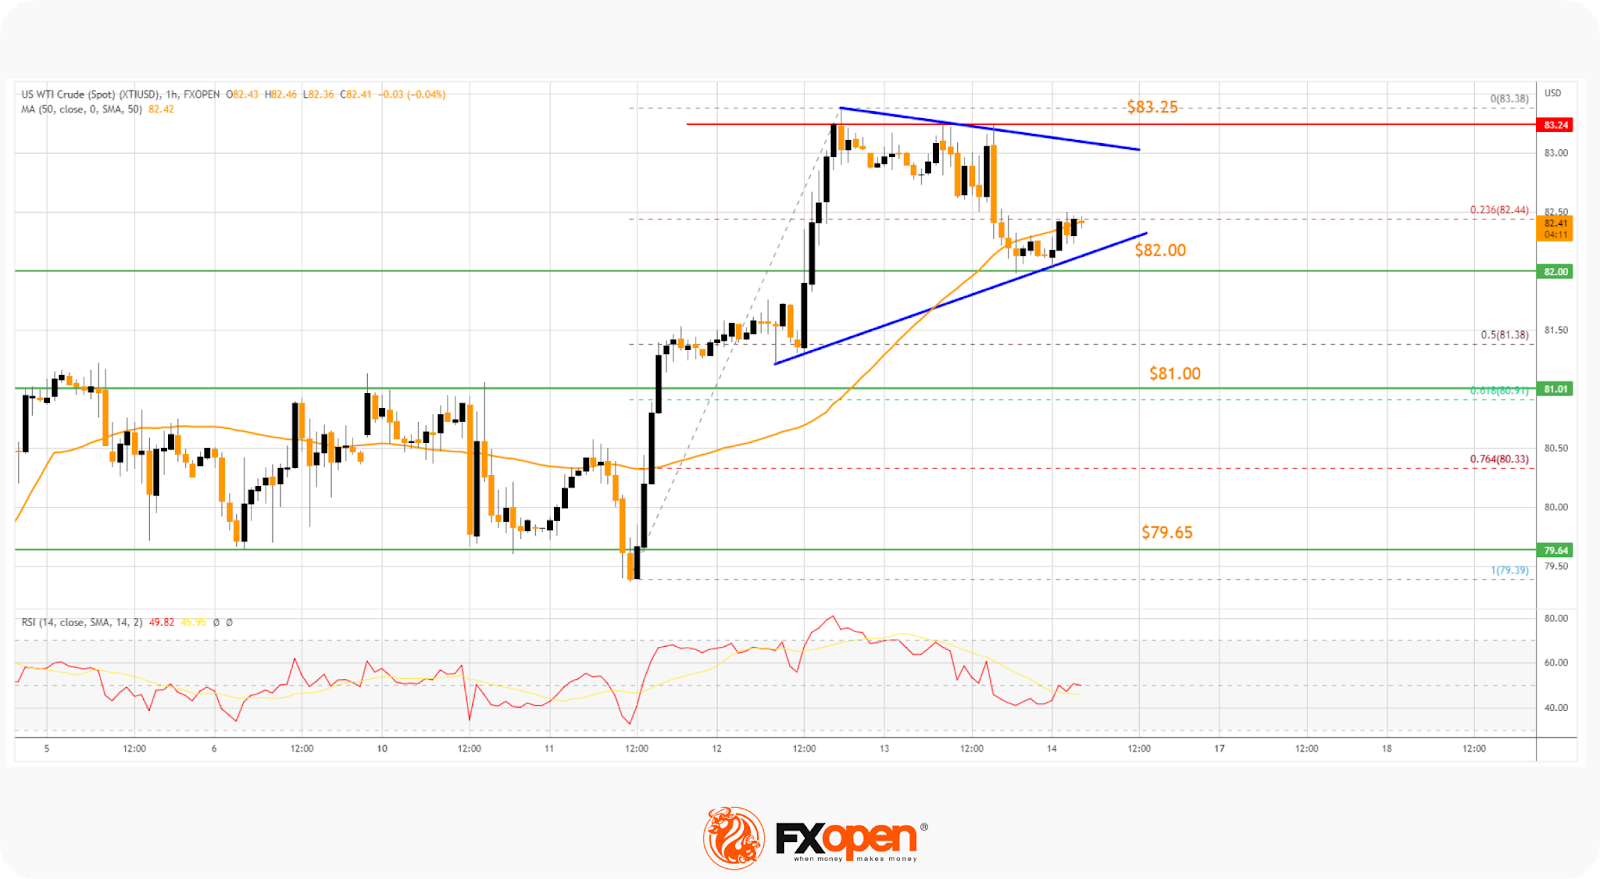
A high was formed near $83.83 before the price corrected lower. There was a move below the 23.6% Fib retracement level of the upward move from the $79.39 swing low to the $83.38 high. However, the bulls were active near the $82.00 support.
The price is now trading near the 50-hour simple moving average at $82.45. There is also a key contracting triangle forming with support near $82.00.
On the upside, resistance is seen near the triangle’s upper trend line at $83.00. The first major resistance is near the $83.25 level, above which the price might accelerate higher toward $84.20 or even $85.00. Any more gains might send the price toward the $86.50 level in the coming sessions.
On the downside, support is near the $82.00 level. The next major support is near the 61.8% Fib retracement level of the upward move from the $79.39 swing low to the $83.38 high at $81.00.
If there is a downside break, the price might decline toward $79.65. Any more losses may perhaps open the doors for a move toward the $75.00 support zone.
EUR/USD Technical Analysis
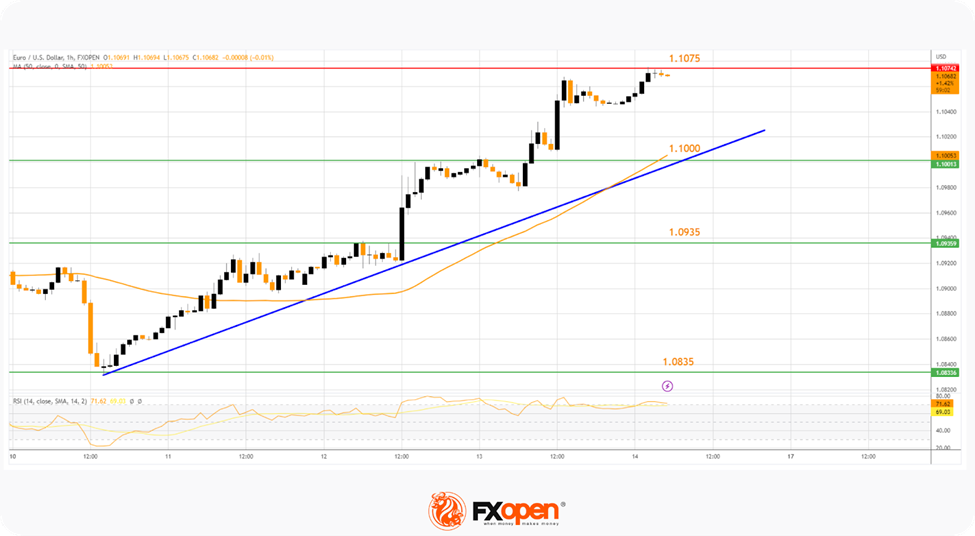
On the hourly chart at FXOpen, the Euro started a fresh increase from the 1.0835 support zone against the US Dollar. The EUR/USD pair climbed above the 1.0935 resistance to move into a bullish zone.
The pair settled above the 50-hour simple moving average at 1.1000. It is now showing positive signs and consolidating in a tight range. On the upside, immediate resistance is near the 1.1075 level.
The next major resistance is near the 1.1120 level. A break above the 1.1120 resistance zone could spark another strong increase. In the stated case, it could rise toward the 1.1200 resistance.
Conversely, the pair might start a downside correction from 1.1075. Initial support is near 1.1000, coinciding with the 50-hour simple moving average and a connecting bullish trend line. Any more losses might send the pair towards 1.0935 in the near term.
Cliff Notes: Constructive Developments for the Consumer
Key insights from the week that was.
Developments in Australia and the US this week were supportive of our views for the RBA and the FOMC.
The Westpac-MI Consumer Sentiment survey delivered a positive update on confidence. The RBA’s decision to leave the cash rate unchanged in April proved to be a major support, resulting in the headline index surging 9.4% in the month, up from 78.5 to 85.8. This is also highlighted not only by the upswing across the survey’s housing sub-indexes – confidence among mortgage holders up 12.2%; the ‘time to buy a dwelling’ index up 8.2%; and house price expectations up 16.7% – but also by the broader recovery in household’s expectations around the near-term economic outlook and family finances. While these developments certainly mark a clear improvement from the deeply pessimistic reads observed over February and March – a situation that was only comparable to the major economic dislocations in the 1980s-90s – at 85.8, the headline index is still characterised as being in weak territory.
As discussed by Chief Economist Bill Evans, survey evidence from prior tightening cycles suggests that upon more convincing evidence that the RBA Board will pause policy for a sustained period, there is greater scope for Consumer Sentiment to return towards more normal levels. For now, consumers remain circumspect around whether the RBA’s April pause will last; a view which we share, as we continue to forecast one final 25bp rate hike at the May Board meeting.
The March labour force survey is also consistent with our view, delivering an upside surprise. The lift in the participation rate (up 0.9ppt to 66.74%) saw the labour force grow by 51.4k, broadly matching the gain in employment of 53.0k. The labour market remains extremely tight, with the unemployment rate surprising to the low side for a second consecutive month, unchanged at a near-50 year low of 3.5%. The employment-to-population ratio rose to a near-record high of 64.4%. Overall, the update confirmed that businesses’ appetite for new workers remains robust, and with continued gains in labour supply growth – as also evinced by the underlying strength in overseas arrivals – labour force outcomes have been able to remain sound and above expectations at this stage of the cycle.
Before moving offshore, a quick note on businesses. The latest NAB business survey provided further evidence of: an economy operating at a high level of capacity; an economic slowdown over the past half year; and a fragile and pessimistic mood amongst businesses. The business conditions index declined once again, falling by 1pt to +16 in March, well down from around +24 last September and reflective of the loss of momentum within the Australian economy as a consequence of high inflation and rapid interest rate rises. Having lifted 3pts to a still subdued -1, the business confidence index may receive some further reprieve from the RBA’s decision to pause in the April survey; however, the greater concern for businesses is the downbeat outlook for domestic demand and the fragile and volatile global economy.
Turning to the US, two key data reports were released this week. Non-farm payrolls data indicated that 236k jobs were created in March (219k net of revisions to the prior two months), providing a benign read on the health of the labour market – strong enough to limit concern over imminent recession, soft enough to ward off concern over additional inflation pressures. While household employment rose by a much larger 577k in March, this outsized gain only partly offsets the persistent relative weakness in household employment versus payrolls over the past year. Also notable was that the participation rate continues to rise, the increase in the labour force offsetting 480k of the 577k jobs created in the month. Offering further support to the idea that labour demand and supply are now close to balanced, hourly earnings rose by a modest 0.3% in the month, and weekly hours worked edged down by another 0.1hrs to be 0.3hrs lower than a year ago. It is also worth emphasising that the ISMs are pointing to a continued downtrend in job creation which, given the uncertainties around the banking system, is likely to gather pace over the coming months.
On the March CPI report, core inflation (excluding food and energy) was in line with expectations, the 0.4% monthly gain nudging the annual rate slightly higher to 5.6%. The main reason for the ‘stickiness’ in the core measure is due to shelter inflation, which is being held up by the cost of short-term accommodation (2.7%). For the policy outlook, this is not a concern as all leading indicators of rents point to an abrupt deceleration ahead. The remaining detail was also constructive. Other segments of core services – besides shelter – is showing promising signs, with annual inflation across transportation, medical care and recreation all continuing to decelerate. Positively for households, energy prices posted a larger-than-expected decline of 3.5% and grocery prices fell by 0.3%, resulting in headline inflation coming in below expectations at 0.1% in the month.
For the FOMC, these updates provide a balanced look into the progress on inflation and underlying pressures within the economy. We continue to believe that the prudent path for policy is to allow inflation to continue its deceleration without raising the risk of materially weaker growth. With the fed funds rate already at a heavily contractionary 4.875%, policy should remain on hold over 2023 before interest rates can be brought back near neutral over 2024 and 2025, allowing growth to slowly accelerate back towards trend.
DXY Testing the 100.82 YtD Low
Markets
Yesterday’s second tier US data (weekly jobless claims, PPI) undershot consensus again. It strengthened market conviction of the Fed’s tightening cycle not only coming to a close but that it is about to go in reverse soon to support a slowing economy. Short-term US yields initially dropped 6-7 bps shortly after the release before recovering again. Yields at longer maturities ended the day even 5.4-6.3 bps higher (10-y/30-y segment), reflecting hopes of the expected cutting cycle to boost the economic recovery going forward. The spread between the 10-y and 2-y over the past month halved, from -108 bps early March – the most since the early eighties – to -52 bps yesterday. German yields joined the US trend lower after the data but partly missed out on the late-session recovery at the other side of the Atlantic. Speeches from ECB members Kazaks and Holzmann came after European closing hours too. Both favoured another 50 bps May rate hike. The US dollar stayed in the defensive on currency markets amid a bright equity mood (Nasdaq finished 2% higher). DXY (trade-weighted) slipped from 101.5 to 101.01. EUR/USD shot op from below 1.10 to 1.1046, the highest close since end March 2022. We fear there is little that can save the dollar short-term, neither fundamentally nor technically. The economic calendar contains US retail sales and U. of Michigan consumer confidence. But given the market’s current reaction function, all the greenback can hope for is that is does not surprise to the downside. DXY is testing the 100.82 YtD low during the Asian session this morning. A break lower paves the way towards a support zone around 99.4. EUR/USD extends gains to 1.107 with from a technical point of view little in the way for a return to 1.1185. The picture for rates turned a bit more neutral in our view. It’s all tentative, but yesterday’s intraday price action at the front end of the curve suggests markets currently think enough cuts are priced in for the time being. For longer maturities, the bad economic news yesterday was eventually good news for yields. This combines with rates across all maturities consistently finding solid support from the lows set at the height of the financial turmoil mid-March. There are two risks to this hypothesis today: a huge miss in the data and/or the earnings season kickoff by the financial sector. Especially the latter’s effect on equity markets is critical. Another series of Fed and ECB speakers serve as a wildcard for trading. It took a while, but we’re finally seeing some movement in sterling as well, even as it is a non-autonomous, USD-inspired one. EUR/GBP rose for a third day straight to 0.8821 with the pound unable to profit from BoE Pill’s warning for a positive demand shock emerging (see headline below).
News Headlines
Bloomberg reports that Republican House Speaker McCarthy is preparing to unveil a proposal next week which would suspend the US debt ceiling for a year in return for spending concessions. The plan calls for a House vote in late May according to people familiar with talks. In return for the vote, non-defense discretionary spending would have to stay at roughly the same level as fiscal year 2022 and grow 1% per year over 10 years. The GOP plan will include other spending cut proposals and regulations changes which could form the basis of separate budget talks towards late May 2024. US President Biden and Democrats have long called for an unconditional increase of the US debt limit. US Treasury Secretary Yellen warned that the US debt ceiling could be hit as soon as early June. Without a deal to raise it, the country is at risk of default. CDS prices to insure against the risk and short term US money market rates stretching beyond June are starting to show signs of rising unease over the issue in the investor community.
UK chief economist Pill said that the less pessimistic outlook on UK unemployment is supportive for consumption given the relatively strong relationship between unemployment and precautionary saving. That gives space for a positive demand shock which may cloud the picture a return of double digit inflation towards the central bank’s 2% inflation target. Pill is worried about inflation (10.4% Y/Y) but the Bank of England needs to recognize there is scope to do too much as well as too little. He wasn’t lured into giving guidance for the May policy meeting (including new Monetary Policy Report) and added that the string of 11 interest rate hikes (to 4.25%) was weighing on inflation. UK money markets discount a 4.5-4.75% policy rate peak. The MPC is divided on whether the economy needs higher unemployment to return inflation to target.
USD/CAD Daily Outlook
Daily Pivots: (S1) 1.3299; (P) 1.3373; (R1) 1.3414; More....
Intraday bias in USD/CAD stays on the downside fall the momentum. Fall from 1.3860, which is seen as the third leg of the corrective pattern from 1.3976, is in progress for 1.3224/61 support zone. Strong support is expected there to complete the corrective pattern and bring rebound. On the upside, above 1.3405 support turned resistance will turn intraday bias neutral first. Further break of 1.3552 will indicate near term reversal.
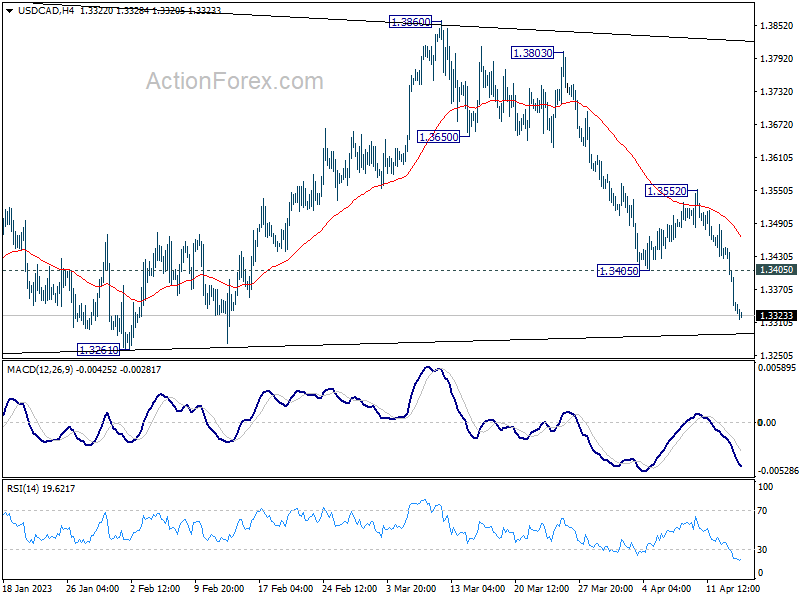
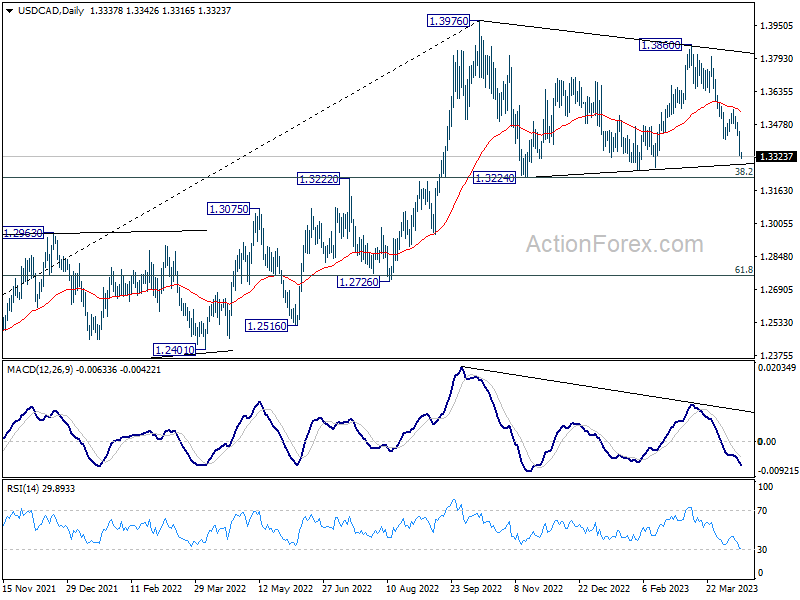
In the bigger picture, the up trend from 1.2005 (2021 low) is still in progress. Break of 1.3976 will confirm resumption and target 61.8% projection of 1.2401 to 1.3976 from 1.3261 at 1.4234. Firm break there will pave the way to long term resistance zone at 1.4667/89 (2016, 2020 highs). On the downside, sustained break of 55 week EMA (now at 1.3282) is needed to confirm medium term topping. Otherwise, outlook will remain bullish even in case of deep pull back.
Dollar Dives as Disinflation Solidifies Fed’s Tightening Cycle End; Stocks Rise
As disinflation process in the US picks up steam, Dollar continues its relentless descent, fueling the belief that Fed's tightening cycle is close to its curtain call. This evolving sentiment has not only lifted US stocks overnight but also spilled over into Asian session, painting a positive picture for the markets. Despite its recent woes, the greenback is not this week's weakest performer; that dubious honor goes to Yen, bogged down by unwavering dovish stance of the new BoJ Governor. Meanwhile, Swiss Franc basks in the limelight as the strongest contender, trailed by Aussie, Euro, and Sterling. Amid BoC's pause earlier in the week, Canadian Dollar remains a mixed bag.
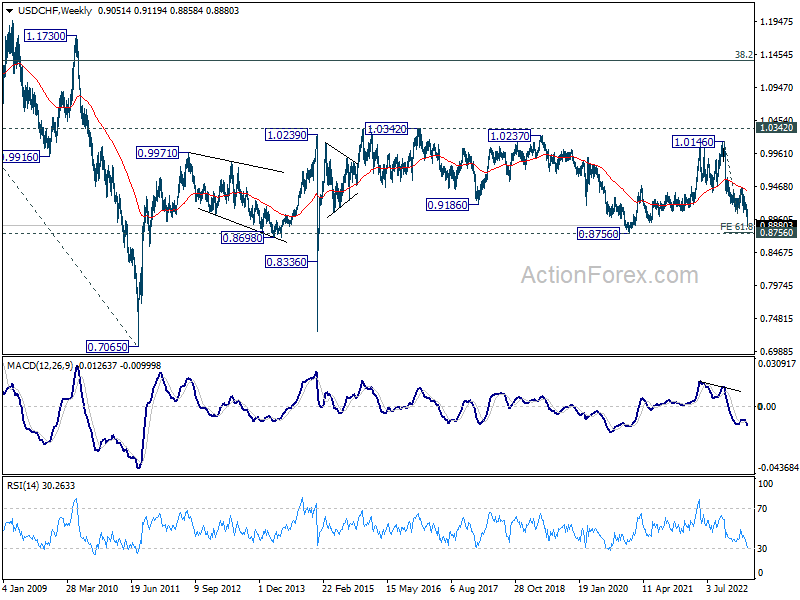
On the technical front, USD/CHF is quickly approaching an important support level at 0.8756 (2021 low). A test on the level could happen in weeks, or even days depending on the intensity of the current selloff in the greenback. Robust support is expected there to bring sustainable rebound back to 0.9058/9439 resistance zone, at least on the first attempt. However, decisive break of the support will break USD/CHF out of a long term range that started back in early 2010s. That would be a significant development if realized.
In Asia, at the time of writing, Nikkei is up 1.14%. Hong Kong HSI is up 0.09%. China Shanghai SSE is up 0.43%. Singapore Strait Times is up 0.34%. Japan 10-year JGB yield is down-0.0048 at 0.461. Overnight, DOW rose 1.14%. S&P 500 rose 1.33%. NASDAQ rose 1.99%. 10-year yield rose 0.11 to 3.452.
DOW surges as disinflation gains momentum and fed's tightening cycle nears end
US stocks closed significantly higher overnight, with DOW and S&P 500 extending their near-term rallies. This week's data supported the view that disinflation is gaining momentum in the US, as evidenced by the notable downside surprise in US PPI and the below-expectation headline CPI readings for March. Additionally, jobless claims data indicated that job market remains stable rather than overheated. The overall picture suggests that while inflation is slowing, the economy isn't crashing. These factors also contribute to the case that Fed's tightening cycle is nearing its end, although it remains uncertain when Fed will reverse course.
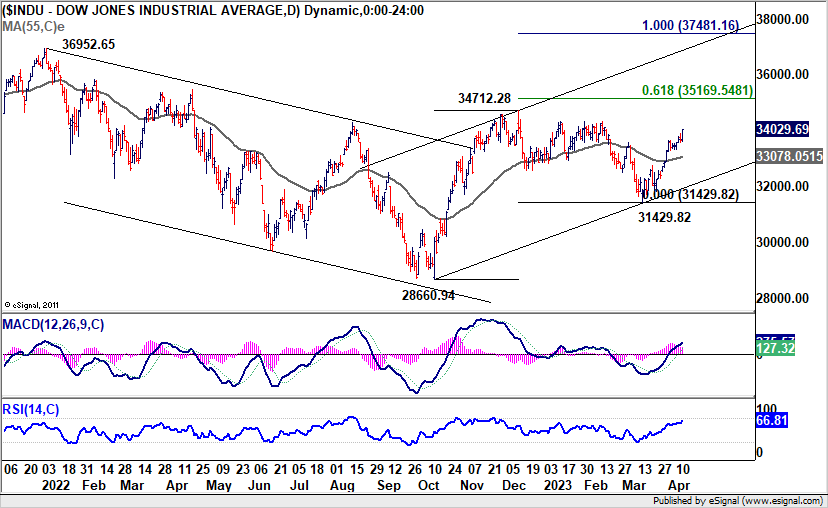
Technically, DOW's corrective pattern from 34712.28 should have completed with three waves down to 31429.82. Further rise is now expected as long as 55 D EMA (now at 33078.05) holds. Break of 34712.28 resistance is envisaged as the rally continues. The test for the near term lies in 61.8% projection of 28660.94 to 34712.28 from 31429.82 at 35169.54. Decisive break there could add more fuel to the rally and prompt upside acceleration through. 36952.65 high later in the year.
BoJ Ueda foresees core inflation slowing, reiterates commitment to ultra-loose monetary policy
BoJ Governor Kazuo Ueda, who recently attended the G20 finance leaders' meeting in Washington, expects core consumer inflation in Japan, currently around 3%, to slow below 2% by the latter half of this fiscal year. Ueda emphasized the central bank's commitment to maintaining ultra-loose monetary policy in order to achieve its 2% inflation target in a stable and sustainable manner.
Ueda believes that "as our base scenario is for global growth to pick up after a period of slowdown, Japan's wages will likely keep rising." He added that the BoJ's forecasts already factor in the possibility of a global economic slowdown, but a severe global recession is not considered in the baseline projection.
As for the upcoming April policy meeting, Ueda said, "It's been just a week since I took office and now I am on a business trip. I'll think about it closely once I'm back." Market participants are closely watching the BoJ's first policy meeting under Ueda's leadership on April 27-28, where the board will release fresh quarterly growth and inflation forecasts extending through fiscal 2025.
NZ BNZ manufacturing dropped to 48.1, sector faces headwinds
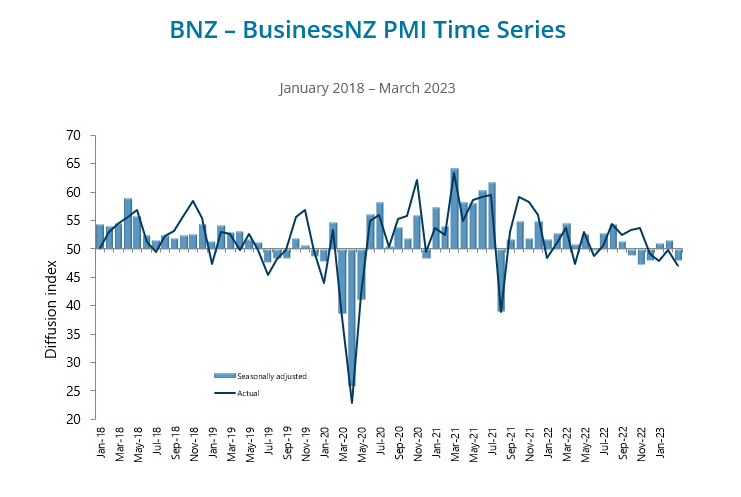
New Zealand's BusinessNZ Performance of Manufacturing Index fell from 51.7 in February to 48.1 in March, slipping back into negative territory after briefly reaching positive levels in January and February. The decline in the index signals challenges for the manufacturing sector.
A closer look at the data reveals that production dropped from 48.7 to 43.3, its lowest level since August 2021. Employment shrank from 55.2 to 47.1, while new orders dipped from 51.5 to 46.7, matching November 2022 levels. Finished stocks decreased from 55.1 to 48.4, and deliveries rose slightly from 52.2 to 53.8.
Catherine Beard, BusinessNZ's Director of Advocacy, pointed out that the numbers behind the main March result indicate the manufacturing sector is facing significant headwinds. BNZ Senior Economist Craig Ebert added that although New Zealand's March PMI was disappointing, it was "not especially negative in the longer-term context" and was in line with global manufacturing readings.
Looking ahead
Swiss PPI is the only feature in the European session. Later in the day, main focus in US retail sales, and import prices, industrial production and U of Michigan consumer sentiment will be released. Canada will also release manufacturing sales.
USD/CAD Daily Outlook
Daily Pivots: (S1) 1.3299; (P) 1.3373; (R1) 1.3414; More....
Intraday bias in USD/CAD stays on the downside fall the momentum. Fall from 1.3860, which is seen as the third leg of the corrective pattern from 1.3976, is in progress for 1.3224/61 support zone. Strong support is expected there to complete the corrective pattern and bring rebound. On the upside, above 1.3405 support turned resistance will turn intraday bias neutral first. Further break of 1.3552 will indicate near term reversal.
In the bigger picture, the up trend from 1.2005 (2021 low) is still in progress. Break of 1.3976 will confirm resumption and target 61.8% projection of 1.2401 to 1.3976 from 1.3261 at 1.4234. Firm break there will pave the way to long term resistance zone at 1.4667/89 (2016, 2020 highs). On the downside, sustained break of 55 week EMA (now at 1.3282) is needed to confirm medium term topping. Otherwise, outlook will remain bullish even in case of deep pull back.
Economic Indicators Update
| GMT | Ccy | Events | Actual | Forecast | Previous | Revised |
|---|---|---|---|---|---|---|
| 22:30 | NZD | Business NZ PMI Mar | 48.1 | 51 | 52 | |
| 06:30 | CHF | Producer and Import Prices M/M Mar | -0.20% | -0.20% | ||
| 06:30 | CHF | Producer and Import Prices Y/Y Mar | 2.70% | 2.70% | ||
| 12:30 | CAD | Manufacturing Sales M/M Feb | -2.50% | 4.10% | ||
| 12:30 | USD | Retail Sales M/M Mar | -0.50% | -0.40% | ||
| 12:30 | USD | Retail Sales ex Autos M/M Mar | -0.40% | -0.10% | ||
| 12:30 | USD | Import Price Index M/M Mar | -0.20% | -0.10% | ||
| 13:15 | USD | Industrial Production M/M Mar | 0.20% | 0.00% | ||
| 14:00 | USD | Michigan Consumer Sentiment Index Apr P | 62.7 | 62 | ||
| 14:00 | USD | Business Inventories Feb | 0.20% | -0.10% |
DOW surges as disinflation gains momentum and fed’s tightening cycle nears end
US stocks closed significantly higher overnight, with DOW and S&P 500 extending their near-term rallies. This week's data supported the view that disinflation is gaining momentum in the US, as evidenced by the notable downside surprise in US PPI and the below-expectation headline CPI readings for March. Additionally, jobless claims data indicated that job market remains stable rather than overheated. The overall picture suggests that while inflation is slowing, the economy isn't crashing. These factors also contribute to the case that Fed's tightening cycle is nearing its end, although it remains uncertain when Fed will reverse course.
Technically, DOW's corrective pattern from 34712.28 should have completed with three waves down to 31429.82. Further rise is now expected as long as 55 D EMA (now at 33078.05) holds. Break of 34712.28 resistance is envisaged as the rally continues. The test for the near term lies in 61.8% projection of 28660.94 to 34712.28 from 31429.82 at 35169.54. Decisive break there could add more fuel to the rally and prompt upside acceleration through. 36952.65 high later in the year.
NZ BNZ manufacturing dropped to 48.1, sector faces headwinds
New Zealand's BusinessNZ Performance of Manufacturing Index fell from 51.7 in February to 48.1 in March, slipping back into negative territory after briefly reaching positive levels in January and February. The decline in the index signals challenges for the manufacturing sector.
A closer look at the data reveals that production dropped from 48.7 to 43.3, its lowest level since August 2021. Employment shrank from 55.2 to 47.1, while new orders dipped from 51.5 to 46.7, matching November 2022 levels. Finished stocks decreased from 55.1 to 48.4, and deliveries rose slightly from 52.2 to 53.8.
Catherine Beard, BusinessNZ's Director of Advocacy, pointed out that the numbers behind the main March result indicate the manufacturing sector is facing significant headwinds. BNZ Senior Economist Craig Ebert added that although New Zealand's March PMI was disappointing, it was "not especially negative in the longer-term context" and was in line with global manufacturing readings.
BoJ Ueda foresees core inflation slowing, reiterates commitment to ultra-loose monetary policy
BoJ Governor Kazuo Ueda, who recently attended the G20 finance leaders' meeting in Washington, expects core consumer inflation in Japan, currently around 3%, to slow below 2% by the latter half of this fiscal year. Ueda emphasized the central bank's commitment to maintaining ultra-loose monetary policy in order to achieve its 2% inflation target in a stable and sustainable manner.
Ueda believes that "as our base scenario is for global growth to pick up after a period of slowdown, Japan's wages will likely keep rising." He added that the BoJ's forecasts already factor in the possibility of a global economic slowdown, but a severe global recession is not considered in the baseline projection.
As for the upcoming April policy meeting, Ueda said, "It's been just a week since I took office and now I am on a business trip. I'll think about it closely once I'm back." Market participants are closely watching the BoJ's first policy meeting under Ueda's leadership on April 27-28, where the board will release fresh quarterly growth and inflation forecasts extending through fiscal 2025.