Sample Category Title
USD/JPY At Risk of Fresh Decline If It Breaks 132.00
Key Highlights
- USD/JPY reacted to the downside from the 133.75 resistance zone.
- It traded below a major bullish trend line with support near 132.90 on the 4-hour chart.
- EUR/USD rallied further above the 1.1000 resistance zone.
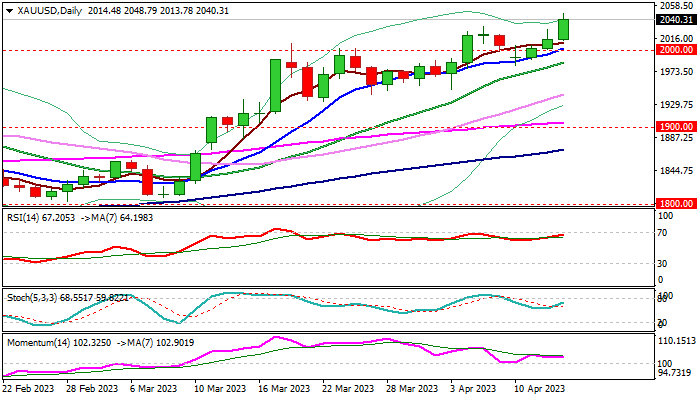
- Gold price started a fresh increase above the $2,020 resistance.
USD/JPY Technical Analysis
The US Dollar started a fresh decline after it failed to surpass 133.75 against the Swiss Franc. USD/JPY traded below the 133.20 support to start a bearish wave.
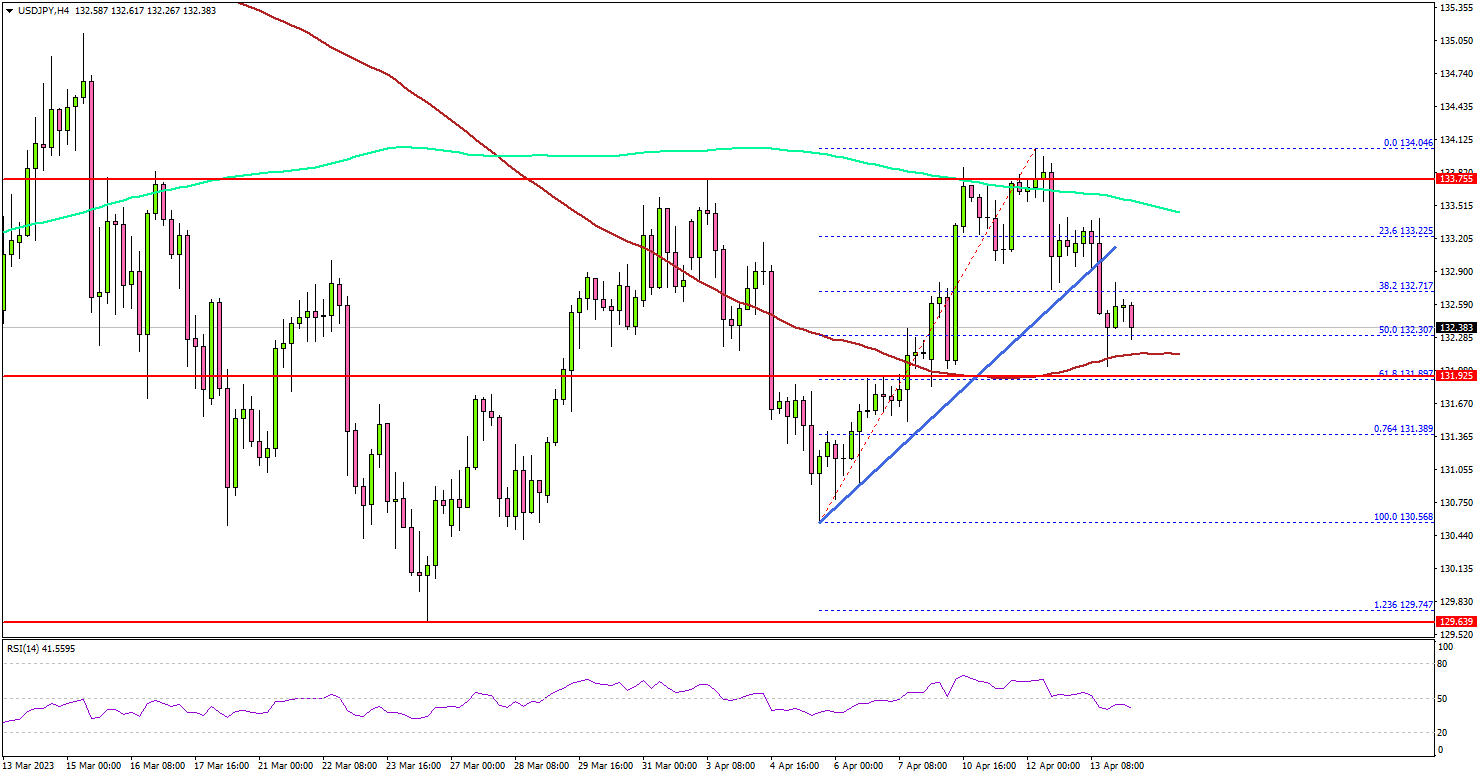
Looking at the 4-hour chart, the pair gained bearish momentum below the 133.00 support zone and settled below the 200 simple moving average (green, 4 hours).
There was also a break below a major bullish trend line with support near 132.90 on the same chart. The pair tested the 132.20 support and the 100 simple moving average (red, 4 hours). The next major support is near the 131.80 level, below which the pair might accelerate lower.
In the stated case, the pair may perhaps decline toward the 130.50 level. Any more losses might call for a test of the 129.80 support zone.
On the upside, the pair is facing resistance near the 133.00 level. The next key resistance is near the 133.75 zone. A clear move above the 133.75 resistance might send the pair toward the 134.50 zone. Any more gains might send the pair toward 135.00.
Looking at EUR/USD, there was a major upside break above 1.1000, and the pair traded to a new multi-week high above 1.1050.
Economic Releases
- US Retail Sales for March 2023 (MoM) – Forecast -0.4%, versus -0.4% previous.
- US Industrial Production for March 2023 (MoM) – Forecast 0.2%, versus 0% previous.
Elliott Wave Sequence Suggests GBPUSD Favors Higher & Remain Supported
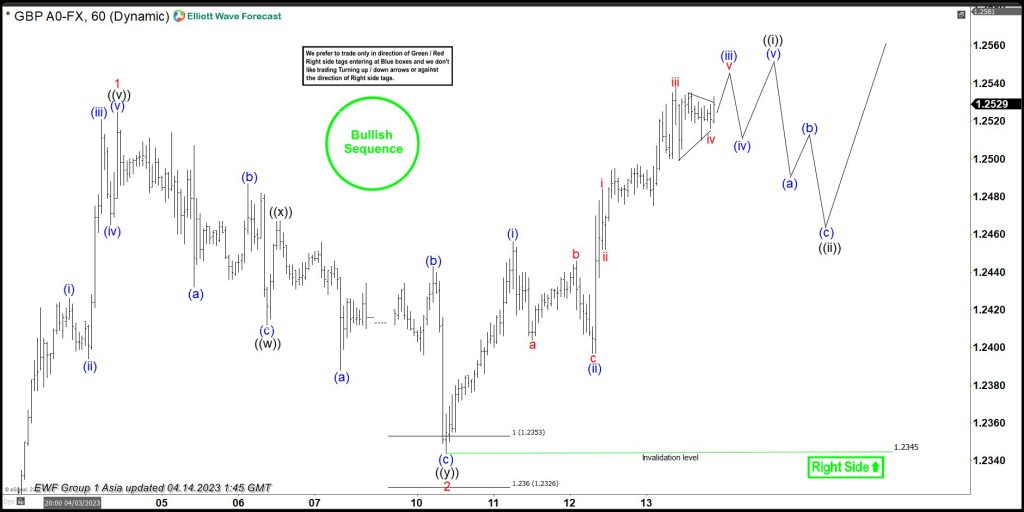
GBPUSD ended 5 wave impulse Elliott Wave sequence as wave 1 of (C) at 1.2525 high on 4/04/2023 started from 3/08/2023 low. It already confirmed higher high sequence against September-2022 low, calling for further upside to continue in wave (C). It placed ((i)) of 1 at 1.2204 high & ((ii)) at 1.2009 low. ((ii)) was 0.5 Fibonacci retracement of ((i)). It ended ((iii)) at 1.2423 high & ((iv)) at 1.2273 low. ((iv)) was typical 0.382 Fibonacci retracement of ((iii)). Finally, it ended ((v)) at 1.2525 high as wave 1. Below there, it ended wave 2 at 1.2345 low in 7 swings correction. Currently, it favors higher in 3 of (C).
Above wave 2 low, it placed (i) at 1.2456 high & (ii) at 1.2397 low as 0.5 Fibonacci retracement in 3 swing sequence. Currently, it favors higher in (iii) of ((i)) of 3. It placed i at 1.2484 high, ii at 1.2452 low, iii at 1.2538 high & iv as triangle at 1.2516 low. Above there, it favors higher in v of (iii) & expects small upside before starts correcting in (iv) in ((i)) soon. It expects short term upside in ((i)) of 3 before starts correcting in ((ii)) later in 3, 7 or 11 swings against 4/10/2023 low. The pair should remain supported in correction at extreme areas to resume higher in bullish sequence.
GBPUSD 60 Minute Elliott Wave Chart
GBPUSD Elliott Wave Video
https://www.youtube.com/watch?v=DrQ2iaoW6KI
USDCAD Wave Analysis
- USDCAD reversed from key resistance level
- Likely to fall to support level 1.3295
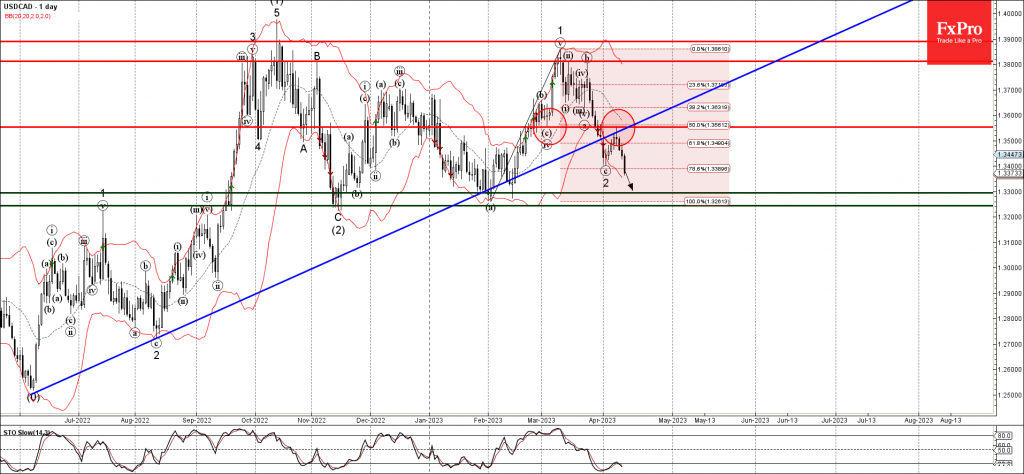
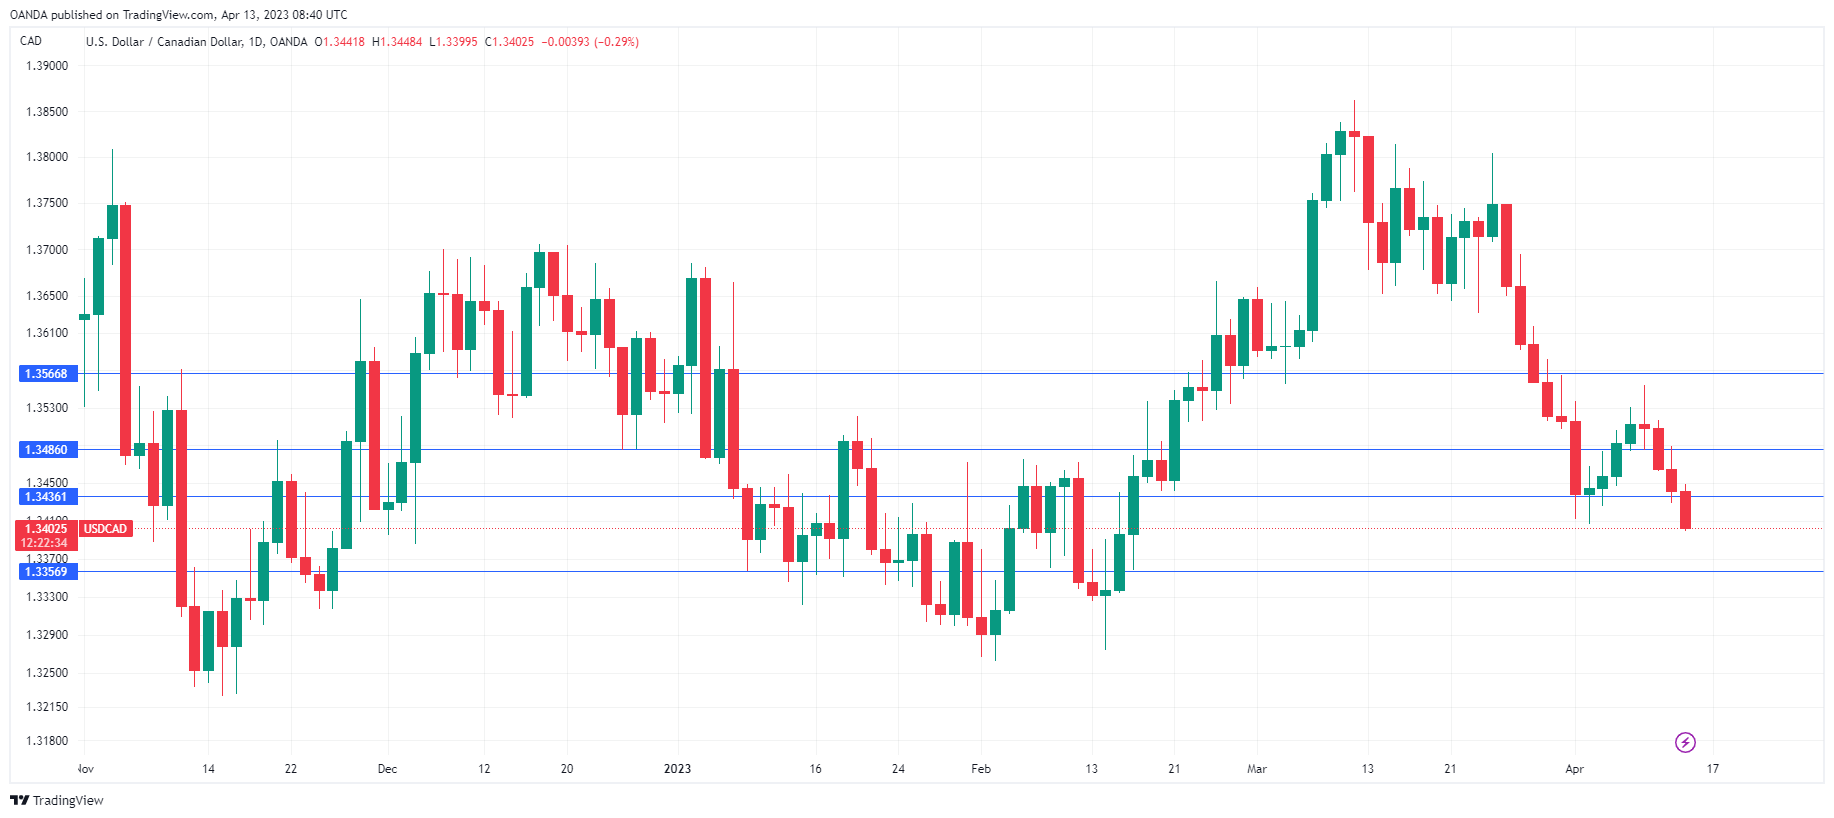
USDCAD currency pair continues to fall after the earlier downward reversal from the key resistance level 1.3555 (former support from the start of March).
The resistance level 1.3555 was further strengthened by the recently broken trendline from 2022, acting as the resistance after it was broken.
Given the strongly bearish USD sentiment seen today, USDCAD can then be expected to fall further toward the next support level 1.3295 (which stopped wave (a) in February).
USDCHF Wave Analysis
- USDCHF under strong bearish pressure
- Likely to fall to support level 0.8800
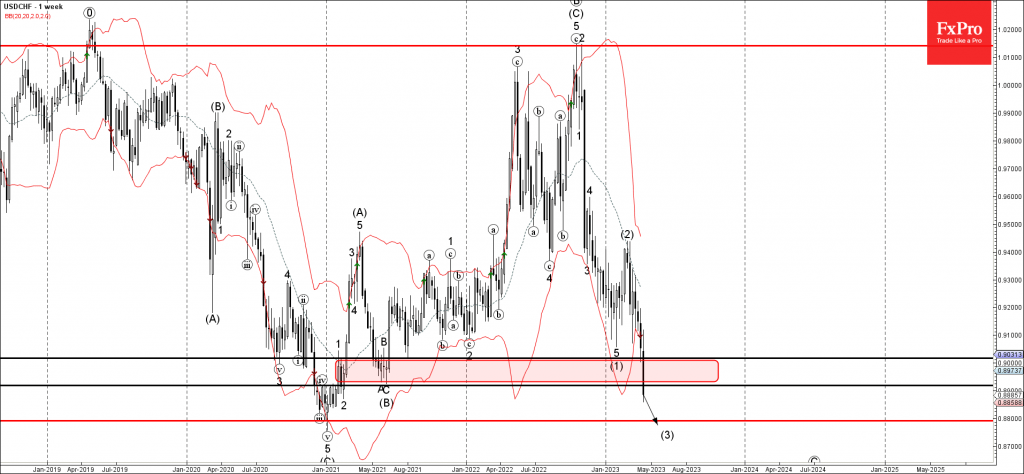
USDCHF under the strong bearish pressure after the pair broke the support area located between the support levels 0.9020 and 0.8920 (former multi-month low from 2021).
The breakout of this support area accelerated the active intermediate impulse wave (3) from March.
USDCHF can then be expected to fall further toward the next support level 0.8800 (which stopped the weekly downtrend at the start of 2021, target price for the completion of the active impulse wave (3)).
Gold Wave Analysis
- Gold broke resistance level 2030.00
- Likely to rise to resistance level 2100.
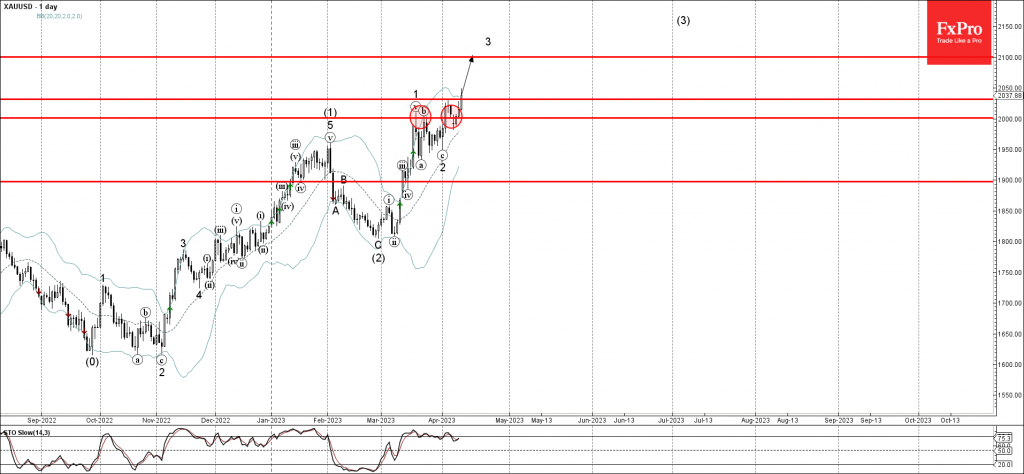
Gold continues to rise after the price broke the minor resistance level 2030.00 (which reversed the price at the start of this month).
The breakout of the resistance level 2030.00 continues the active minor impulse wave 3 which belongs to the sharp upward impulse sequence (3) from February.
Given the multi month uptrend, Gold can then be expected to rise further toward the next resistance level 2100.00 (forecast price for the completion of the active impulse wave 3).
ETHUSD Technical Analysis: Morning Star Pattern Above $1,824
Bears couldn’t keep control of the market, and ETH/USD started to correct upwards after touching a low of $1,763 on 9 April.
ETHUSD is now moving under a strong bullish momentum after crossing the $2,000 resistance and may touch $2,100 and $2,200 levels.
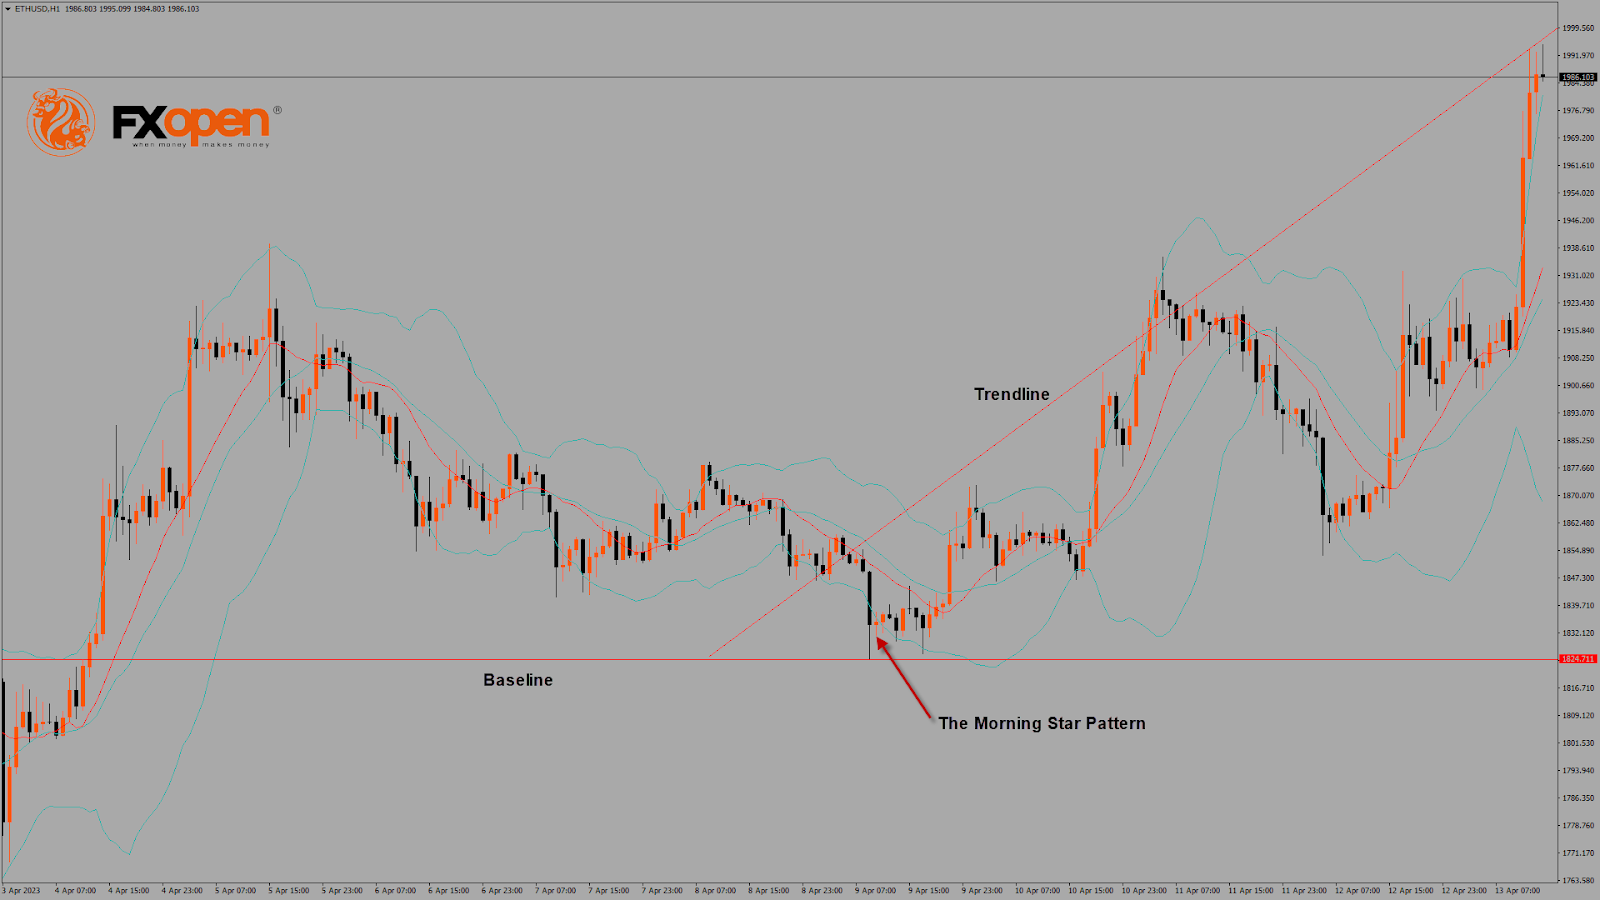
The morning star pattern is above the $1,824 handle on the H1 timeframe. It’s a bullish pattern, which signifies the end of a bearish phase.
The relative strength index is at 78.57, indicating a strong demand for Ether and a continuation of the buying pressure in the markets.
The STOCHRSI and Williams’s percent range give an overbought signal, meaning that the price is expected to decline in the short-term range.
Most of the technical indicators are bullish. Most moving averages are bullish.
ETH is now trading above the 100-hour simple and 200-hour exponential moving averages.
- Ether bullish reversal is seen above the $1,824 mark.
- The short-term range is expected to be strongly bullish.
- The average true range indicates low market volatility.
Ether Bullish Reversal Is Seen Above $1,824
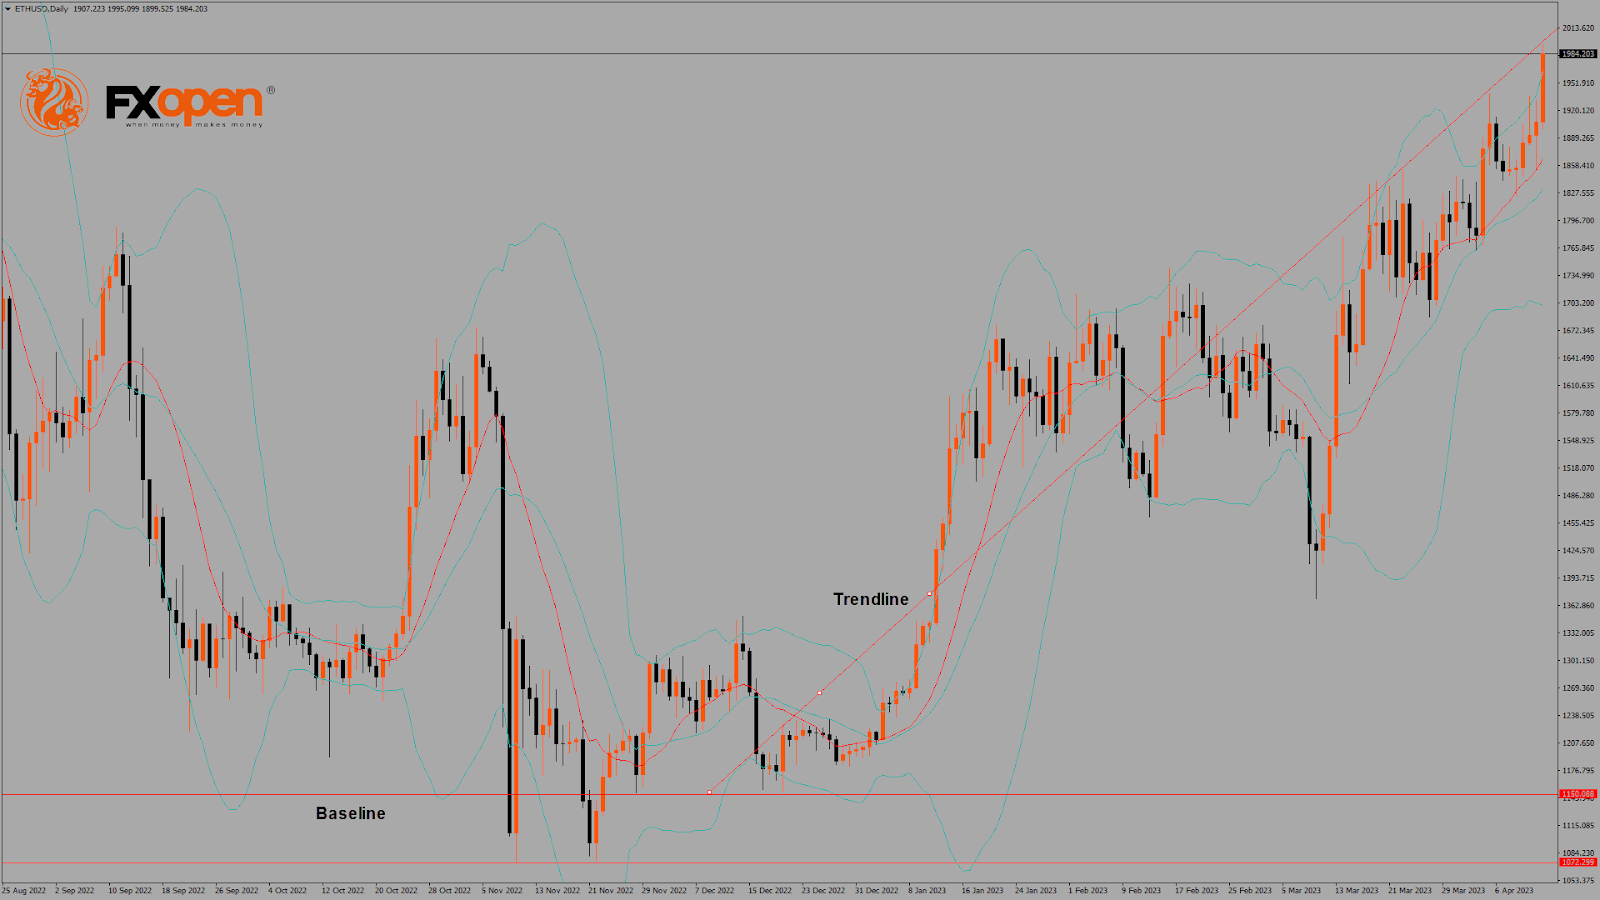
On the daily chart, ETH is trading just above its pivot level of $1,987 and is moving into a very strong bullish channel. The price has already crossed its classic resistance level of $1,991 and Fibonacci resistance level of $1,997; further upsides are located at $2,050 and $2,100.
A bullish price crossover is formed with the 20-week and 50-week adaptive moving averages in the weekly timeframe. The key support levels to watch are $1,938, which is the first resistance level of the pivot point indicator, and $1,962.
The Week Ahead
ETH has crossed the $2,000 barrier, and now we are heading towards the $2,100 level in the medium-term range in the H1 timeframe.
There is a bullish ascending channel forming from $1,824 towards the $1,999 level.
There is a major bullish trendline with the support located at $1,775, which is a 14-day RSI at 50.
The immediate short-term outlook for Ether has turned as mildly bullish, the medium-term outlook has turned bullish, and the long-term outlook for Ether is neutral in present market conditions.
The resistance zone is located at $2,024, which is a 14-day RSI at 70%, and at $2,029, which is a 50% Fib retracement from 52-week High/Low.
The weekly outlook is $2,200 with a consolidation zone of $2,100.
LTCUSD Technical Analysis: Tweezer Bottom Pattern Above $89.15
Bears couldn't pull the market further down last week, and after touching a low of $89.15 on 9 April, LTC started to correct upwards against the US Dollar, touching a high of $96.85 on 11 April.
There is a tweezer bottom pattern above the $89.15 handle on the H1 timeframe. It signifies the end of a bearish phase and the start of a bullish phase in the market.
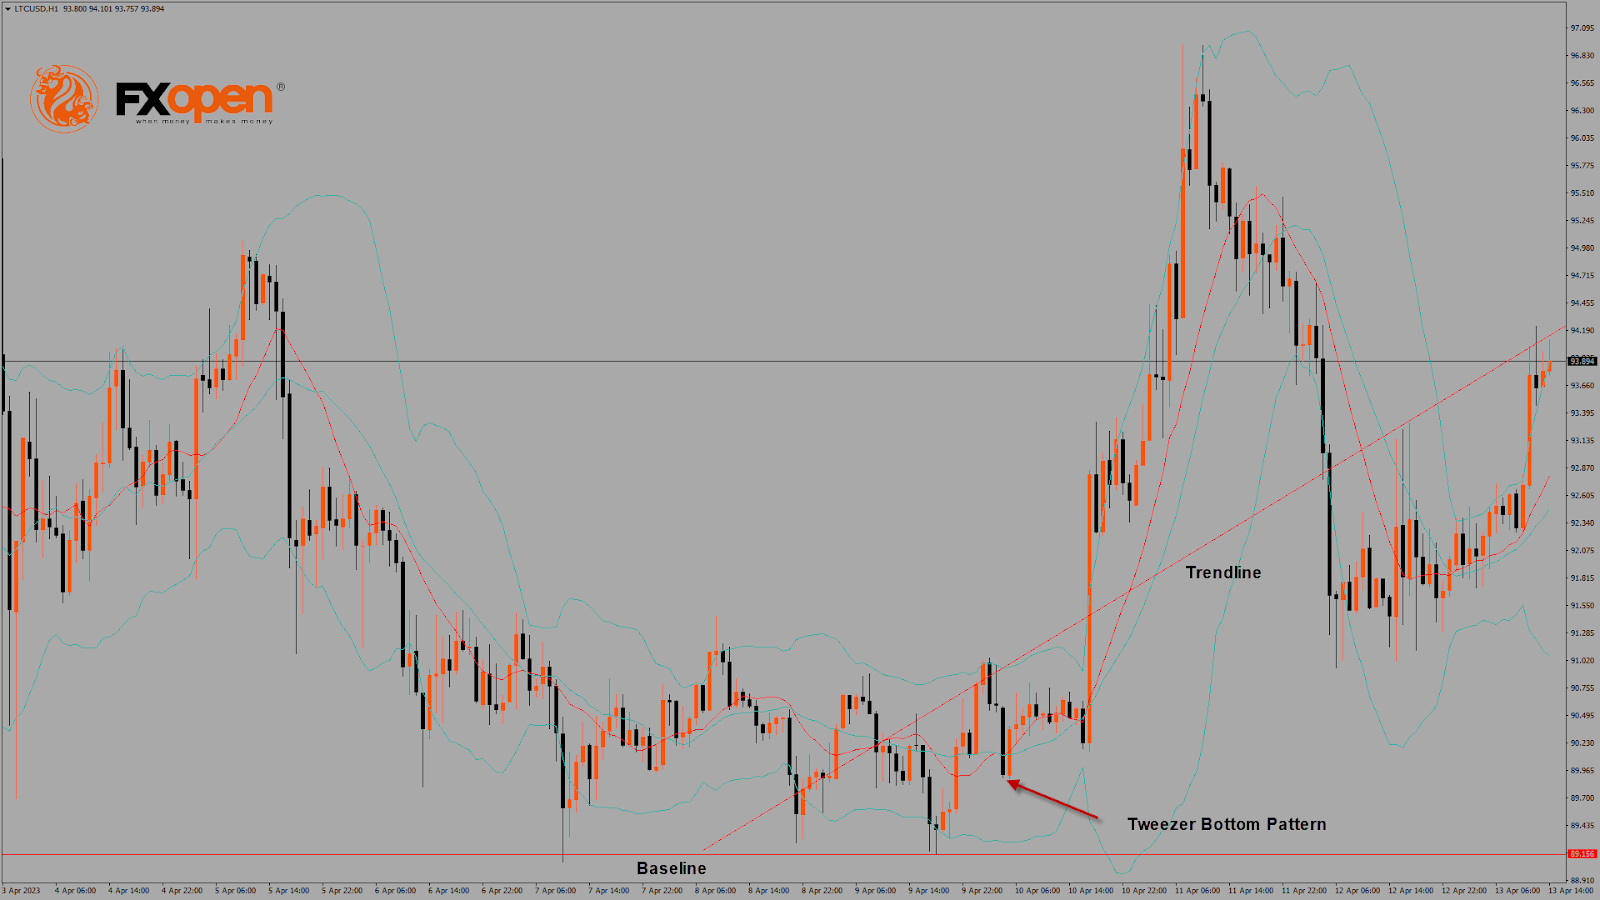
The price of Litecoin is near the channel's support, indicating upcoming bullish movement. Also, Litecoin is trading above its 100-hour simple moving average and 200-hour exponential moving average, and it's above the pivot level of $93.76.
The relative strength index is at 67.54, reflecting a very strong demand for Litecoin and the continuation of the buying pressure in the markets.
Litecoin remains above all moving averages, so the market is still bullish at the current market level of $94.23.
Both Williams’s percent range and STOCHRSI are signalling overbought market conditions, which means that the price is expected to decline in the short-term range.
The short-term outlook for Litecoin has turned as strongly bullish.
- Technical indicators are bullish.
- Litecoin bullish reversal is seen above the $89.15 level.
- The average true range indicates low market volatility.
Litecoin Bullish Reversal Seen Above $89.15
The price of Litecoin continues to move in a very strong uptrend, crossing the $95 handle, with further resistances at $98 and $100.
There is a bullish crossover of 50-day and 100-day moving averages in the 4-hour timeframe.
LTCUSD has crossed its classic resistance level of $93.93 and Fibonacci resistance level of $94.22, after which the path towards $100 will get cleared.
Litecoin faces resistance at $96.96, which is a 1-month high, and at $97.99, which is the third resistance level of the pivot point indicator.
The Week Ahead
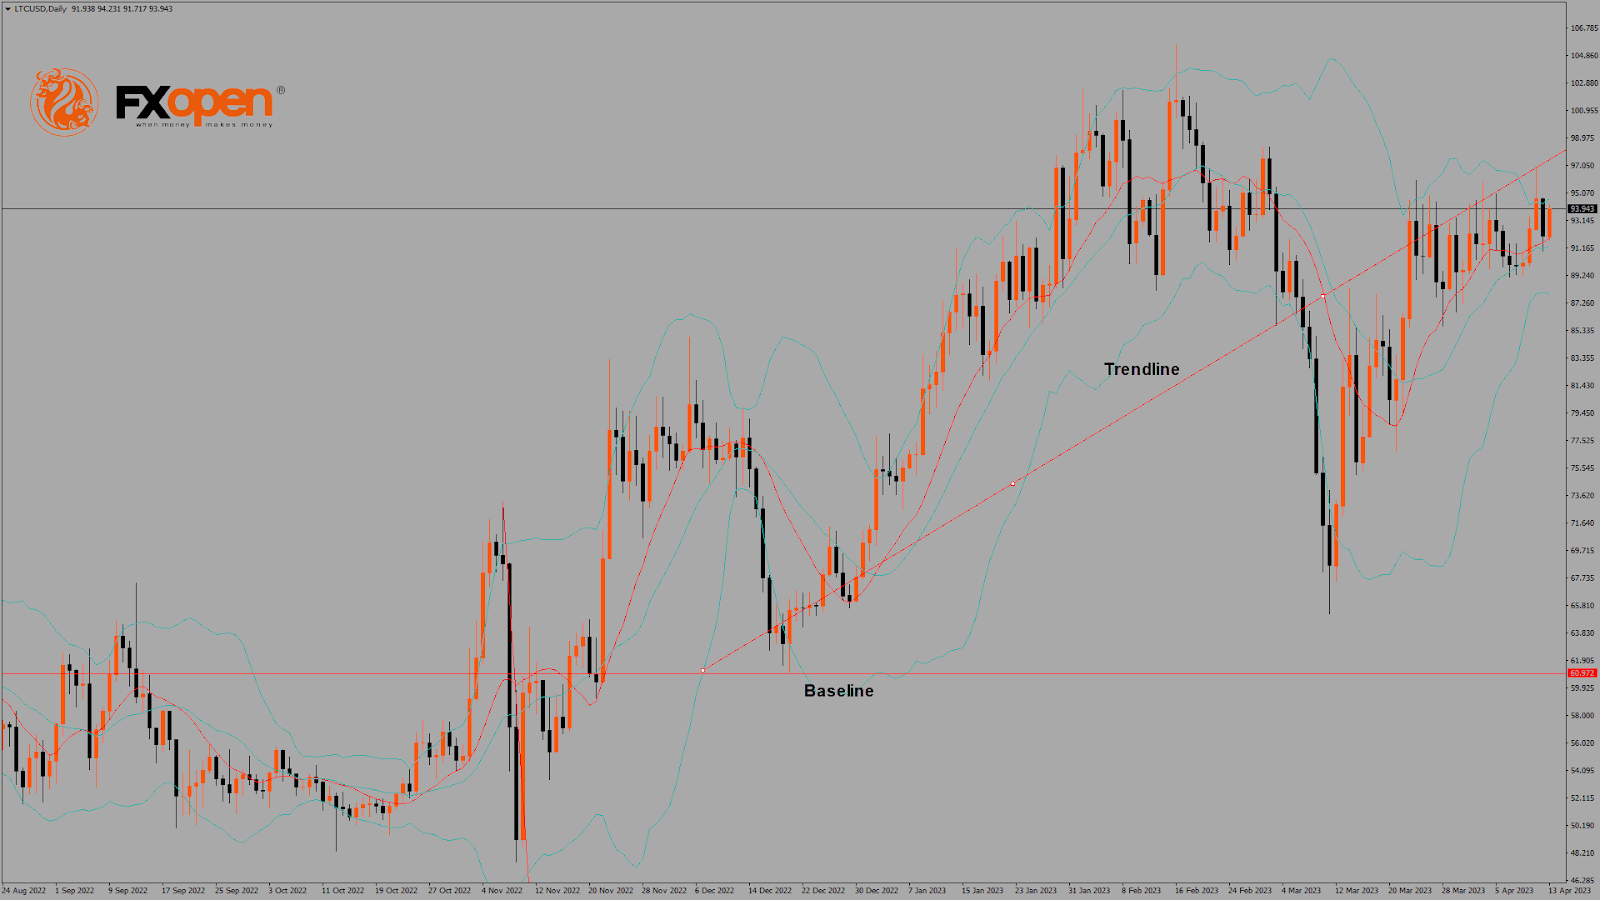
The price of Litecoin rebounded from the high of $96.85, and after the market consolidation, the bullish trend continued in the daily timeframe.
Most of the technical indicators are reflecting a bullish sentiment.
Litecoin may stay above the important support level of $92.12, at which price crosses the 9-day moving average, and at $90.38, which is the first support level of the pivot point indicator.
The short-term outlook for Litecoin has turned strongly bullish, the medium-term outlook is bullish, and the long-term outlook is neutral at present market conditions.
The weekly projection is $110, with a consolidation zone at $105.
GBP/USD – Pound Climbs to Highest Level Since June 2022
GBP/USD has edged higher and is trading around the 1.25 line. Earlier today, GBP/USD touched a high of 1.2537, its highest level since June 6th.
UK GDP stalls
The UK economy flatlined in February, versus an upwardly revised 0.4% gain in January and the consensus estimate of 0.1%. Growth was a negligible 0.1% in the three months to the end of February, as the economy has stagnated. The drivers behind the lack of growth are widespread strikes and inflation, which remains stubbornly high. How bad is the outlook for the UK economy? An IMF forecast released this week has projected that growth will contract by 0.3% in 2023, making it the worst performer in the G-20, which includes Russia.
The country has been hit by a wave of large-scale strikes in the public sector, as workers have seen real income fall due to red-hot inflation. The strikes, which show no signs of letting up, resulted in business activity and manufacturing contracting in February and further labour unrest will continue to hamper economic growth.
Inflation isn’t showing any signs of peaking, and rose in February to 10.4%, up from 10.1% in January. The Bank of England may have designated inflation as public enemy number one, but raising interest rates to 4.25% has failed to curb inflation. UK Finance Minister Hunt has pledged to slice inflation in half and says a recession can be avoided, but Hunt’s optimism is hard to share given the grim economic landscape in the UK.
US PPI drops sharply
In the US, inflation at the wholesale level fell sharply in March. Headline PPI dropped to 2.7% y/y, down sharply from an upwardly revised 4.9% a month earlier and below the estimate of 3.0%. The core rate eased to 3.4% y/y, down from 4.8% in February and matching the forecast. On a monthly basis, headline PPI dropped by 0.5% and the core rate by 0.1%.
The positive PPI data comes on the heels of the consumer inflation report, which was mixed, as headline CPI fell from 5.9% to 5.0%, while the core rate nudged up to 5.6%, up from 5.5%. Inflation has been decelerating, but the markets still expect a rate hike in May, with a 65% probability of a 25-bp increase, according to the CME Group.
GBP/USD Technical
- GBP/USD touched resistance at 1.2537 earlier. The next resistance line is 1.2656
- There is support at 1.2405 and 1.2282
XAU/USD: Gold Price Surges to 13-Month High on Recession Fears and Signs that Fed May Pause Rate Hikes
Gold hit the highest levels since March 2022 after strong acceleration higher on Thursday, with metal’s price advancing 1.5% until early US session.
Weaker than expected US economic data on Wed/Thu added to existing concerns that the economy is likely to enter a mild recession and boosted bets that the Fed may pause in interest rate hikes, which increased demand for safe-haven gold.
Initial bullish signal was generated on return above psychological $2000 level, with the second weekly close above this barrier to confirm signal and reinforce bullish structure.
Bulls are heading towards key barriers at $2070/74 (Mar 2022 / Aug 2020 tops) with the latter marking the yellow metal’s record high.
Another important signal is expected from the eventual monthly close above $2000, as two previous attempts failed, despite spikes well above the level.
This would set the stage for stronger advance, as weakening fundamentals and bullish technical studies work in favor of such scenario.
However, bulls are very likely to face headwinds on approach to $2070/74 targets which mark significant barriers and also due to overbought conditions on weekly chart.
Expect limited consolidation before fresh push higher if current favorable conditions persist, with bulls to remain intact while the price stays above $2000.
Res: 2048; 2055; 2070; 2074
Sup: 2032; 2013; 2000; 1984