Sample Category Title
EUR/AUD Daily Outlook
Daily Pivots: (S1) 1.6092; (P) 1.6183; (R1) 1.6319; More...
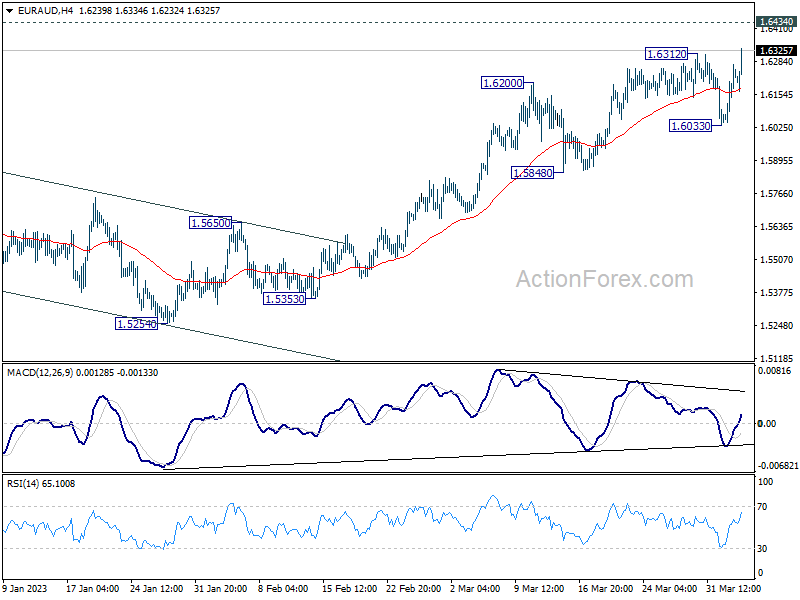
EUR/AUD's break of 1.6321 indicates that up trend from 1.4281 is resuming. Intraday bias is back on the upside. But focus remains on 0.6389/6434 cluster resistance zone. Decisive break there will carry larger bullish implications. However, firm break of 1.6033 support will confirm short term topping, after rejection by the mentioned resistance. Intraday bias will be turned back to the downside for 1.5848 support and possibly below.
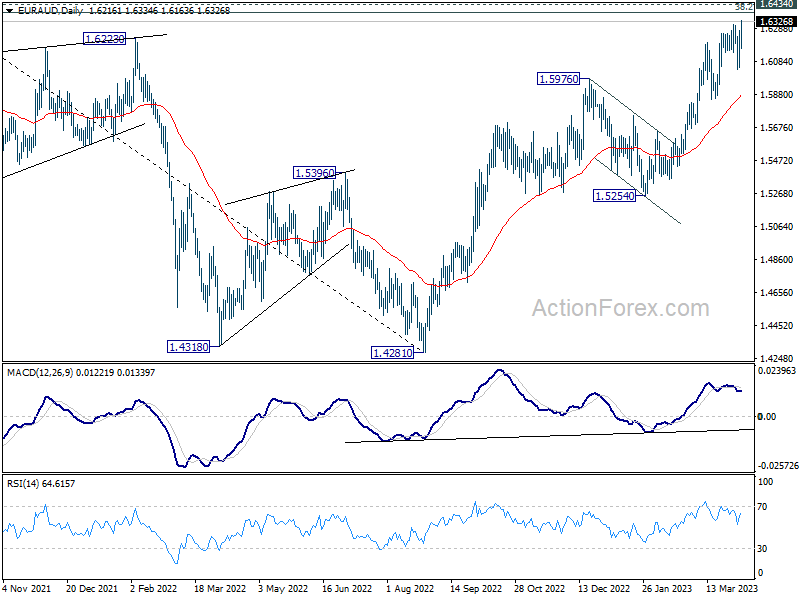
In the bigger picture, focus stays on 1.6389/6434 cluster resistance (38.2% retracement of 1.9799 to 1.4281 at 1.6389). Sustained break there should confirm that whole down trend from 1.9799 (2020 high) has completed. Further rally should then be seen to 61.8% retracement at 1.7691. However, rejection by this cluster resistance will make medium term outlook neutral at best.
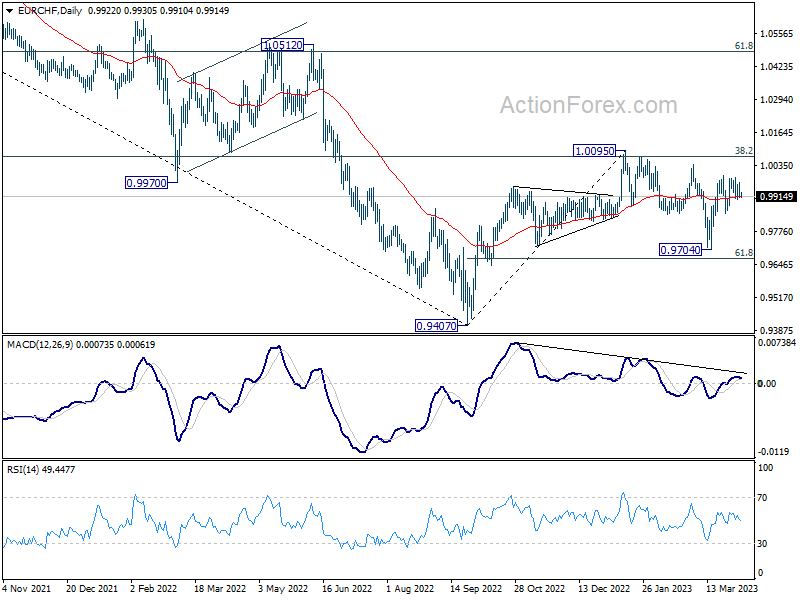
EUR/CHF Daily Outlook
Daily Pivots: (S1) 0.9905; (P) 0.9938; (R1) 0.9962; More...
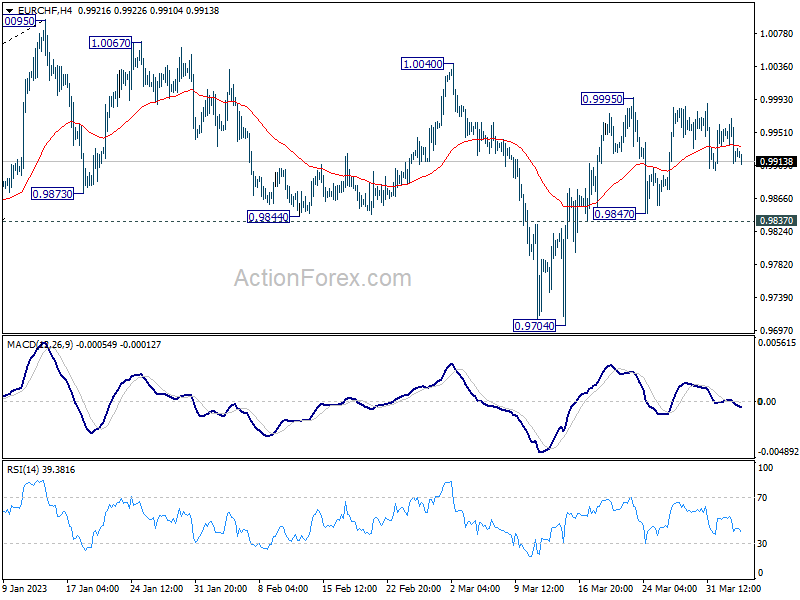
Intraday bias in EUR/CHF stays neutral as sideway trading continues. Near term outlook remains cautiously bullish with 0.9837 minor support intact. Correction from 1.0095 could have completed at 0.9704 already. Break of 0.9995 will affirm this bullish case and target a retest on 1.0095 high. However, break of 0.9837 will dampen this bullish view and turn bias back to the downside for 0.9704 support instead.
In the bigger picture, prior rejection by 55 week EMA (now at 1.1002) and 38.2% retracement of 1.1149 to 0.9407 at 1.0072 suggests that medium term outlook is staying bearish. That is, down trend from 1.2004 is not completed yet and is in favor to resume through 0.9407 at a later stage. However, decisive break of 1.0095 resistance will raise the chance of bullish trend reversal. Rise from 0.9407 should then target 1.0505 cluster resistance (2020 low at 1.0505, 61.8% retracement of 1.1149 to 0.9407 at 1.1484).
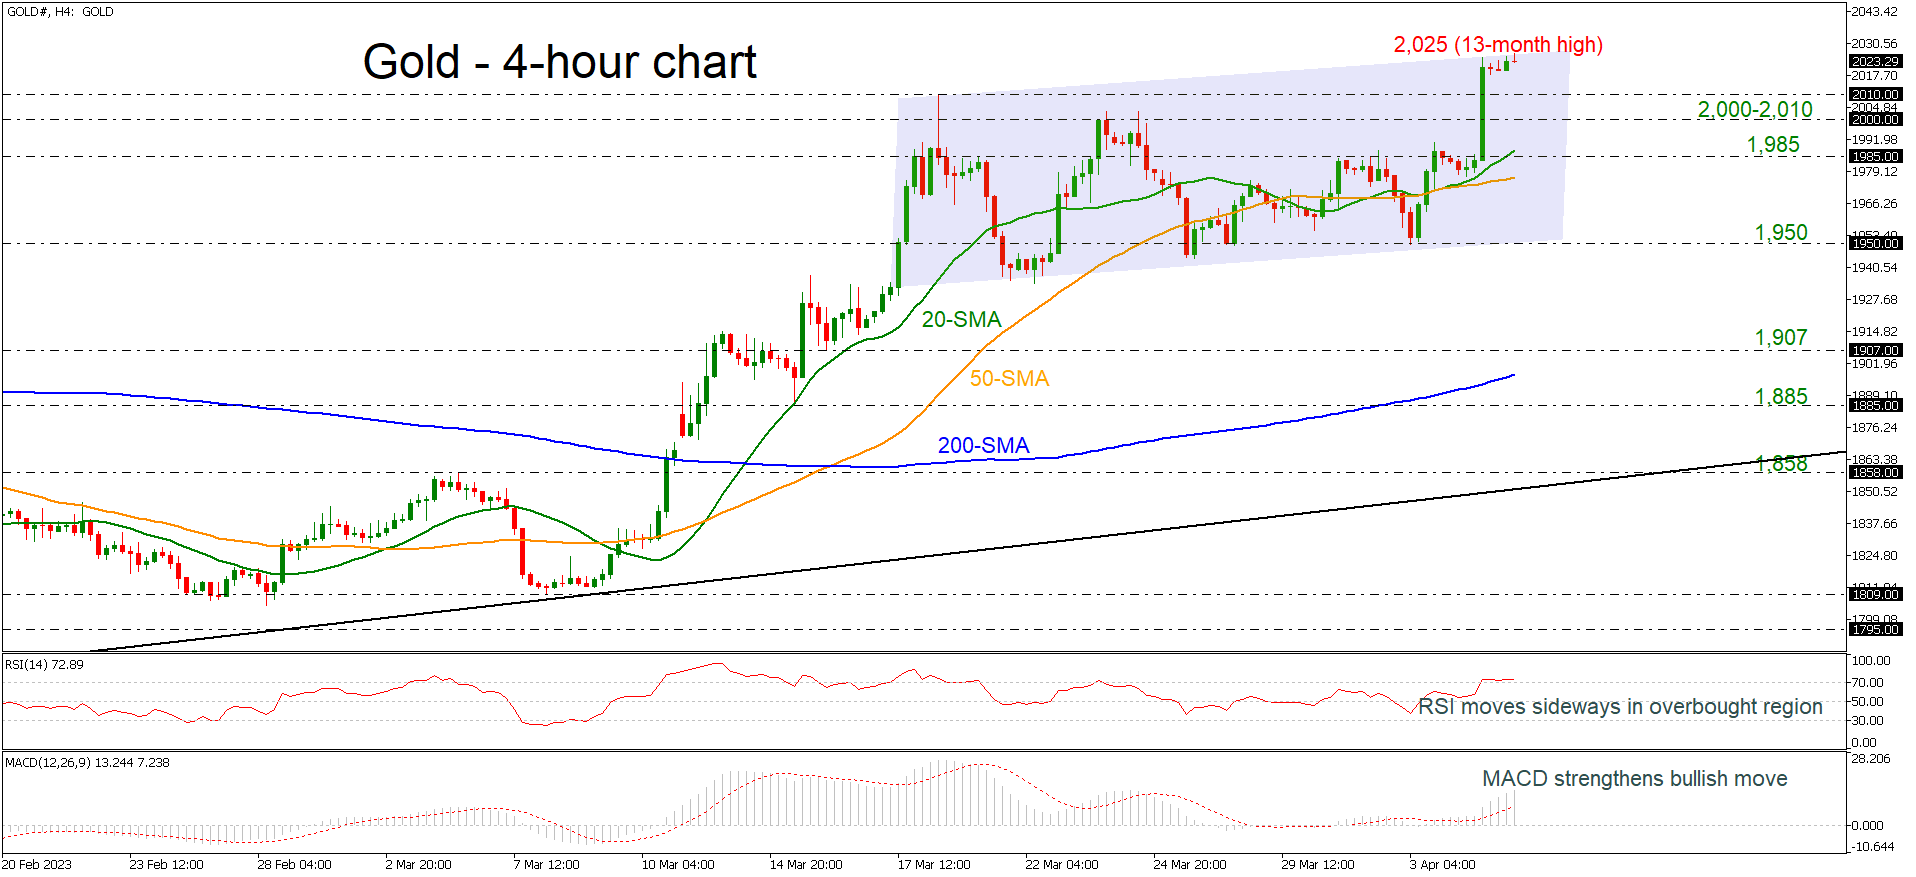
Gold Finally Rallies Well Above 2,000
Gold surged above the 2,000 round number and reached a new 13-month peak of 2,025 earlier today, confirming the long-term bullish outlook. The commodity is standing well above the short-term simple moving averages (SMAs) as well as above the ascending trend line.
Technically, the RSI indicator is flattening near the overbought territory but is weakening the current bullish momentum, while the MACD is strengthening above its trigger and zero lines.
Should the price manage to strengthen its upside move, the next resistance to have in mind is the previous high of 2,074.90, taken from the highs in August 2020. A break higher test the psychological mark of 2,100, driving the market into uncharted levels.
However, if prices are unable to break higher, the risk would shift to the downside, with the 2,000-2,010 support zone coming into focus. A drop lower could send the precious metal towards the 20-period SMA, which stands near the 1,985 support level ahead of the 50-period SMA at 1,976.
In brief, gold is showing more positive actions after the recent surge, creating an upward sloping channel in the short-term timeframe.
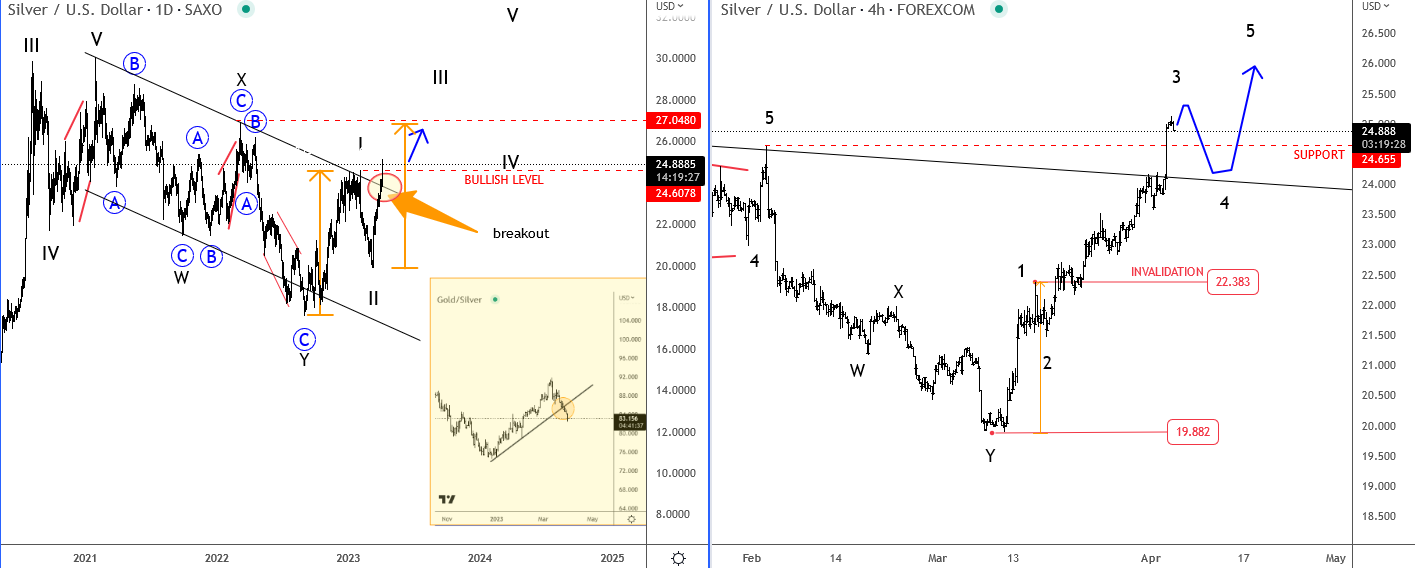
Silver’s Elliott Wave: Buckle Up for a Bullish Ride
Silver has turned lower at start of the year but drop from the high can be counted as a w-x-y correction that found support at 19.88. Ideally, that was wave II on a daily chart where price is currently breaking the trendline resistance so ita appears that uptrend resumption is here. In fact price action on 4h chart looks very bullish with higher highs and higher swing low formations. It's a strong recovery that looks impulsive, and it's already breaking 24.65 swings high so more upside can be seen after next retracement. Ideally, it will be wave four back to trendline support.
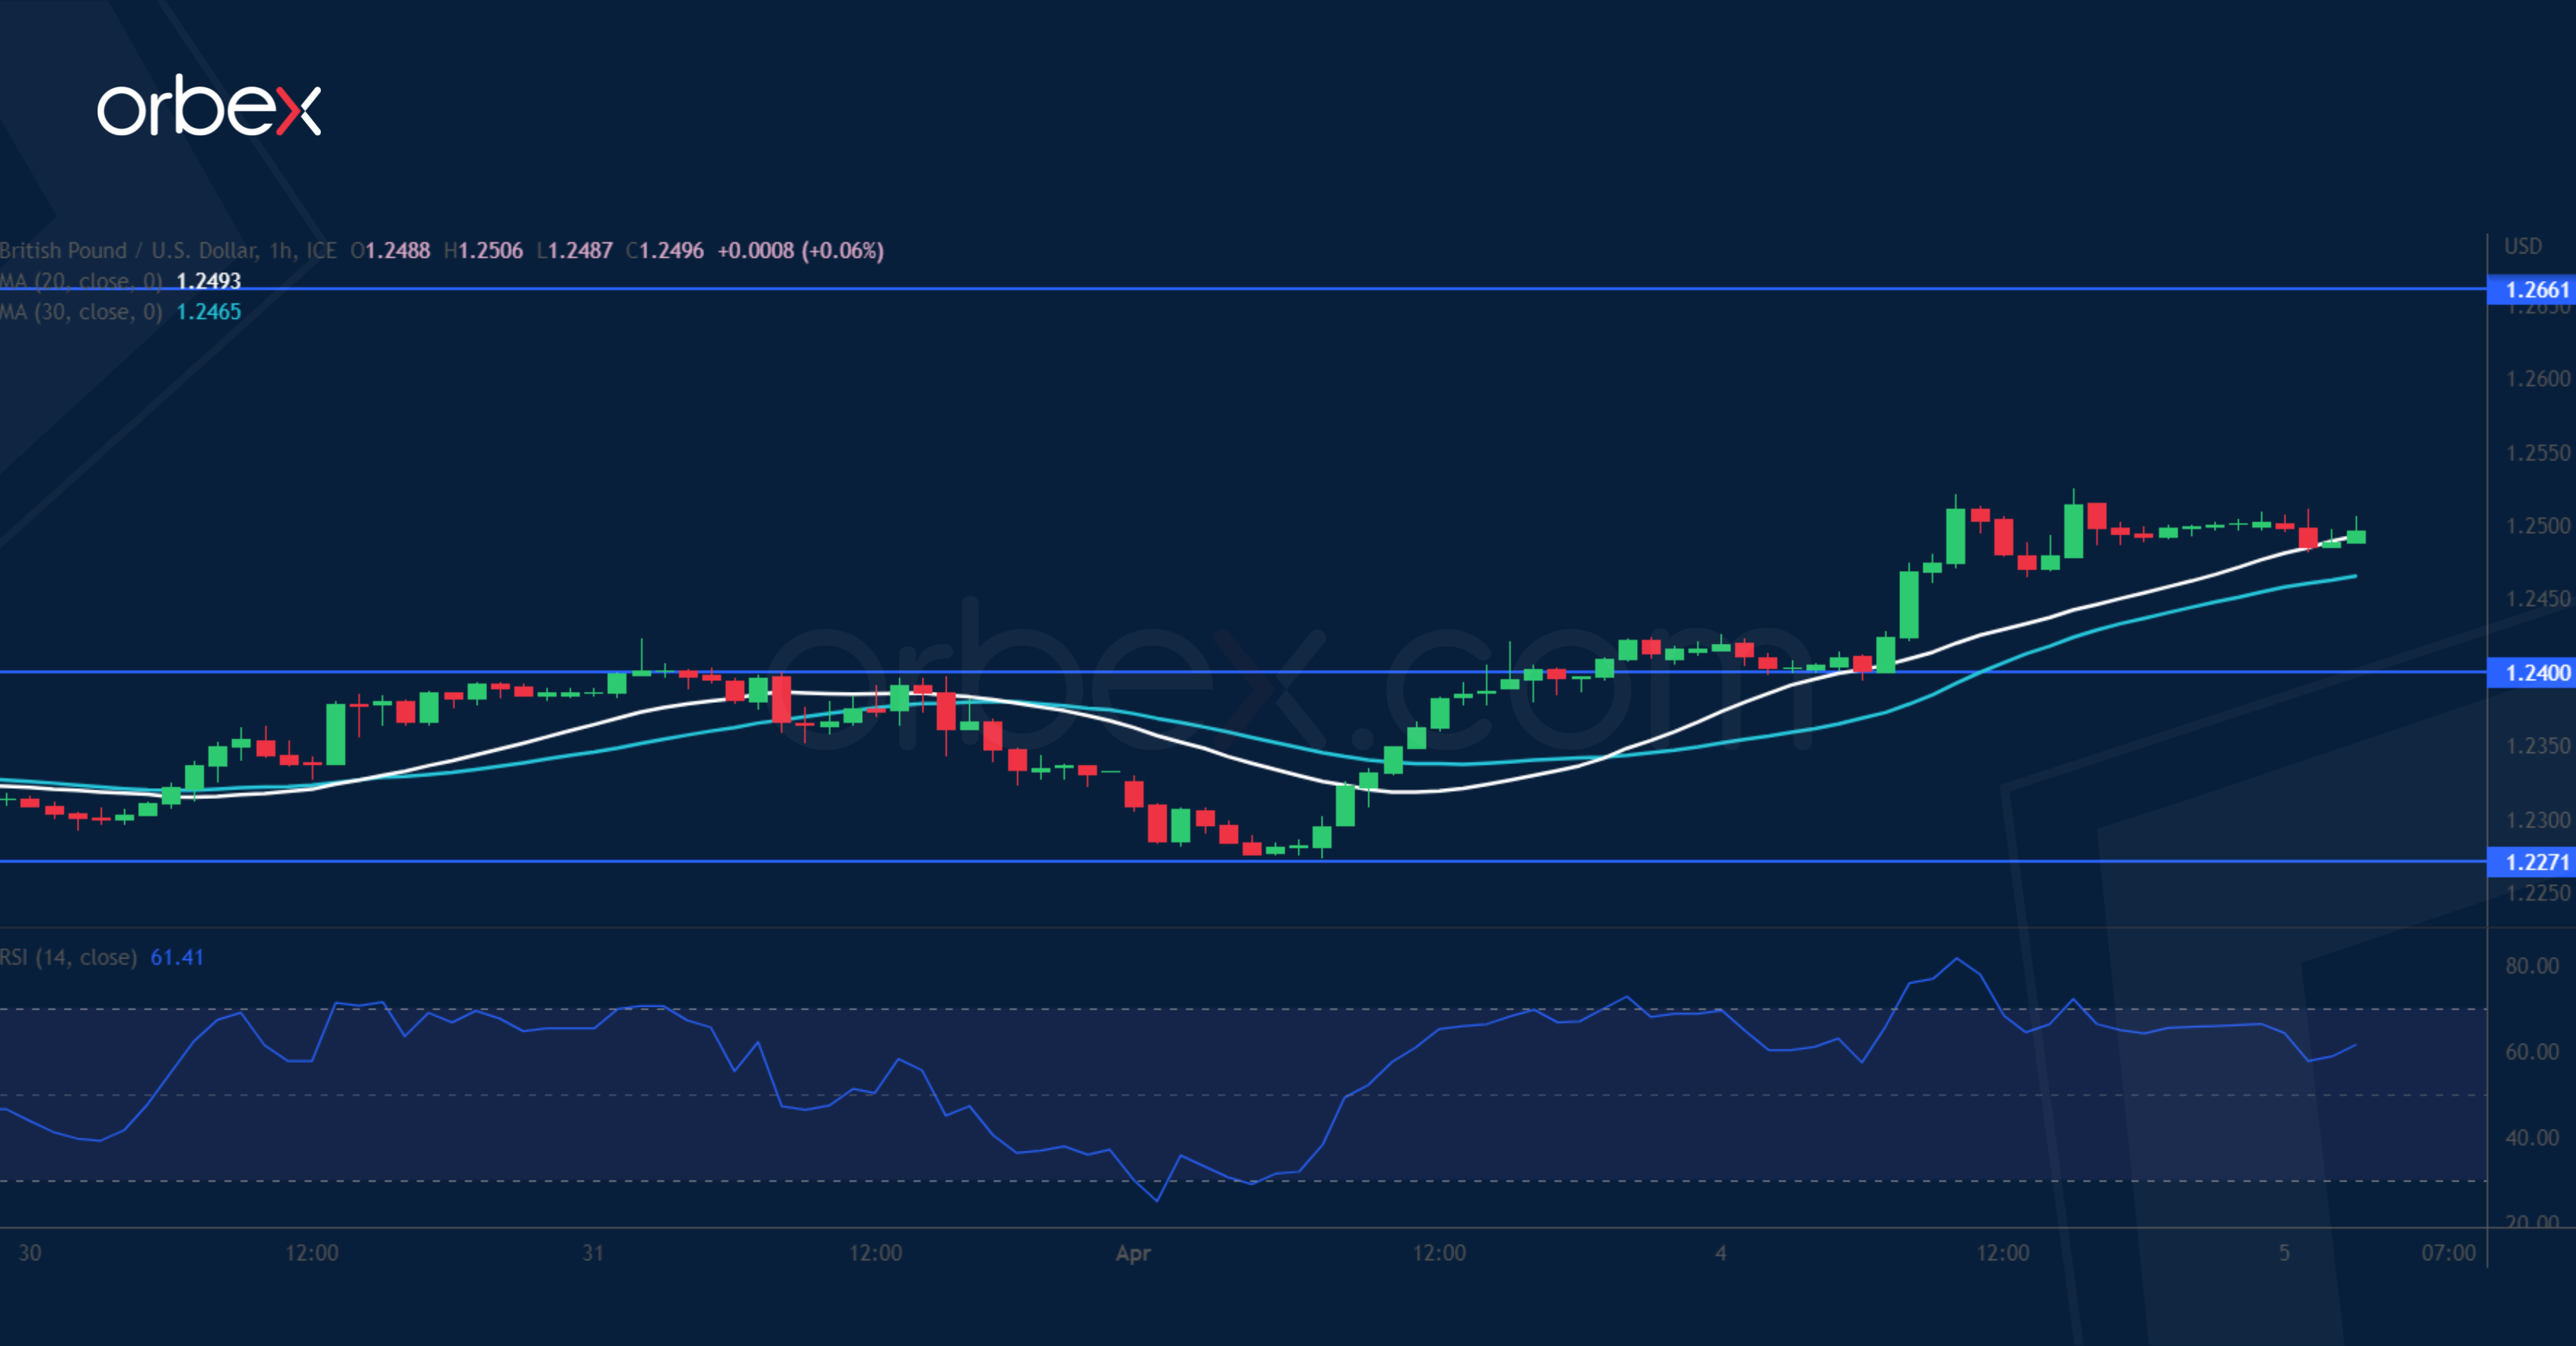
GBP Resumes Uptrend
GBP/USD breaks major resistance
The pound soars as BoE Chief Economist hints at more rate hikes. A climb over the double top at 1.2430 from December and January’s highs on the daily chart forced sellers to cover, further driving up volatility. This break of a 4-month long consolidation along with a short squeeze of medium-term bears could open the door for a sustained recovery. The pair is heading to its 11-month high at 1.2660 though the RSI’s overbought condition may warrant a limited pullback. 1.2400 at the base of the surge is the first support.
AUD/USD bounces higher
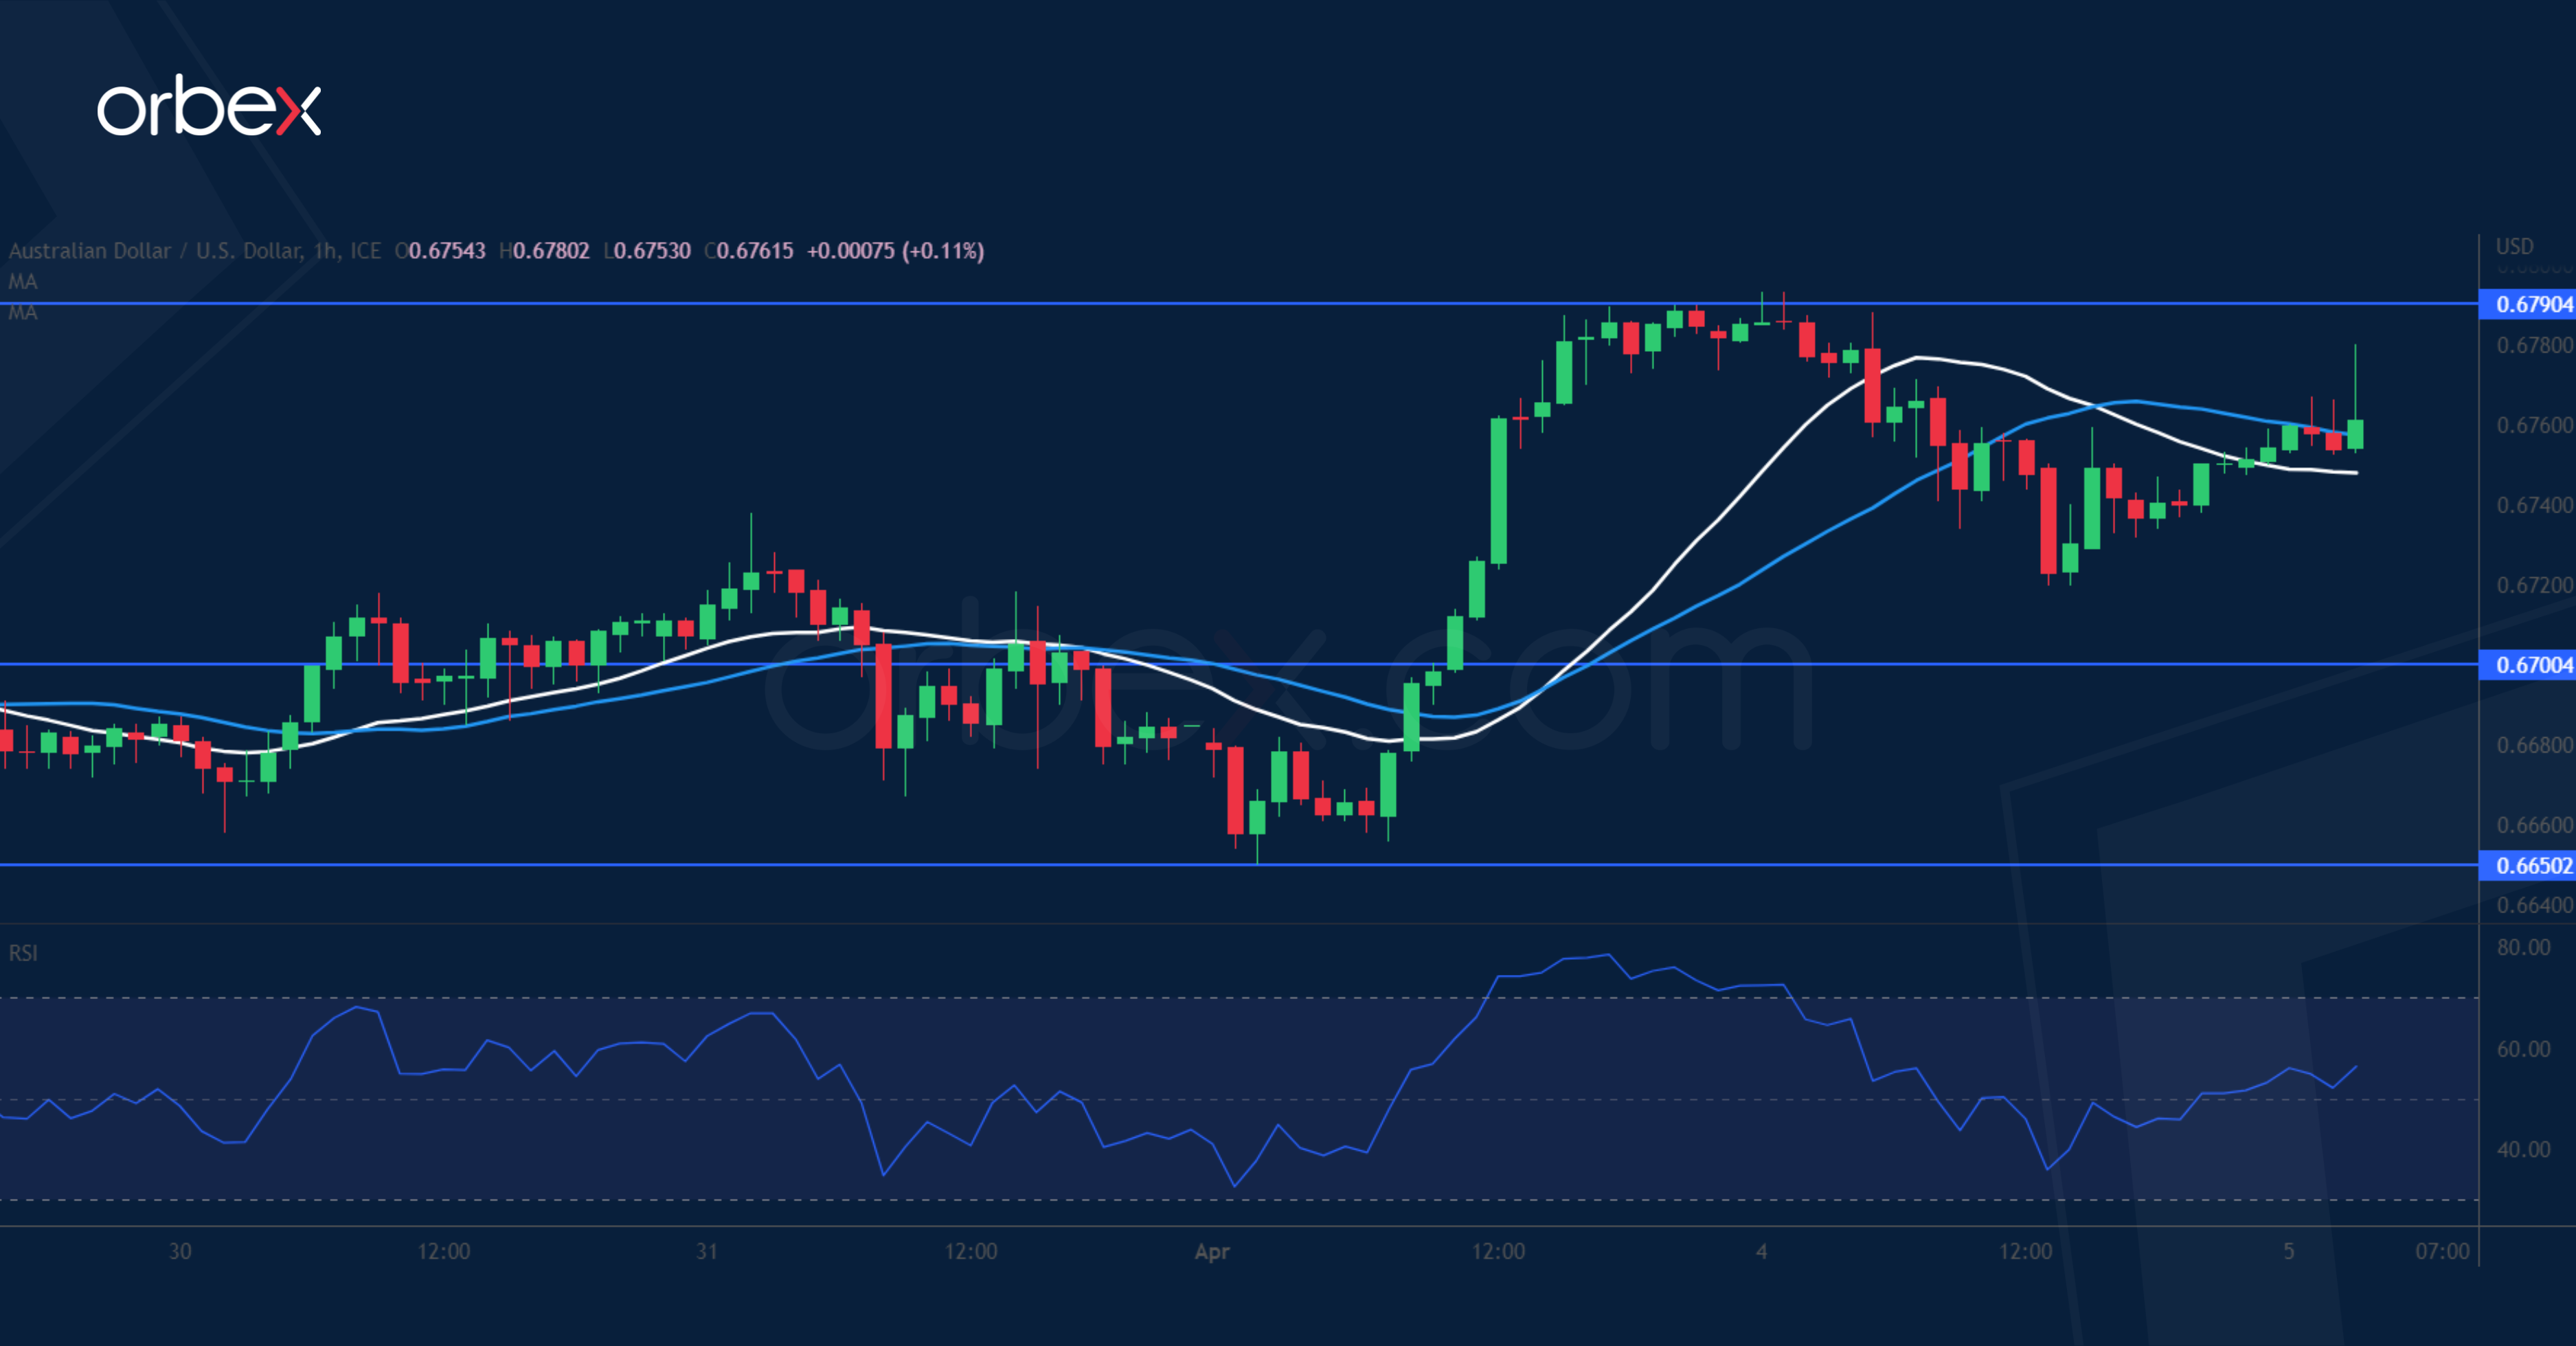
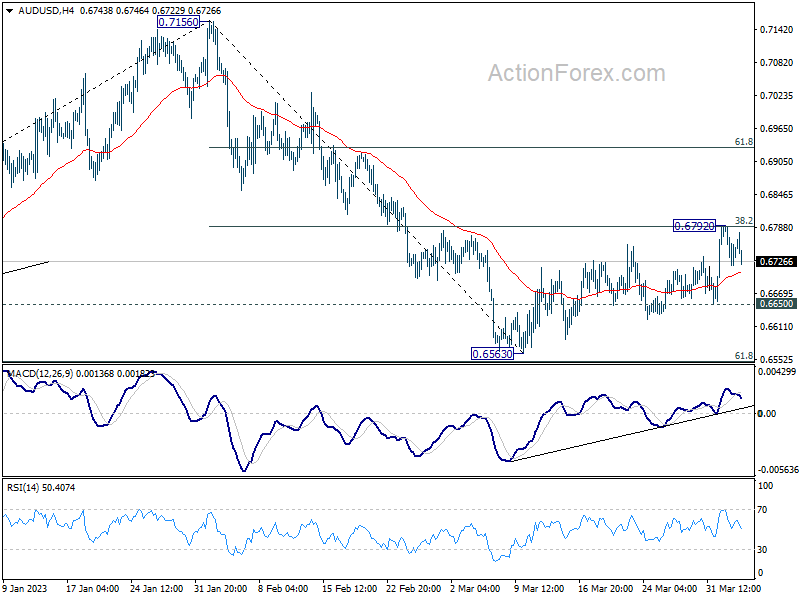
The Australian dollar rallies as the RBA’s rate hike pause bolsters confidence of a global pivot soon. A surge above the daily resistance of 0.6770 may have put the aussie back on track against its US counterpart. As the RSI falls into the neutral area, support could be expected in the fresh demand zone 0.6700-0.6720. A rally back above 0.6790 may attract momentum buyers and propel the pair towards 0.6900. On the flip side, a bearish breakout would dent the optimism and lead to a test of the important floor at 0.6650.
GER 40 consolidates gains
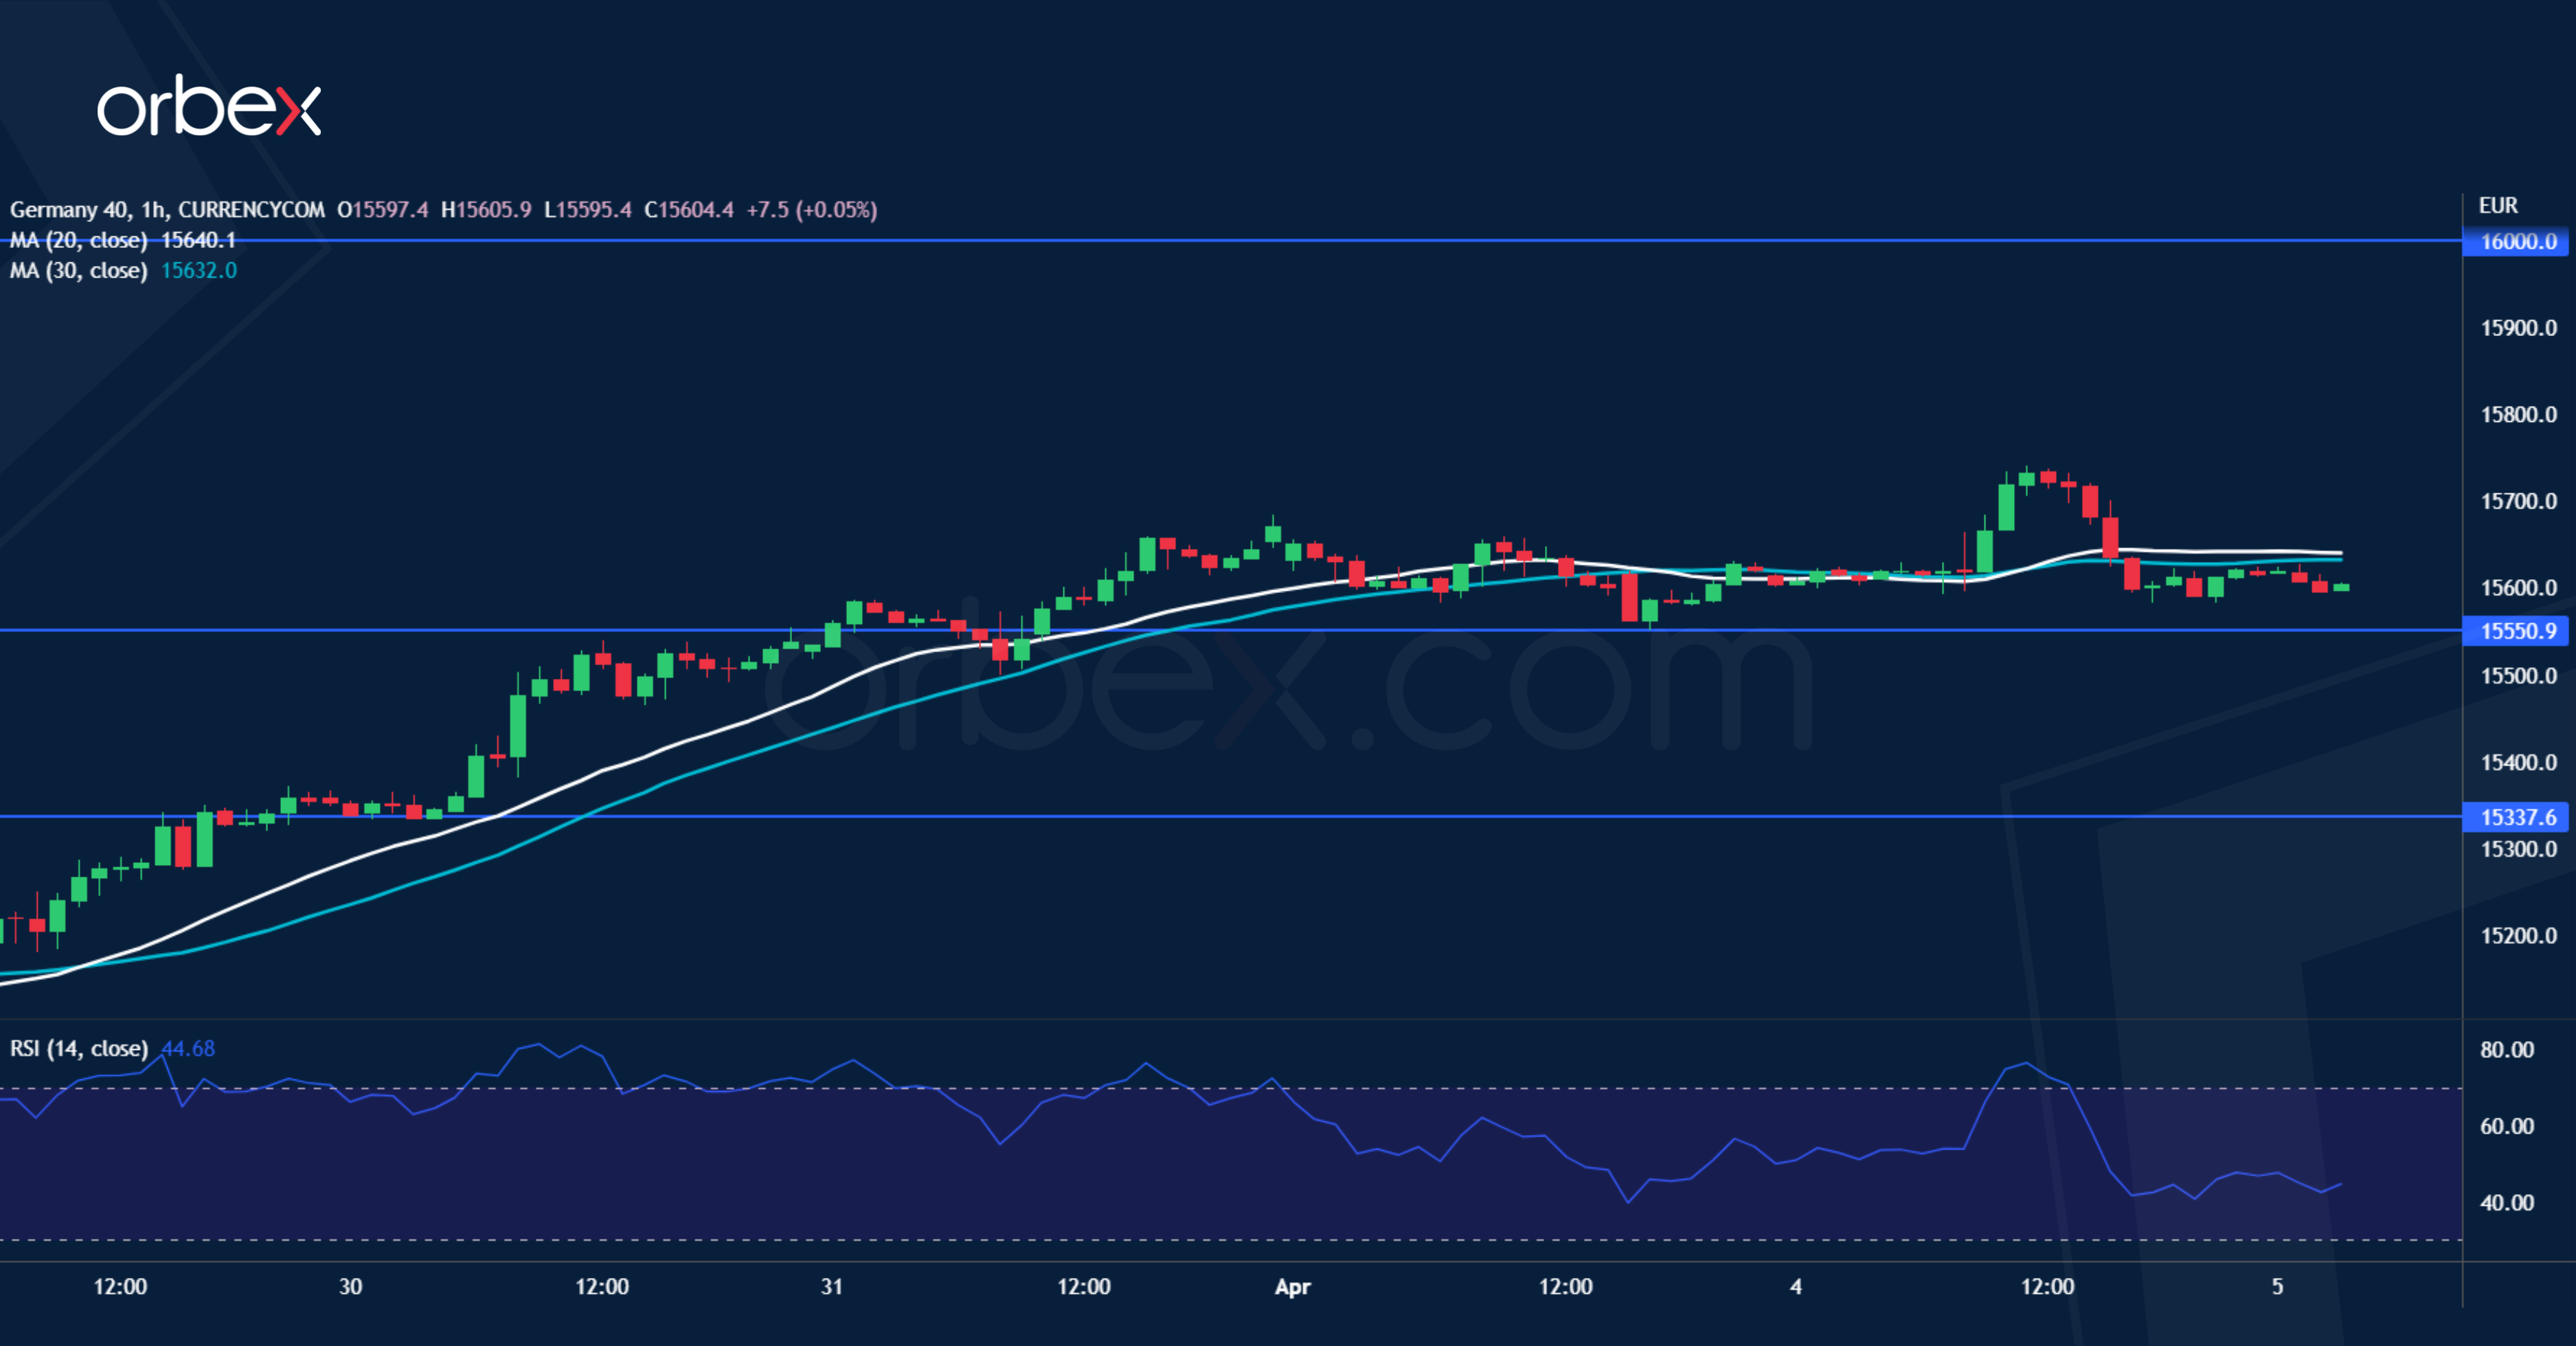
Global equities retrace as the US labour market shows signs of cooling. The Dax 40’s break above this year’s peak at 15700 suggests that the bulls have regained control of the price action. The psychological tag of 16000 is next and then the all-time high at 16300 would be within reach where a breakout would signal a bullish continuation. In the meantime, the RSI’s repeatedly overbought situation may temper the bullish fever, 15550 would be the first level to expect buying interest in case of a retracement.
USD/CAD Daily Outlook
Daily Pivots: (S1) 1.3412; (P) 1.3439; (R1) 1.3472; More....
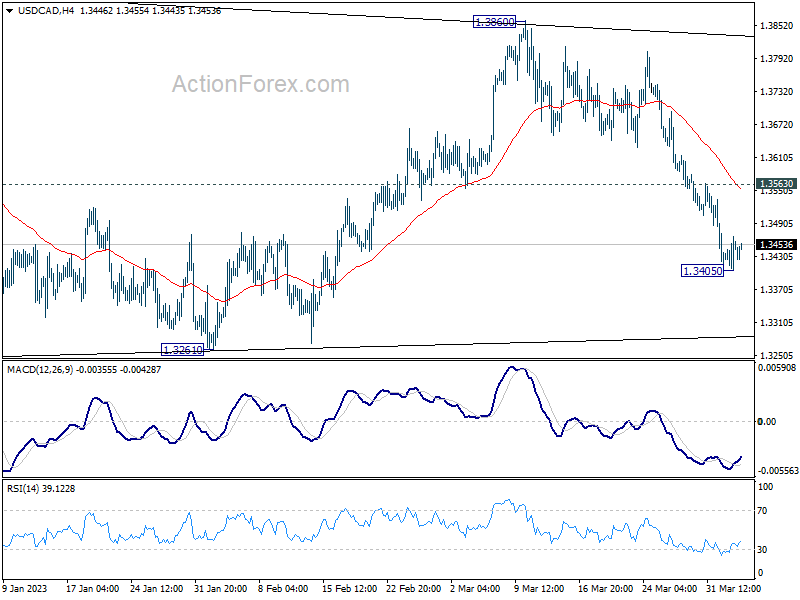
With 4 hour MACD crossed above signal line, a temporary low is in place at 1.3405 and intraday bias in USD/CAD is turned neutral first. Upside of recovery should be limited by 1.3563 resistance to bring another fall. Break of 1.3405 will resume the decline from 1.3860, as the third leg of the corrective pattern from 1.3976, to 1.3224/61 support zone. Strong support should be seen around there to bring rebound.
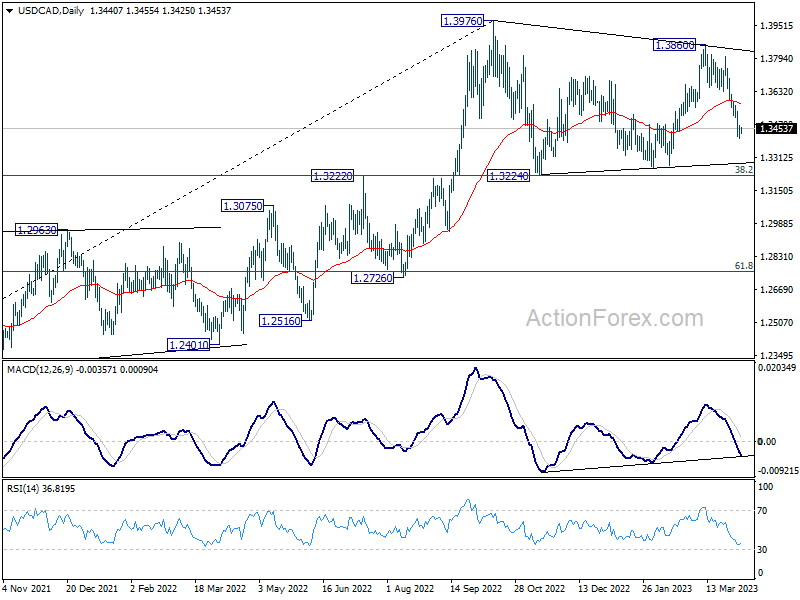
In the bigger picture, the up trend from 1.2005 (2021 low) is still in progress. Break of 1.3976 will confirm resumption and target 61.8% projection of 1.2401 to 1.3976 from 1.3261 at 1.4234. Firm break there will pave the way to long term resistance zone at 1.4667/89 (2016, 2020 highs). On the downside, sustained break of 55 week EMA (now at 1.3282) is needed to confirm medium term topping. Otherwise, outlook will remain bullish even in case of deep pull back.
AUD/USD Daily Report
Daily Pivots: (S1) 0.6717; (P) 0.6755; (R1) 0.6789; More...
Intraday bias in AUD/USD is turned neutral with current retreat. On the upside, sustained break of 38.2% retracement of 0.7156 to 0.6563 at 0.6790 will pave the way to 61.8% retracement at 0.6929. However, break of 0.6650 support will turn bias back to the downside for 0.6563 low again.
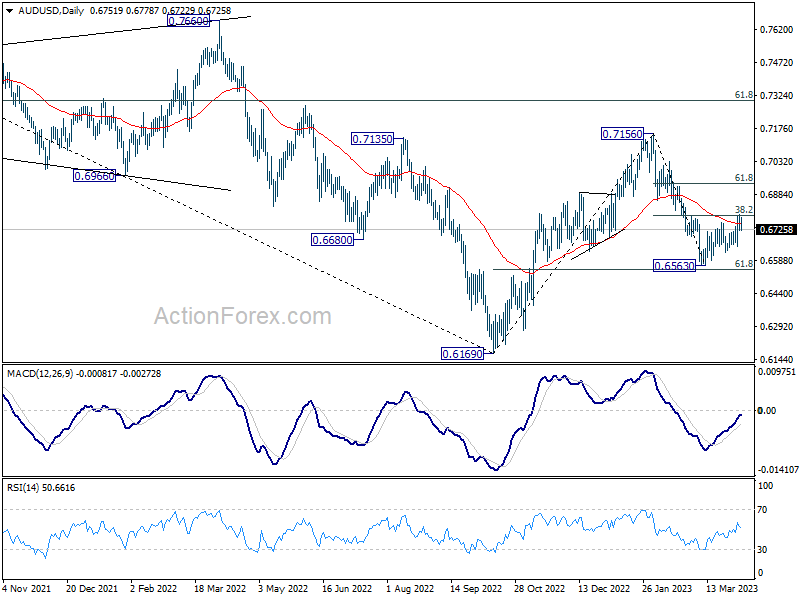
In the bigger picture, as long as 61.8% retracement of 0.6169 to 0.7156 at 0.6546 holds, the decline from 0.7156 is seen as a correction to rally from 0.6169 (2022 low) only. Another rise should still be seen through 0.7156 at a later stage. However, sustained break of 0.6546 will raise the chance of long term down trend resumption through 0.6169 low.
EUR/USD Daily Outlook
Daily Pivots: (S1) 1.0902; (P) 1.0937; (R1) 1.0992; More...
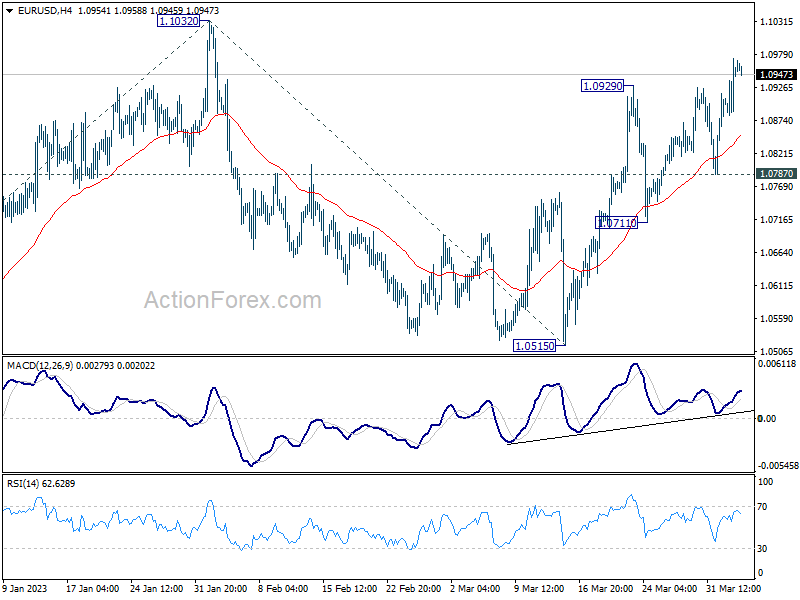
Intraday bias in EUR/USD stays on the upside as rise form 1.0515 is in progress. Next target is retest on 1.1032 high. Decisive break there will resume larger up trend from 0.9534 to 1.1273 fibonacci level next. On the downside, break of 1.0787 support will turn bias back to the downside for 1.0711 support instead.
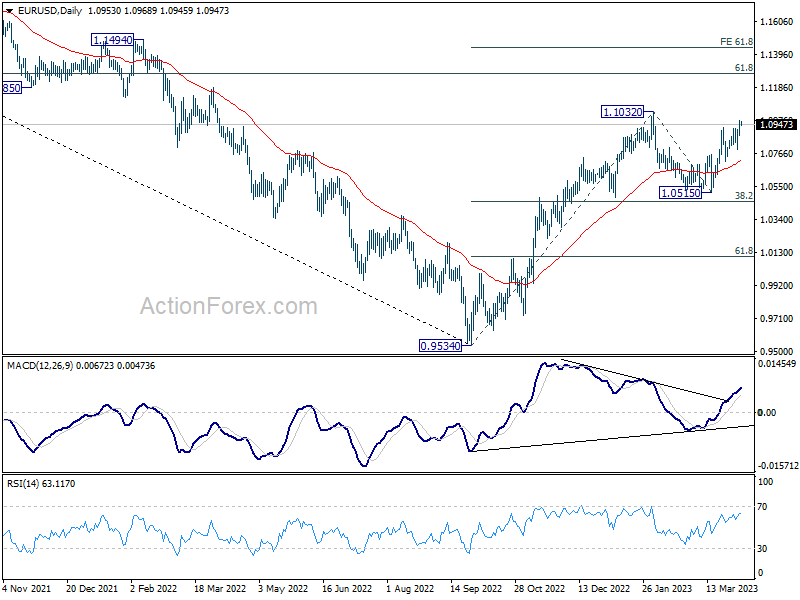
In the bigger picture, rise from 0.9534 (2022 low) is in progress with 38.2% retracement of 0.9534 to 1.1032 at 1.0460 intact. The strong support from 55 week EMA (now at 1.0625) was also a medium term bullish sign. Next target is 61.8% retracement of 1.2348 (2021 high) to 0.9534 at 1.1273. Sustained break there will solidify the case of bullish trend reversal and target 1.2348 resistance next (2021 high).
GBP/USD Daily Outlook
Daily Pivots: (S1) 1.2422; (P) 1.2473; (R1) 1.2552; More...
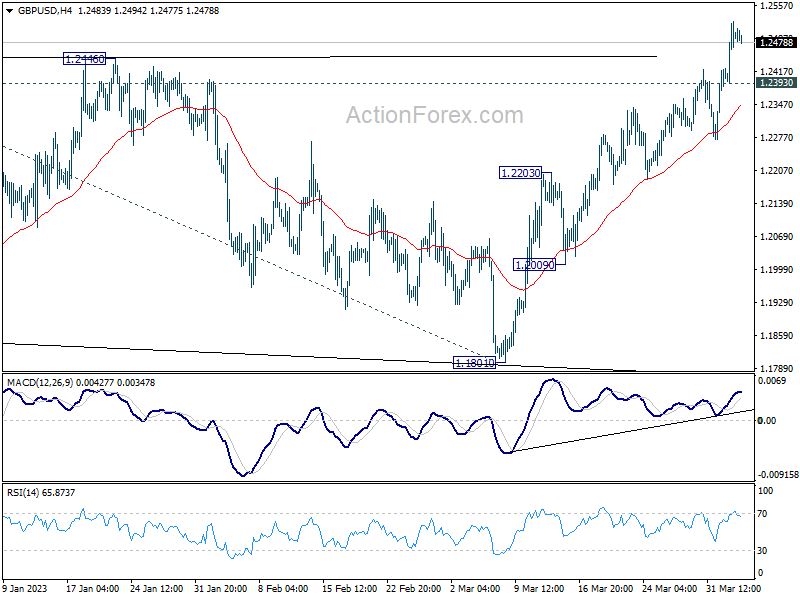
GBP/USD's rally is in progress and intraday bias remains on the upside at this point. Up trend from 1.0351 should target 1.2759 fibonacci level first . Firm break there will target 61.8% projection of 1.0351 to 1.2445 from 1.1801 at 1.3095. On the downside, below 1.2393 minor support will turn intraday bias neutral first. But retreat should be contained above 1.2203 resistance turned support to bring another rally.
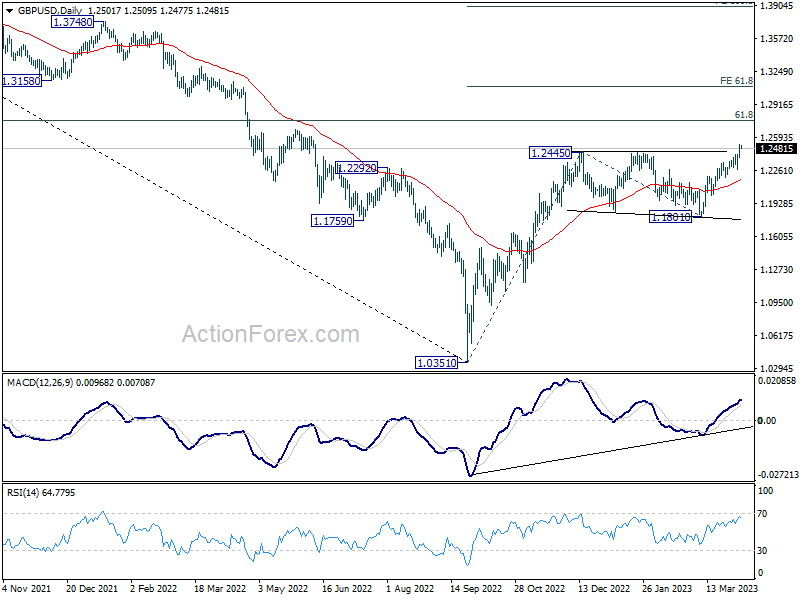
In the bigger picture, the rise from 1.0351 medium term term bottom (2022 low) is in progress for 61.8% retracement of 1.4248 (2021 high) to 1.0351 at 1.2759. Sustained break there will add to the case of long term bullish trend reversal. Further break of 61.8% projection of 1.0351 to 1.2445 from 1.1801 at 1.3095 could prompt upside acceleration to 100% projection at 1.3895. For now, this will remain the favored case as long as 1.1801 support holds, even in case of deep pull back.
USD/JPY Daily Outlook
Daily Pivots: (S1) 131.11; (P) 132.14; (R1) 132.76; More...
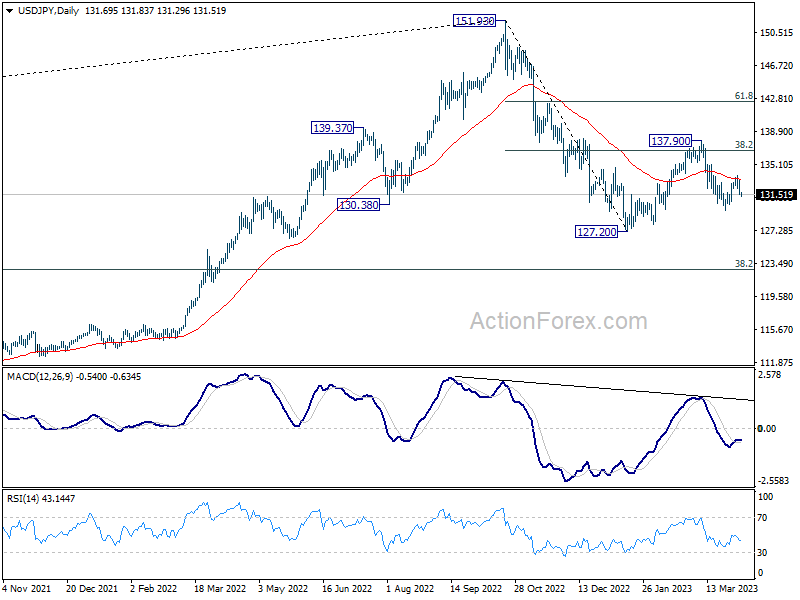
Break of 131.75 minor support suggests that recovery from 129.62 has completed at 133.74 already. Intraday bias is back on the downside for 129.62 first. Break there will resume whole fall from 137.90 to retest 127.20 low. On the upside, however, above 133.74 resistance will turn bias back to the upside for another rise. Overall, eventual downside break out is expected as long as 137.90 resistance holds.
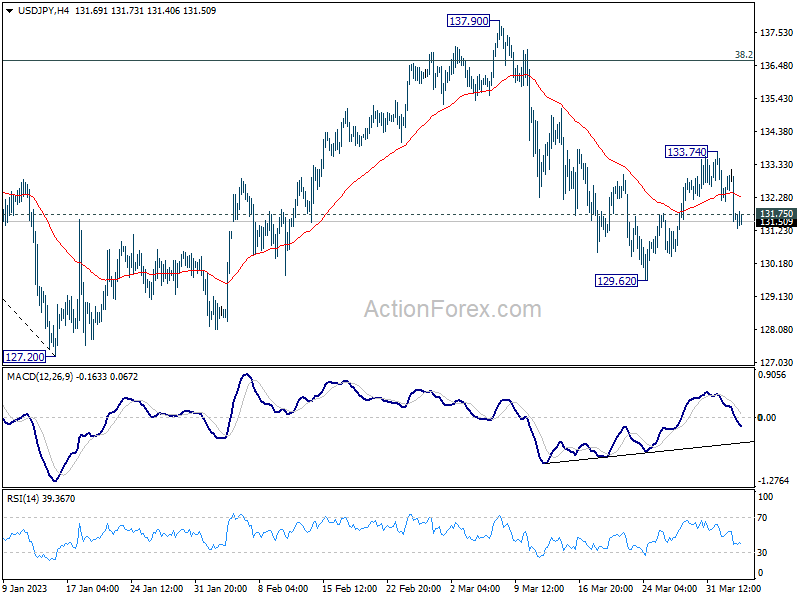
In the bigger picture, corrective pattern from 127.20 might be extending. But after all, down trend from 151.93 is expected to resume at a later stage. Break of 127.20 will resume this down trend and target 61.8% projection of 151.93 to 127.20 from 137.90 at 122.61. This will now be the favored case as long as 137.90 resistance holds.