

Sample Category Title
First Impressions: RBNZ Monetary Policy Review
The RBNZ delivered an unexpectedly large 50bp hike in the OCR, and a further 25bp rise seems on the cards for the May Monetary Policy Statement.
RBNZ Monetary Policy Review, April 2023
The Reserve Bank surprised by raising the OCR by 50 basis points to 5.25% at today’s review, rather than the 25bp that most were expecting.
In aggregate the RBNZ sees the overall profile for inflation pressures as relatively unchanged since February, when its projections showed that the OCR might need to move to 5.5% over the first half of 2023.
The RBNZ acknowledged the weaker starting point for GDP. But the downward impact this would have on their projections was balanced by upward shocks to prices in the wake of the recent flooding and Cyclone Gabrielle. The RBNZ remains concerned about the potential for inflation expectations to be unanchored by the currently high level of core and headline inflation.
The RBNZ acknowledged the recent financial stability pressures offshore, but did not see these as having any significant impact on financial conditions or financial stability in New Zealand. In any case the RBNZ affirmed that they have tools other than the OCR available to deal with financial stability pressures should they arise.
The bottom line is that the RBNZ seems intent on getting the OCR to the level they saw as sufficiently contractionary back in February – that is, an OCR of 5.50%. Any movements in the OCR beyond that point will be data-dependent, but it seems likely the base case will be for a further 25bp increase at the May Monetary Policy Statement.
Based on the tone of this release, it’s likely the RBNZ will retain a tightening bias that will be data-dependent and contingent on the economy and inflation pressures evolving as required to bring inflation expeditiously back towards the 1-3% target range.
Bitcoin Price Eyes Key Upside Break Above $30K
Key Highlights
- Bitcoin price is consolidating gains above the $27,500 support zone.
- BTC broke a key declining channel with resistance near $28,150 on the 4-hours chart.
- EUR/USD and GBP/USD climbed further higher above 1.0950 and 1.2420 respectively.
- The US ISM Services PMI could decline from 55.1 to 54.5 in March 2023.
Bitcoin Price Technical Analysis
Bitcoin price remained well bid above the $25,000 support zone. BTC/USD seems to be forming another bullish trend above the $26,000 pivot zone.
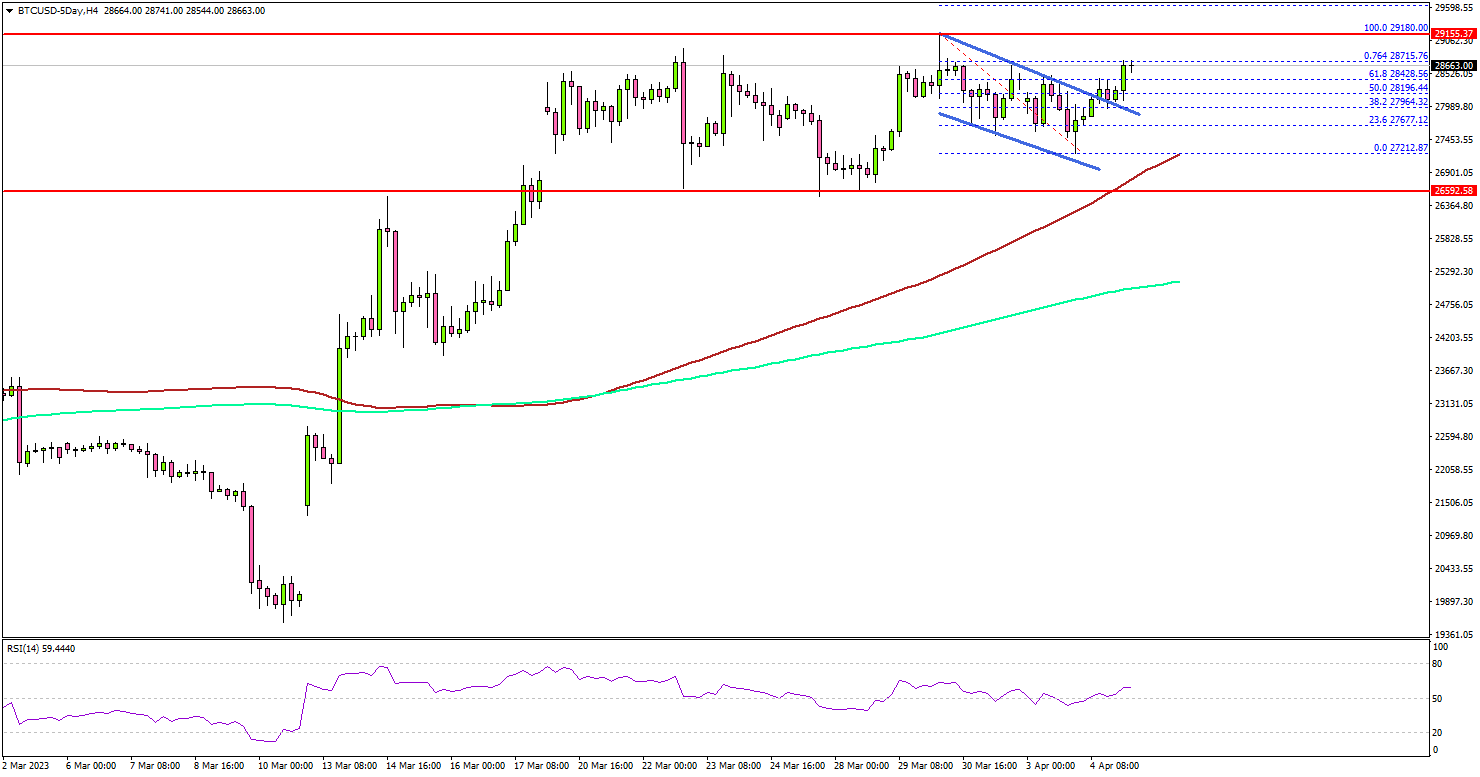
Looking at the 4-hours chart, the price started a fresh increase and was able to clear the $27,500 resistance zone. It broke a key declining channel with resistance near $28,150 to move further into a positive zone.
The price is now trading well above the 100 simple moving average (red, 4-hours) and the 200 simple moving average (green, 4-hours).
It is consolidating near the $28,500 resistance zone. The first major resistance is near the $28,800 level. A successful close above the $28,800 level might spark another bullish wave. In the stated case, the price may perhaps rise towards the $30,000 level.
Any more gains could set the pace for a larger increase to $32,000. On the downside, an initial support sits near the $27,500 level.
The main breakdown support sits near the $27,200 zone and the 100 simple moving average (red, 4-hours). If there is a downside break and close below $27,000, bitcoin might start another decline in the coming days.
In the stated case, it could revisit the $25,000 support or the 200 simple moving average (green, 4-hours). Any more losses might send the price towards $23,500.
Economic Releases
- Germany’s Services PMI for March 2023 - Forecast 53.9, versus 53.9 previous.
- Euro Zone Services PMI for March 2023 – Forecast 55.6, versus 55.6 previous.
- UK Services PMI for March 2023 – Forecast 52.8, versus 52.8 previous.
- US Services PMI for March 2023 – Forecast 53.8, versus 53.8 previous.
- US ISM Services PMI for March 2023 – Forecast 54.5, versus 55.1 previous.
Silver (XAGUSD) Breaks Higher and Forms Elliott Wave Bullish Sequence
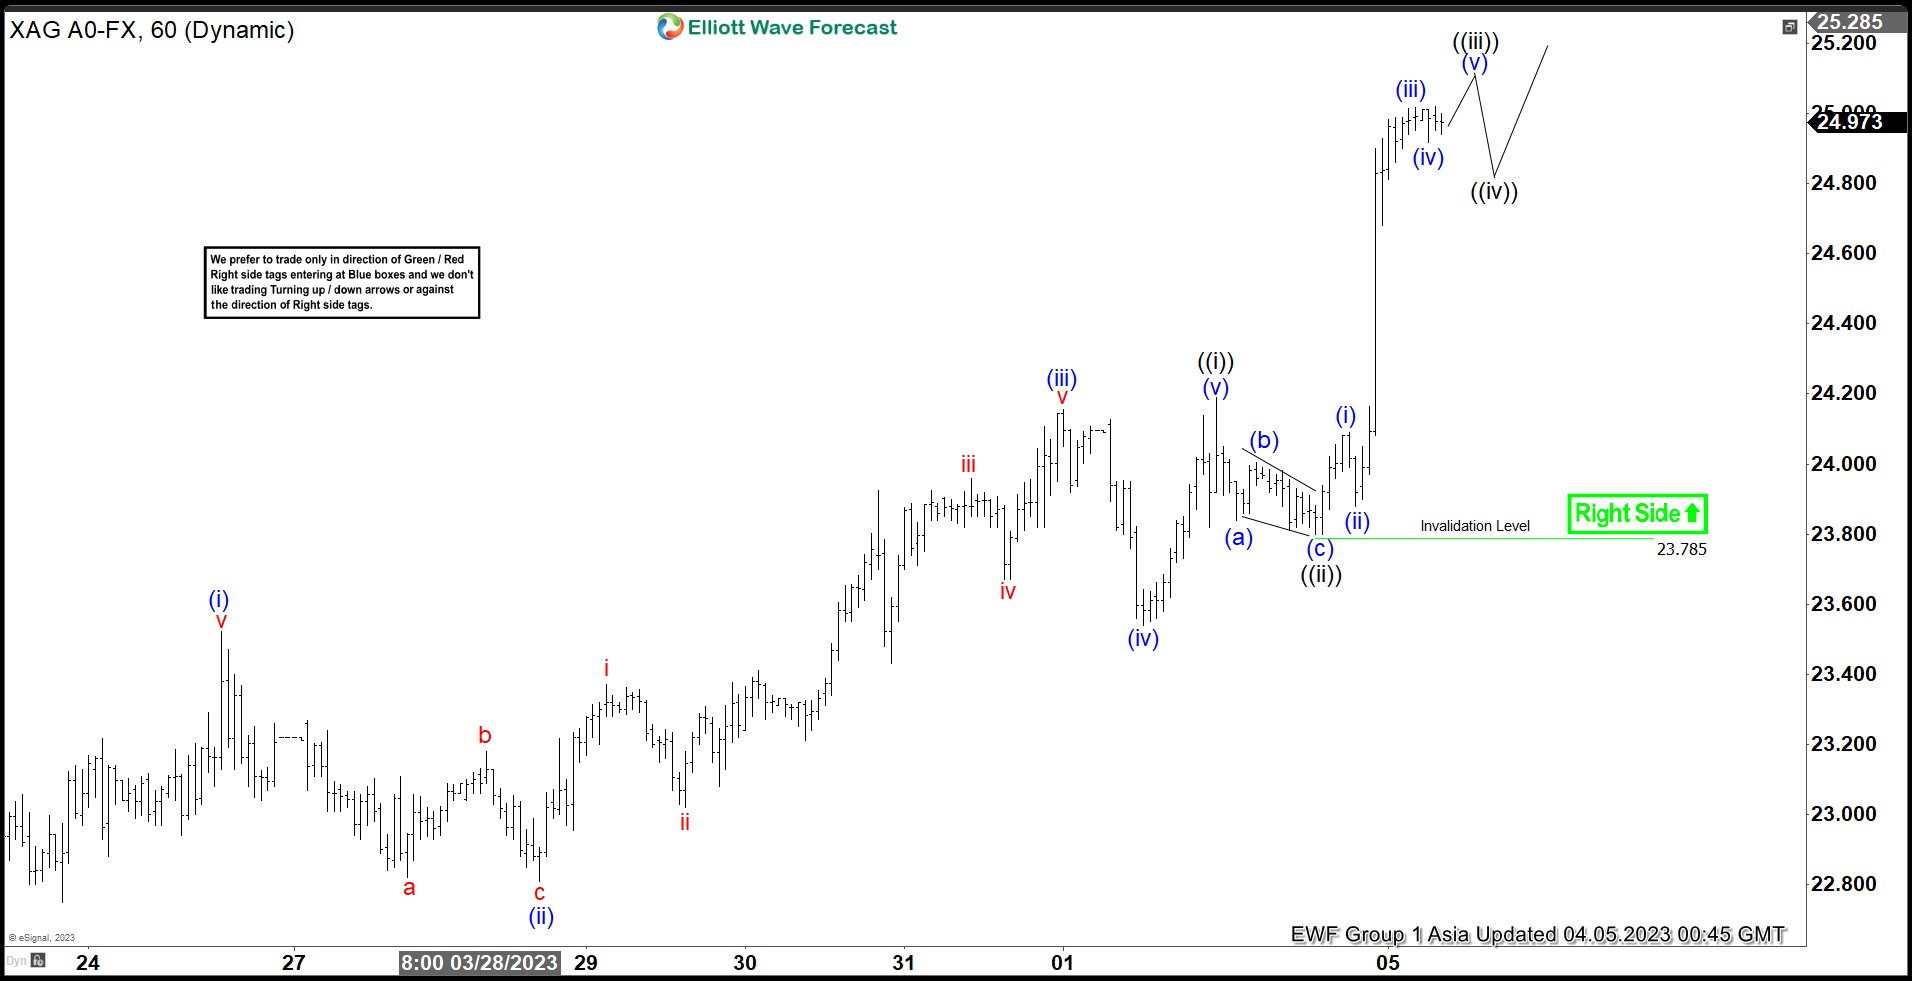
Silver (XAGUSD) broke above the previous peak on 2.2.2023 high ($24.62). As a result, it now shows a bullish sequence from 9.1.2022 low favoring further upside. A 100% – 161.8% Fibonacci extension from 9.1.2022 low targets 26.91 – 31.23. Near term, cycle from 3.10.2023 low is in progress as a 5 waves nesting impulse Elliott Wave structure. Up from 3.10.2023 low, wave 1 ended at 22.71 and pullback in wave 2 ended at 22.12. The metal has resumed higher in wave 3 which subdivides into another 5 waves in lesser degree.
Up from wave 2, the 1 hour chart below shows wave (i) ended at 23.52 and wave (ii) ended at 22.8. Wave (iii) ended at 24.15, wave (iv) ended at 23.54, and wave (v) ended at 24.19 which completed wave ((i)). Pullback in wave ((ii)) ended at 23.78. The metal extends higher in wave ((iii)) and expected to complete soon. Afterwards, it should pullback in wave ((iv)) in 3, 7, or 11 swing before it resumes higher. Near term, as far as pivot at 23.78 low stays intact, expect dips to find support in 3, 7, or 11 swing for further upside.
Silver 60 Minute Elliott Wave Chart
Silver (XAGUSD) Elliott Wave Video
Silver (XAGUSD) broke above the previous peak on 2.2.2023 high ($24.62). As a result, it now shows a bullish sequence from 9.1.2022 low favoring further upside. A 100% – 161.8% Fibonacci extension from 9.1.2022 low targets 26.91 – 31.23. Near term, cycle from 3.10.2023 low is in progress as a 5 waves nesting impulse Elliott Wave structure. Up from 3.10.2023 low, wave 1 ended at 22.71 and pullback in wave 2 ended at 22.12. The metal has resumed higher in wave 3 which subdivides into another 5 waves in lesser degree.
Are the Bulls Back for Bitcoin?
Hey, have you heard about the latest news on de-dollarization? It's the process of shifting away from the US Dollar (USD) as the world's reserve currency for trading oil and other commodities. The USD has been facing many problems lately, such as rising inflation, declining geopolitical relations, and the erosion of trust in banks and the Federal Reserve. As a result, many countries are moving towards using their currencies instead. For instance, China has already signed agreements with Australia, Russia, Japan, Brazil, and Iran to use their national currencies for trade. Moreover, the BRICS member countries are discussing the possibility of creating their currency backed not by gold but by land and rare earth metals. This could significantly weaken the USD's presence in global economic activity and boost cryptocurrencies like Bitcoin. Exciting times are ahead for global currencies, don't you think?
BTCUSD - Weekly Timeframe
The weekly timeframe of BTCUSD is currently at a drop-base-drop supply zone. It is expected that we will get to see some minor initial reactions from the supply zone. The overall market direction, however, looks largely bullish based on the break above the previously marked highs. The trendline support and the 100-period moving average are in perfect alignment. Combining that with the drop-base-rally demand zone, we have credible confirmations of the bullish sentiment.
Analysts’ Expectations:
- Direction: Bullish
- Target: $37124
- Invalidation: $19506
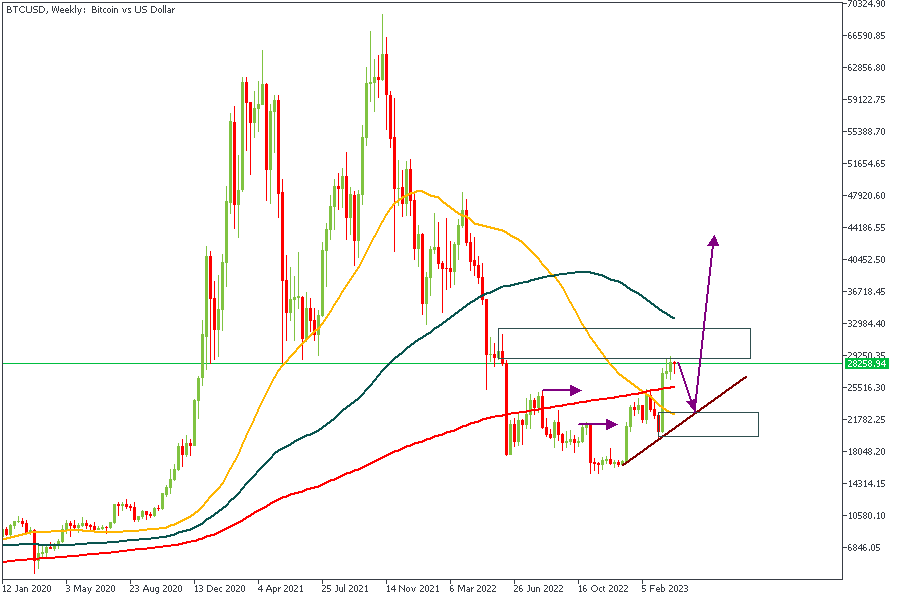
Based on the technical breakdown indicating a change in the market from a bearish to a bullish sentiment, it is safe to conclude that the Bulls might just be gearing up to resume the bullish movement once the retracement move is completed.
CONCLUSION
The trading of CFDs comes at a risk. Thus, to succeed, you have to manage risks properly. To avoid costly mistakes while you look to trade these opportunities, be sure to do your due diligence and manage your risk appropriately.
BTCUSD and XRPUSD Technical Analysis
BTCUSD – Hammer Pattern Is Above $26,529
Last week, the bearish momentum in Bitcoin price didn't sustain, and after touching the low of $26,529 on 27th March, the prices started to correct upwards against the US Dollar and touched the high of $29,171 on 30th March.
At the beginning of the week, Bitcoin is ranging near a NEW record 1-month high. We can clearly see a hammer pattern above $26,529, which signals a downtrend reversal.
Bitcoin touched an intraday low of $27,244 in the Asian trading session and an intraday high of $28,144 in the European trading session today.
The Williams percent range indicator is back over -50 in the daily timeframe, indicating a bullish trend.
Both the STOCH and STOCHRSI are reflecting overbought conditions, which means that in the immediate short term, a decline in the prices is expected.
The price is back over the pivot point in the daily timeframe, which stands for the bullish nature of the markets.
The relative strength index is near 53, which is a sign of a NEUTRAL demand for Bitcoin and a shift towards the consolidation phase in the markets.
Bitcoin is above a 200-hour simple moving average and above a 200-hour exponential moving average.
The average true range is indicating lower market volatility with a bullish momentum.
- Bitcoin bullish reversal is seen above $26,529.
- The RSI remains above 50, indicating a bullish market.
- The price is now trading above its pivot level of $28,028.
- Short-term range is moderate BULLISH.
- Some major technical indicators signal that the price may move to $28,500 and $29,000 soon.
Bitcoin Bullish Reversal Seen Above $26,529
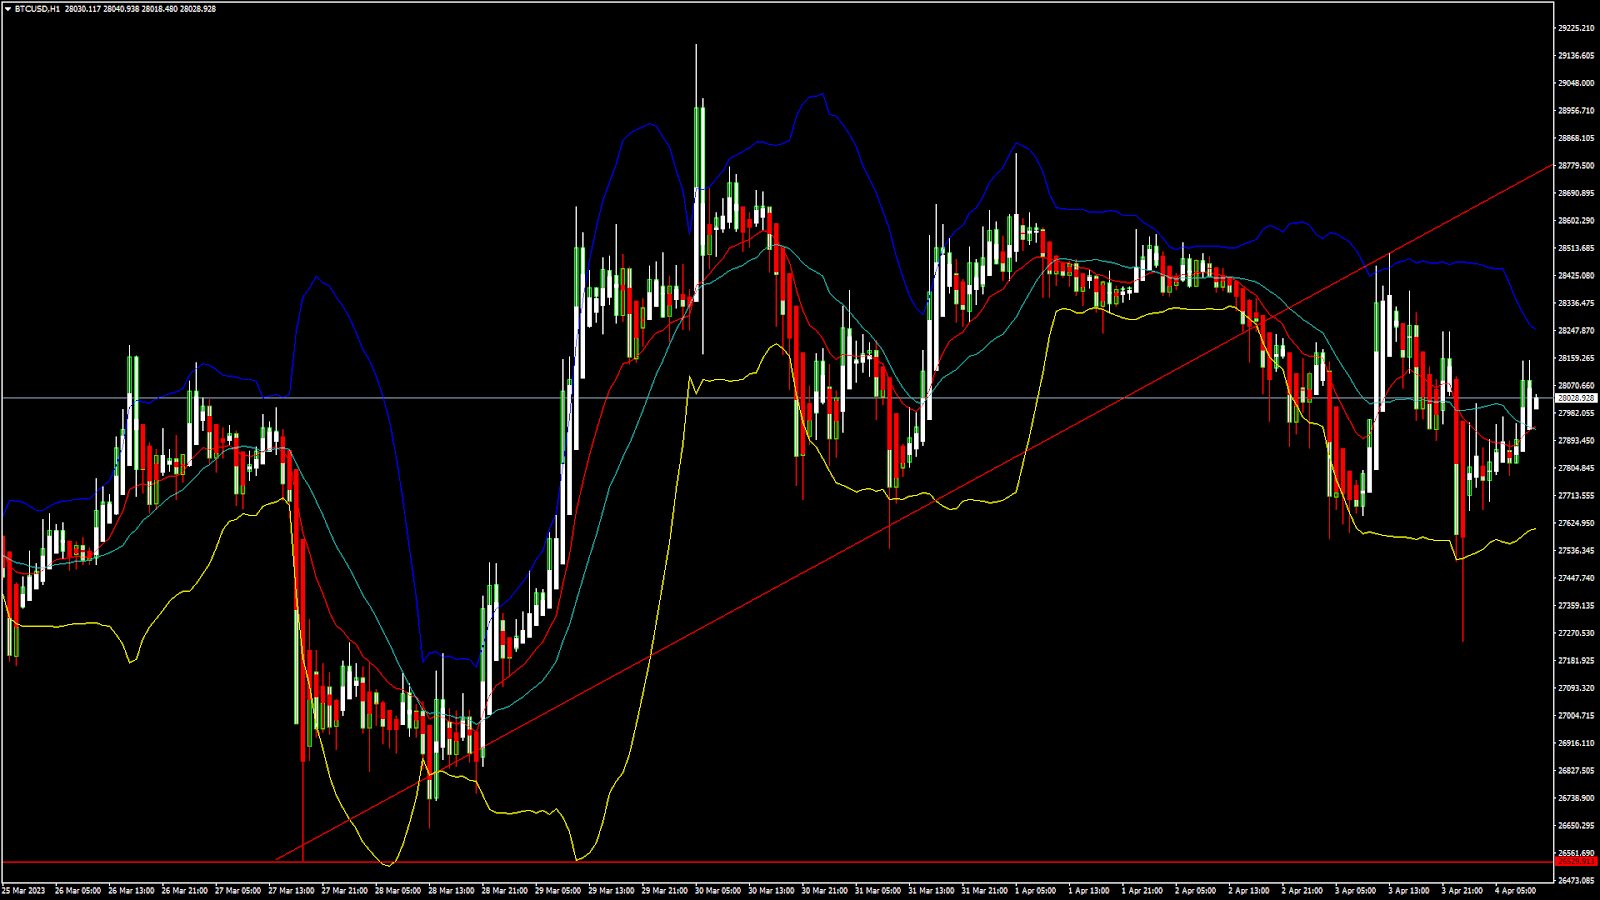
The prices of Bitcoin have been successful in crossing the $29,000 resistance, and now we are looking for fresh upsides in the range of $30,000 and $32,000.
With the continued support seen at lower levels, we can see the formation of an ascending channel which may push the prices of Bitcoin above $30,000.
There is also a bullish crossover pattern with the 20-period and 50-period adaptive moving averages in the 4-hour timeframe.
A support zone is located at $26,547, where the price crosses the 18-day moving average, and at $27,144, which is the first support of the pivot point indicator.
BTCUSD is now facing its classic resistance level of $28,188 and Fibonacci resistance level of $28,286, breaking which the price will be able to move to $29,000.
There is an increase of 31.90% in the daily trading volume, which is normal. The short-term outlook for Bitcoin is bullish, the medium-term outlook has turned bullish, and the long-term outlook remains neutral under present market conditions.
The Week Ahead
We can see that Bitcoin has now resumed its long-term uptrend with the current support at $16,538 formed on 1st January 2023, which marked the end of the crypto winter.
Now the price of Bitcoin is ranging near the triangle's support in the 1-hour chart, reflecting bullish sentiment.
The immediate expected target is $30,000, after which we may see some consolidation in the zone of the $29,500 level.
Daily RSI is at 59.72, which indicates a NEUTRAL demand for Bitcoin and the shift towards the consolidation phase in the medium-term range.
We can see the formation of a bullish trendline from $26,529 to $28,771.
The BTCUSD is now facing resistance at $29,147, which is a 13-week high, and at $30,471, which corresponds to a 14-day RSI at 70.
XRPUSD – Double Bottom Pattern Is Above $0.4548
Last week, the market sentiment turned bullish after Ripple touched a low of $0.4548 on 27th March and started to correct. On 29th March, it touched a high of $0.5846.
The market opened bearish this week. There is a double bottom pattern above the $0.4548 handle.
Ripple touched an intraday low of 0.4817 in the Asian trading session and an intraday high of 0.5020 in the European trading session today.
The MACD indicator is giving a bullish divergence signal in the 2-hour timeframe, which stands for the bullish nature of the market.
The relative strength index is at 61.43, which signifies a STRONG demand for Ripple at the current market prices and the continuation of the bullish phase in the market.
Moving averages signal an upward price movement at the current market level of 0.4955.
Both the STOCHRSI and CCI are in the overbought zones, which means the price may decline in the short-term phase.
Ripple is now trading just below its pivot level of 0.5109 and is now facing its classic resistance at 0.5813 and Fibonacci resistance at 0.5652, after which it will be able to move towards 0.6000.
Some of the major technical indicators are bullish.
- Ripple bullish reversal is seen above 0.4548.
- The price is below its pivot level.
- Average true range indicates HIGH volatility.
Ripple Bullish Reversal Seen Above $0.4548
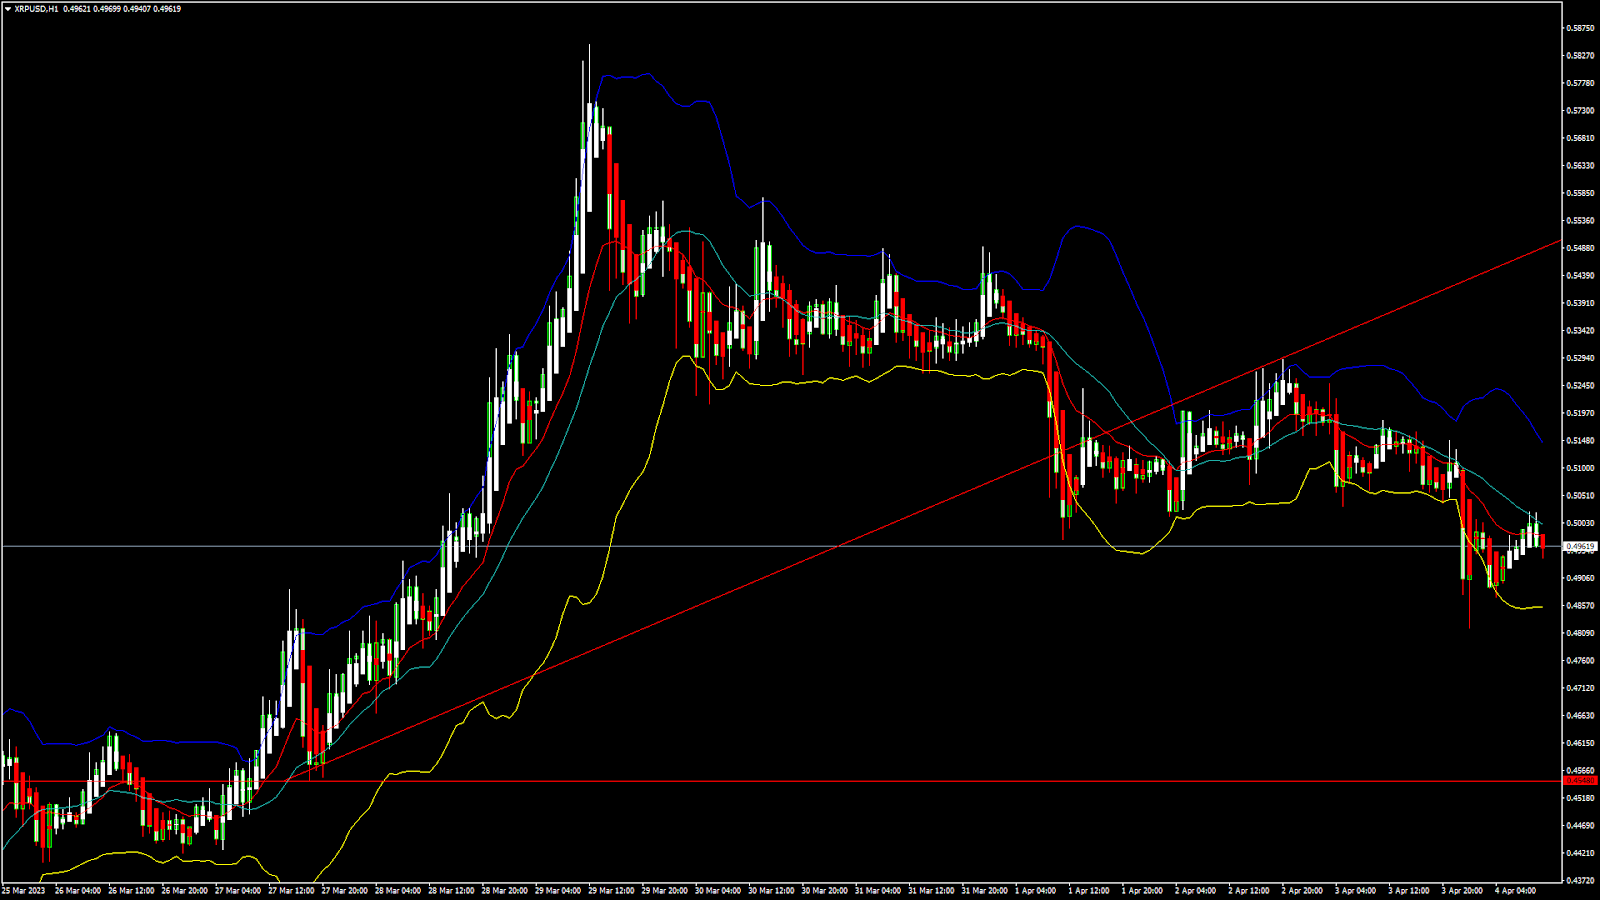
We can see that Ripple continues to move bullish, and further resistance levels are at 0.5500 and 0.6000.
The previous candle closed over Bollinger bands signalling a neutral sentiment in the weekly timeframe.
We can see the formation of the bullish trend reversal pattern with the 50-week Adaptive Moving Average in the weekly timeframe.
We have also detected a bullish price crossover with a 50-period moving average MA50 in the 15-minute timeframe.
The short-term outlook for Ripple has turned bullish, the medium-term outlook is bullish, and the long-term outlook is neutral.
We can see a decrease of 1.27% in the daily trading volumes of Ripple, which is an average value.
This Week Ahead
Ripple continues to move in a strong bullish momentum above the 0.4500 level. We are now looking for fresh upsides in the range of 0.5500 and 0.6000.
We saw a pullback after the price touched a high of $0.5846, which is expected to be short-term, and after the current phase of market consolidation gets over, we are looking for a fresh rally.
The resistance level is located at $0.5289, which is the first resistance pivot and at $0.5343.
We can see a continuous progression of a bullish trendline formation from $0.4548 to $0.5498.
The support level is located at $0.4866, which is a 38.2% retracement from the 13-week high, and at $0.4941, which is a 38.2% retracement from 4-week high.
The weekly outlook for Ripple is $0.6000 with a consolidation zone of $0.5500.
XAU/USD: Gold Surges to One-Year High
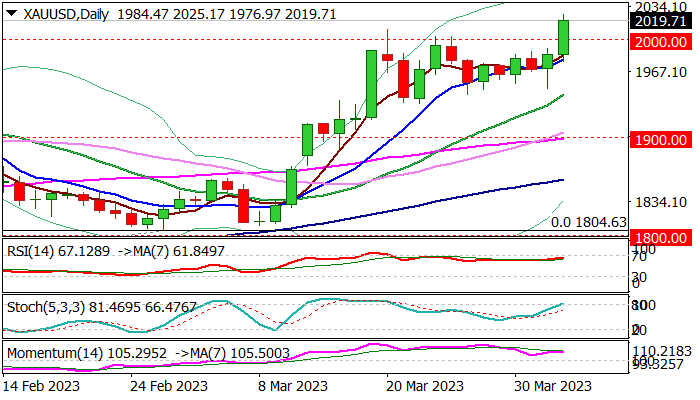
Gold was sharply up in early US trading on Tuesday, breaking through psychological $2000 level and hitting the highest since March 2022.
Fresh rally was sparked by weaker than expected US data which added to uncertainty and prompted traders from dollar into safety of the yellow metal
Today’s advance signals that extended consolidation under $2000 is likely over and the price is entering fresh bullish phase after a two-week pause.
Strong rise ($2025 peak reached so far and price holding there) adds to expectations that the latest break higher will be verified by close above broken $2000 level, which will generate bullish signal and unmask key targets at $2070 (Mar 2022 high) and $2074 (gold’s record high, posted on Aug 2020).
Overall environment is favorable for gold and improving, as the global economy remains fragile, weighed by persisting pressure from high energy prices, stubbornly high inflation, rising interest rates and continuous political and geopolitical tensions, which threaten to escalate.
Investors also sell dollar on growing speculations that the Fed may end its tightening cycle sooner than initially estimated, which also makes the greenback less attractive and adds support to gold.
Res: 2025; 2037; 2055; 2070
Sup: 2009; 2000; 1978; 1966
GBP/USD: Cable Surges to the Hghest Since June
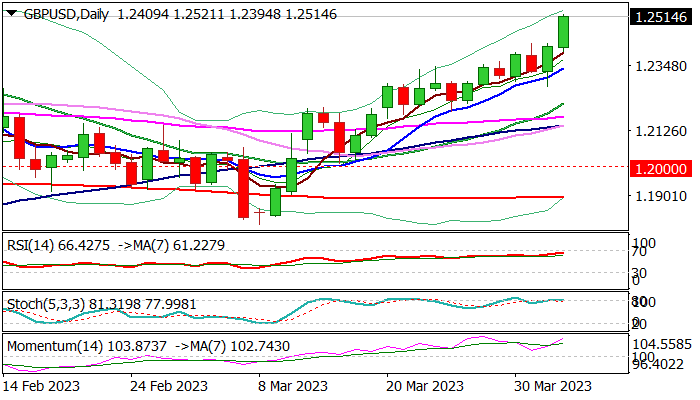
Cable extends step ascend into second straight day, extending broader uptrend above former tops (1.2447) and hit new multi-month high on probe through 1.2500 barrier, for the first time since June 2022.
Pound benefited from fresh weakness of the US dollar, as growing optimism continues to fuel risk appetite.
Markets also keep a high percentage of expectations that the Bank of England would deliver a 12th consecutive rate hike in its May policy meeting, although some calmer tones about possibility that the central bank may need to start cutting rates earlier than expect, but this was so far seen as a speculation and had no impact on pound’s near-term performance.
Technical studies keep firm bullish tone on daily chart and continue to support fresh advance, which looks for close above 1.2447 (former tops of Dec 14 / Jan 23) to generate initial signal of bullish continuation.
Additional positive signal has been generated on bullish engulfing pattern on monthly chart, after the action in past four months repeatedly failed to register close below 1.20 level, adding to significance of the support.
Also, fresh rally signaled an end of four-month consolidation and extension of an uptrend from 1.0348 (Sep 26 low), bringing in focus targets at 1.2665 (May 2022 double top); 1.2759 (Fibo 61.8% of 1.4249/1.0348 downtrend) and 1.2791 (100WMA).
Broken barriers at 1.2447 reverted to solid support, which guards rising 10DMA (1.2335), where dips should be contained.
Res: 1.2600; 1.2665; 1.2694; 1.2759
Sup: 1.2500; 1.2447; 1.2335; 1.2290
BoE Pill emphasizes need for enough tightening to see the job through
BoE Chief Economist Huw Pill, in a speech, highlighted the importance of delivering enough monetary tightening to "see the job through" and return inflation to target levels on a sustainable basis. He acknowledged the significant policy lag in monetary policy transmission but maintained that a cautious approach was still required.
Pill noted that while headline inflation is set to decline substantially during the year due to base effects and falling energy prices, it's crucial to remain vigilant regarding domestically generated inflation. He stated, "caution is still needed in assessing inflation prospects on account of the potential persistence of domestically generated inflation."
ECB Makhlouf: Must remain steadfast and ready to act as required
ECB Governing Council member Gabriel Makhlouf emphasized the need for vigilance regarding the lagging effects of monetary policy on growth and inflation.
He said today, "We must remain alert to the longer lags in the transmission of monetary policy to growth and inflation." He highlighted the importance of evaluating the impact of past monetary policy decisions on the economy when determining further action.
Makhlouf also stressed that the ECB "must remain steadfast and ready to act as required" to ensure that inflation returns to its target level over the medium-term.
He added that interest rates must be maintained at a restrictive level to dampen demand, implying a continued cautious approach by the ECB in managing inflation expectations and economic growth.