Sample Category Title
Dollar Remains Weak after Disappointing US ADP Data, Yen and Swiss Franc Rally
Disappointing US private job data doesn't trigger significant fresh selling in Dollar, but it's still maintaining its position as the week's weakest performer so far. Countervailing forces from declining US and European benchmark treasury yields are keeping the greenback's losses against Euro and Sterling in check. However, Swiss Franc and Yen seem to be making headway in broad rallies.
Australian Dollar is currently the day's weakest performer, as post-RBA selloff gains momentum. Meanwhile, New Zealand Dollar is holding onto its gains after a larger-than-expected RBNZ rate hike during the Asian session, although no clear follow-through buying has emerged.
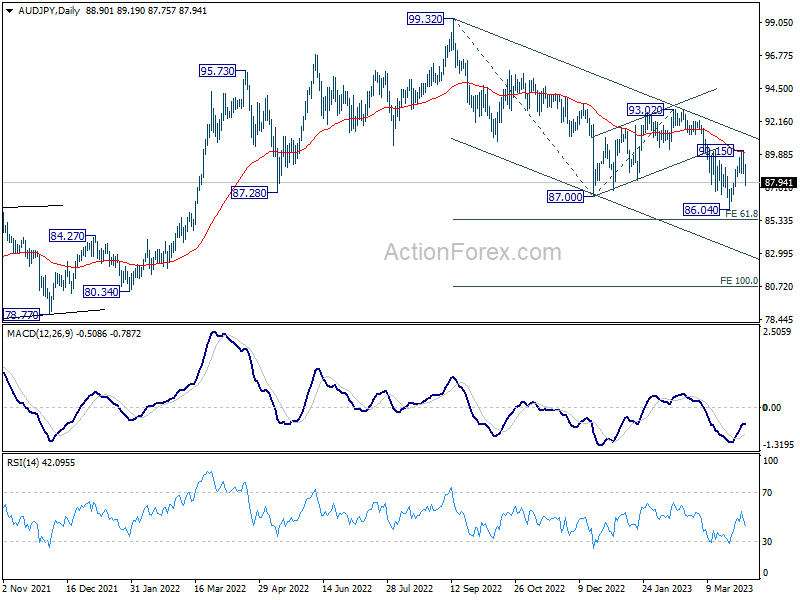
From a technical standpoint, AUD/JPY's rebound from 86.04 is likely complete at 90.15, following a rejection by the 55 day EMA. Deeper decline is now anticipated towards 86.04 and below, resuming the overall downtrend from 99.32. The key level to watch ahead is 61.8% projection of 99.32 to 87.00 from 93.02 at 85.40. Firm break below this level could trigger a more rapid decline to the 100% projection at 80.70, potentially within Q2.
In Europe, at the time of writing, FTSE is up 0.28%. DAX is down -0.51%. CAC is down -0.25%. Germany 10-year yield is down -0.019 at 2.234. Earlier in Asia, Nikkei dropped -1.68%. Japan 10-year JGB yield rose 0.0532 to 0.469. Singapore Strait Times rose 0.23%. Hong Kong and China were on holiday.
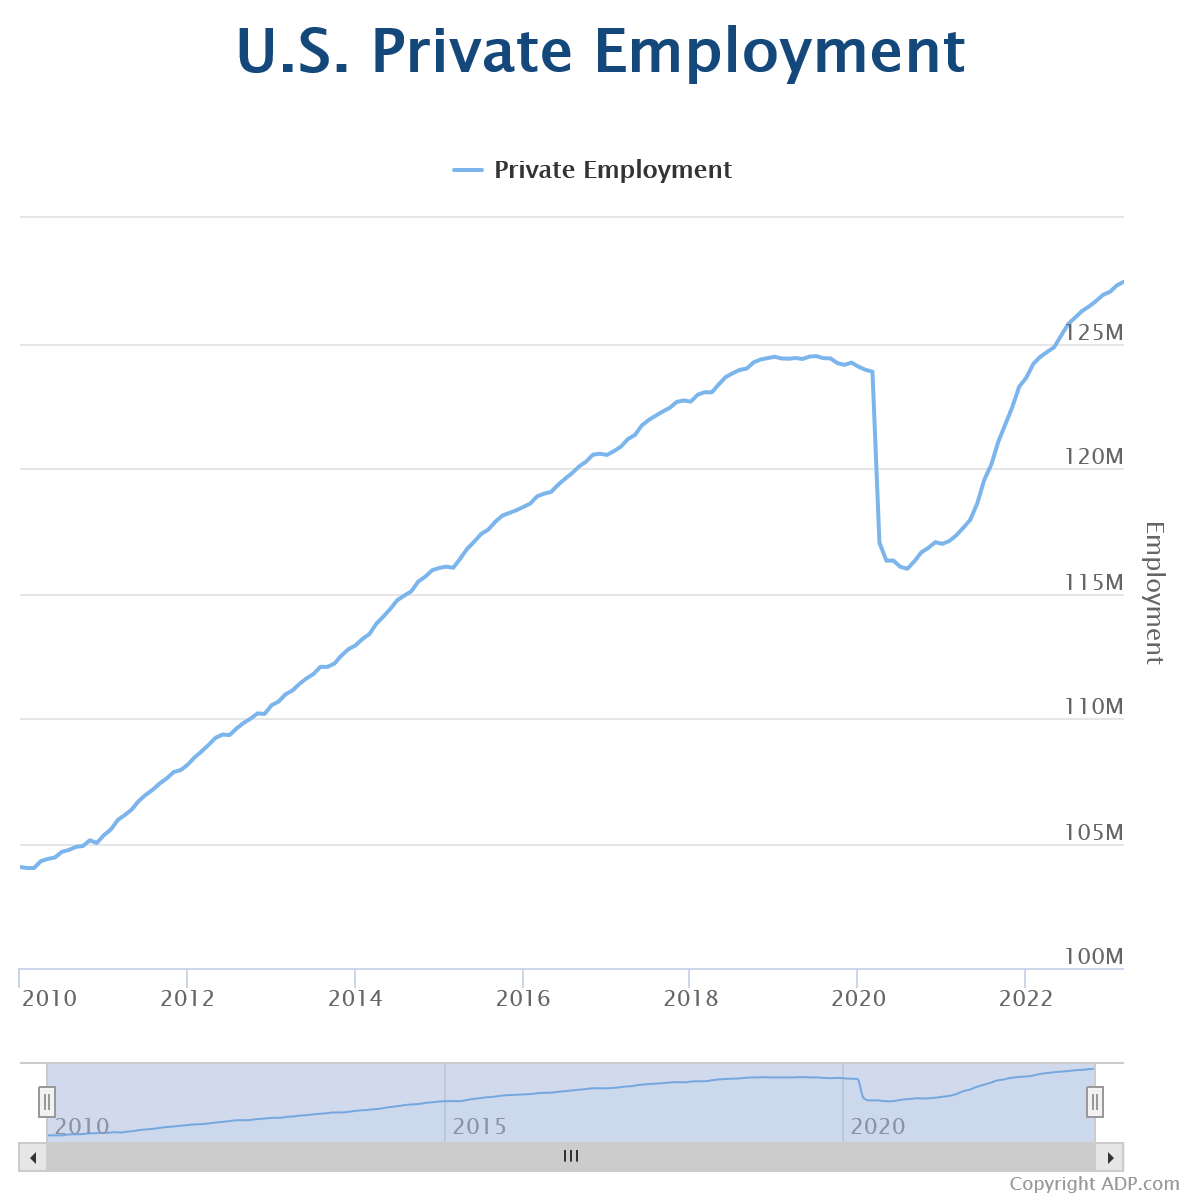
US ADP employment rose only 145k, signals economy is slowing
US ADP private sector employment increased by 145k jobs in March, well below expectation of 200k. By industry sector, goods-producing jobs increased 70k while service-providing jobs increased 75k. By establishment size, small company jobs rose 101k, medium companies rose 33k, and large companies rose 10k.
"Our March payroll data is one of several signals that the economy is slowing," said Nela Richardson, chief economist, ADP. "Employers are pulling back from a year of strong hiring and pay growth, after a three-month plateau, is inching down."
UK PMI services finalized at 52.9, composite at 52.2
UK PMI Services was finalized at 52.9 in March, down from February's 53.5. PMI Composite was finalized at 52.2, down from prior month's 53.1.
Tim Moore, Economics Director at S&P Global Market Intelligence, noted that the UK service sector returned to growth in Q1 2023 due to improved business and consumer confidence, as well as a sustained rebound in new orders. Export sales also boosted the service economy, with the fastest rise in new orders from abroad in over eight years.
Overall business expenses increased at the slowest pace since May 2021, as lower transport bills and falling commodity prices offset rising staff costs. Moore highlighted that prices charged by service sector businesses increased at the weakest rate in 19 months, signaling that competitive pressures and improved supply conditions would likely reduce consumer price inflation in the coming months.
Eurozone PMI composite finalized at 10-month high, but growth varies across countries
Eurozone PMI Services was finalized at 55.0 in March, up from February's 52.7. PMI Composite was finalized at 53.7, up from prior month's 52.0. Both indexes were at their 10-month highs.
Looking at PMI Composite of some member states, improvements were seen in Spain (58.2, 16-month high), Italy (55.2, 16-month high), France (52.7, 10-month high), and Germany (52.6, 10-month high). Ireland dropped to 52.8, 2-month low.
Joe Hayes, Senior Economist at S&P Global Market Intelligence said eurozone economy is rebounding from the slowdown seen in late 2022, and for now, appears to be clear of a recession.
He noted that March's economic activity increase was driven by strong growth in the service sector, but highlighted that growth varies across countries, with significant contributions from Spain and Italy. However, modest activity levels in Germany and France suggest a more conservative outlook for the eurozone's overall economic health.
Hayes also mentioned that the case for further interest rate hikes remains strong, as inflation rates, though cooling from their peaks, continue to run high, especially in the service sector.
RBNZ hikes 50bps after considering a 25bps move too
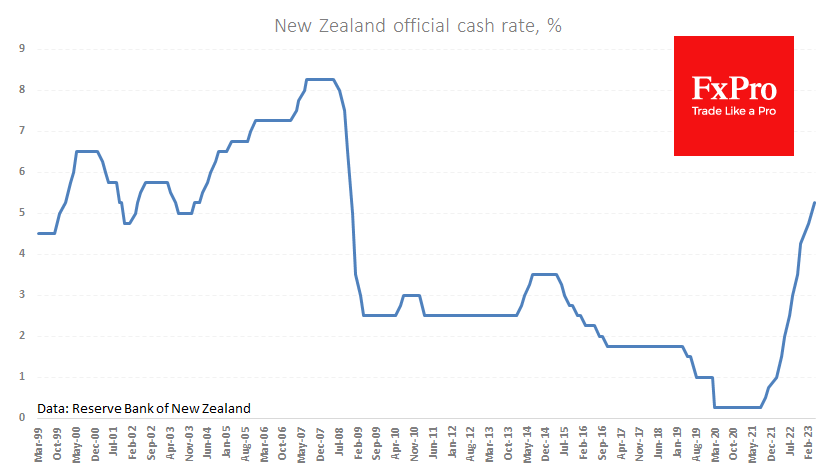
In an unexpected move, RBNZ raised the Official Cash Rate by 50bps to 5.25%, doubling the anticipated 25bps hike. This bold step reflects the central bank's concerns about persistently high inflation and employment levels.
The RBNZ statement highlighted that "inflation is still too high and persistent, and employment is beyond its maximum sustainable level." Despite lower-than-expected economic activity in the December quarter, demand continues to outstrip supply, exerting further pressure on annual inflation.
The statement also noted that severe weather events in the North Island have contributed to higher prices for some goods and services. This increased near-term CPI inflation poses a risk of inflation expectations remaining above the target range.
In the meeting minutes, the Committee emphasized the need to continue raising the OCR to bring inflation back to the 1-3% target and fulfill their remit. They discussed both 25 and 50 basis point increases, ultimately opting for the more aggressive 50 basis point hike. This decision aims to maintain current lending rates for businesses and households while supporting an increase in retail deposit rates, countering the downward pressure on lending rates caused by falling wholesale interest rates since the February Statement.
RBA Lowe: To hold doesn't imply tightening is over
RBA Governor Philip Lowe, in a speech today, clarified that the decision to keep interest rates unchanged yesterday does not mark the end of tightening measures.
"The decision to hold rates steady this month does not imply that interest rate increases are over. Indeed, the Board expects that some further tightening of monetary policy may well be needed to return inflation to target within a reasonable timeframe," he said.
Acknowledging that monetary policy is now in restrictive territory, Lowe said it was time to hold interest rates steady and gather more information. He also mentioned that RBA will review its monetary policy stance at the next meeting, taking into account updated forecasts and scenarios.
USD/CHF Mid-Day Outlook
Daily Pivots: (S1) 0.9031; (P) 0.9087; (R1) 0.9118; More...
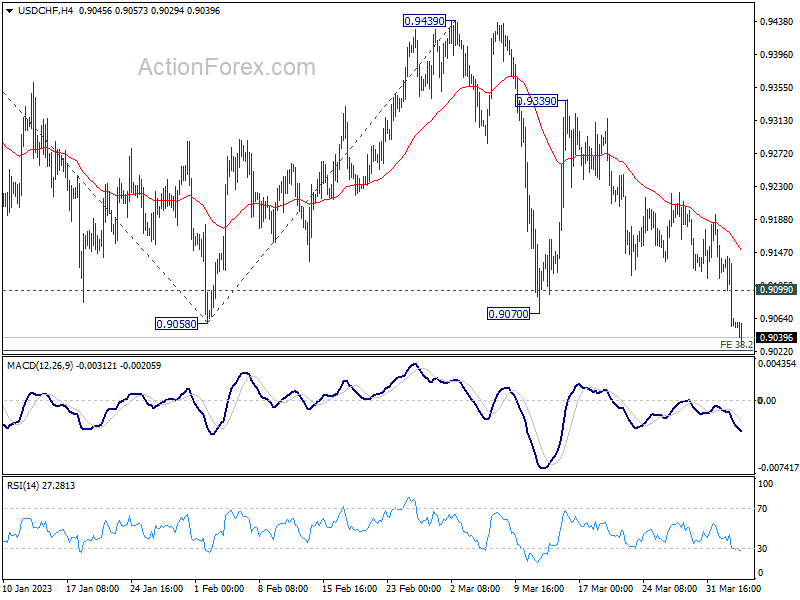
Intraday bias in USD/CHF stays on the downside for 38.2% projection of 1.0146 to 0.9058 from 0.9439 at 0.9023. Decisive break there will extend the down trend from 1.0146 to 61.8% projection at 0.8767.On the upside, above 0.9099 minor resistance will delay the bearish case and turn intraday bias neutral again.
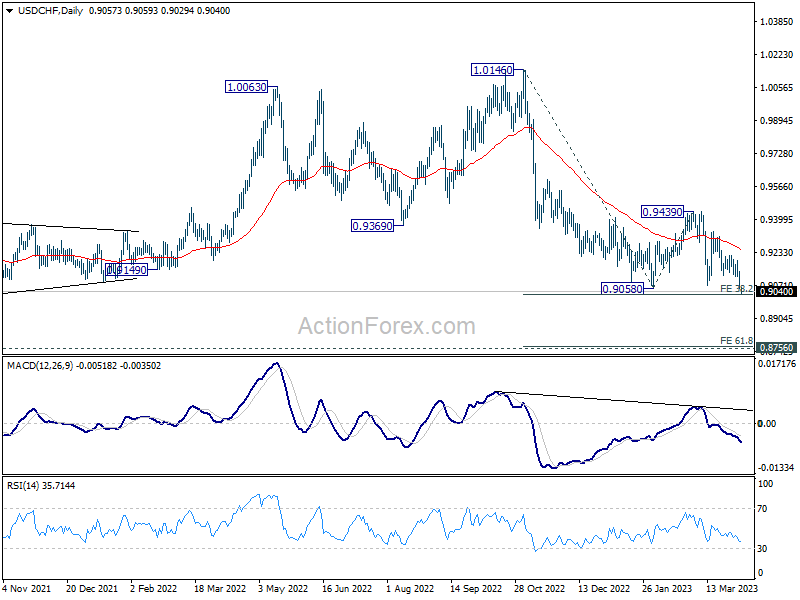
In the bigger picture, outlook will stay bearish as long as 0.9439 resistance holds, and fall from 1.1046 (2022 high) is still in progress. Prior rejection by 55 week EMA was a medium term bearish sign. Sustained of 0.9058 will resume such decline towards 0.8756 support (2021 low). But overall, this fall is still as a leg in the long term range pattern from 1.0342 (2016 high). So, downside should be contained by 0.8756 to bring reversal.
Economic Indicators Update
| GMT | Ccy | Events | Actual | Forecast | Previous | Revised |
|---|---|---|---|---|---|---|
| 02:00 | NZD | RBNZ Interest Rate Decision | 5.25% | 5.00% | 4.75% | |
| 06:00 | EUR | Germany Factory Orders M/M Feb | 4.80% | 0.40% | 1.00% | 0.50% |
| 06:45 | EUR | France Industrial Output M/M Feb | 1.20% | 0.60% | -1.90% | -1.40% |
| 07:45 | EUR | Italy Services PMI Mar | 55.7 | 53 | 51.6 | |
| 07:50 | EUR | France Services PMI Mar F | 53.9 | 55.5 | 55.5 | |
| 07:55 | EUR | Germany Services PMI Mar F | 53.7 | 53.9 | 53.9 | |
| 08:00 | EUR | Eurozone Services PMI Mar F | 55 | 55.6 | 55.6 | |
| 08:30 | GBP | Services PMI Mar F | 52.9 | 52.8 | 52.8 | |
| 09:00 | EUR | Italy Retail Sales M/M Feb | -0.10% | 0.50% | 1.70% | |
| 12:15 | USD | ADP Employment Change Mar | 145K | 200K | 242K | 261K |
| 12:30 | CAD | Trade Balance (CAD) Feb | 0.4B | 2.2B | 1.9B | 1.2B |
| 12:30 | USD | Trade Balance (USD) Feb | -70.5B | -68.5B | -68.3B | -68.7B |
| 13:45 | USD | Services PMI Mar F | 53.8 | 53.8 | ||
| 14:00 | USD | ISM Services PMI Mar | 54.5 | 55.1 | ||
| 14:30 | USD | Crude Oil Inventories | -1.6M | -7.5M |
USD/CAD – Canadian Dollar Eyes Canada’s Job Report
The Canadian dollar has edged lower ahead of the North American session. On the economic front, the US releases ADP Employment Change and the ISM Services PMI later today. There are no tier-1 releases out of Canada today, but we’ll get a look at the March employment report on Thursday.
In the European session, USD/CAD is trading at 1.3464, up 0.14% on the day.
Markets eye NFP after soft JOLTS Jobs Openings
In the US, a soft JOLTS Job Openings release has investors focussed on the health of the US labour market. Employment numbers have been surprisingly strong in the face of rising interest rates, but investors are smelling blood in the water after a weak employment release yesterday. JOLTS Job Openings fell to 9.93 million in February, down from 10.56 million and its lowest level since May 2021.
Will nonfarm payrolls also miss expectations? If so, it would point to weakness in the labour market and the Fed would have an excuse to take a pause in rates at the May meeting. The ADP Employment Change is expected to fall to 200,000, down from 242,000 prior. A weak reading will garner headlines, but the ADP release isn’t considered a reliable precursor of nonfarm payrolls and is unlikely to swing market direction.
Canada’s job numbers up next
Canada’s employment report usually coincides with the US employment report on a Friday. A quirk in the calendar has Canadian markets closed for a holiday on Friday, so Canada’s employment data will be released on Thursday, a day ahead of the US numbers. The economy is expected to have created 12,000 new jobs in March, down from 21,800 in February, while unemployment is projected to inch higher to 5.1%, up from 5.0%.
USD/CAD Technical
- USD/CAD is testing support at 1.3431 earlier today. The next support level is 1.3354
- 1.3590 and 1.3673 are the next resistance line.
US ADP employment rose only 145k, signals economy is slowing
US ADP private sector employment increased by 145k jobs in March, well below expectation of 200k. By industry sector, goods-producing jobs increased 70k while service-providing jobs increased 75k. By establishment size, small company jobs rose 101k, medium companies rose 33k, and large companies rose 10k.
"Our March payroll data is one of several signals that the economy is slowing," said Nela Richardson, chief economist, ADP. "Employers are pulling back from a year of strong hiring and pay growth, after a three-month plateau, is inching down."
USD/CHF: Falls to Multi-Month Low as Pressure on Greenback Rises
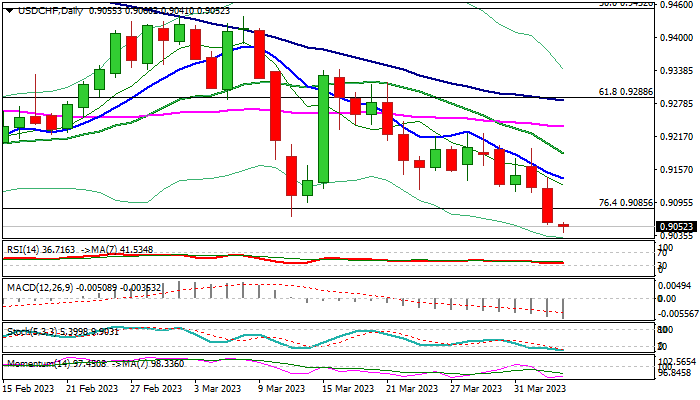
The dollar fell to the lowest level since Aug 2021 against Swiss franc on Wednesday, in extension of sharp bearish acceleration in past two days, when the pair lost 1.1% of its value.
Fresh weakness broke through key med-term supports at 0.9060/80 zone (lows of Nov 2021 / Feb/Mar 2023), signaling continuation of larger downtrend from 1.0147 (Oct 2022 peak) which still requires confirmation on sustained break of these levels.
Initial target lays at 0.9000 (psychological), followed by a higher base at 0.8925/30 (May 2021), which guard key support at 0.8757 (2021 low, the lowest since 2015).
Firmly bearish studies on all larger timeframes (day / week / month) support the notion, although oversold conditions suggest that bears my lose traction and enter consolidation in coming sessions.
Broken Fibo barrier at 0.9085 (76.4% retracement of larger 0.8757/1.0147 downtrend) reverted to initial resistance, ahead of falling 10DMA (0.9140) which is expected to cap extended upticks, to keep bears intact.
The US dollar’s near-term outlook remains weak, with the latest downbeat US data and signals that Fed’s tightening cycle is likely near its end, add to negative stance.
Today’s ADP private sector labor data (Mar 200K f/c vs Feb 242K) is in immediate focus, as markets look for more information about the situation in the US labor sector, with more details to be provided by Friday’s non-farm payrolls report (Mar 240K f/c vs Feb 311K).
Caution on holiday-thinned markets due to Good Friday, which may spark higher volatility.
Res: 0.9085; 0.9119; 0.9140; 0.9186.
Sup: 0.9000; 0.8925; 0.8871; 0.8757.
New Zealand Dollar Surges But Unable to Consolidate after RBNZ Hkes by 50 Basis Points
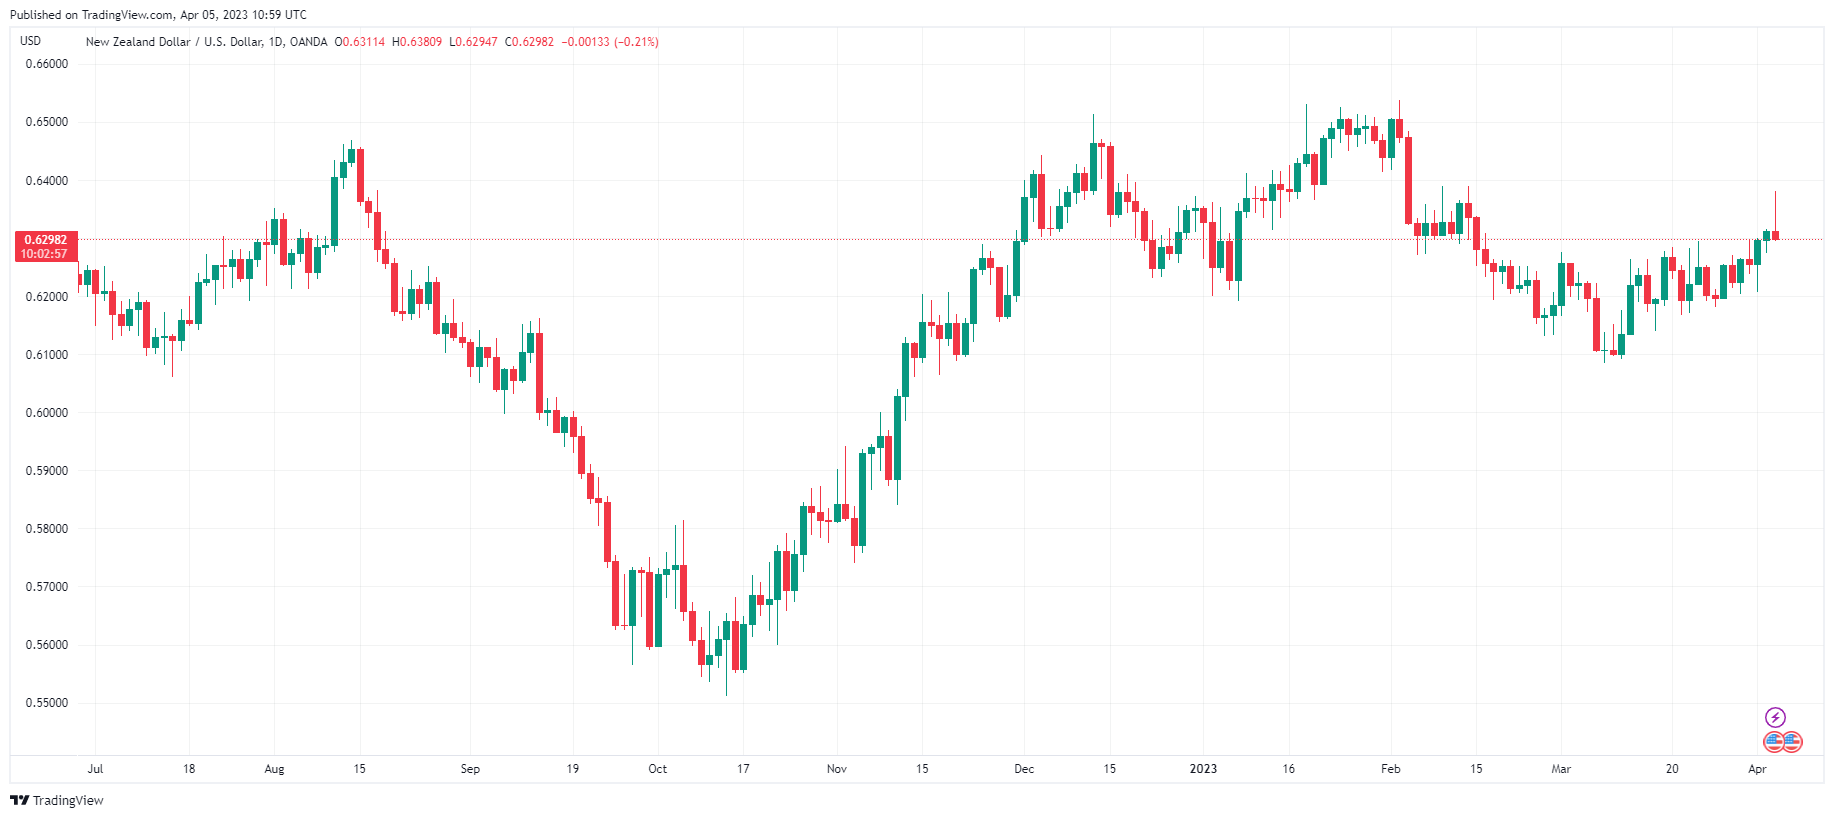
The New Zealand dollar is showing sharp movement on Wednesday after the Reserve Bank of New Zealand shocked the markets and raised rates by 50 basis points. In the US, JOLTS Jobs Openings was below expectations, raising concerns about the strength of the US labour market.
In the European session, NZD/USD is trading at 0.6296, down 0.24%.
RBNZ stuns markets
The RBNZ gets the prize for shocker of the week, after the central bank delivered a 50-bp hike, bringing the benchmark cash rate to 5.25%. Most analysts were expecting a modest 25-bp increase and ahead of the decision, the markets had priced in such a move at a massive 86%. The New Zealand dollar climbed over 1% following the decision, but has pared all of the gains and fallen into negative territory.
The RBNZ statement noted that inflation remains too high, and there’s no arguing that point, as CPI was unchanged in the fourth quarter at 7.2%. The reason that the markets were completely blindsided was that the economy is sputtering. GDP declined by 0.6% in the fourth quarter. The uncertain global outlook doesn’t bode well for the export-dependent economy, and high interest rates and red-hot inflation are hurting domestic demand. This writer suggested yesterday that it seemed a sensible time for the RBNZ to take a breather, but instead, the Bank pushed the rate pedal down even harder than expected.
In the US, a soft JOLTS Job Openings release has the markets abuzz about the strength of the US labour market. JOLTS slipped to 9.93 million, down from 10.56 million and its lowest level since May 2021. The nonfarm payrolls report on Friday will have added significance, as a soft reading would put pressure on the Fed to take a pause at its meeting in May.
NZD/USD Technical
- NZD/USD tested resistance at 0.6362 earlier. Above, there is resistance at 0.6425
- 0.6308 and 0.6245 are providing support
Dollar Index – Consolidation to Precede Final Push Towards 100.66/00 Targets
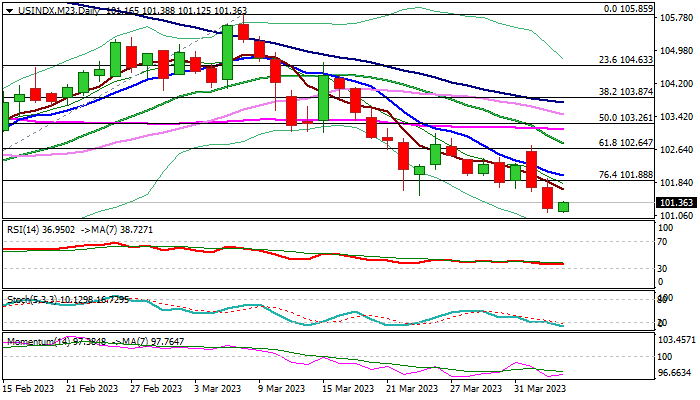
The dollar index consolidating above new two-month low, posted after a sharp fall in past two days.
The greenback was deflated by renewed risk appetite, while weak latest economic data from the US suggest that economic conditions are fragile and suggest that the Fed likely near the end of its tightening cycle that makes the US currency less attractive for investors.
Markets will continue to closely watch the US data to get more clues about economic growth, particularly due to the banking stress, which would strongly influence dollar’s performance, as the latest crisis in the sector faded, but many remain very cautious regarding this problem.
The latest drop marked retracement of the most of 100.66/105.85 rally and pushed the price close to key support at 100.66 (2023 low), with the action being additionally supported by bearish daily studies.
However, oversold conditions on daily chart signal that larger bears may take a breather and consolidate before final push towards 100.66 and 100.00 (psychological) in extension.
Upticks are expected to stall under falling 10DMA (102.02) to offer better opportunities to re-enter larger bearish market.
Only lift above 102.73/78 (Monday’s top / falling 20DMA) would sideline bears and open way for stronger correction.
Res: 101.53; 101.88; 102.02; 102.64
Sup: 101.12; 100.66; 100.00; 99.30
Rate Surprise from New Zealand
The Reserve Bank of New Zealand made another rate hike of 50 points to 5.25%. Contrary to forecasts of a 25-point rate hike and the global trend towards a slowdown in policy tightening, the RBNZ has not slowed down a step. In this cycle, the rate has already been increased by 500 points.
A higher-than-expected rate hike caused the NZDUSD to rise 1.2% within a minute to 0.6378. However, a few minutes later, the excitement for the New Zealand currency eased, and the pair almost erased this rise, returning to the 0.6310 level at the start of the day.
In our view, the pressure on the NZD was due to hints that this could be the end of the RBNZ’s hike cycle, suggesting a slowdown in domestic demand and normalisation of domestic price pressures as the weather in the north of the country normalises.
The NZDUSD has maintained an upward trend for almost a month, receiving support from increasingly higher levels. We consider the smooth reversal to the upside in the pair in March from the 200-day average line as a milestone. On Monday, the Kiwi crossed above its 50-day average, which is also a signal that Today’s intraday trend shows that the bulls cannot increase the momentum of this trend.
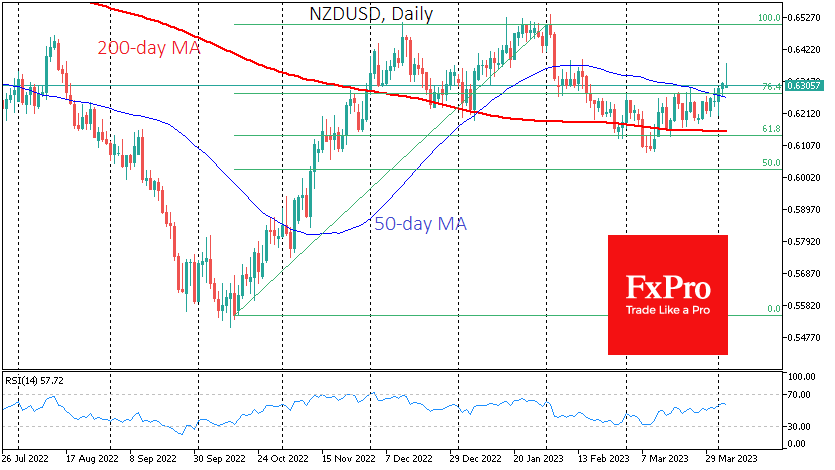
Despite a strong sell-off shortly after the rate decision, the NZDUSD doesn’t look overbought, and there are no significant resistance levels until the area of 0.6500.
And the Kiwi might continue. The pair had an almost canonical Fibonacci retracement from the October-January rise in February and early March and has been moving gently upwards since then, with the potential to reach 0.70-0.71 before the end of the year.
Ethereum’s Overtaking
Market picture
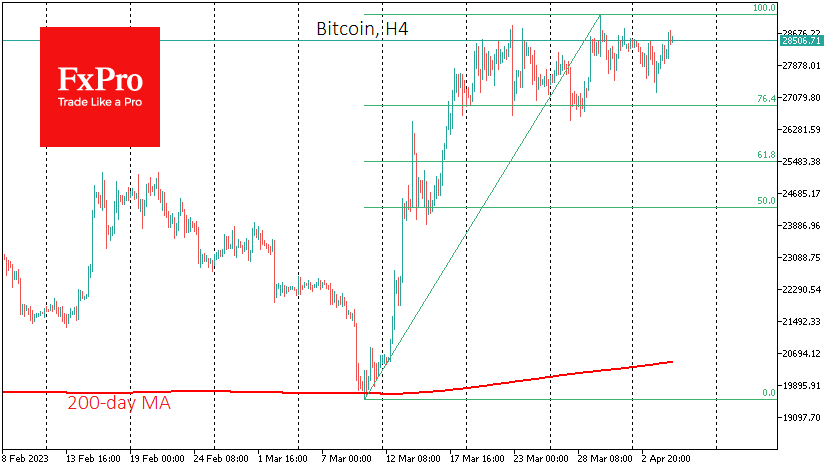
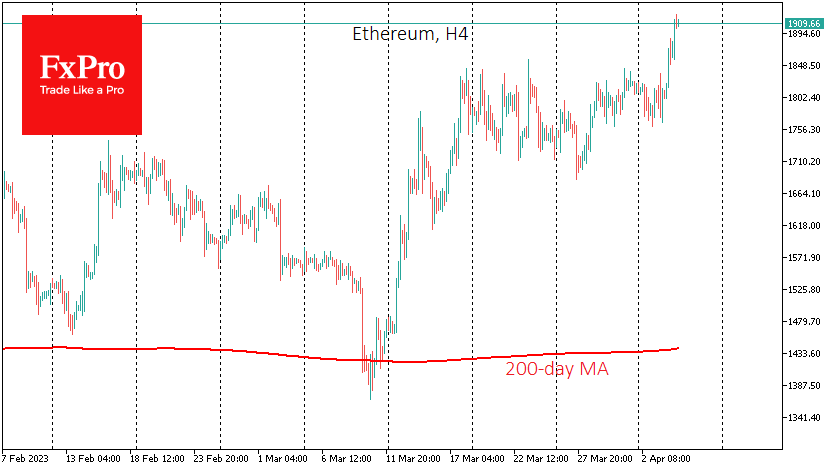
The cryptocurrency market has gained over 3% in the last 24 hours, reaching $1.21 trillion. Interestingly, Bitcoin has yet to keep pace with the overall crypto market growth, adding 2.3% to $28.55K over the same period. Ethereum, on the other hand, has risen by 5.5% to $1910.
The first cryptocurrency is stuck in local highs, above which it has been unable to consolidate since 19th March. This prolonged consolidation sets the stage for the next big move. The resolution of this consolidation is likely to be linked to the market’s reaction to Friday’s Non-Farm Payrolls. Technically, a pullback to the $27k level to correct the rally of the 10th of March is likely.
A more bullish scenario is offered by Ethereum, which broke through resistance in a sharp move yesterday and continues to gain traction, reaching an 8-month high. The dynamics within the Fibonacci theory suggest that a target near $2150 could be considered.
News background
According to Kaiko estimates, Binance’s share of the spot crypto market fell by 16% to 54% in the first quarter. The decline was facilitated by removing commission-free trading on several instruments and the CFTC lawsuit.
The CFTC’s lawsuit against Binance did not result in a significant outflow of users from the platform and reduced investor confidence in BTC, Glassnode noted. The transitional structure of the Bitcoin market continues to take shape after a bearish period. The number of addresses holding at least one BTC is approaching 1 million.
According to Brown Brothers Harriman (BBH) research, nearly 3/4 of institutional investors surveyed said they were “extremely or very interested” in cryptocurrency ETFs. Meanwhile, only 25% of respondents plan to increase their investments over the next year.
The US Department of Justice reported seizing $112 million in digital assets from cryptocurrency fraud and money laundering perpetrators.
AUD/USD: Aussie Dollar Under Increased Pressure on Expectations that Interest Rate Has Peaked
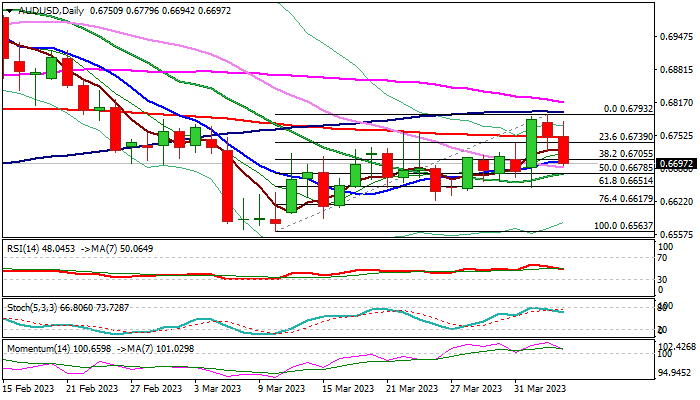
Australian dollar remains in red for the second consecutive day, with bearish acceleration in early Wednesday, generating an initial signal of reversal, after recovery leg from 0.6563 Mar 10 low, stalled under 100DMA (0.6797).
The Aussie came under increased pressure after the Reserve Bank of Australia stayed on hold on Tuesday, keeping its cash rate unchanged at 3.6% after ten consecutive rate hikes and was further deflated on today’s comments from National Australia Bank.
NAB said it expects that Australia’s interest rate has peaked at 3.6%, from previous forecast of 3.85% which was revised last week from 4.1%, with strong downward revisions within a short period of time.
Economists expects inflation to moderate in coming months that would keep the central on hold, probably until the first half of 2024, when the first rate cut is expected.
Technical picture on daily chart is weakening as 14-d momentum is in steep descend and approaching the centreline and thickening falling daily cloud after yesterday’s twist, increases downside pressure.
Break of 200DMA (0.6748) generated initial negative signal, which was boosted by violation of next pivots at 0.6705/00 (Fibo 38.2% of 0.6563/0.6793 / 10DMA), with close below these levels required to confirm signal.
Bears eye immediate target at 0.6678 (20DMA / 50% retracement), ahead of more significant 0.6651 (Fibo 61.8% / Monday’s low) break of which would confirm an end of 0.6563/0.6793 corrective phase.
Near term bias is expected to remain with bears while the price action stays below 200DMA, which guards upper pivot at 0.6797 (100DMA).
Res: 0.6705; 0.6739; 0.6748; 0.6797
Sup: 0.6678; 0.6651; 0.6617; 0.6589
Technical Outlook and Review
DXY:
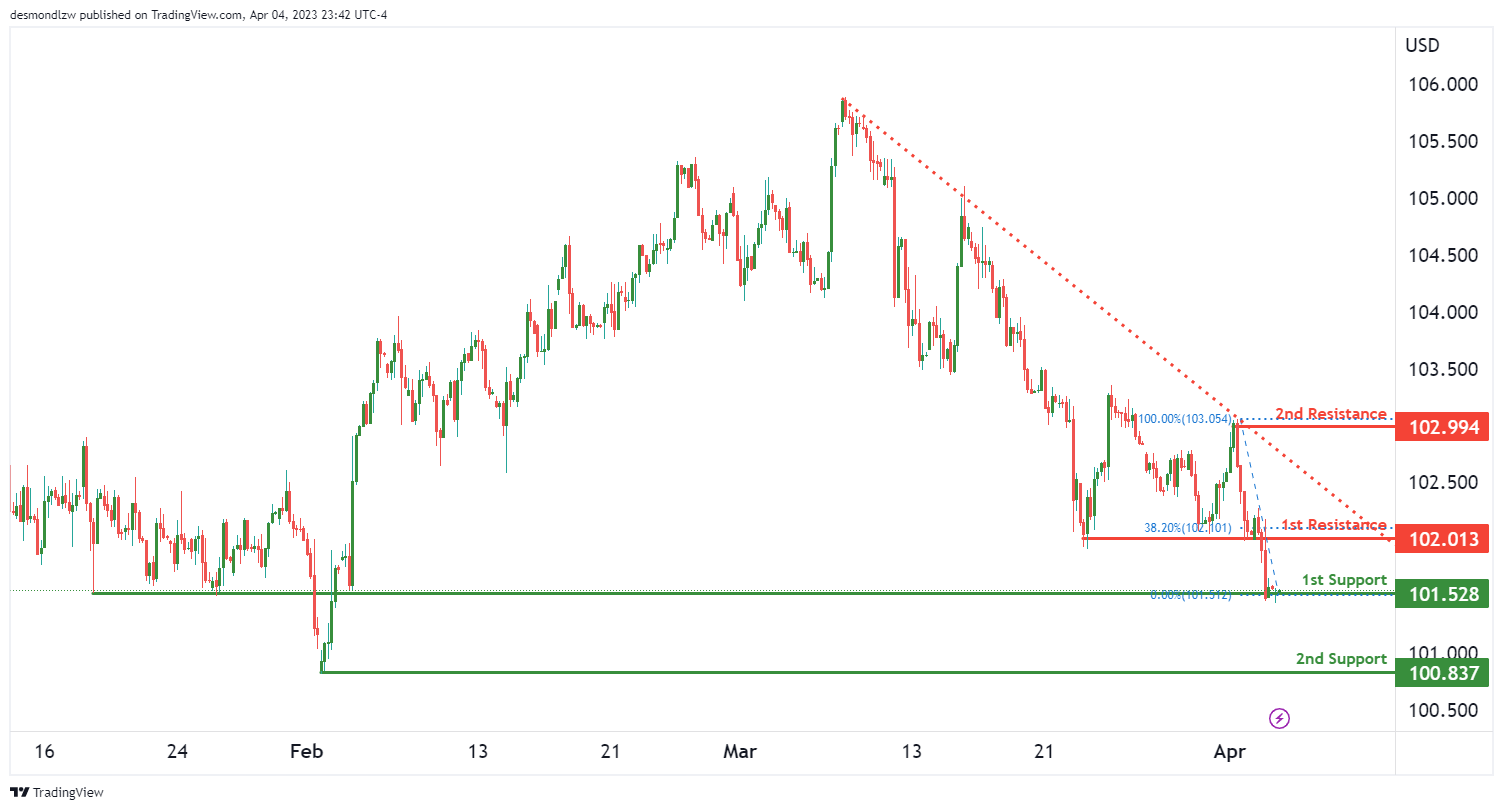
The DXY chart is currently showing a bearish momentum, with several factors contributing to the downward pressure. Firstly, price is below a major descending trend line, which suggests that bearish momentum is likely to continue in the near future.
Looking at the support and resistance levels, we can see that price could potentially make a bearish break off the 1st support and drop towards the 2nd support. The 1st support level is at 101.52, and it is a good level of support as it is an overlap support. On the other hand, the 2nd support level is at 100.83, and it is a swing low support, making it another strong level of support.
In terms of resistance levels, the 1st resistance level is at 102.01. This level is a pullback resistance and also has a 38.20% Fibonacci retracement lining up with it, which makes it a strong level of resistance. The 2nd resistance level is at 102.99, and it is a swing high resistance.
It is worth noting that the overall momentum of the chart is bearish, which suggests that prices are likely to continue to decline. Furthermore, the fact that price is below a major descending trend line reinforces this bearish bias.
EUR/USD:
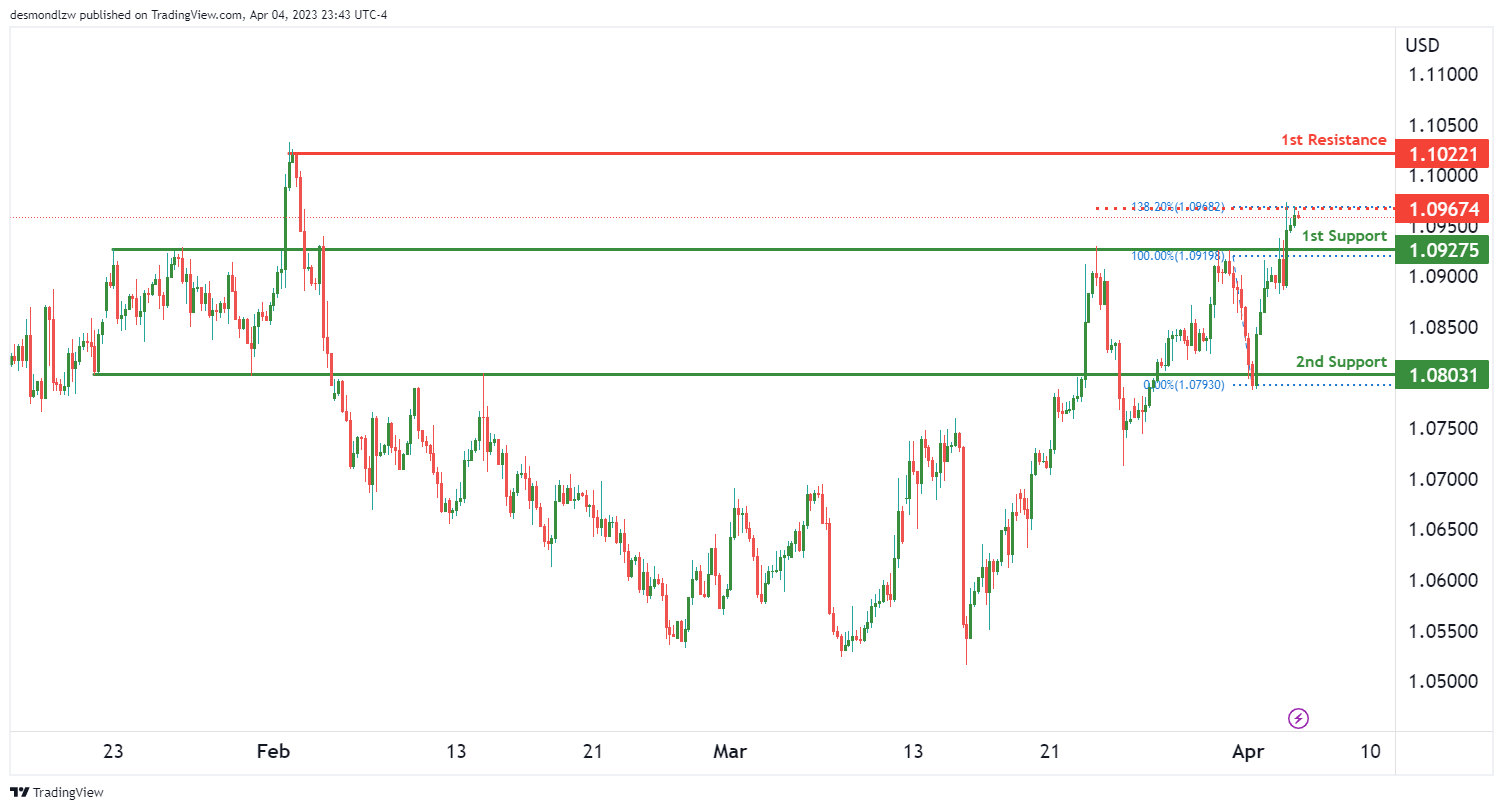
The EUR/USD chart is currently showing a bullish momentum, with potential for a bullish continuation towards the 1st resistance level.
Looking at the support levels, we can see that the 1st support level is at 1.0927, which is an overlap support and a good level of support. The 2nd support level is at 1.0803, and it is also an overlap support, making it another strong level of support.
In terms of resistance levels, the 1st resistance level is at 1.1022, which is a swing high resistance and a good level of resistance. Additionally, there is an intermediate resistance level at 1.0967, which is a swing high resistance and has a 138.20% Fibonacci extension lining up with it, making it another strong level of resistance.
The overall momentum of the chart is bullish, which suggests that prices are likely to continue to rise. Given the potential for a bullish continuation towards the 1st resistance level, it is possible that prices could reach this level soon.
GBP/USD:
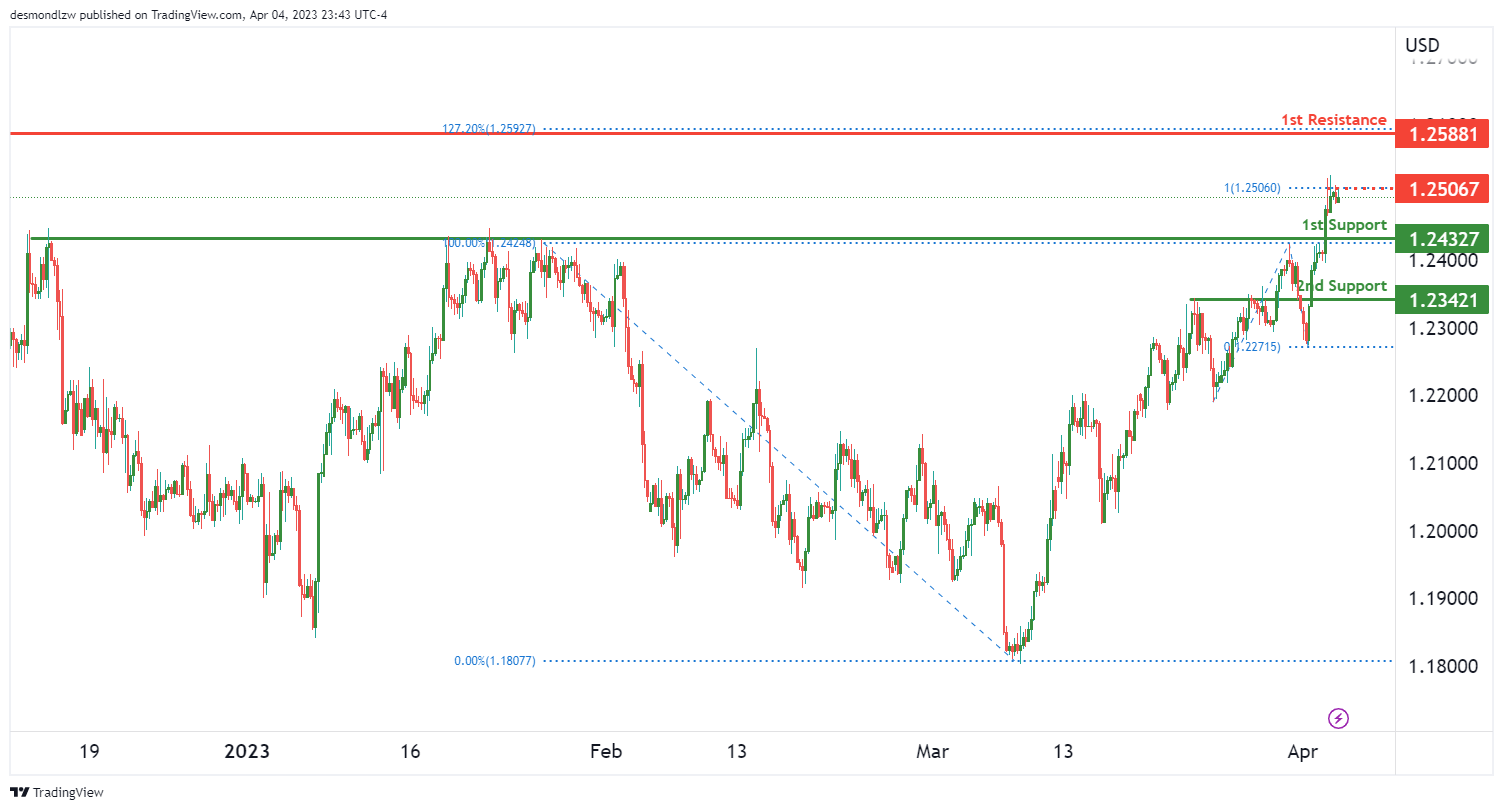
The GBP/USD chart is currently showing a bullish momentum, with potential for a bullish continuation towards the 1st resistance level.
Looking at the support levels, we can see that the 1st support level is at 1.2432, which is a pullback support and a good level of support. The 2nd support level is at 1.2342, and it is also an overlap support, making it another strong level of support.
In terms of resistance levels, the 1st resistance level is at 1.2588, which is a swing high resistance and a good level of resistance. Additionally, there is an intermediate resistance level at 1.2506, which is also a swing high resistance and another strong level of resistance.
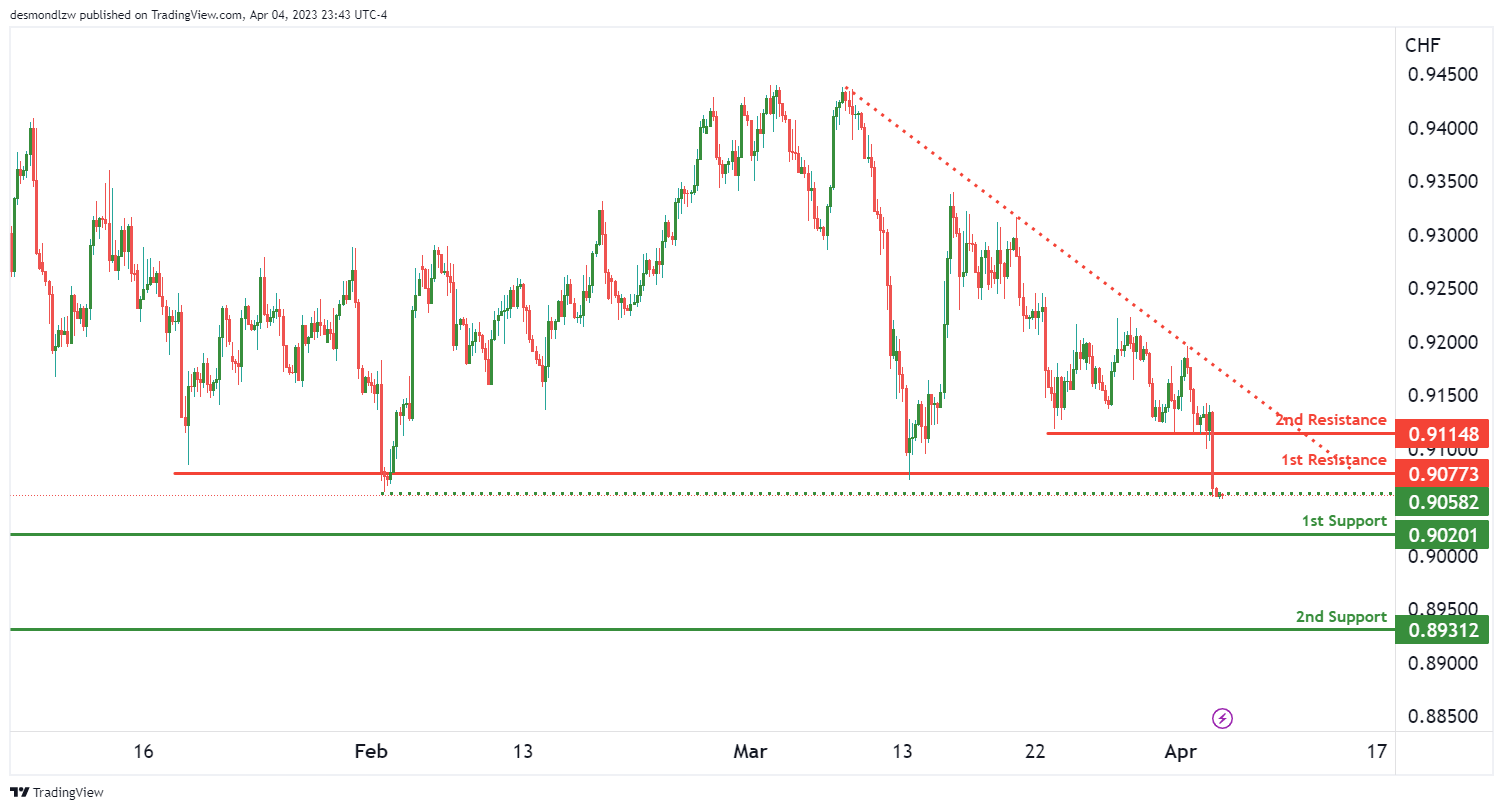
USD/CHF:
The USD/CHF chart shows bearish momentum as prices are below a major descending trend line, indicating that a continuation of the bearish trend is likely. The first support is at 0.9020, which is a swing low support level. Additionally, the second support at 0.8931 is also a swing low support level. On the other hand, the first resistance at 0.9077 is a pullback resistance level, and there is an intermediate resistance at 0.9114 that is also a pullback resistance level. There is an intermediate support at 0.9058, which is a multi-swing low support level.
Given the bearish momentum, price could potentially continue to drop towards the first support at 0.9020. If price were to break through this level, it could potentially reach the second support at 0.8931. On the other hand, if there is a reversal, price could potentially rise towards the first resistance at 0.9077. It’s important to keep an eye on the intermediate levels at 0.9114 and 0.9058 as they could potentially act as resistance and support respectively.
USD/JPY:
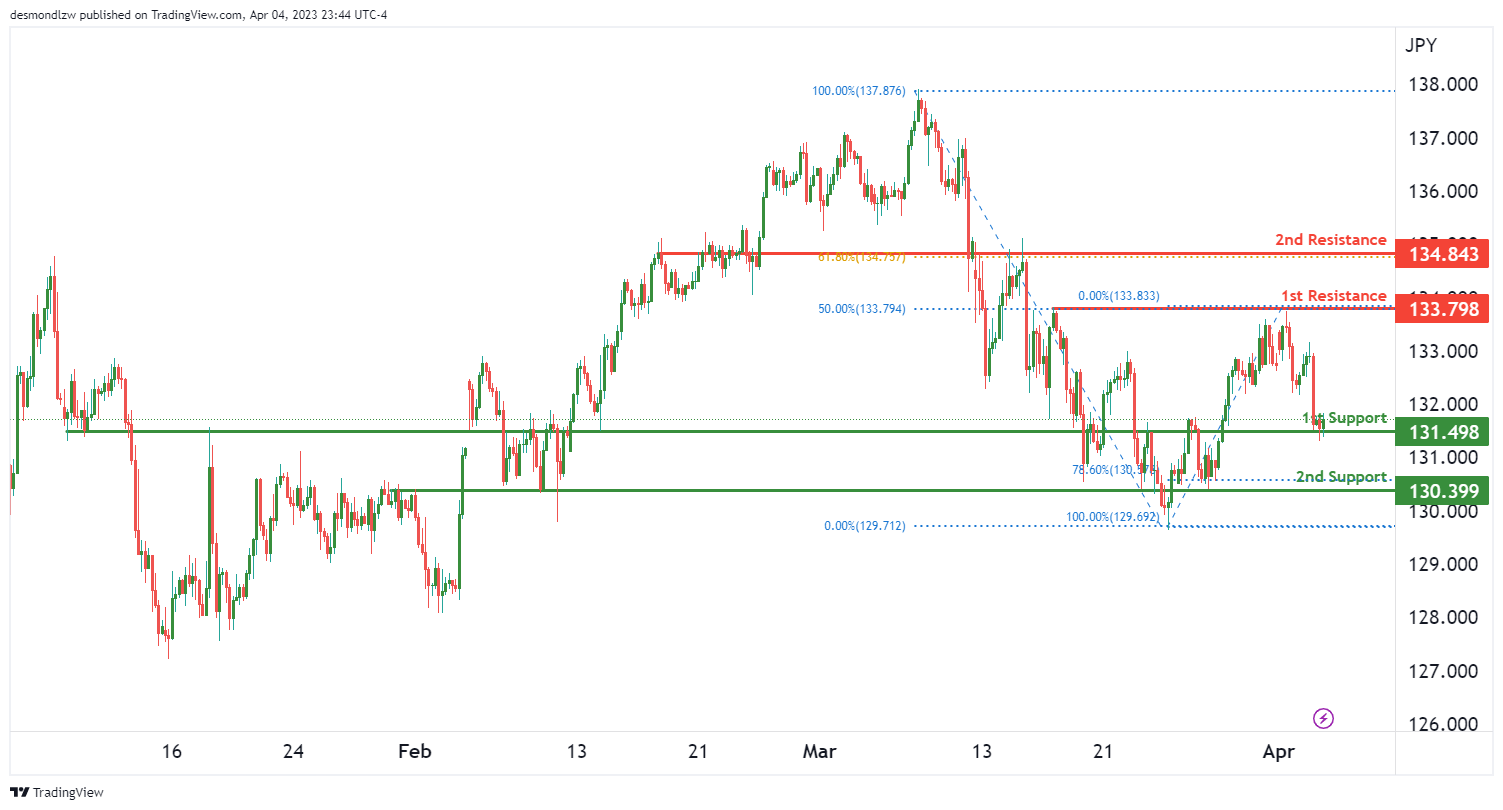
The overall momentum of the USD/JPY chart is bullish, supported by the fact that price is currently above the Ichimoku cloud. Looking at the chart, there are multiple factors contributing to the bullish momentum, including an ascending trend line and multiple overlap supports.
If the bullish momentum were to continue, the price could potentially reach the 1st resistance level at 133.79, which is a multi-swing high resistance level that also coincides with a 50% Fibonacci retracement.
In terms of support levels, the 1st support level is at 131.49, which is an overlap support level and a good potential area for prices to bounce back up. The 2nd support level is at 130.39, which is another overlap support level that also coincides with the 78.60% Fibonacci retracement level, making it a strong level to watch.
There is also a 2nd resistance level at 134.84, which is an overlap resistance level and coincides with the 61.80% Fibonacci retracement level. This level could potentially act as a barrier for prices to rise further towards the upside.
It’s worth noting that if price were to break the 1st support level, the next support level to watch for would be the 2nd support level at 130.39. However, if price were to break the 1st resistance level, it could potentially rise towards the 2nd resistance level at 134.84.
AUD/USD:
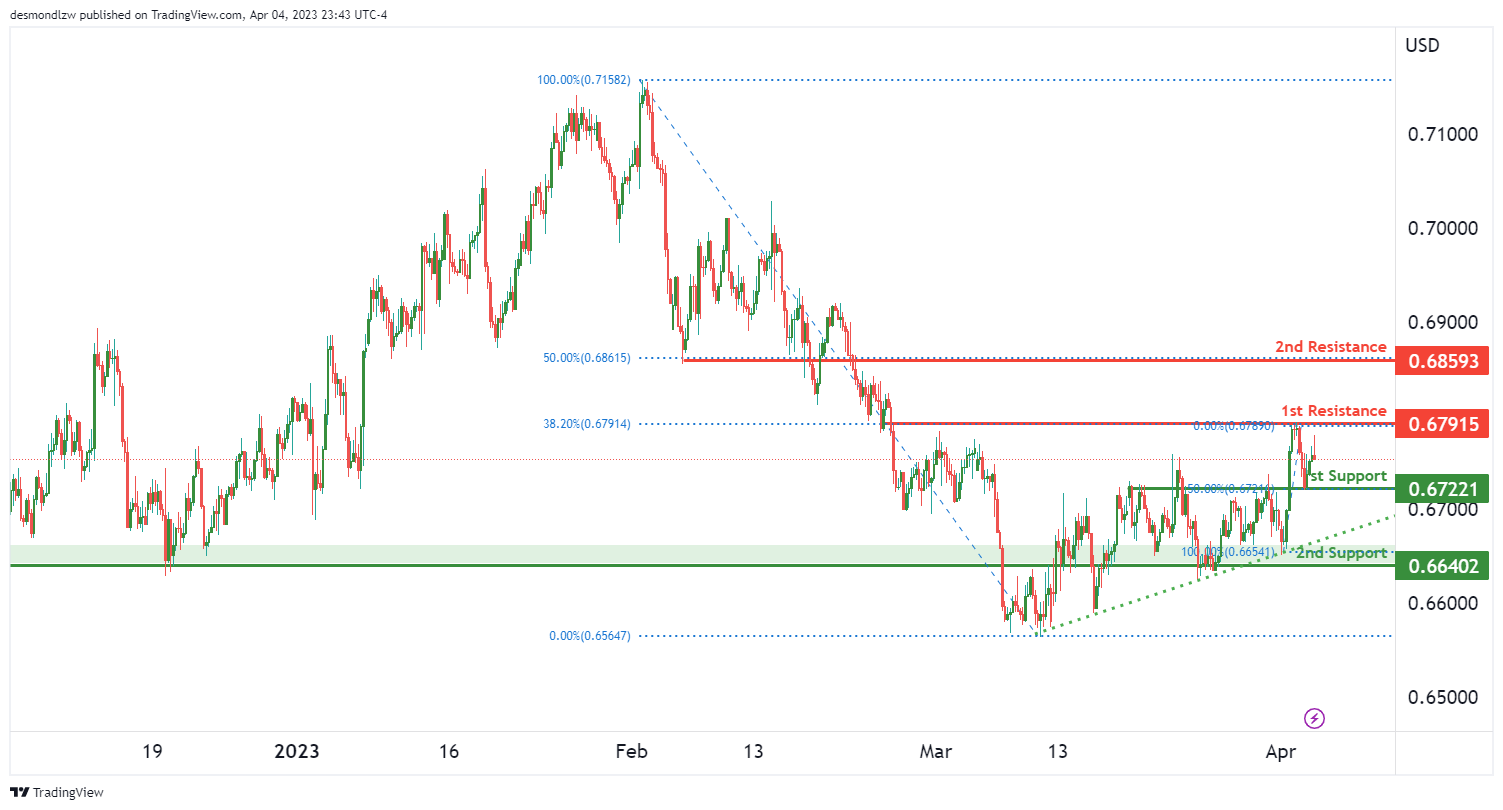
The AUD/USD chart is showing strong bullish momentum, with prices potentially continuing to rise towards the 1st resistance. The overall bias is bullish, with the price above the Ichimoku cloud and no significant resistance in the way of a potential uptrend.
Currently, the 1st support level is at 0.6722, which is an overlap support level and also lines up with a 50% Fibonacci retracement. This level has been tested multiple times in the past and could provide strong support if the price were to drop.
If the price were to bounce from the 1st support, it could rise towards the 1st resistance at 0.6791. This level is also an overlap level, but this time it coincides with a 38.20% Fibonacci retracement. A breakthrough of this resistance could potentially lead to a bullish acceleration towards the 2nd resistance level at 0.6859, which is also an overlap resistance and a 50% Fibonacci retracement level.
The 2nd support level at 0.6640 is another overlap support level and could potentially provide additional support if the price were to drop further.
NZD/USD:
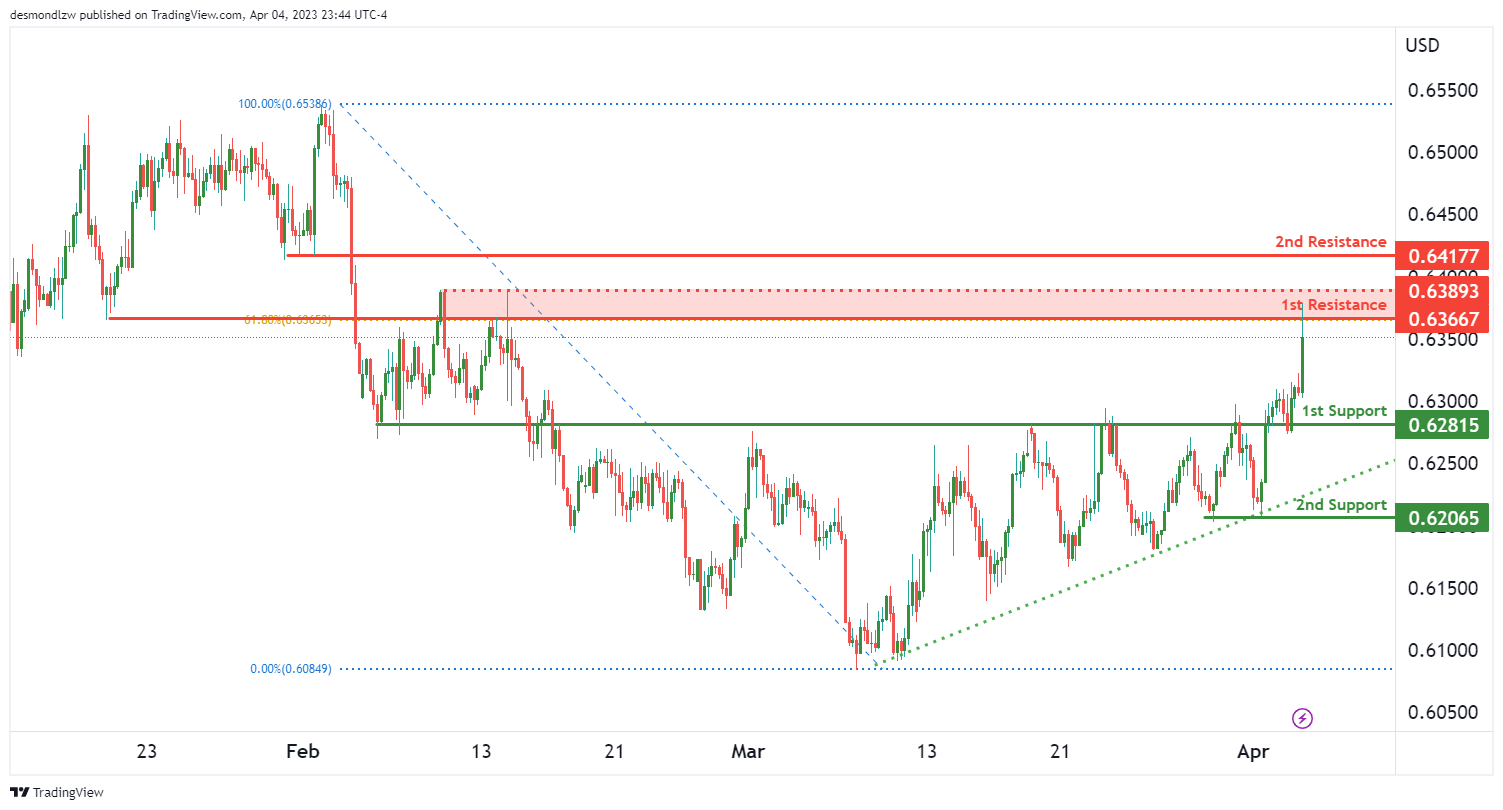
The NZD/USD pair continues to show bullish momentum as it remains above a major ascending trend line, suggesting further bullish momentum is on the cards. If price continues to move higher, it could potentially make a bullish continuation towards the 1st resistance level at 0.6366.
On the downside, the 1st support level is located at 0.6281, which is a strong overlap support and could provide a level of buying interest if prices were to drop. The 2nd support level is located at 0.6206, which is a multi-swing low support that could also attract buyers if the pair were to experience a pullback.
On the upside, the 1st resistance level is at 0.6366, which coincides with a 61.8% Fibonacci retracement level and is a strong overlap resistance. If price were to break through this level, it could trigger a move towards the 2nd resistance level at 0.6417, which is a pullback resistance.
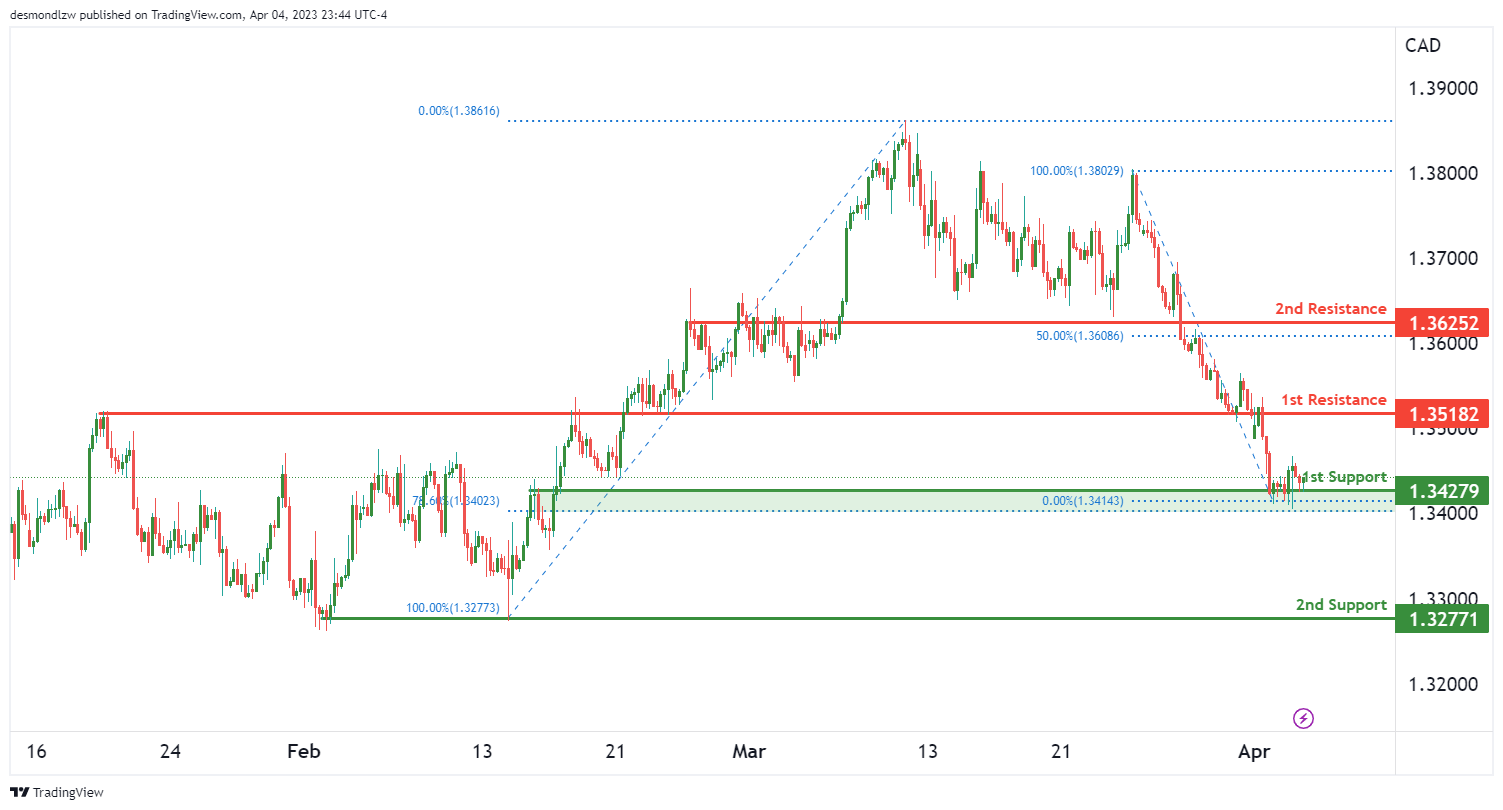
USD/CAD:
USD/CAD is showing bullish momentum with potential for further upward movement, supported by an overall bullish bias. Price is currently above a major ascending trend line, adding to the potential for continued bullishness.
The first support level for USD/CAD is at 1.3427, which is an overlap support and also lines up with a 78.60% Fibonacci retracement. If price were to bounce from this level, it could potentially rise towards the first resistance level at 1.3518, which is another overlap resistance.
However, if price were to break below the first support level, it could potentially drop to the second support at 1.3277, which is a multi-swing low support.
Looking at resistance levels, the first resistance level at 1.3518 is a good one as it coincides with an overlap resistance. Meanwhile, the second resistance level at 1.3625 is another good one as it is also an overlap resistance and lines up with a 50% Fibonacci retracement.
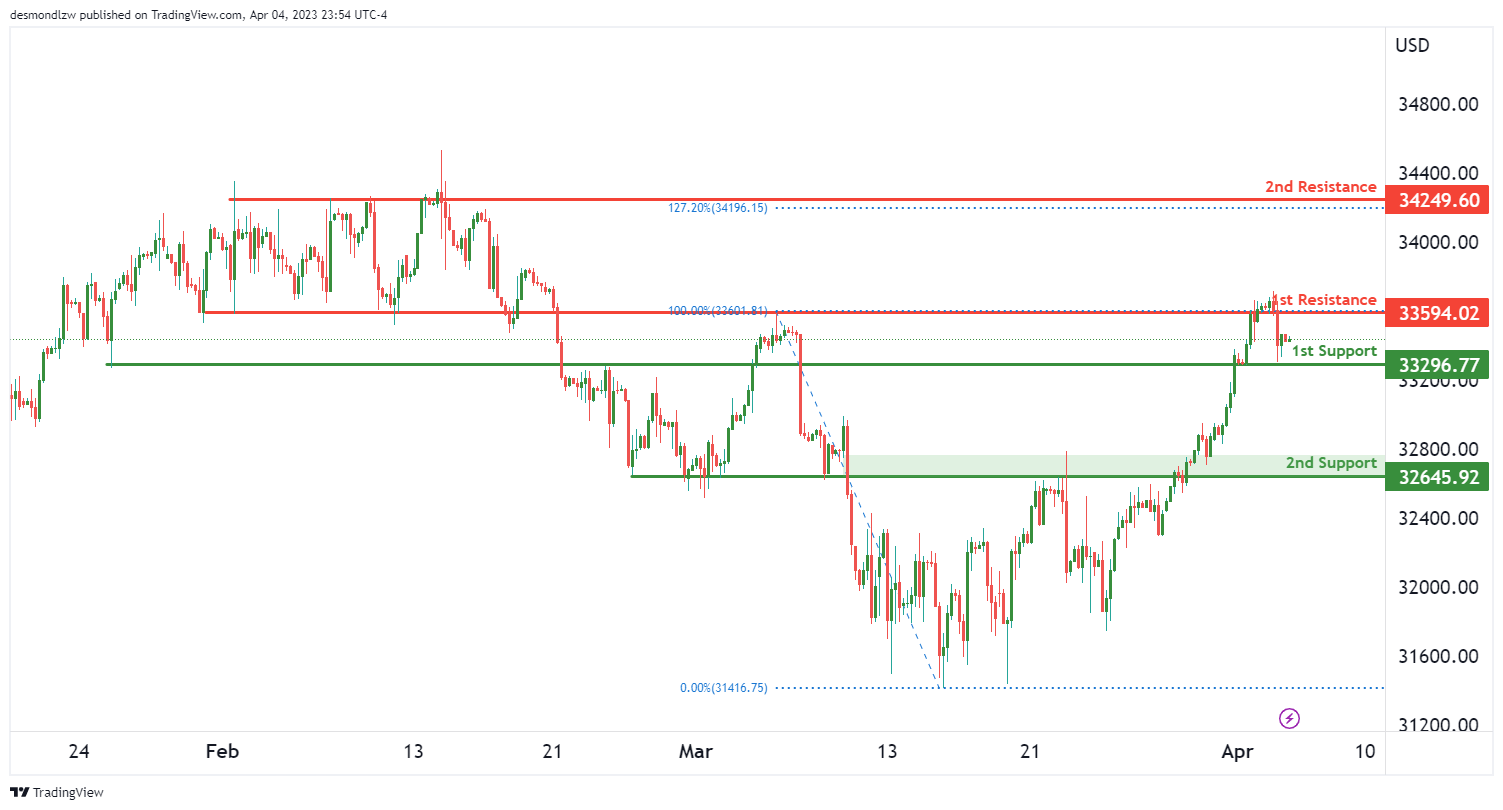
DJ30:
The DJ30 chart is currently showing strong bullish momentum with potential for a bullish bounce off the 1st support level towards the 1st resistance level.
The 1st support level is located at 33296.77 and is a strong overlap support. Additionally, the 2nd support level at 32645.92 is a multi-swing low support, further bolstering its potential as a strong support level.
On the other hand, the 1st resistance level is located at 33594.02 and is a strong overlap resistance. Moving higher, the 2nd resistance level is located at 34249.60 and is a multi-swing high resistance. This level coincides with the 127.20% Fibonacci extension, adding further significance to its potential as a resistance level.
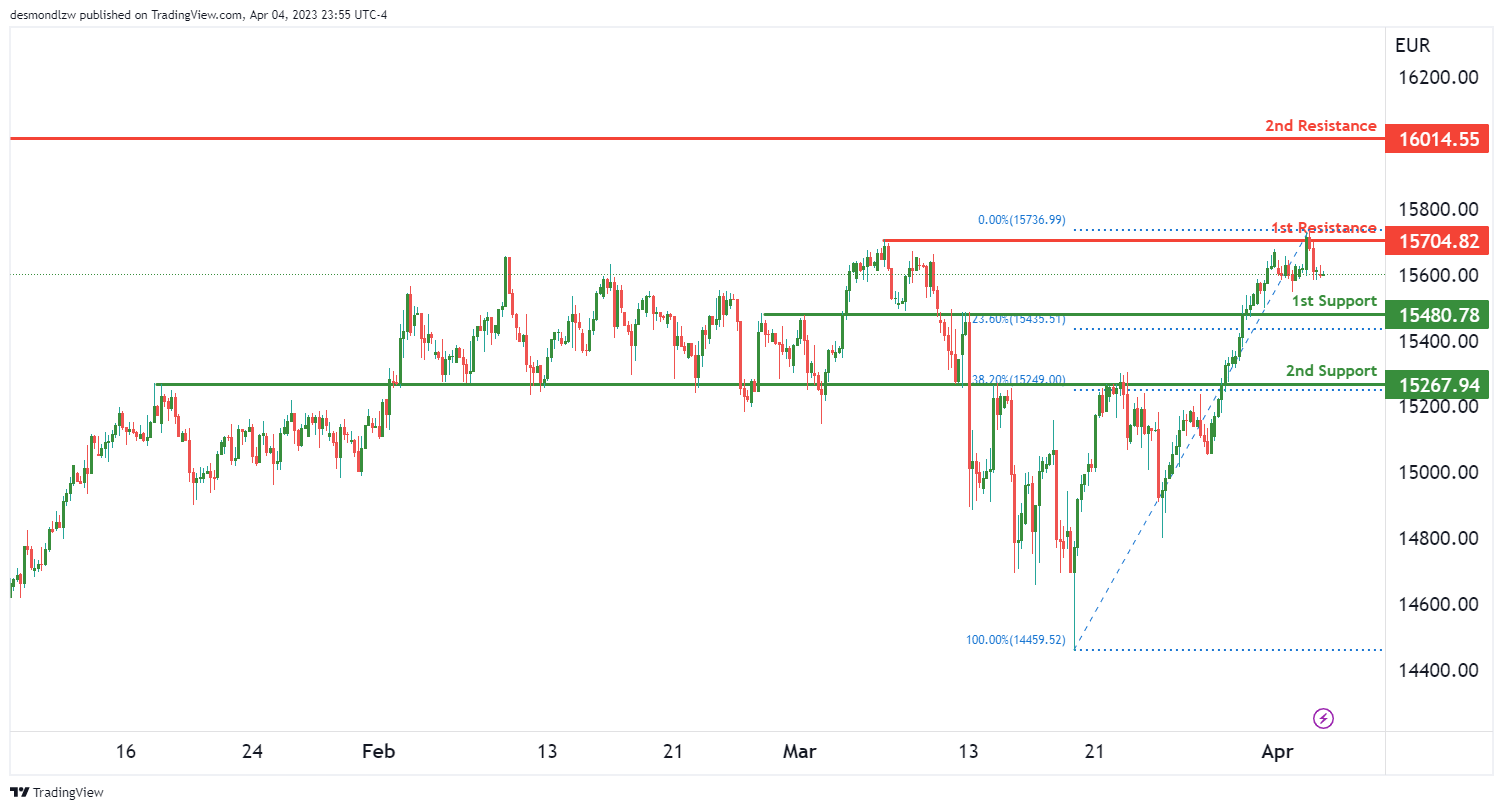
GER30:
The GER30 chart is currently showing strong bearish momentum with potential for a bearish continuation towards the 1st support level.
The 1st support level is located at 15480.78 and is a strong overlap support. Additionally, the 2nd support level at 15267.94 is an overlap support that coincides with the 38.20% Fibonacci retracement, further bolstering its potential as a strong support level.
On the other hand, the 1st resistance level is located at 15704.82 and is a multi-swing high resistance. Moving higher, the 2nd resistance level is located at 16014.55 and is a swing high resistance. These resistance levels indicate potential areas where the bearish momentum could potentially stall.
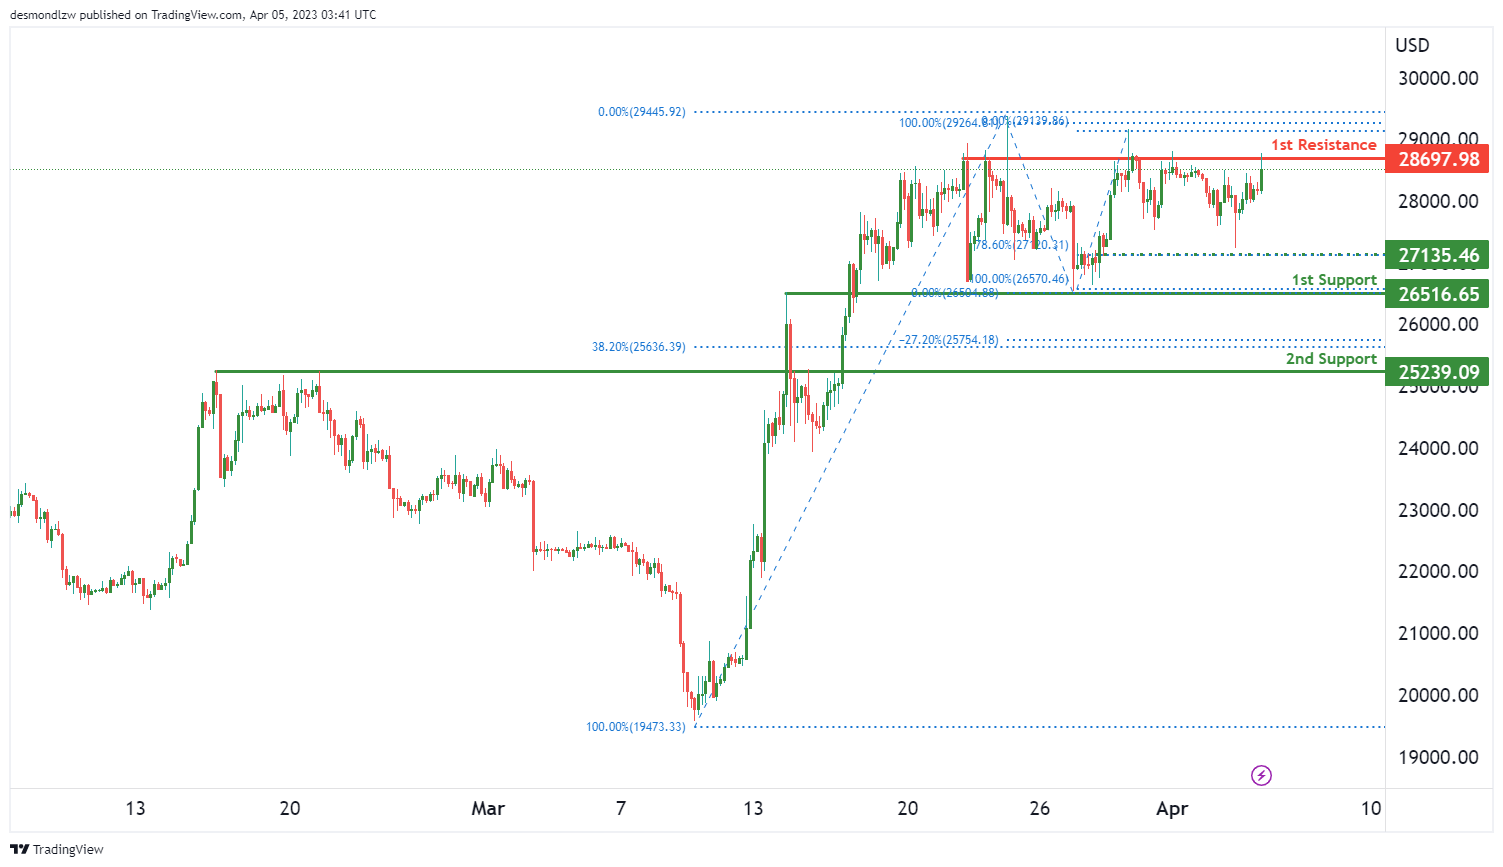
BTC/USD:
The BTC/USD chart currently indicates a strong bearish momentum with potential for a bearish break off the 1st support level towards the 2nd support level.
The 1st support level is located at 26516.65 and is a strong overlap support, however, if it were to break, the price could drop towards the 2nd support level at 25239.09 which is also an overlap support and coincides with the 38.20% Fibonacci retracement, further strengthening its potential as a support level.
On the other hand, the 1st resistance level is located at 28697.98 and is a multi-swing high resistance. There is also an intermediate support level at 27135.46 which is a swing low support, providing additional support for the price in case of any pullback.
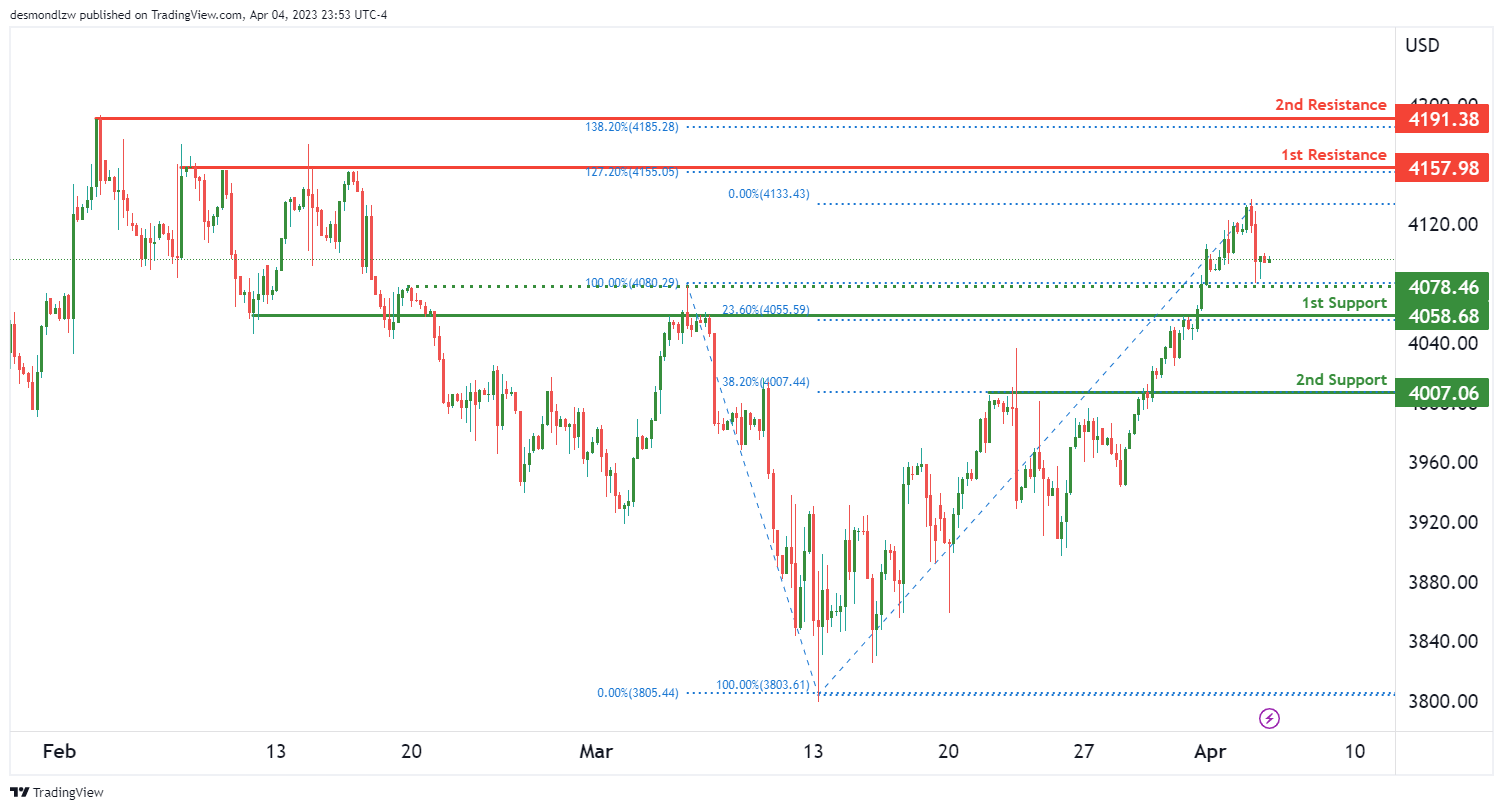
US500
The US500 chart currently shows strong bearish momentum with the potential for a bearish continuation towards the 1st support level.
The 1st support level is located at 4058.06 and is a strong overlap support. Additionally, the 2nd support level at 4007.06 is a pullback support and coincides with the 38.20% Fibonacci retracement, further strengthening its potential as a strong support level.
On the other hand, the 1st resistance level is located at 4157.98 and is a multi-swing high resistance. Moving higher, the 2nd resistance level is located at 4191.38 and is a swing high resistance. These levels coincide with the 127.20% and 138.20% Fibonacci extensions, respectively, adding further significance to their potential as resistance levels.
In between the support and resistance levels, there is an intermediate support level located at 4078.46, which is a swing low support. This level could potentially act as a support if price were to drop further.
ETH/USD:
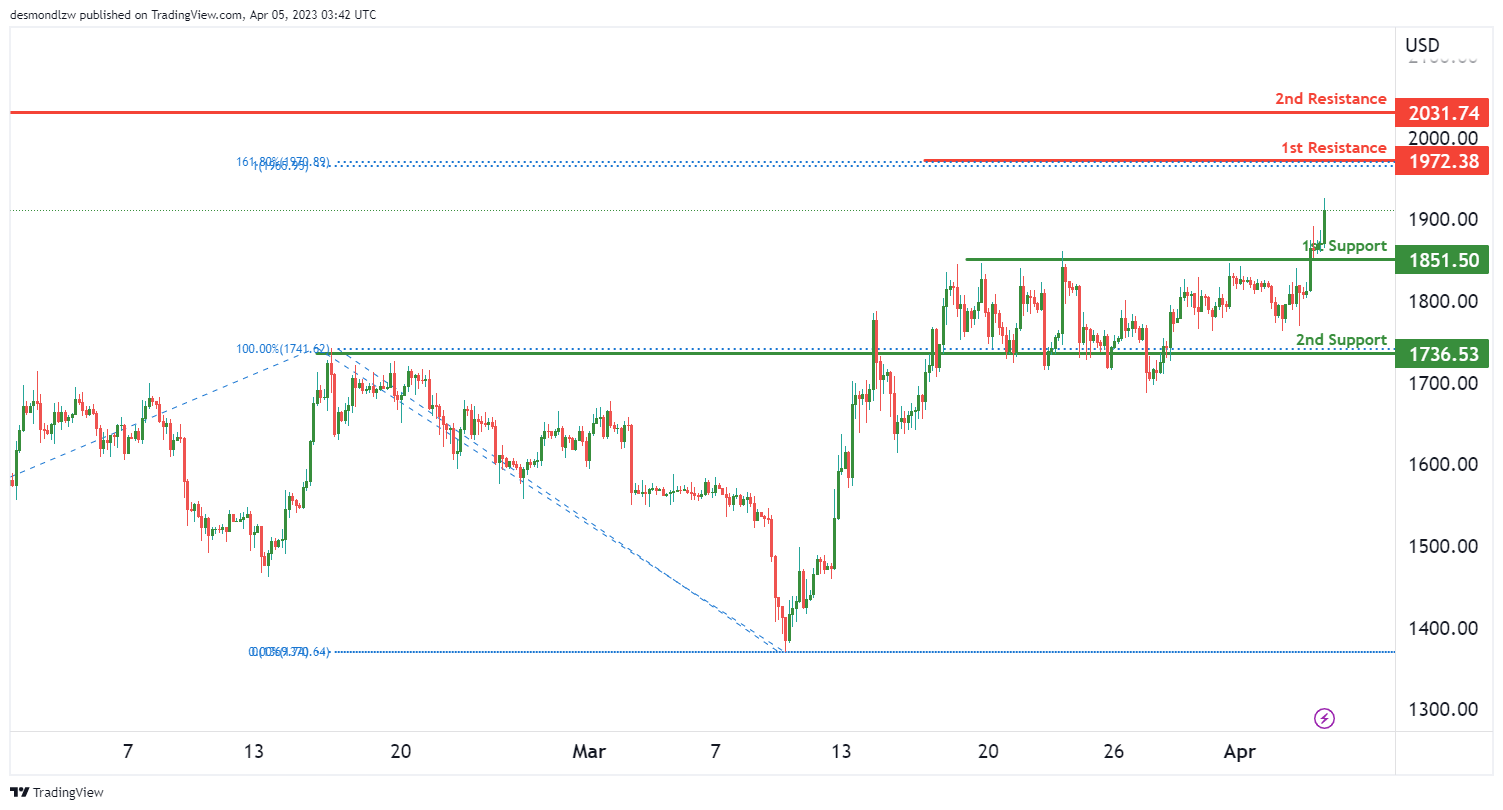
The ETH/USD chart is currently showing strong bullish momentum, with the potential for a continuation towards the 1st resistance level.
The 1st support level is located at 1851.50 and is a pullback support, which adds significance to its potential as a strong support level. Additionally, the 2nd support level at 1736.53 is an overlap support, which further confirms its potential as a support level.
On the other hand, the 1st resistance level is located at 1972.38 and is a swing high resistance. Moving higher, the 2nd resistance level is located at 2031.74 and is a swing high resistance. These levels suggest that there may be some selling pressure at these levels, which could limit price appreciation.
WTI/USD:
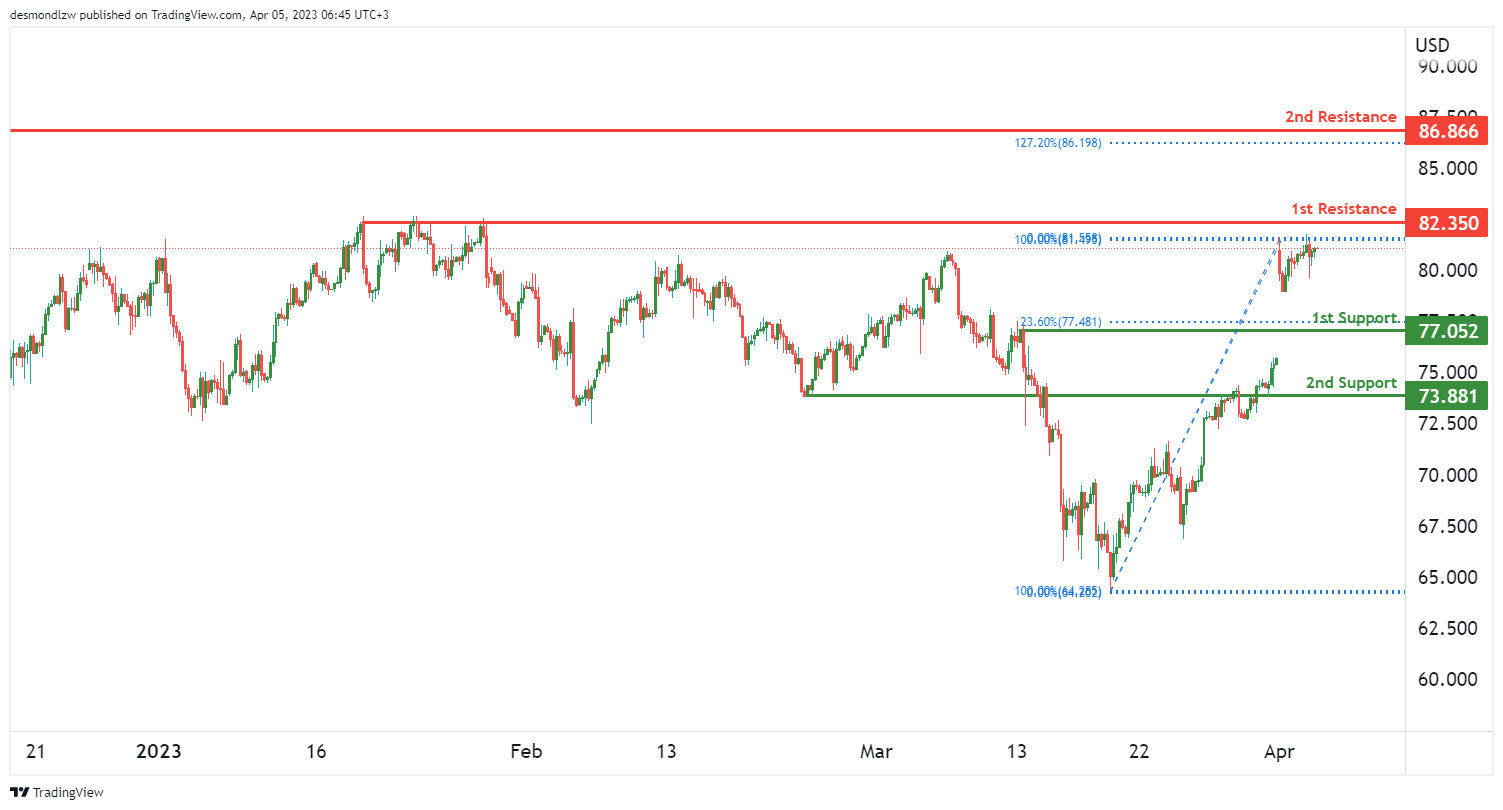
WTI’s chart shows strong bullish momentum with a potential for a break through the 1st resistance level and rise towards the 2nd resistance level.
The 1st support level is located at 77.05 and coincides with the 23.60% Fibonacci retracement. Additionally, the 2nd support level at 73.88 is a pullback support, further reinforcing its potential as a strong support level.
On the other hand, the 1st resistance level is located at 82.35 and is a multi-swing high resistance. Moving higher, the 2nd resistance level is located at 86.86 and is a swing high resistance. These levels are significant because they can act as barriers to further price increases.
XAU/USD (GOLD):
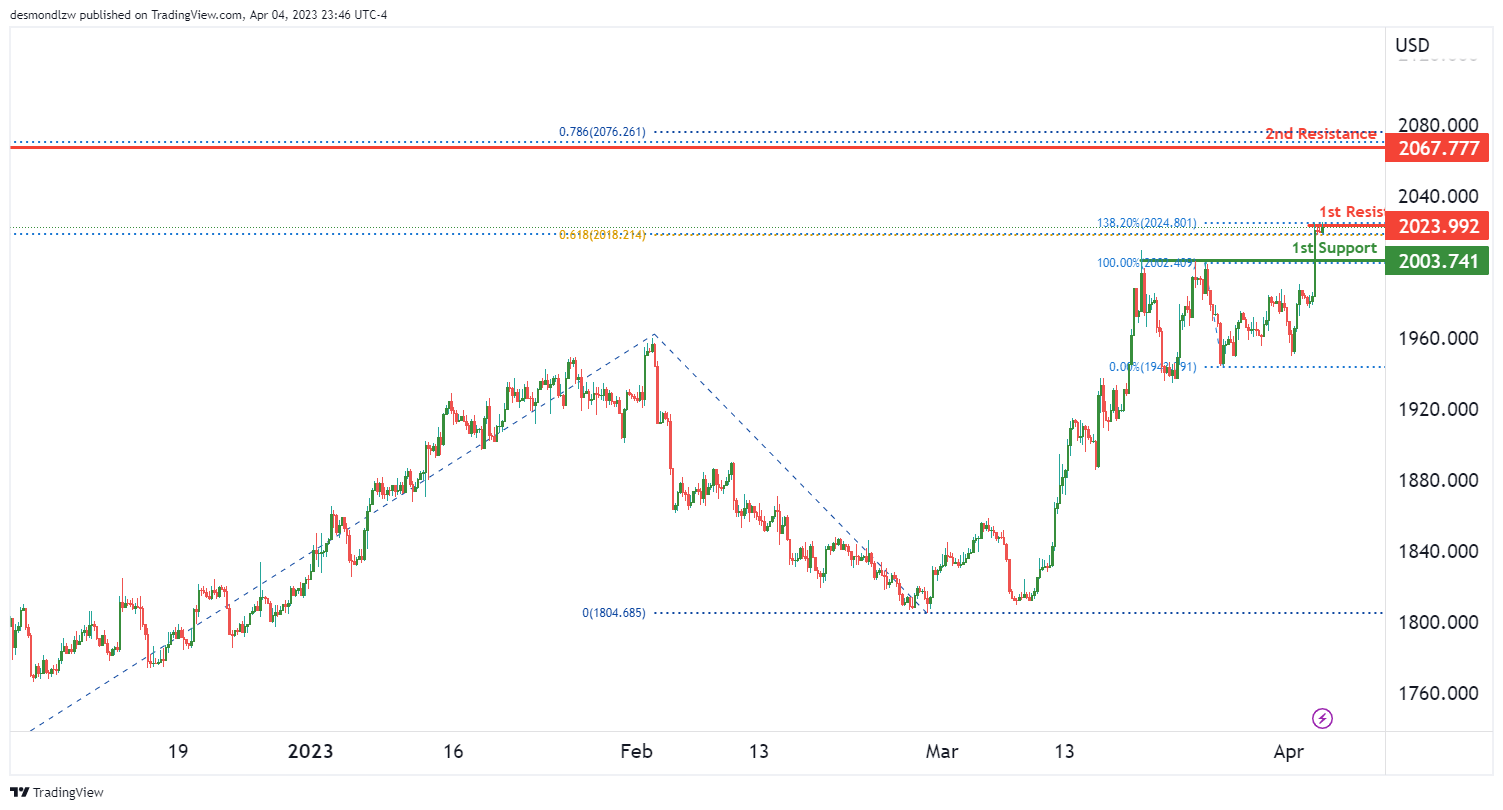
Gold has been showing strong bullish momentum with potential for a bullish break through of the 1st resistance level and rise towards the 2nd resistance level. The overall bias is bullish, with price above an ascending trend line indicating further bullish momentum is on the cards.
The 1st support level is located at 2003.00 and is a pullback support. This level is significant as it has provided support in the past and is likely to do so again.
Moving higher, the 1st resistance level is located at 2023.00 and is a swing high resistance. This level coincides with the 138.20% Fibonacci extension, adding further significance to its potential as a resistance level. A break through this level could trigger a rise towards the 2nd resistance level located at 2067.00.
The 2nd resistance level is a swing high resistance and coincides with the 78.60% Fibonacci expansion. This level has been significant in the past and is likely to provide resistance once again.