

Sample Category Title
EUR/GBP Daily Outlook
Daily Pivots: (S1) 0.8844; (P) 0.8866; (R1) 0.8905; More...
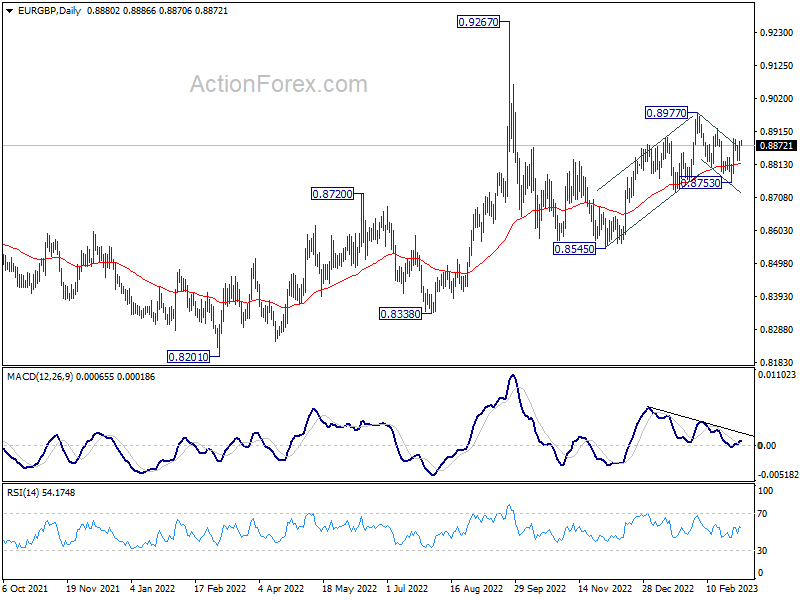
Intraday bias in EUR/GBP remains neutral and outlook is unchanged. On the upside, break of 0.8895 will affirm the case that correction from 0.8977 has completed at 0.8753. Further rally should be seen to retest 0.8977.
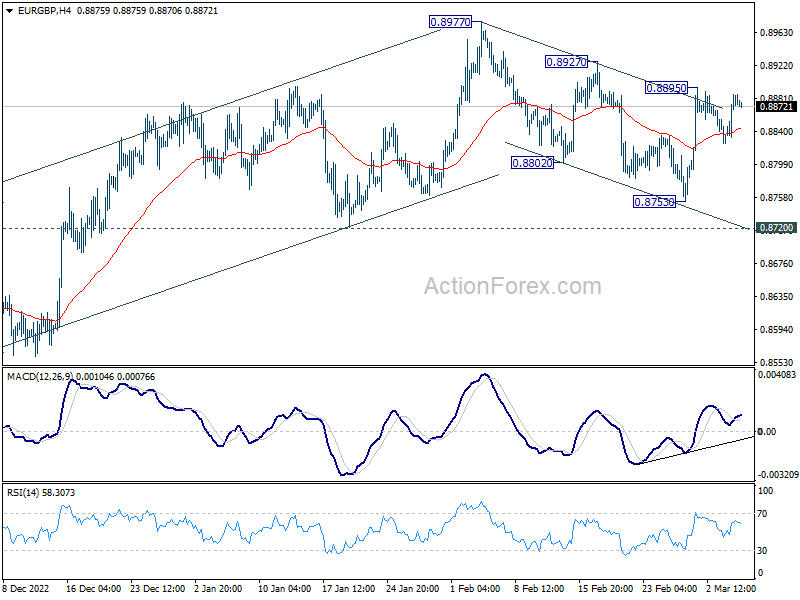
In the bigger picture, outlook is rather mixed for now, except that price actions from 0.9267 (2022 high) are part of the long term range pattern from 0.9499 (2020 high). With 0.8720 support intact, rise from 0.8545 is in favor to continue through 0.8977. However, firm break of 0.8720 will argue that such rebound has completed, and open up deeper fall through this support level.
RBA Raises Cash Rate by 25 Basis Points – Opens the Door for a Pause
By referring to tightening policy with issue about timing of further hikes the RBA is increasing its options – our view is that with the inflation outlook still too high it is too early to pause in April.
The Reserve Bank Board lifted the cash rate by 25 basis points from 3.35% to 3.6%.
While this decision was widely expected the real issue was the guidance in the Governor would provide for the future.
He chose to use the words, “The Board expects that further tightening of monetary policy will be needed to ensure inflation returns to target ….In assessing when and how much further interest rates need to increase, the Board will be paying close attention to developments in the global economy, trends in household spending and the outlook for inflation and the labour market.”
The compares to the February Statement which noted, “The Board expects that further increases in interest rates will be needed over the months ahead … in assessing how much further interest rates need to increase.”
Note that in February the issue was around “how much” whereas in March it has become “when and how much.”
The assessment of those issues that the Board is following with respect to future policy the Statement provides the following insights:
- The monthly CPI suggests that inflation has peaked.
- At the aggregate level wages growth is still consistent with the inflation target and recent data suggest a lower risk of a cycle in which prices and wages chase one another.
- The Board remains alert to the risk of a price-wage spiral given the limited spare capacity in the economy.
- Household consumption growth has slowed. But in contrast, the outlook for business investment remains positive.
- Rents are increasing at the fastest rate for some years.
- Employment fell in January but that reflects changing seasonal patterns.
These insights indicate that, as should be expected, the accumulation of ten consecutive rate hikes is having an impact on the economy.
We had been expecting that the Board would continue to point to higher rates with 'guidance' along the lines of “The Board expects to increase interest rates further over the period ahead.”
In referring to monetary tightening rather than interest rates the case could be made for a very different message but the second line in the paragraph – “when and how much further interest rates need to increase" – returns the theme to interest rates rather than wider policy and adds a notable “when”.
For these reasons the case can certainly be made for a pause in April.
But we cannot overlook that the Board still has a very strong tightening bias and, by April, will still not be forecasting that inflation will return to the 2–3% target zone before mid 2025.
Recall a key reason for dismissing a pause at the December meeting was that “inflation was expected to take several years to return to the target range.”
Since then, markets have also lifted the profile for the federal funds rate by 50 – 75 basis points despite the FOMC’s forecasts expecting to lower inflation to 3.3% in 2023 compared to the RBA’s “target” of 4.75% by end 2023.
Conclusion
There is some clear evidence in the Governor’s Statement that a pause can be expected in April but the big picture for inflation has not improved sufficiently to justify that call.
We continue to expect rate increases in both April and May.
Nevertheless we will be assessing the Governor’s speeches over the next few weeks and the critical information in the Board Minutes to see whether the case for an imminent pause is justified.
Technical Outlook and Review
DXY:
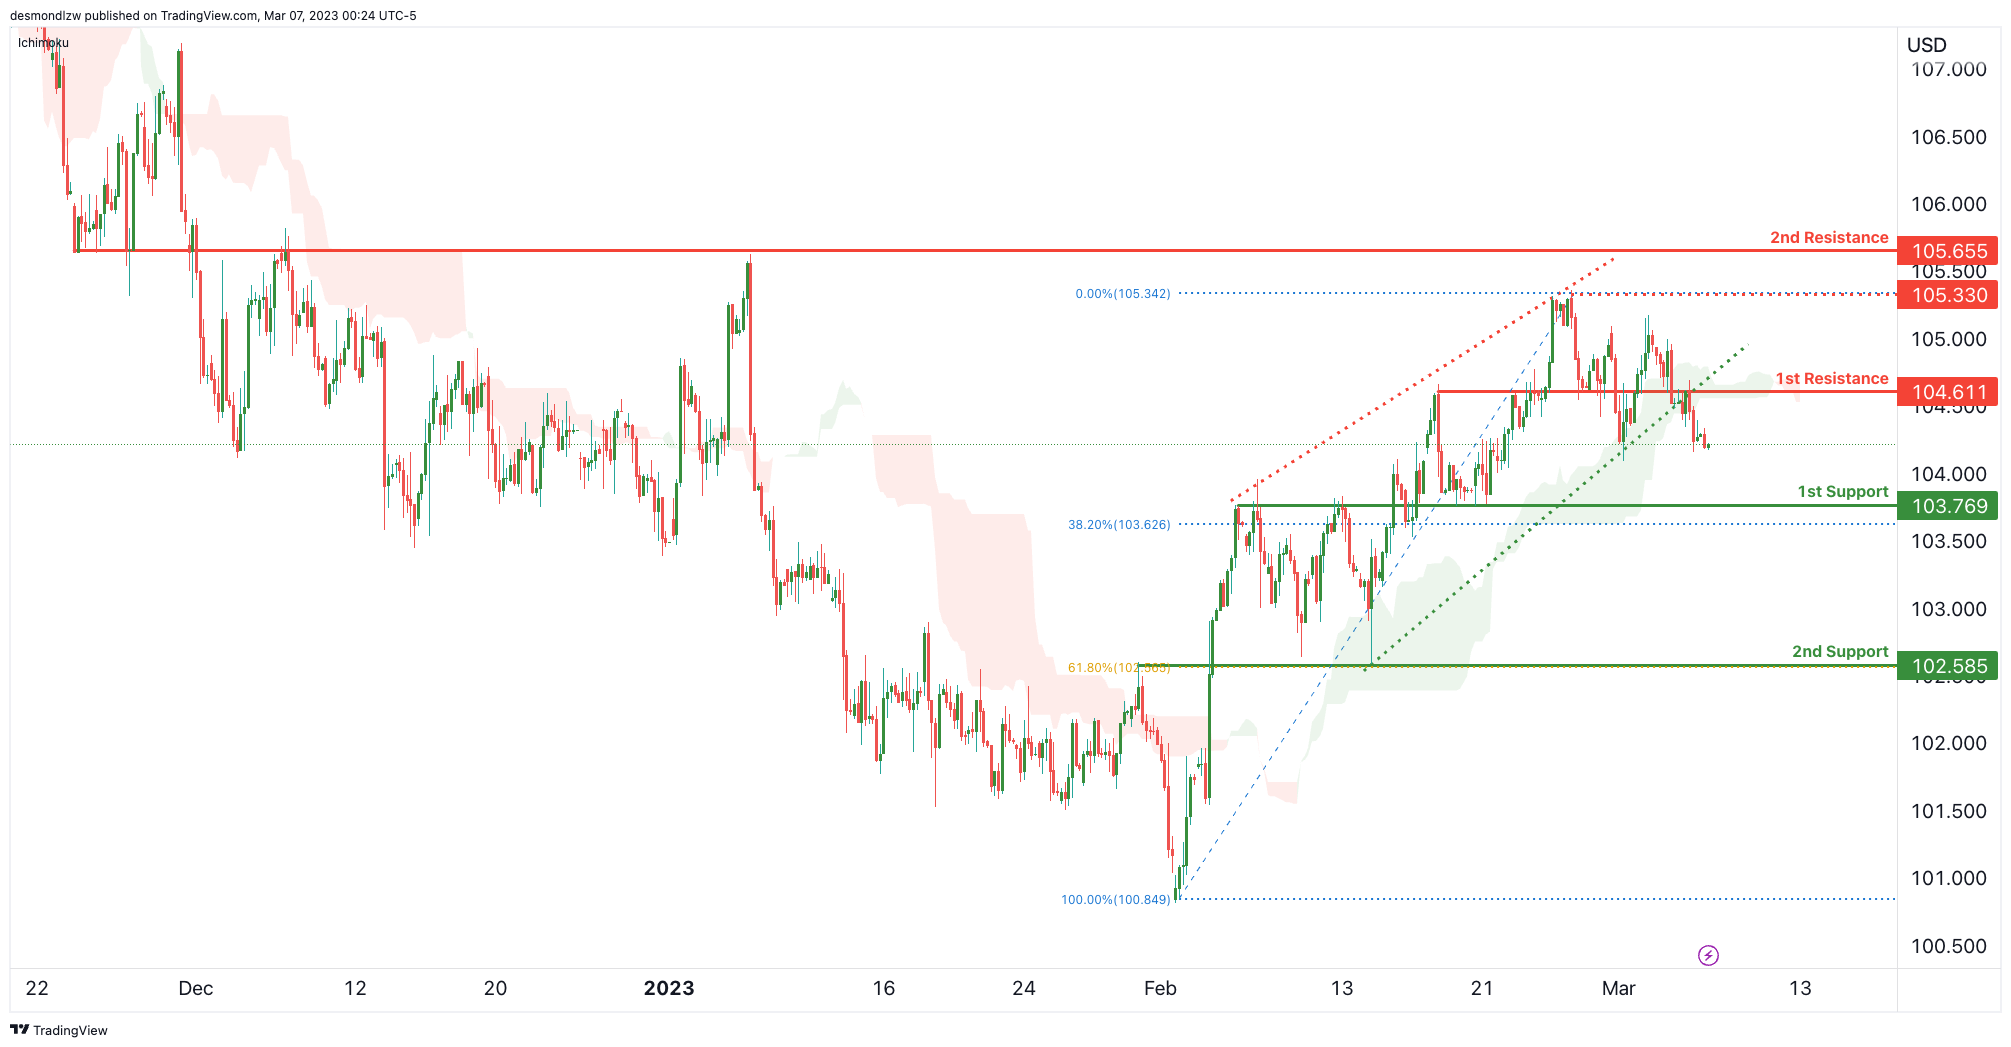
Price has broke an ascending support along with an Ichimoku cloud triggering a potential bearish move. There’s a strong 1st resistance at 104.61 too which is an overlap resistance. Price could drop from here towards 1st support at 103.76 which is an overlap support that lines up with the 38.2% Fibonacci retracement.
If price breaks that level, then the next key support is all the way down at 102.58 which is the overlap support and 61.8% Fibonacci retracement.
EUR/USD:
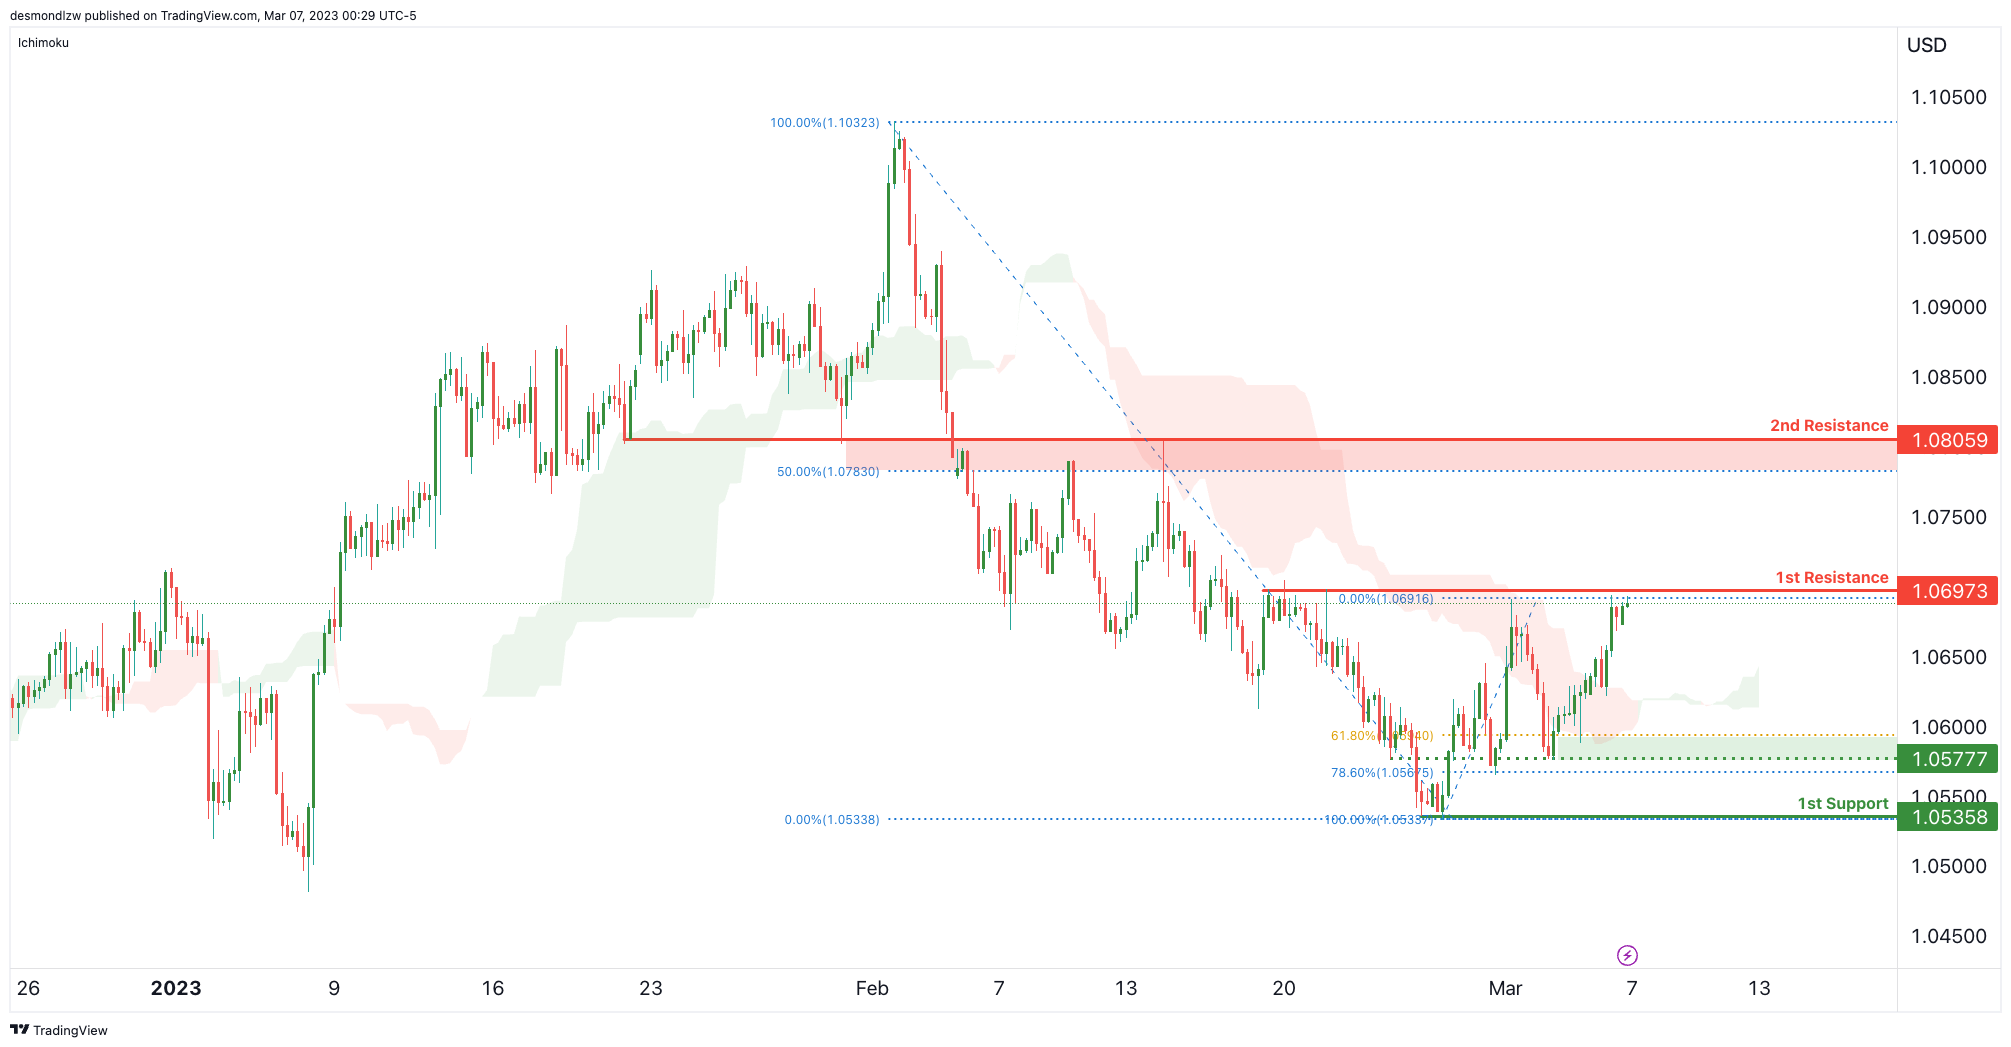
Price is testing a major resistance at 1.0697 which is a multiple swing high resistance. A reversal from here could see prices pushed down to 1.0577 which is the recent swing low support.
Price breaking this 1st resistance could see it rise to 2nd resistance at 1.0805 which is a key overlap resistance that lines up with the 50% Fibonacci retracement.
GBP/USD:
Price is seeing a descending resistance line push prices down towards our 1st support at 1.1923 which is a multiple swing low support. It’s worth noting that price is also seeing bearish momentum from the Ichimoku cloud, which could add to the conviction we have of price being pushed lower.
In terms of resistance, our 1st resistance is at 1.2144 which is a multiple swing high resistance that lines up with the 61.8% Fibonacci retracement.

USD/CHF:
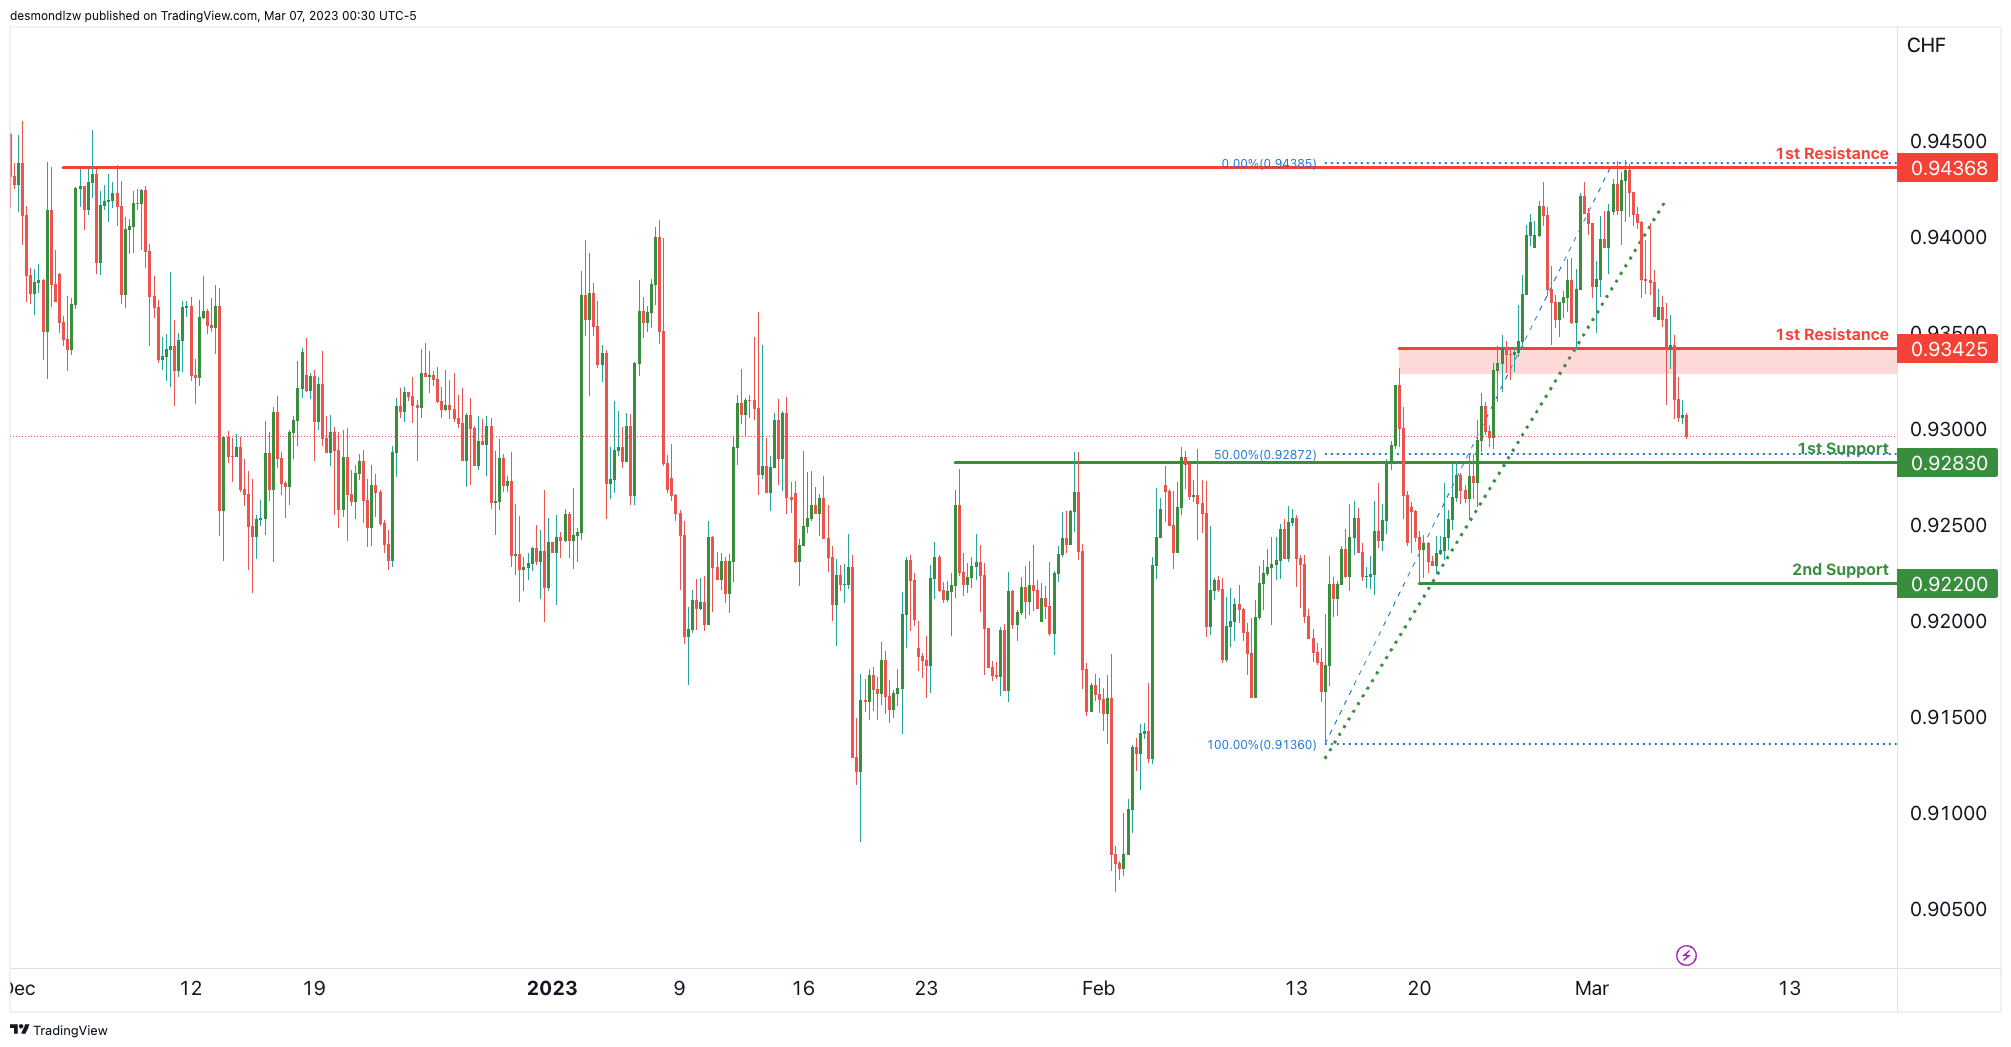
USDCHF has dropped strongly as forecasted. We’re seeing the first major support at 0.9283 which is a 50% Fibonacci retracement and a pullback support. If price breaks that level, the next major support level price might drop to 0.9220.
USD/JPY:
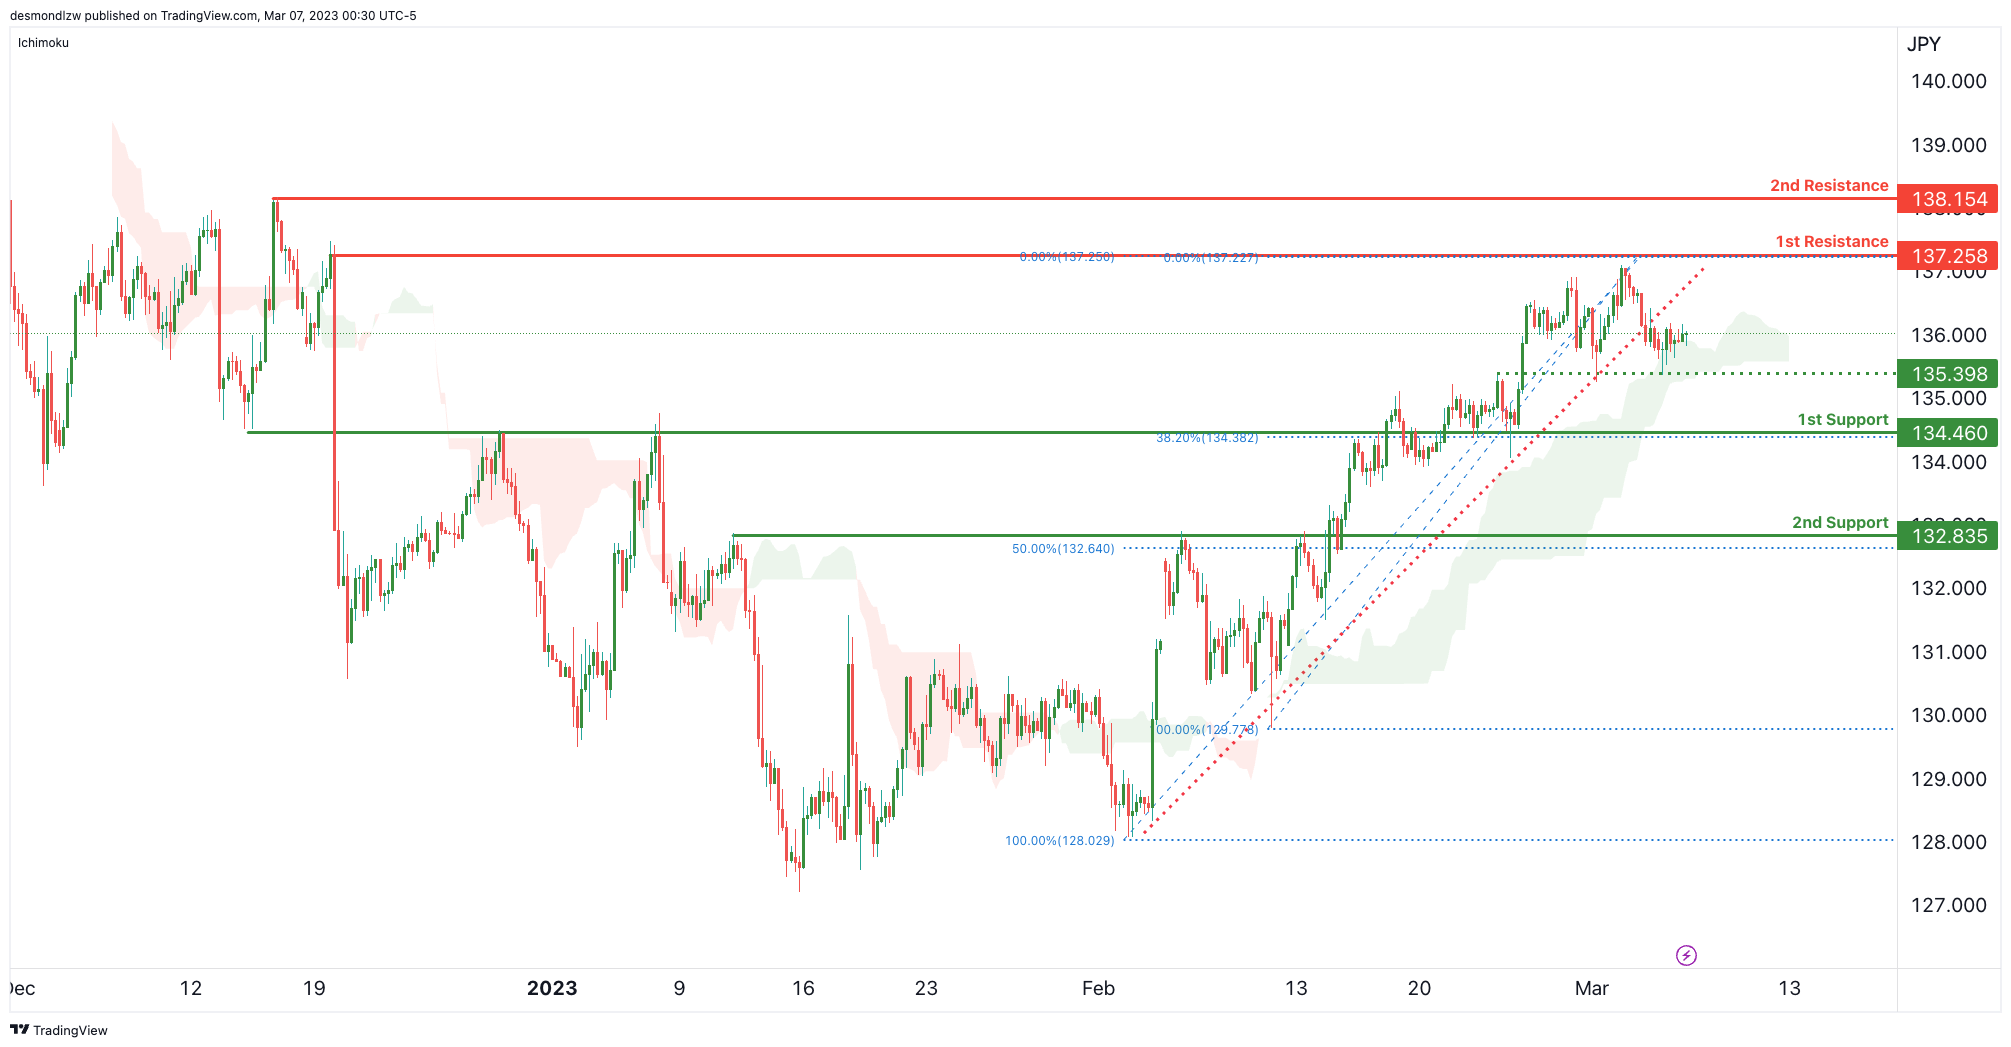
Price has recently broken an ascending support but is facing support from the bullish Ichimoku cloud. It needs to break this Ichimoku cloud along with the intermediate overlap support at 135.98 to trigger a drop to 1st support at 134.46 – which is an overlap support that lines up with the major 38.2% Fibonacci retracement.
AUD/USD:
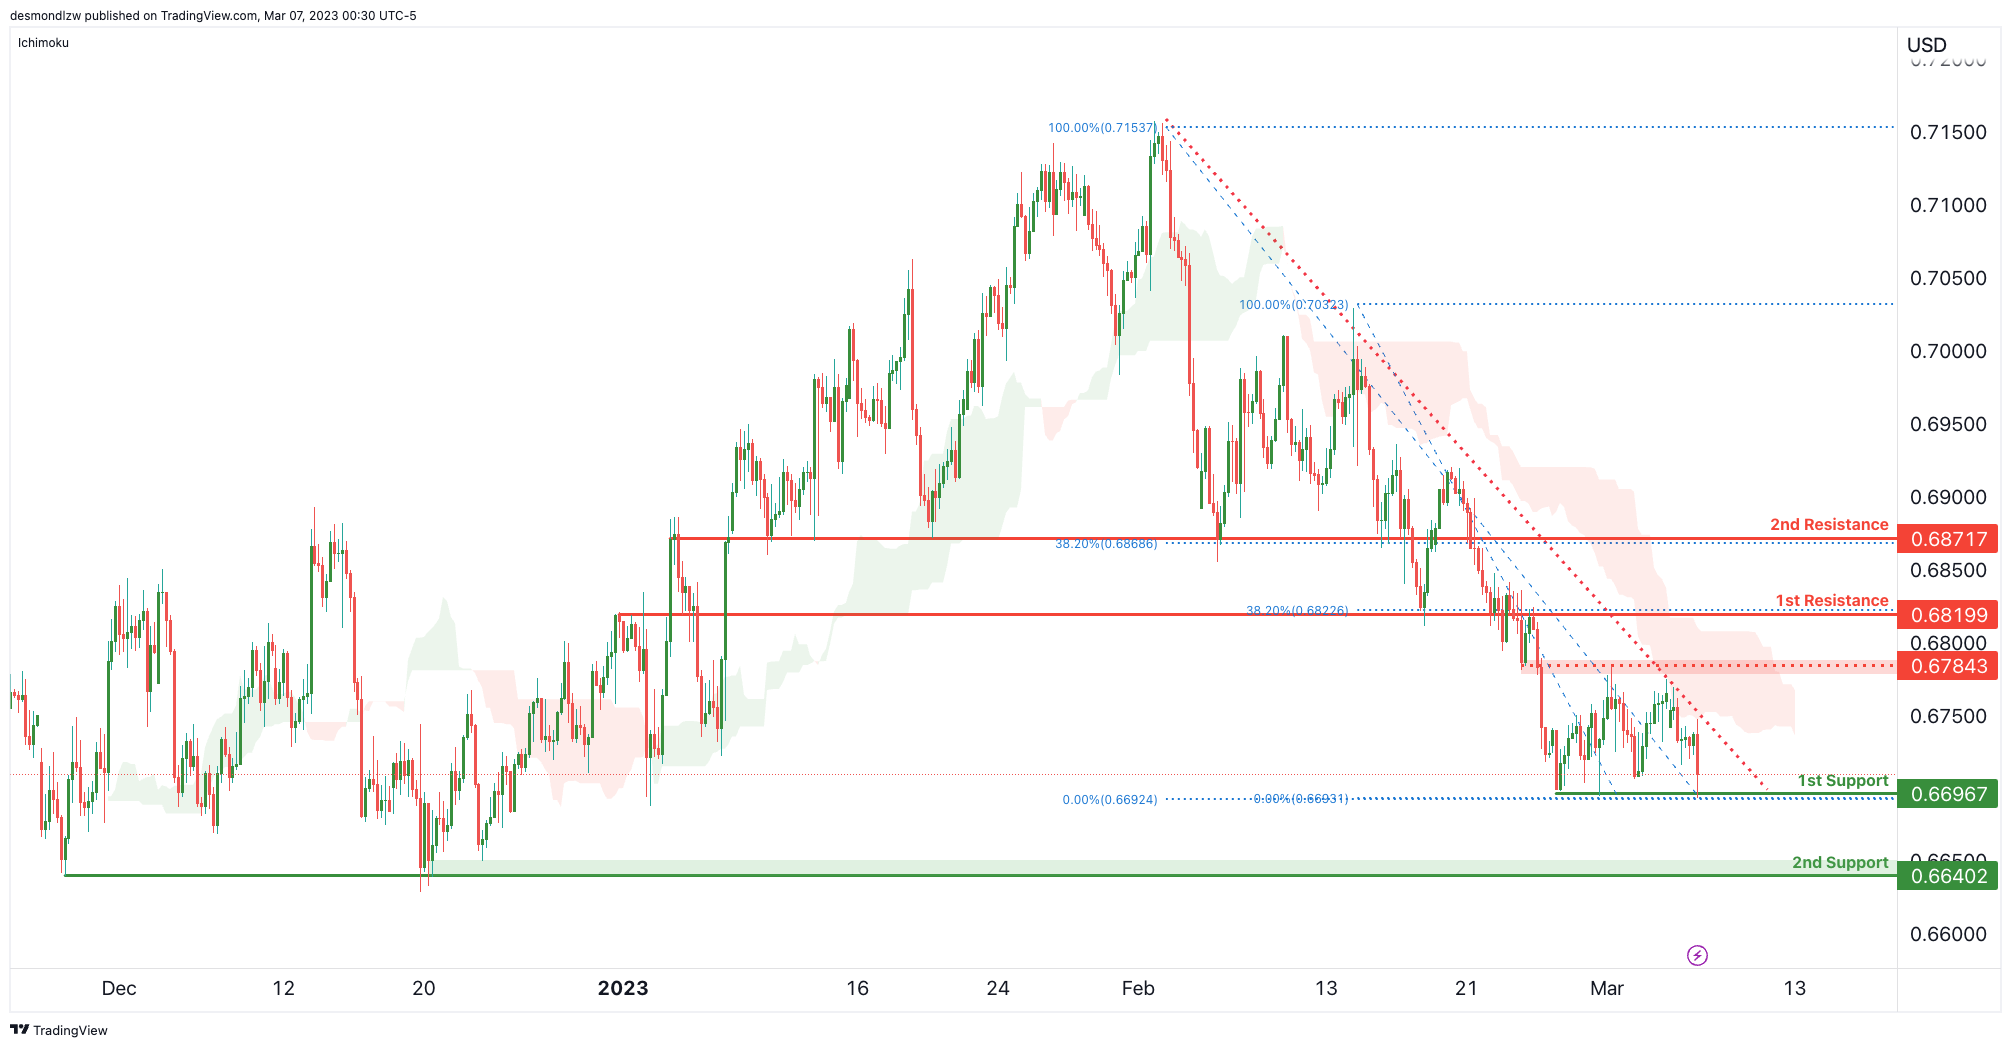
Price is seeing strong bearish momentum from a long term descending resistance line. Along with that, we can see the bearish Ichimoku cloud push prices further down. The 1st support that needs to be broken is 0.6696 which is a multiple swing low support – if price breaks this level, then the next key support level would be down at 0.6640 which is another multiple swing low support.
NZD/USD:
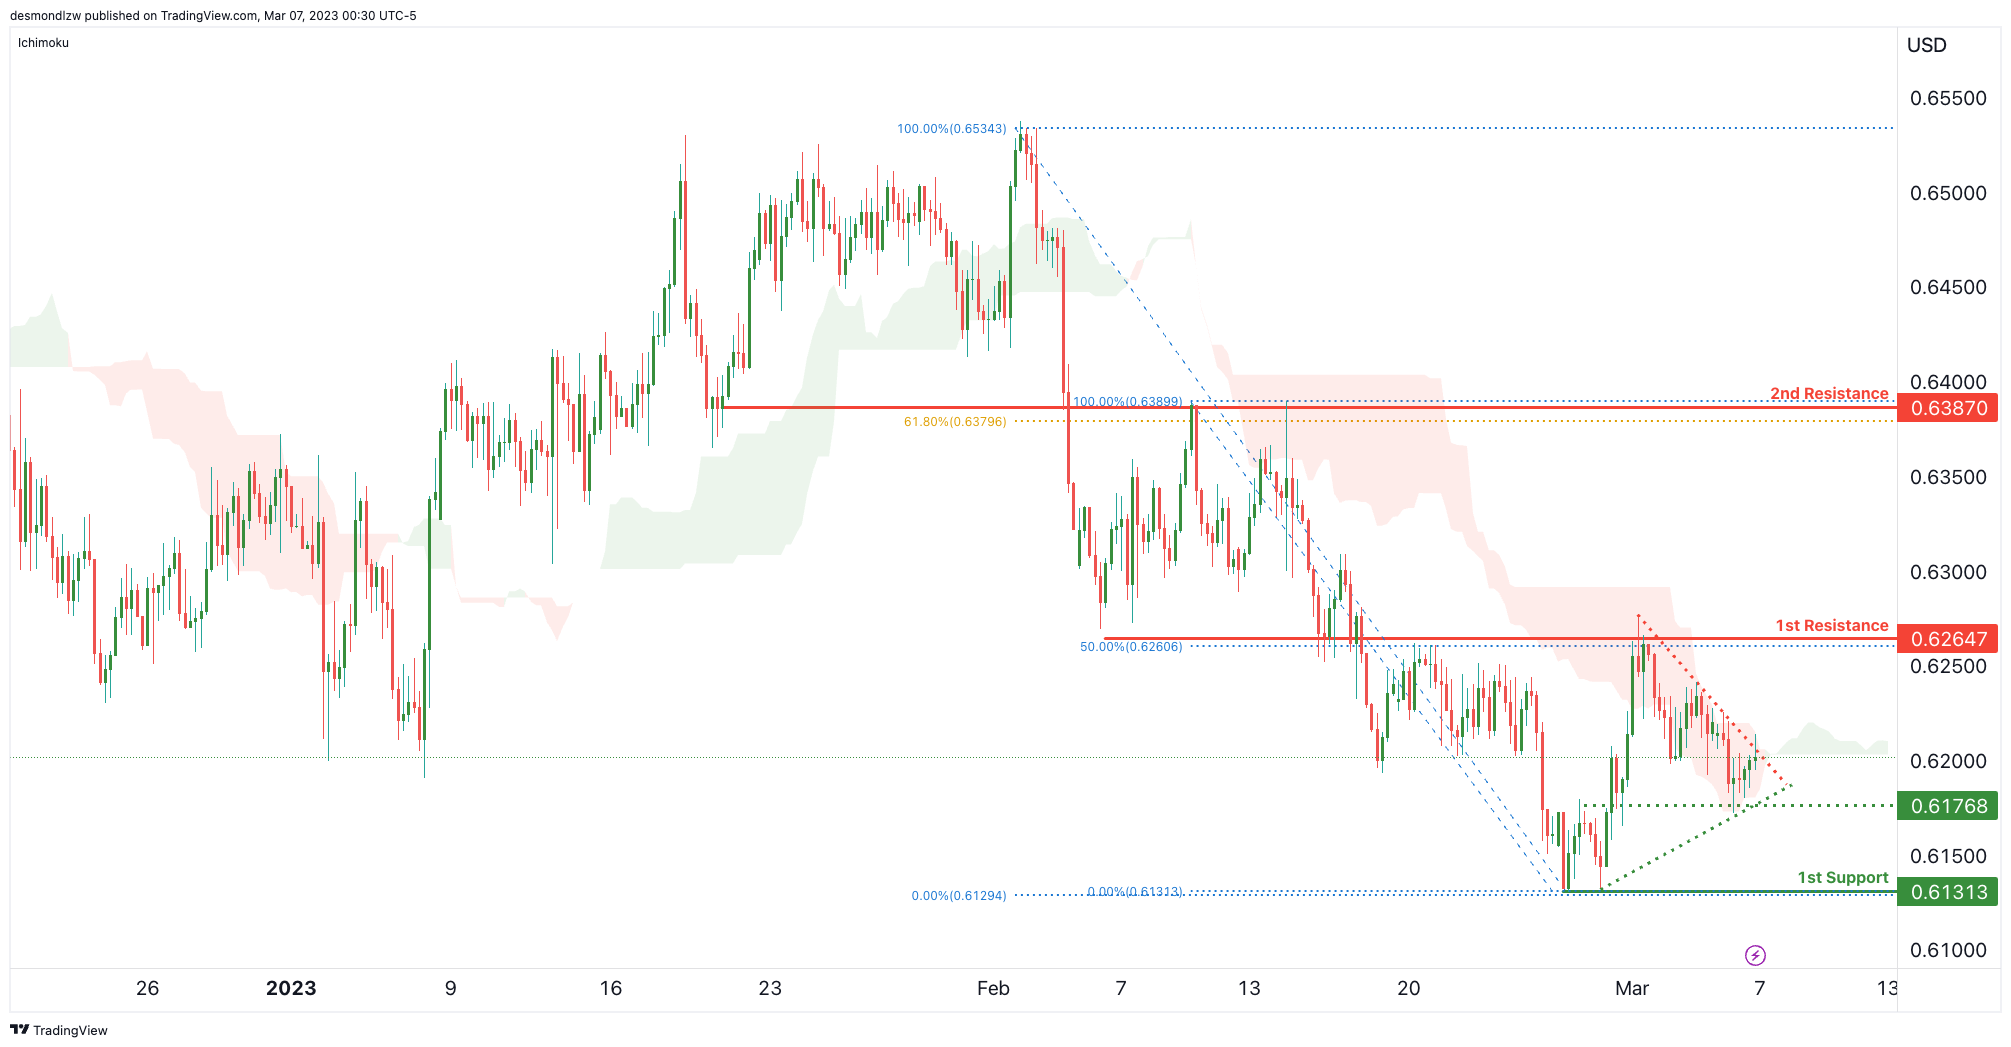
Price is being squeezed between a descending resistance line and an ascending support line along with an intermediate support at 0.6176. It’s worth noting that there’s strong bearish momentum from the Ichimoku cloud.
Price needs to break the intermediate support to trigger the move down to major support at 0.6131.
USD/CAD:
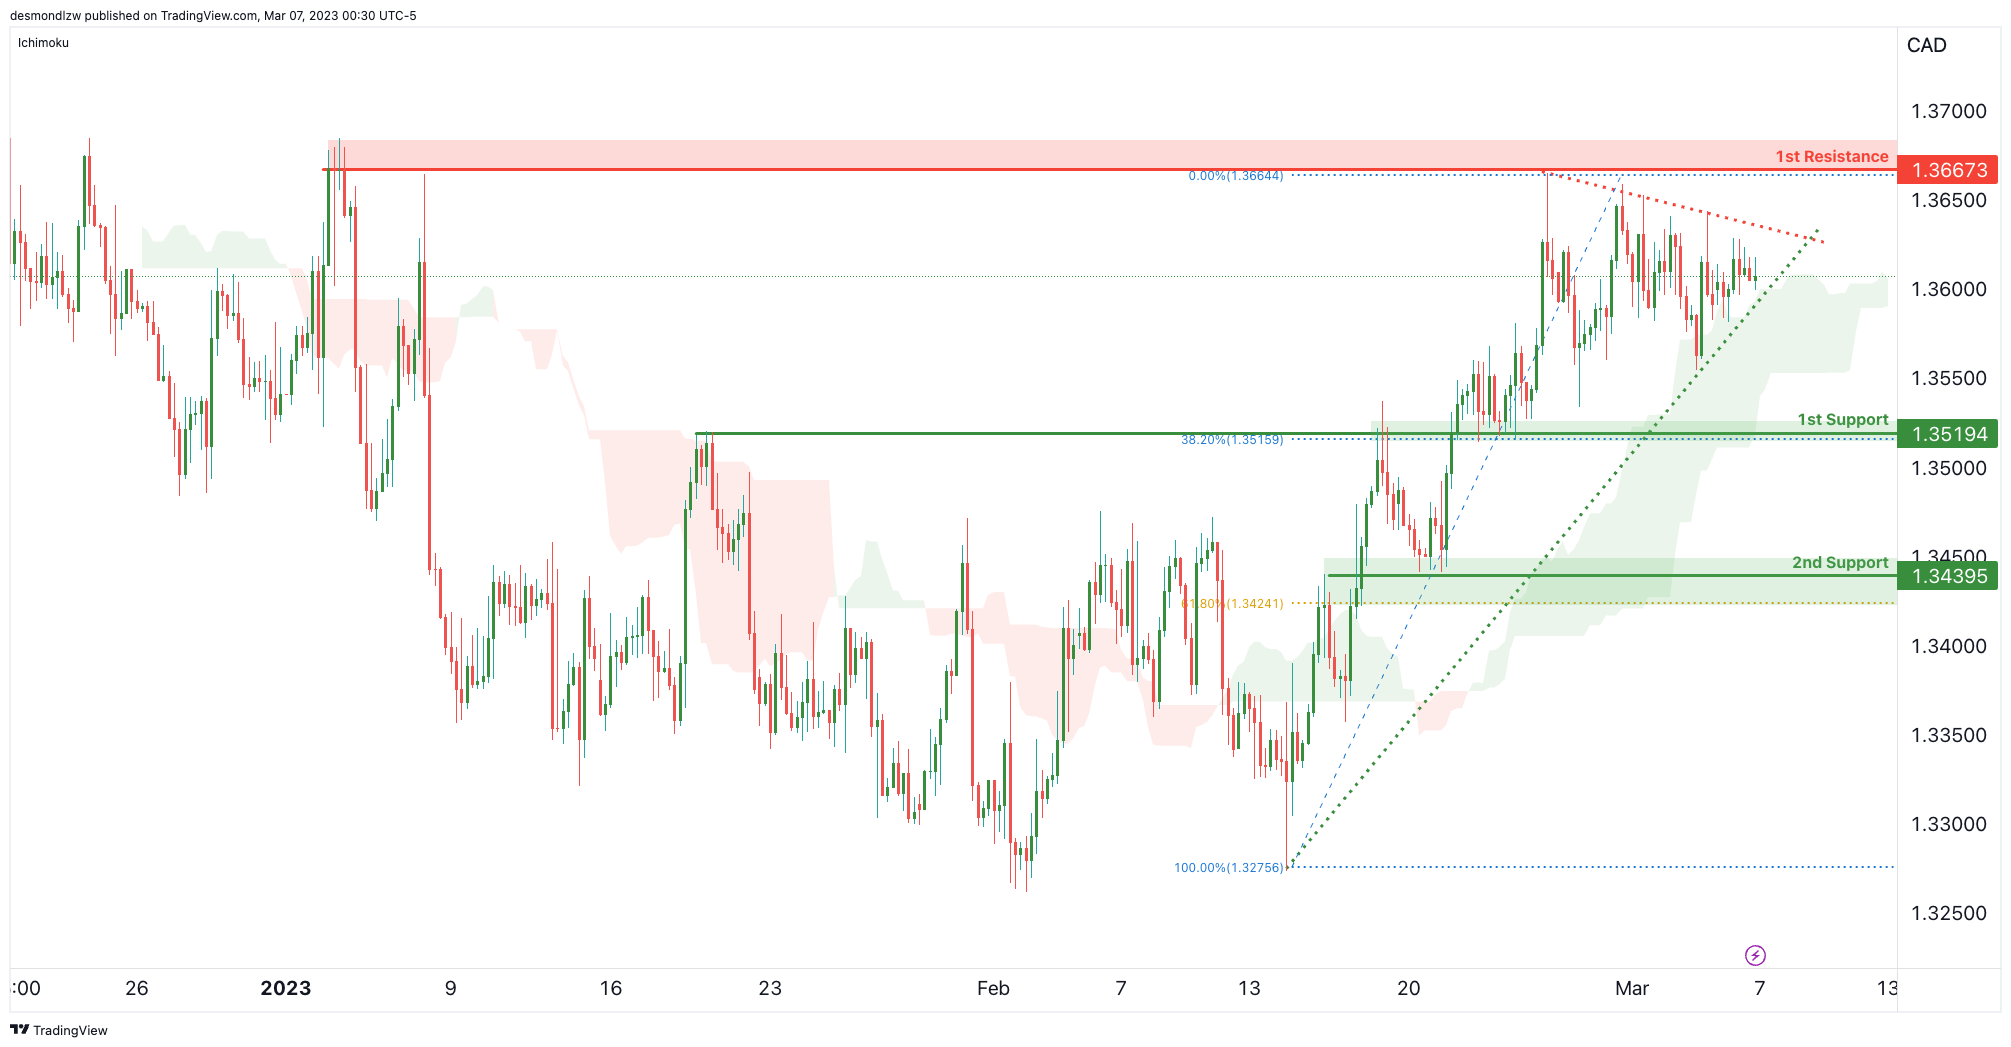
Price is seeing strong bullish momentum from the ascending support line and the bullish Ichimoku cloud. This could push prices up further towards 1.3667 which is a major swing high resistance. It’s worth noting that there’s a short term descending resistance line that is pushing and squeezing prices a bit.
If price were to break the ascending support line, the next key support is down at 1.3519 which is an overlap support that lines up with the 38.2% Fibonacci retracement.
DJ30:
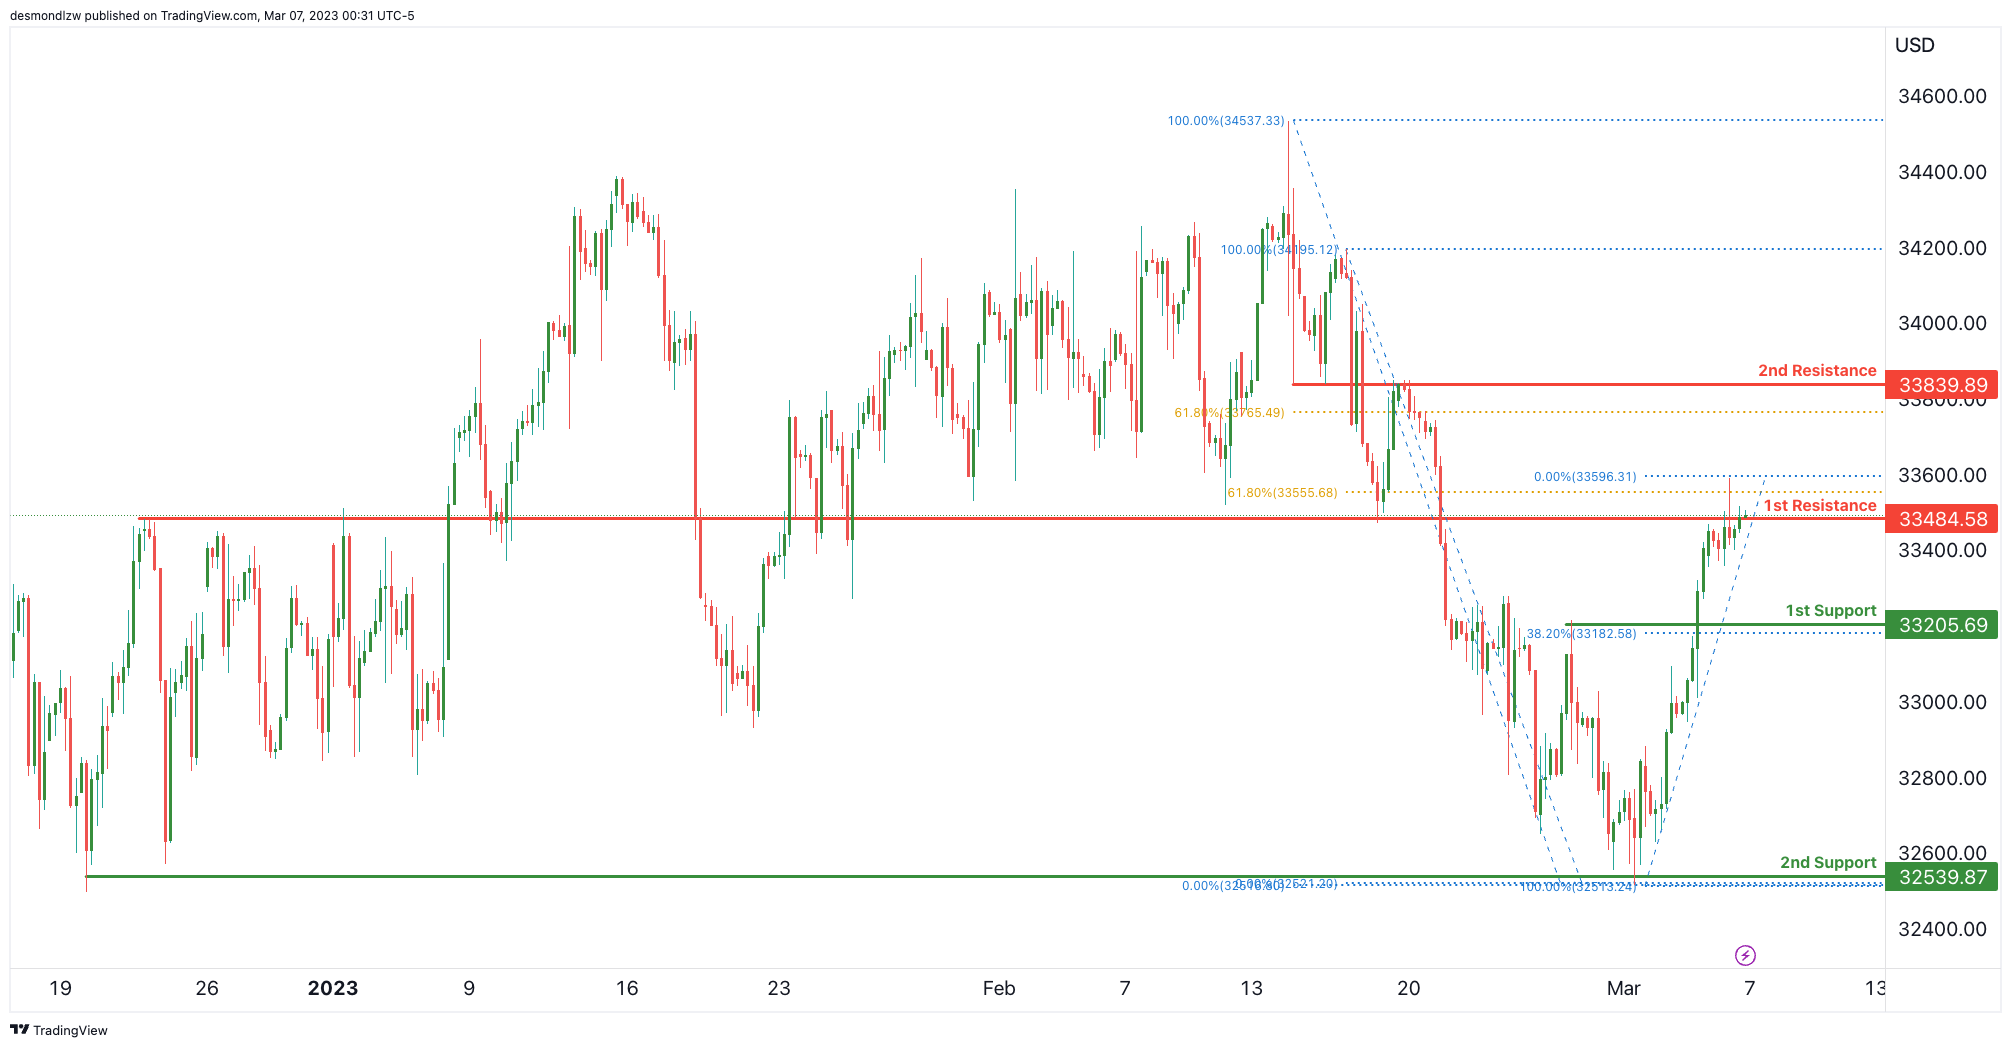
Price is no wrestling major overlap resistance at 33474 which also happens to be a 61.8% Fibonacci retracement. If price reverses from here, the first support it could drop to is 33205 which is a pullback support and a short term 38.2% Fibonacci retracement.
If price breaks down the 1st resistance, then it could rise up to 2nd resistance at 33839 which is a bigger 61.8% Fibonacci retracement.
GER30:
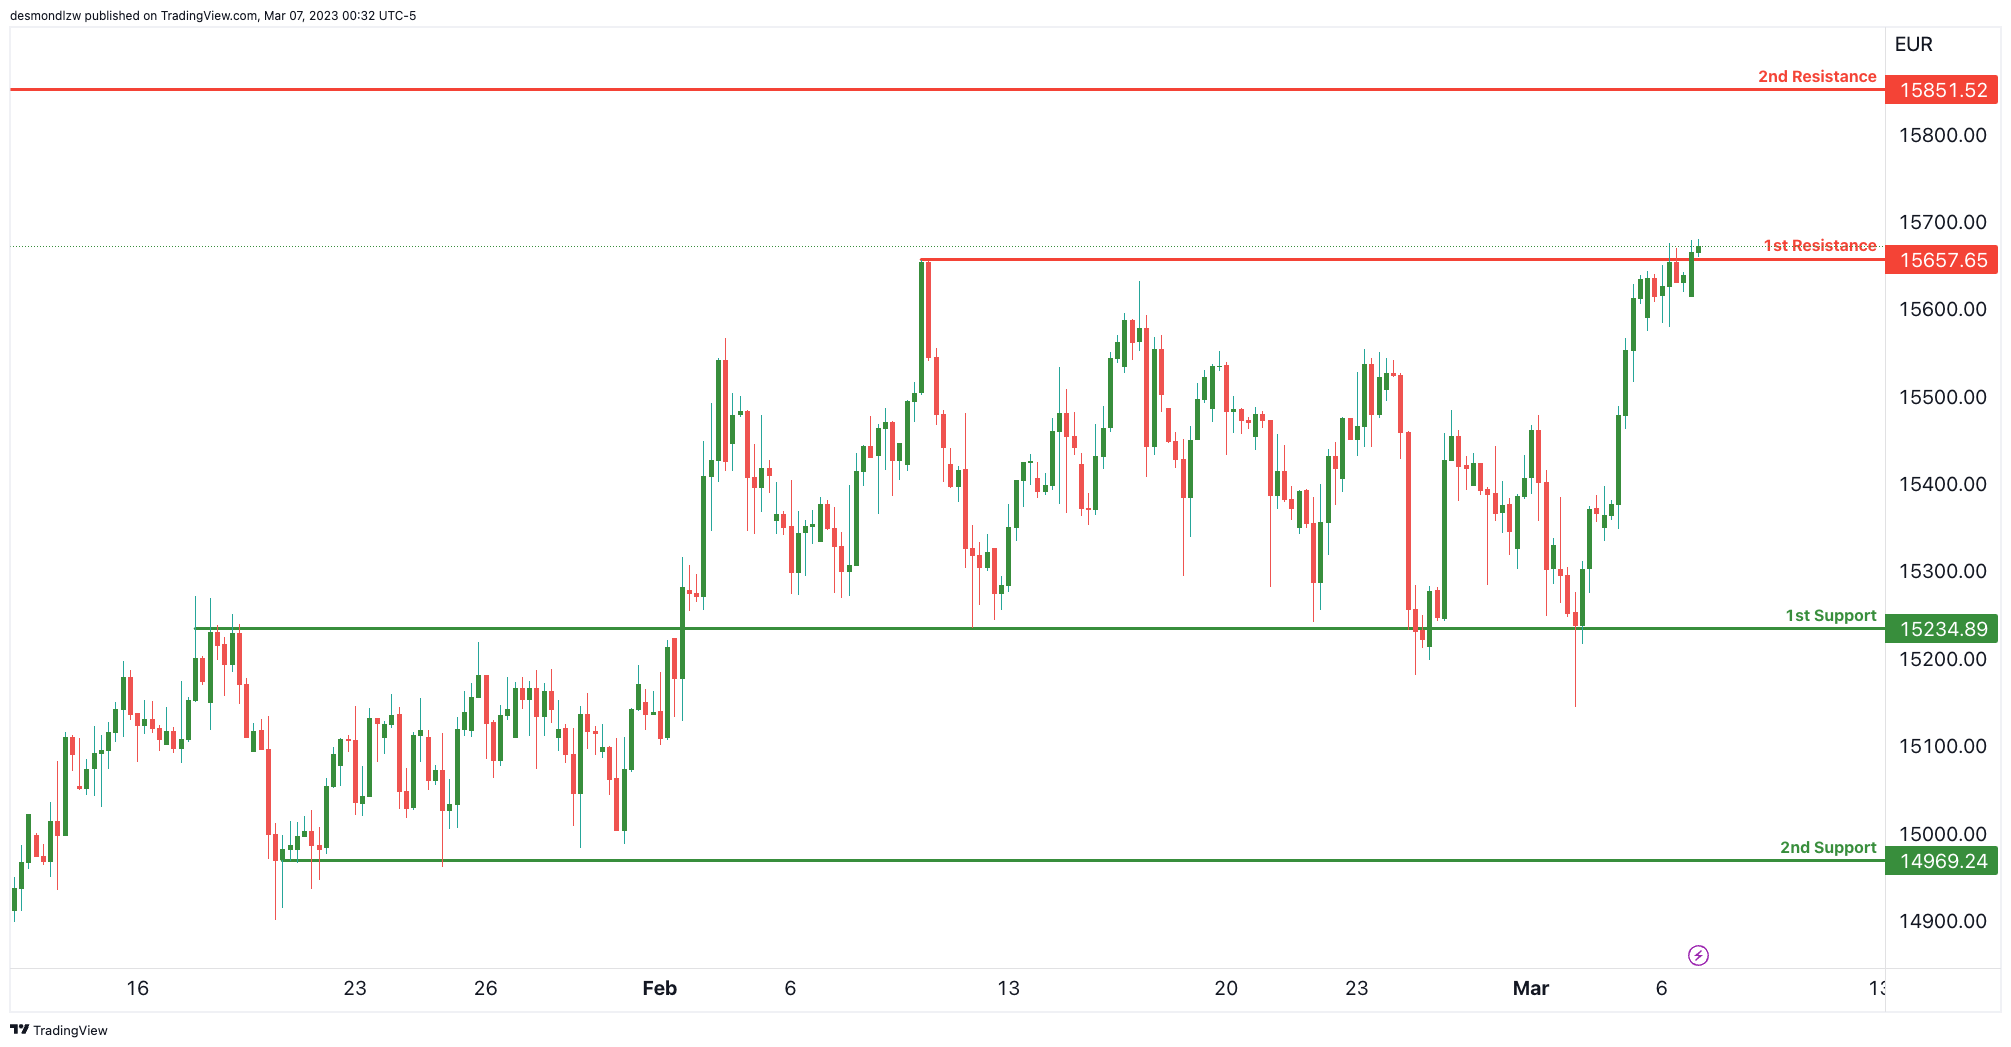
Price is now testing major swing high resistance at 15657 and if price were to break this level, the next overlap resistance from the D1 timeframe is at 15851.
However, if price were to reverse from here, the next major support is down at 15234 which is an overlap support.
BTC/USD:
Price is in a descending channel and seeing our 1st resistance at 22910 which is a Fibonacci retracement and a pullback resistance. If price reverses from this level, we could see the bearish momentum take prices lower to 21367 which is an overlap support.
It’s worth noting that price has finally broken a long term ascending support-turned-resistance line which suggests that we might be seeing a longer term shift to bearish momentum.

US500
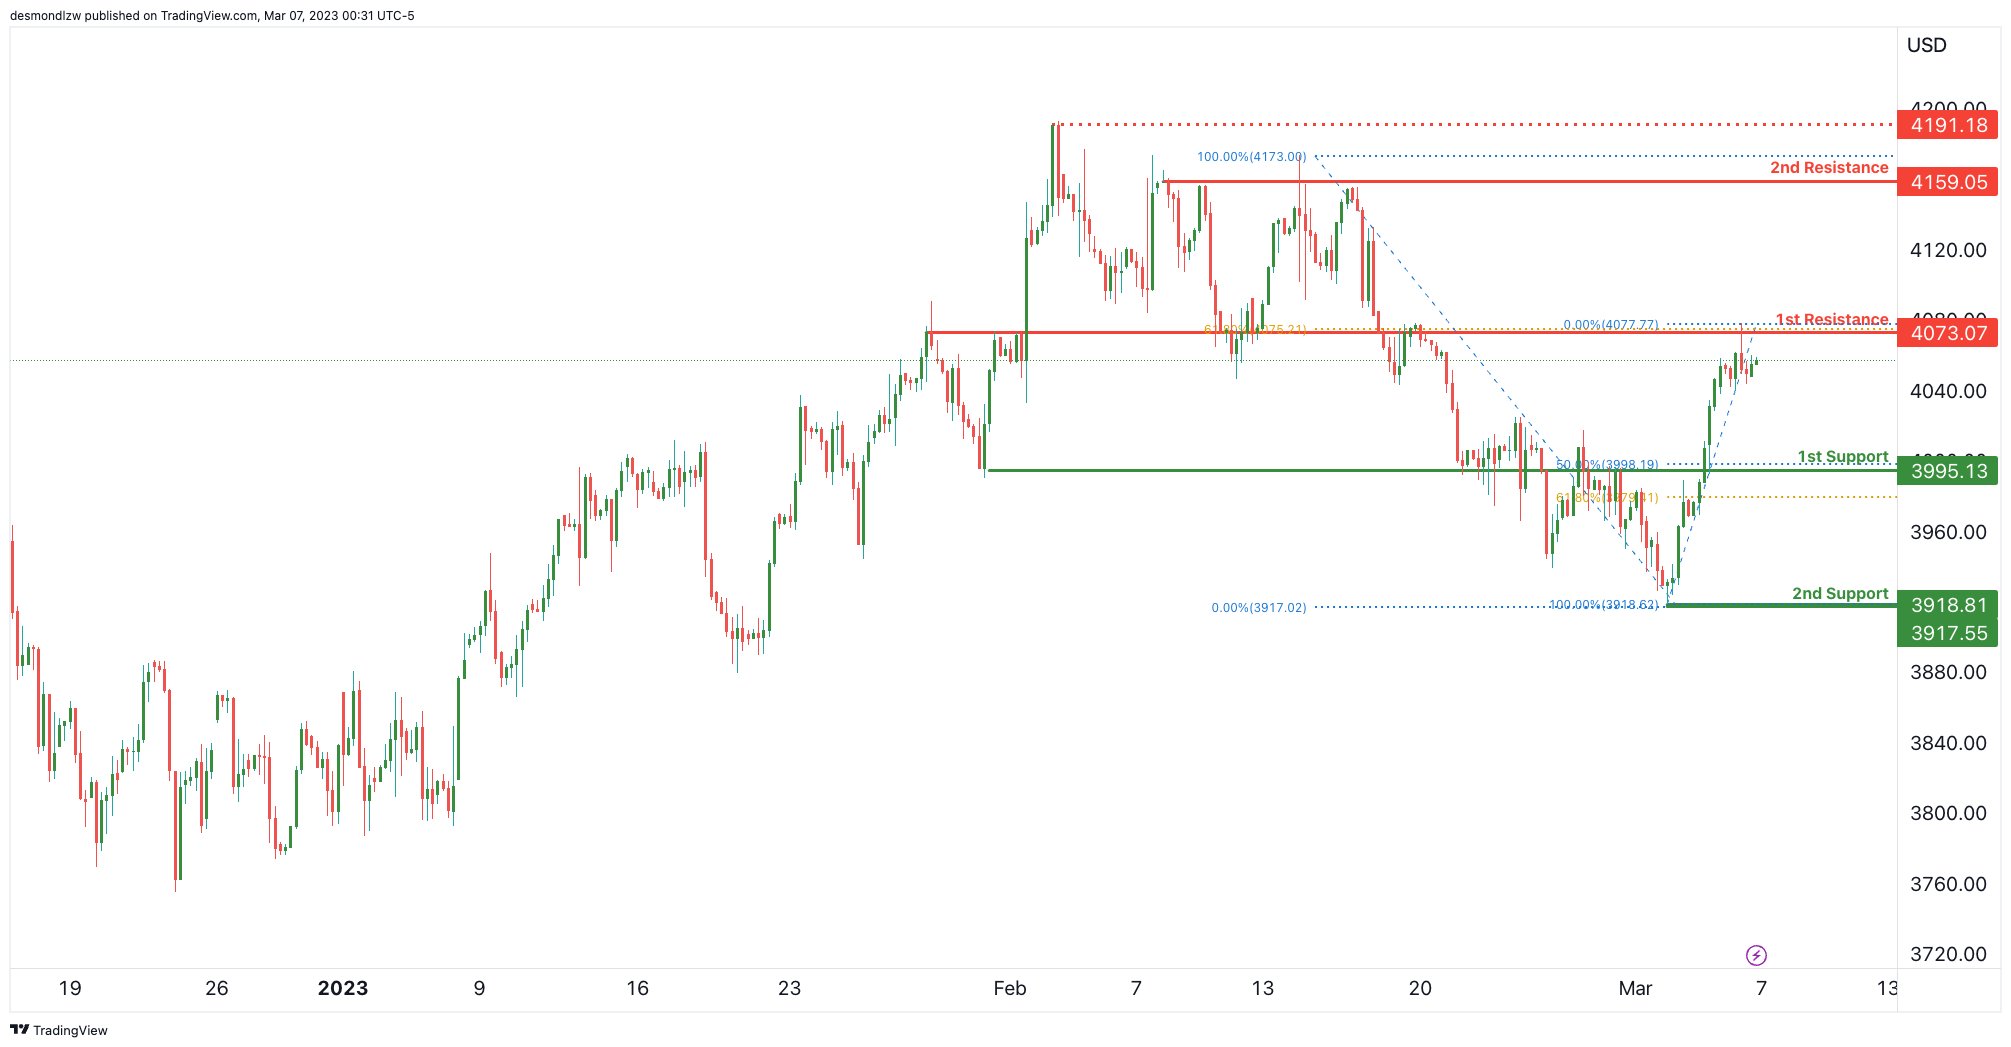
Price is testing a major overlap resistance at 4073 which also lines up with a 61.8% Fibonacci retracement.. If price were to reverse from this level, we could see it drop to the 1st support level at 3995 which also happens to be an overlap support and a 50% Fibonacci retracement.
Breaking that support could see a further drop to 3918 which is a recent swing low support.
ETH/USD:
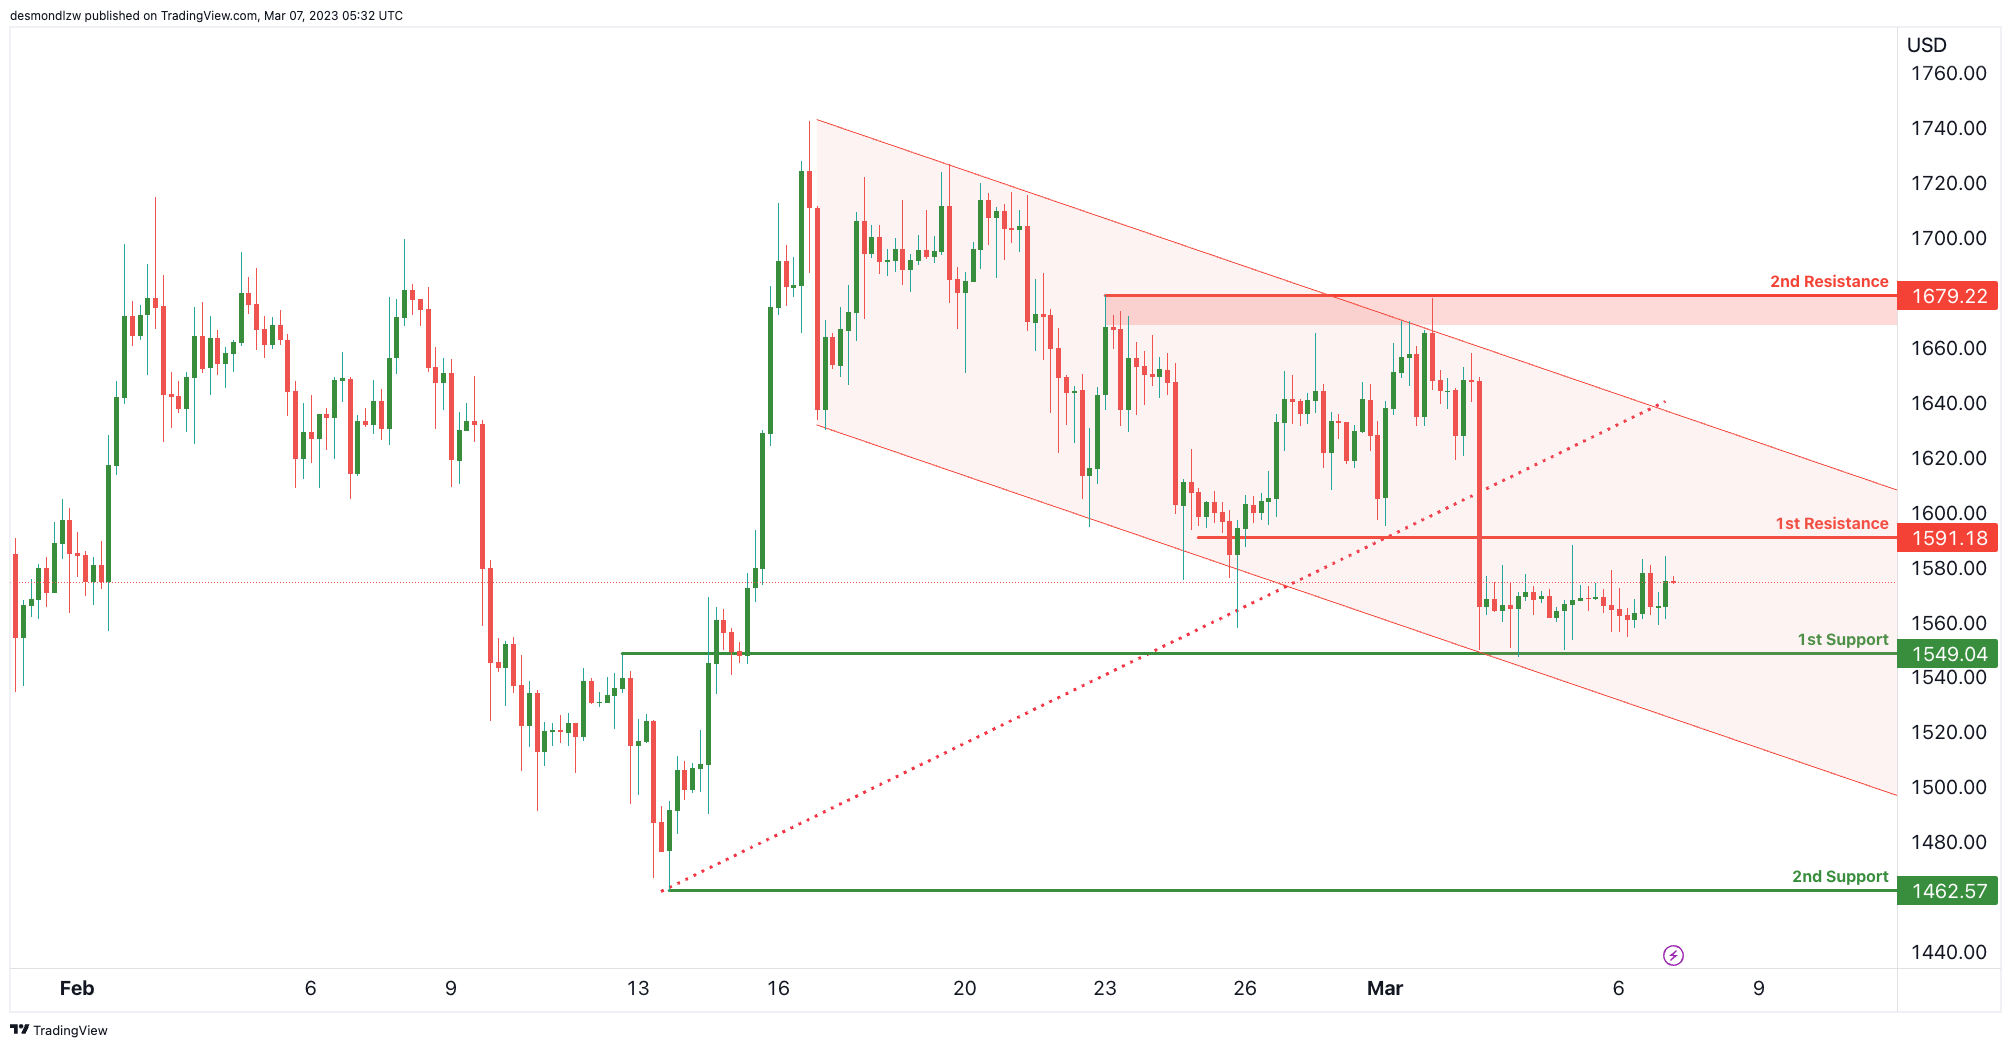
Price is in a bearish descending channel with our 1st resistance at 1591 and the 1st support really near at 1549. Price is currently being squeezed between these 2 levels and a break of either should either see prices with recent multi-swing high resistance at 1679 or recent swing low support at 1462.
WTI/USD:
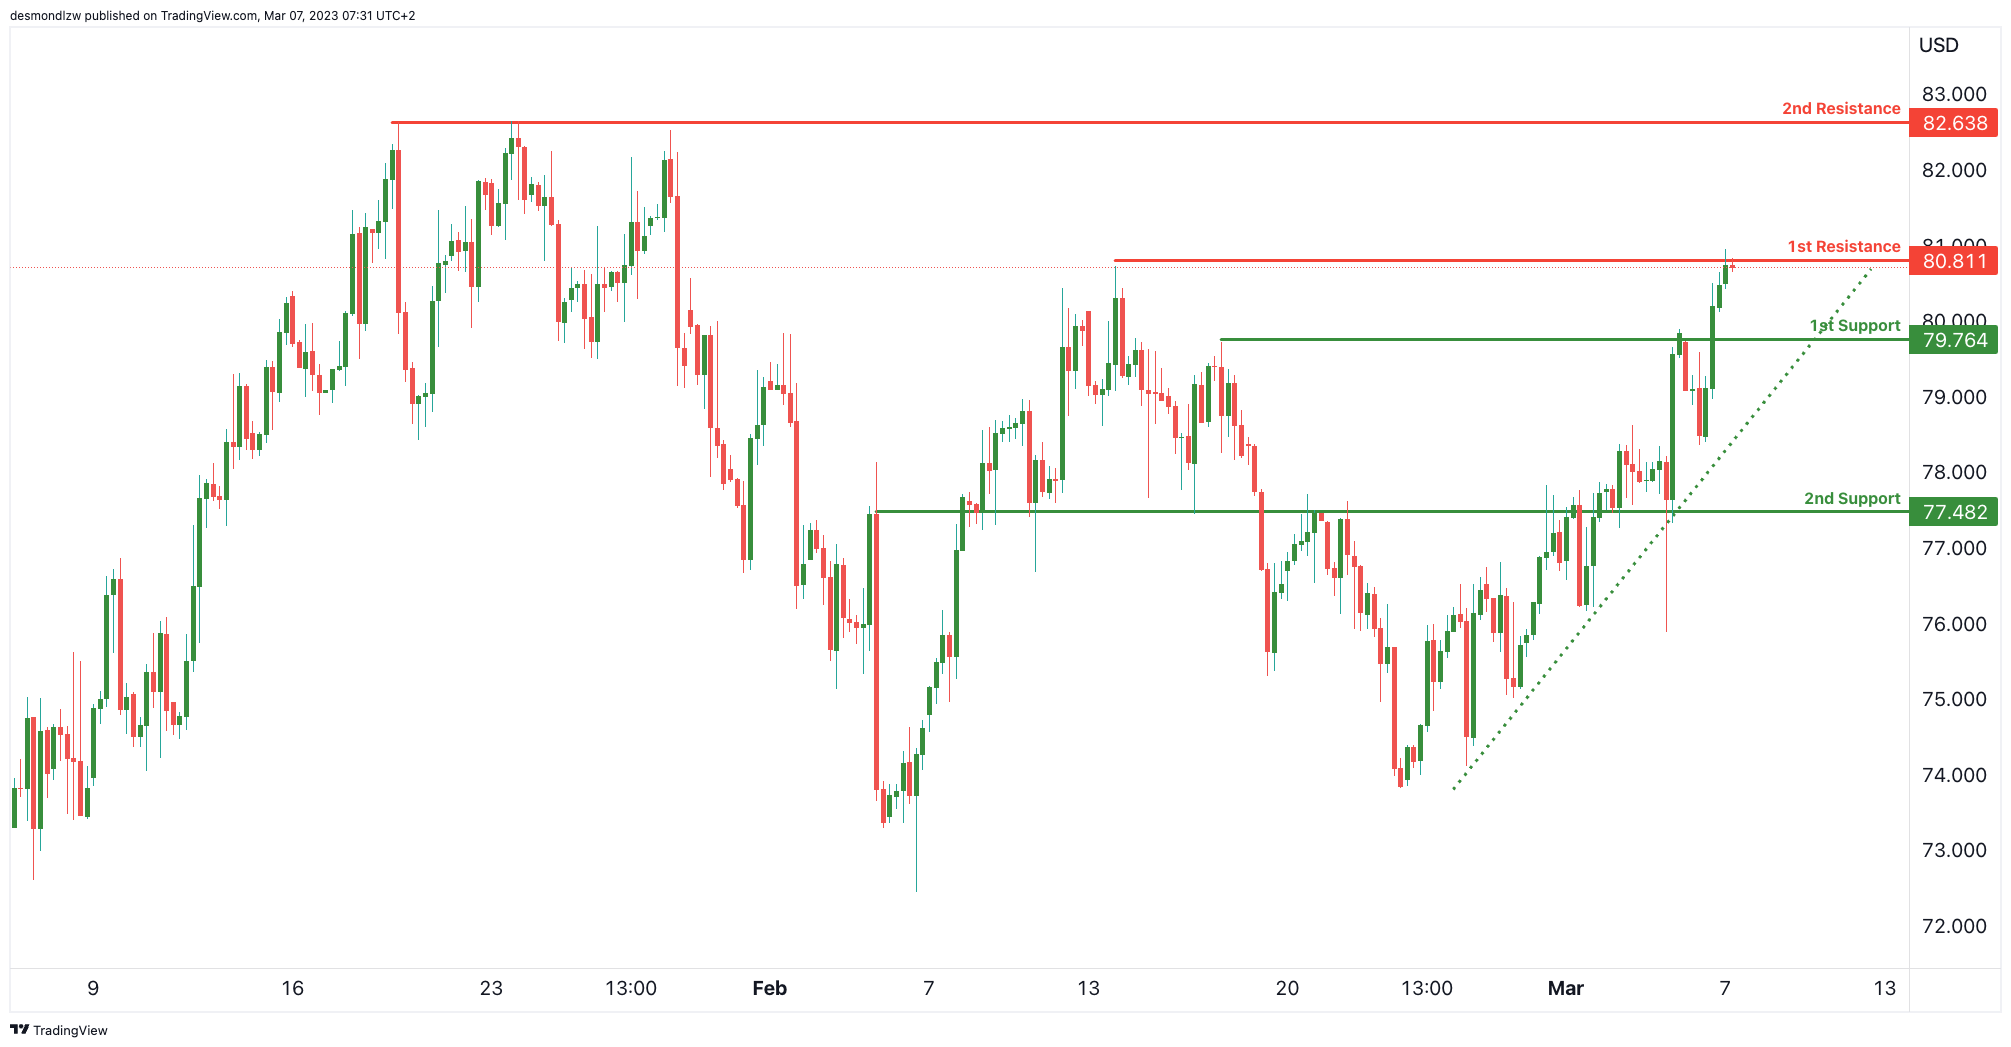
We’re seeing price test major resistance at 80.81 which is a recent swing high resistance. It is worth noting that price is seeing a recent ascending support line suggesting that there might be bullish momentum. A push from here could see prices test recent multi-swing high resistance at 82.63.
If price were to break the ascending support along with the recent 1st support at 79.76, we could see a bigger drop to 2nd support at 77.48 which is an overlap support and 50% Fibonacci retracement.
XAU/USD (GOLD):
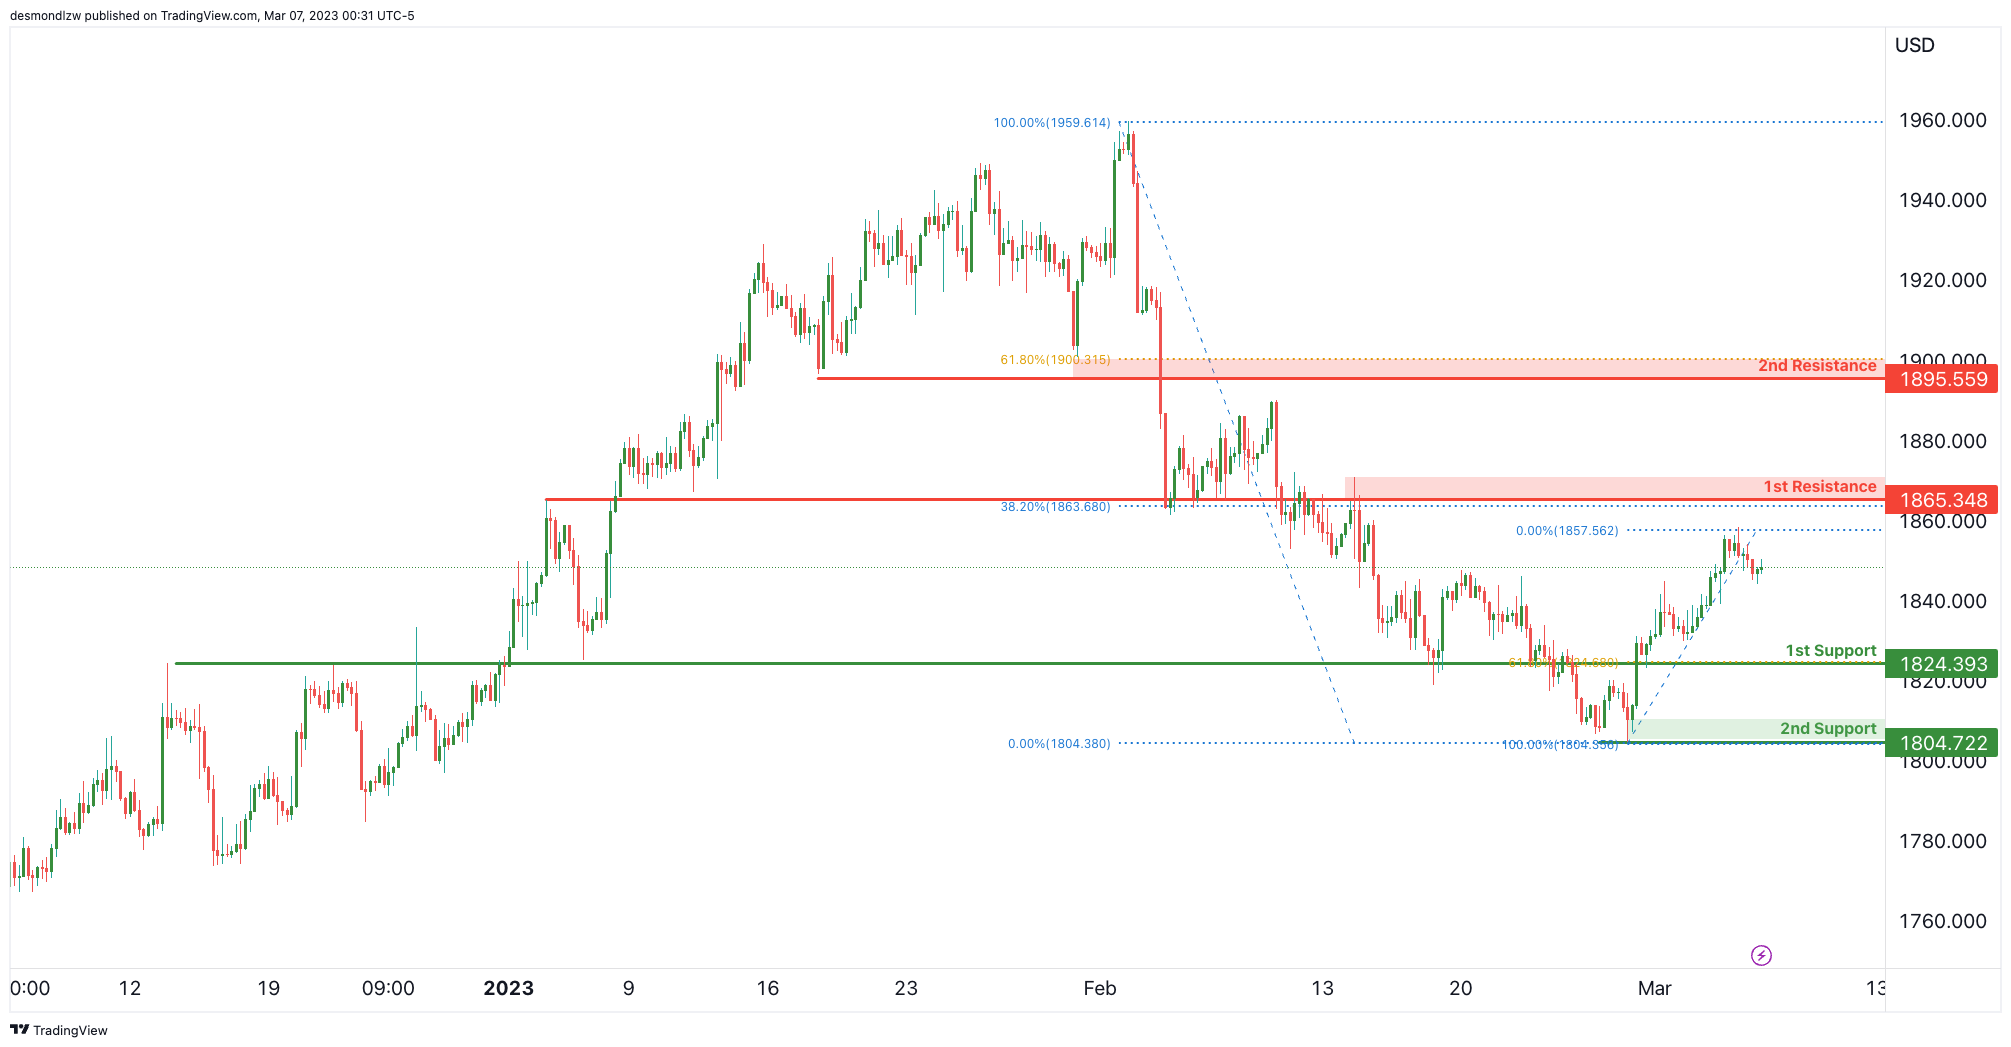
Price is approaching our 1st resistance at 1865 which is an overlap resistance along with a 38.2% Fibonacci retracement. If price were to react off this level, we could see it drop back down to the 1st support level which is a major overlap support – breaking that level would then trigger a drop to 2nd support at 1804 which is a recent swing low support.
EUR/AUD Daily Outlook
Daily Pivots: (S1) 1.5763; (P) 1.5824; (R1) 1.5932; More...
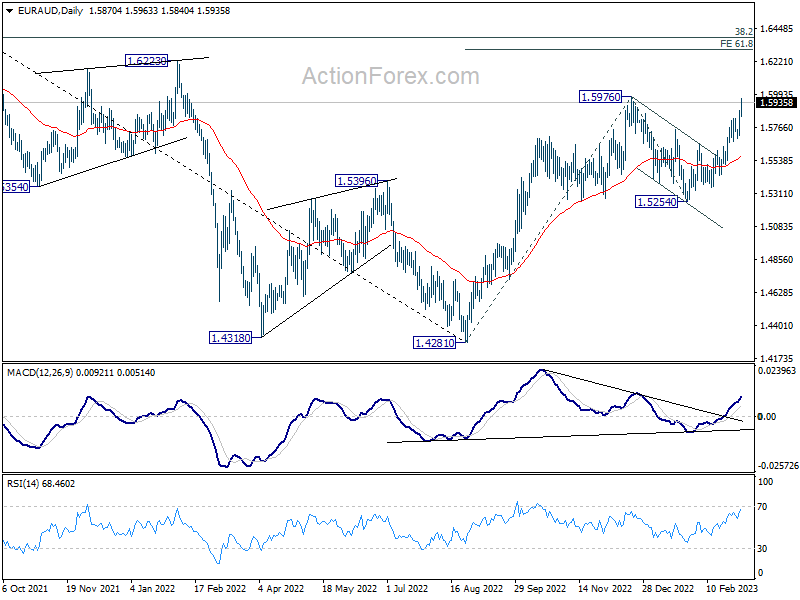
EUR/AUD accelerates to as high as 1.5963 so far. Intraday bias stays on the upside for retesting 1.5976 high. Decisive break there will resume whole rally from 1.4281. Next target will be 61.8% projection of 1.4281 to 1.5976 from 1.5254 at 1.6302. On the downside, below 1.5826 minor support will turn intraday bias neutral and bring consolidations first, before staging another rise.
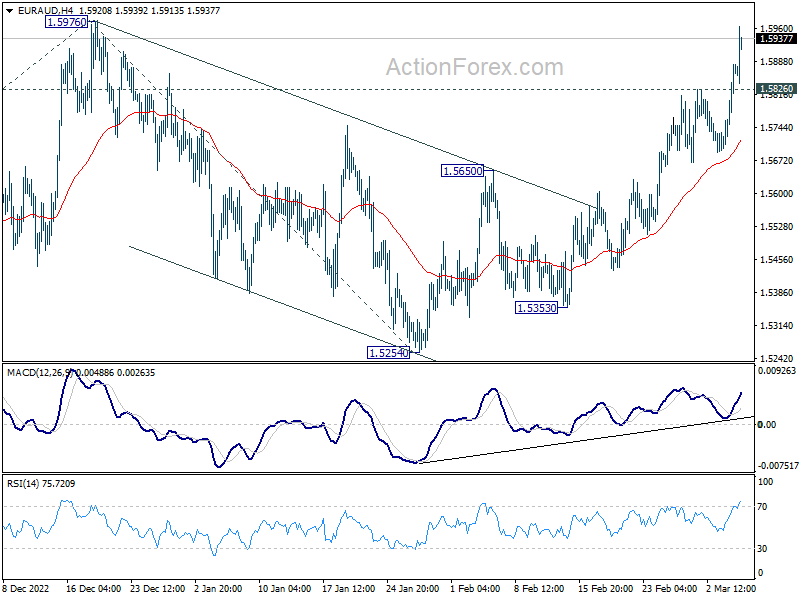
In the bigger picture, the strong support from 55 week EMA (now at 1.5396) is raising the chance of bullish trend reversal. On break of 1.5976, focus will be on 1.6434 cluster resistance (38.2% retracement of 1.9799 to 1.4281 at 1.6389). Sustained break there should confirm that whole down trend form 1.9799 (2020 high) has completed. However, rejection by this cluster resistance will make medium term outlook neutral at best.
Australian Dollar Falls on Subtle Dovish Twist, All Eyes on Fed Chair’s Testimony
Australian dollar experienced a broad decline today following a subtle dovish shift in the statement, raising speculation of a potential earlier pause in the tightening cycle. While the general expectation of another hike in April remains unchanged, May is getting slightly more uncertain. So far, New Zealand dollar is the strongest performer today, followed by the European majors. Yen and dollar are the weakest next to Aussie. The greenback is likely to be impacted by the upcoming semi-annual testimony by Fed Chair Jerome Powell, with traders closely monitoring any hints of a 50bps hike this month and his outlook on the terminal rate.
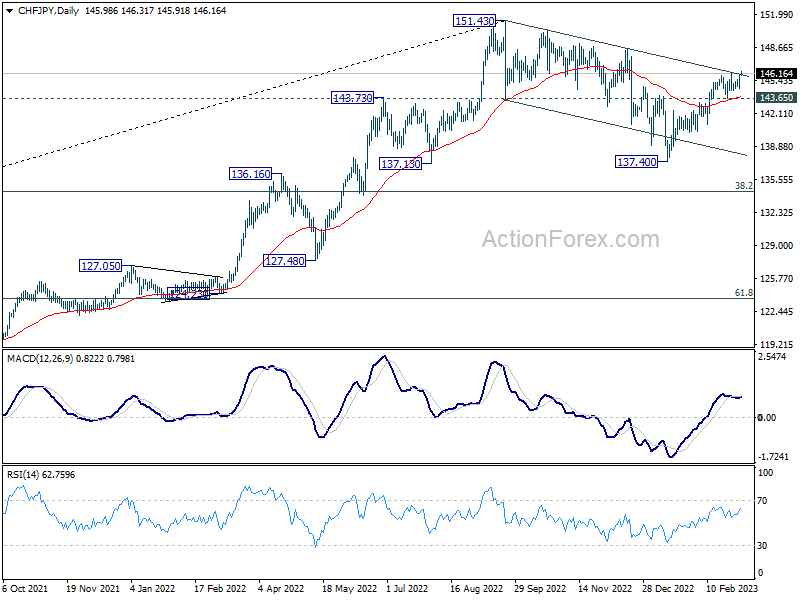
Traders should keep an eye on CHF/JPY, as the franc experienced a sharp jump yesterday following stronger-than-expected Swiss CPI data, ahead of the SNB rate decision later in the month. As a result, today's remarks from SNB Chair Thomas Jordan will be particularly important, and may trigger volatility. From a technical perspective, the rise from 137.40 is still ongoing, with sustained trading above channel resistance confirming the completion of the entire correction from 151.43, and potentially leading to a retest of that level.
In Asia, Nikkei closed up 0.34%. Hong Kong HSI is down -0.21%. China Shanghai SSE is down -0.45%. Singapore Strait Times is up 0.28%. Japan 10-year JGB yield is down -0.0041 at 0.500. Overnight, DOW rose 0.12%. S&P 500 rose 0.07%. NASDAQ dropped -0.11%. 10-year yield rose 0.019 to 3.983.
RBA hikes 25bps, notes lower risk of prices-wages spiral
RBA raised the cash rate target by 25bps to 3.60%, which was widely anticipated. The bank also signaled the need for further tightening of monetary policy. Nevertheless, there was a notable dovish twist in the the statement about a lower risk of prices-wages spiral.
The central bank said monthly CPI indicator suggested that "inflation has peaked in Australia". The central forecasts is for inflation to decline this year and next to around 3% in mid-2025. Medium-term inflation expectations remain "well anchored".
Growth over the next couple of years is expected to be "below trend". Labor markets remains "very tight, although conditions have eased a little". Wage growth is "still consistent with the inflation target" and "recent data suggest a lower risk of a cycle in which prices and wages chase one another".
It indicated that "further tightening of monetary policy will be needed". The timing and extent of further interest rate hikes will depend on "developments in the global economy, trends in household spending and the outlook for inflation and the labour market".
AUD/CAD and AUD/NZD near downside breakout after RBA
Australian Dollar weakened broadly despite RBA's rate hike. This is attributed to the less hawkish statement by RBA indicating a "lower risk of a cycle in which prices and wages chase one another".
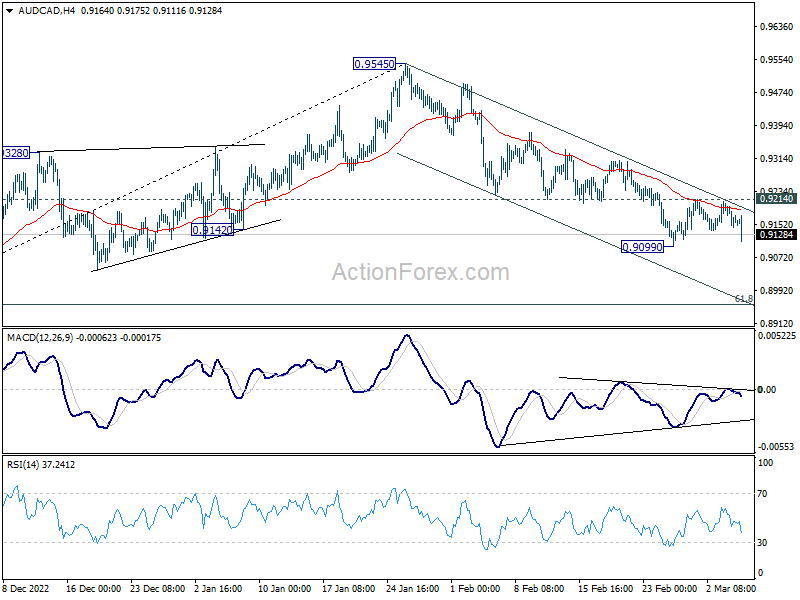
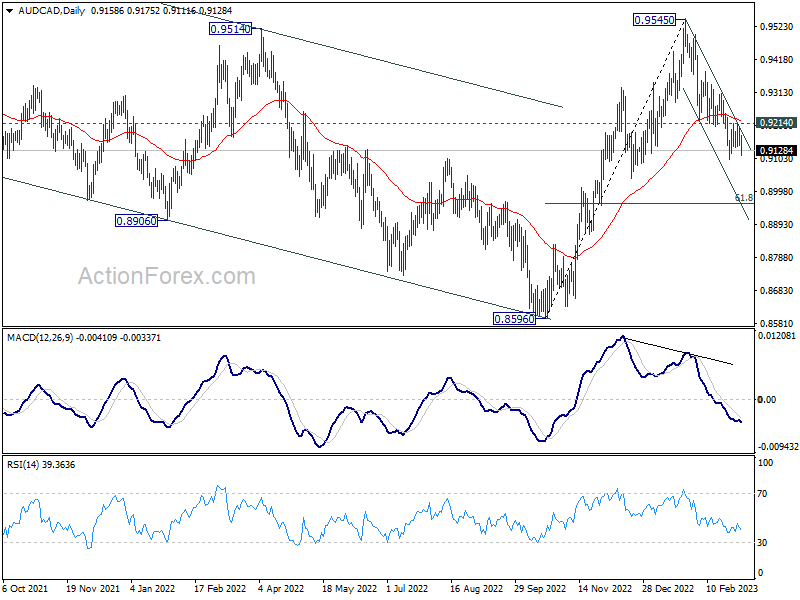
As AUD/CAD nears a breakthrough of 0.9099 temporary low, a deeper decline is expected as long as 0.9214 resistance holds. The next target for the fall from 0.9545 is 61.8% retracement of 0.8596 to 0.9545 at 0.8959. Bullish convergence conditions in 4 hour MACD suggest that stronger support may be seen there to bring a rebound.
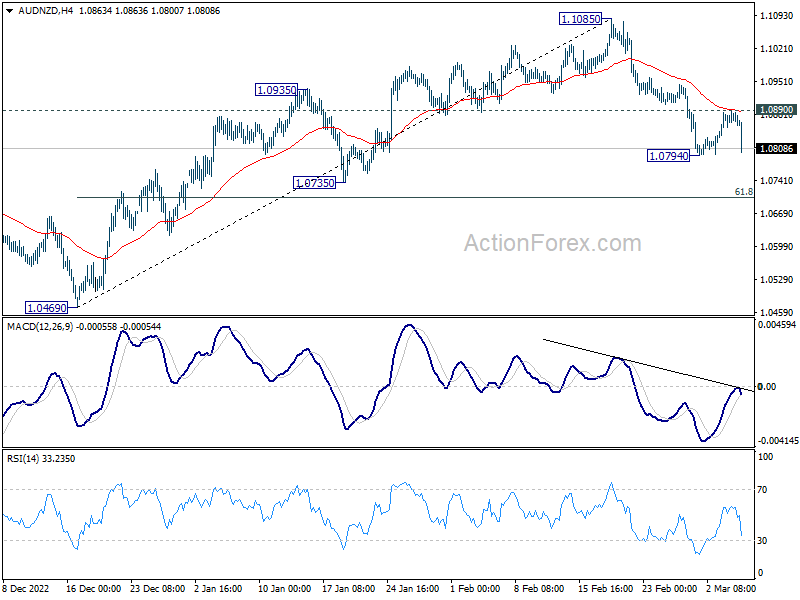
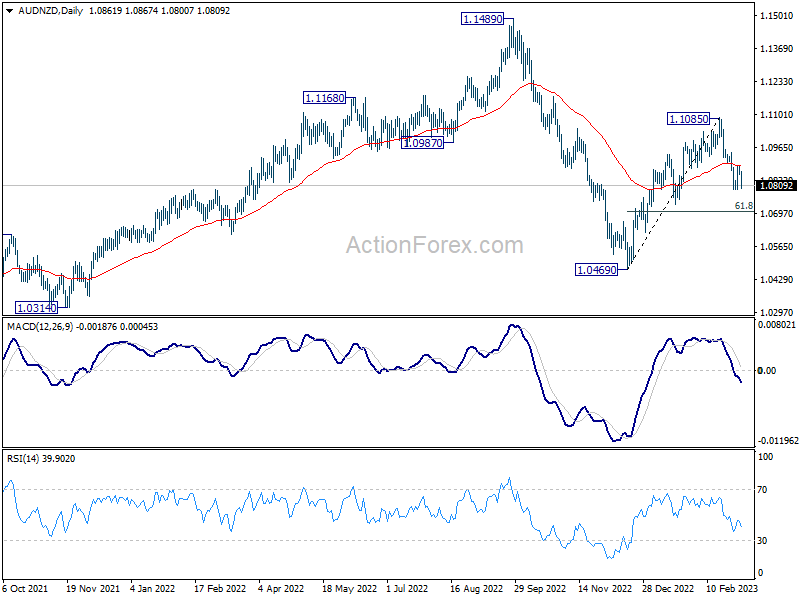
Likewise, AUD/NZD is poised to break through 1.0794, with the decline from 1.1085 targeting the 1.0735 support or further to the 61.8% retracement of 1.0469 to 1.1085 at 1.0704. Sustained break there could pave the way to retest 1.0469 low. The near-term outlook will remain bearish as long as the 1.0890 resistance holds.
Japan's Wage Growth Disappoints in January, Real Earnings Fall the Most Since 2014
Japan's nominal labor cash earnings rose by 0.8% yoy in January, below expectations of 1.9% yoy. The strong growth rate of 4.1% yoy in December was an anomaly due to lump-sum payments, rather than regular wage rises. The level of wage growth is far below the required level needed to maintain a 2% inflation rate, as indicated by outgoing BoJ Governor Haruhiko Kuroda.
Moreover, real cash earnings of workers have declined by -4.1% yoy, indicating that their real wages have fallen the most since 2014. The continuous decline in real wages for ten consecutive months shows that inflation has surpassed earnings.
Later in the week, BoJ is expected to keep its ultra-loose monetary policy unchanged, including the negative short-term interest rate of -0.10% and the 10-year yield cap at 0.50% at Kuroda's final meeting before handing over the reins to Kazuo Ueda. The declining real wages poses a challenge for the incoming governor to achieve the inflation target set by the central bank.
Looking ahead
Swiss unemployment rate and foreign currency reserves, Germany factor orders will be released in European session. But the major focus will be on Fed Chair Jerome Powell's semi-annual testimony.
EUR/AUD Daily Outlook
Daily Pivots: (S1) 1.5763; (P) 1.5824; (R1) 1.5932; More...
EUR/AUD accelerates to as high as 1.5963 so far. Intraday bias stays on the upside for retesting 1.5976 high. Decisive break there will resume whole rally from 1.4281. Next target will be 61.8% projection of 1.4281 to 1.5976 from 1.5254 at 1.6302. On the downside, below 1.5826 minor support will turn intraday bias neutral and bring consolidations first, before staging another rise.
In the bigger picture, the strong support from 55 week EMA (now at 1.5396) is raising the chance of bullish trend reversal. On break of 1.5976, focus will be on 1.6434 cluster resistance (38.2% retracement of 1.9799 to 1.4281 at 1.6389). Sustained break there should confirm that whole down trend form 1.9799 (2020 high) has completed. However, rejection by this cluster resistance will make medium term outlook neutral at best.
Economic Indicators Update
| GMT | Ccy | Events | Actual | Forecast | Previous | Revised |
|---|---|---|---|---|---|---|
| 23:30 | JPY | Labor Cash Earnings Y/Y Jan | 0.80% | 1.90% | 4.80% | 4.10% |
| 00:01 | GBP | BRC Like-For-Like Retail Sales Y/Y Feb | 4.90% | 3.90% | ||
| 00:30 | AUD | Trade Balance (AUD) Jan | 11.69B | 12.25B | 12.24B | 12.99B |
| 03:30 | AUD | RBA Interest Rate Decision | 3.60% | 3.60% | 3.35% | |
| 06:45 | CHF | Unemployment Rate Feb | 1.90% | 1.90% | ||
| 07:00 | EUR | Germany Factory Orders M/M Jan | -0.90% | 3.20% | ||
| 08:00 | CHF | Foreign Currency Reserves (CHF) Feb | 784B | |||
| 15:00 | USD | Fed Chair Powell Testifies | ||||
| 15:00 | USD | Wholesale Inventories Jan F | -0.40% | -0.40% |
Short Term Elliott Wave Outlook in SPX Favors More Upside
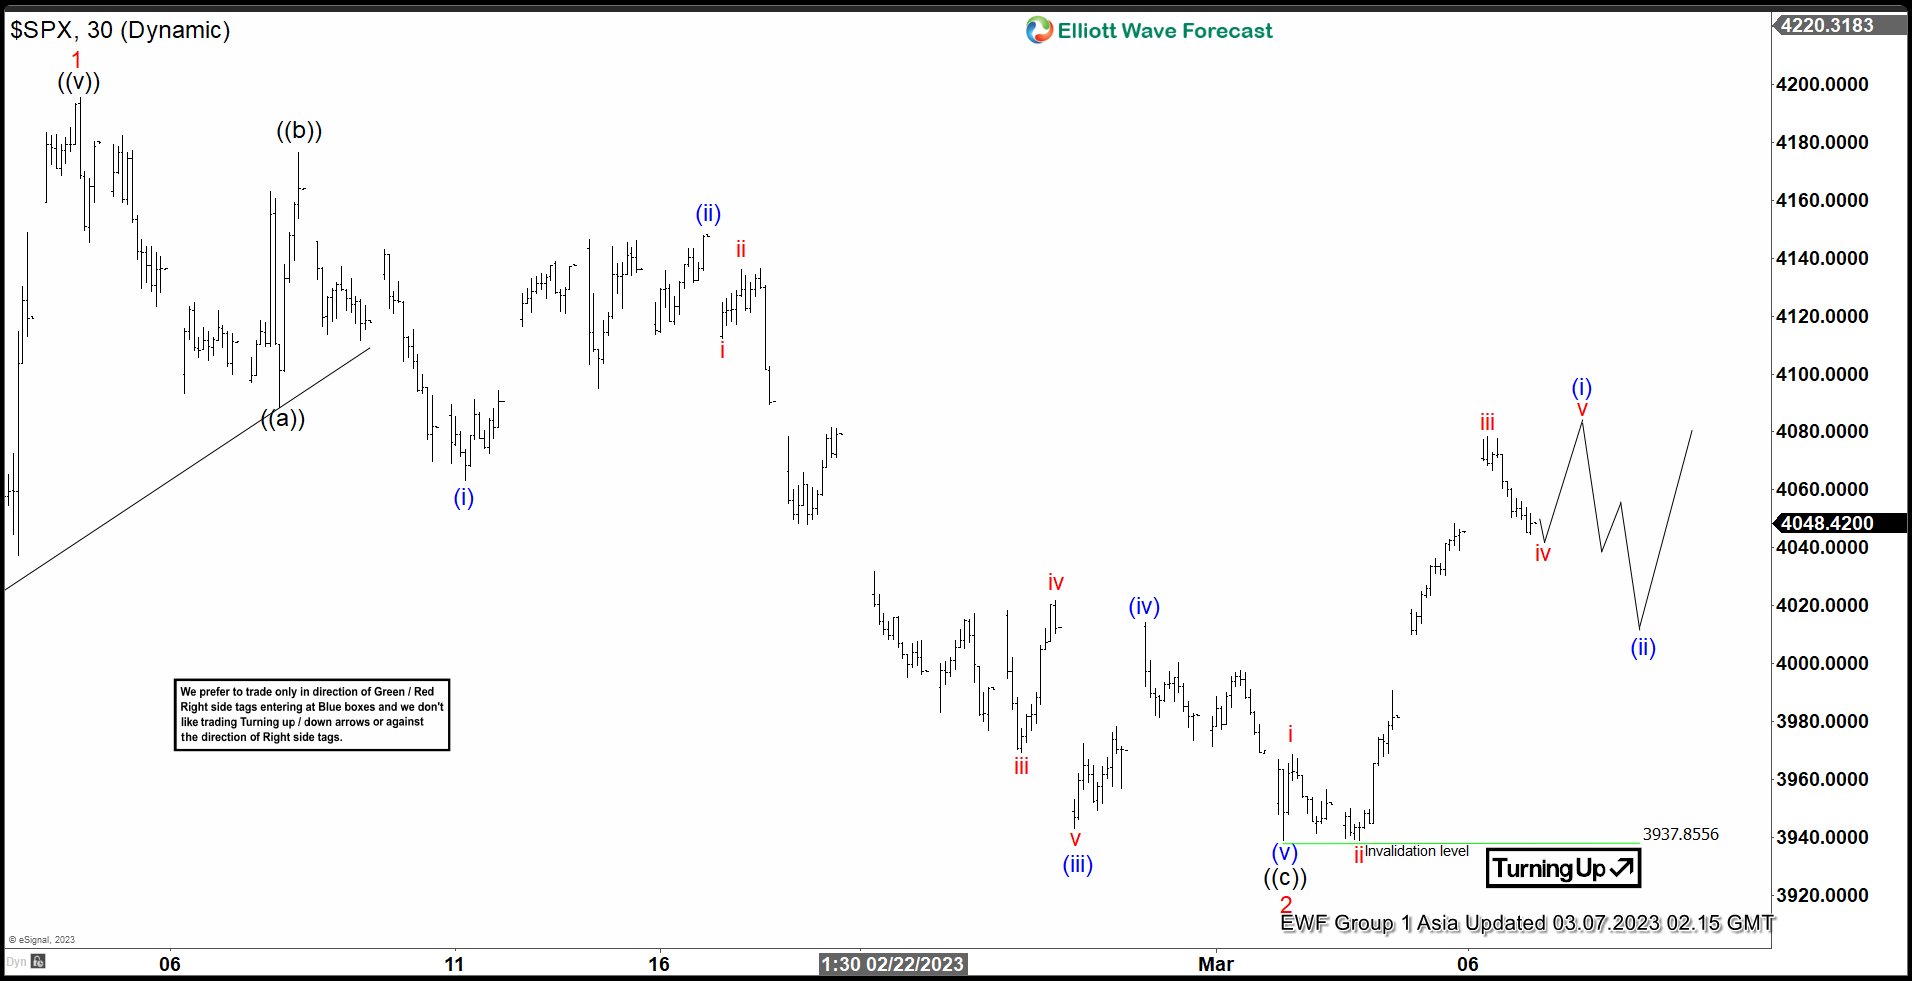
Rally from 10.13.2022 low in SPX is in progress as a nesting impulse. Up from 10.13.2022 low, wave (1) ended at 4100.51 and dips in wave (2) ended at 3764.49. The Index has resumed higher in wave (3) with subdivision as another impulse in lesser degree. Up from wave (2), wave 1 ended at 4195.44 and pullback in wave 2 ended at 3937.85. The 30 minutes chart below shows the pullback in wave 2. Internal subdivision of wave 2 unfolded as a zigzag Elliott Wave structure. Down from wave 1, wave ((a)) ended at where wave ((a)) ended at 4088.39 and wave ((b)) rally ended at 4176.54.
Wave ((c)) lower ended at 3937.85 with internal subdivision as a 5 waves. Down from wave ((b)), wave (i) ended at 4063.18 and rally in wave (ii) ended at 4148.11. Wave (iii) lower ended at 3943.08, rally in wave (iv) ended at 4014.13, and final leg wave (v) ended at 3937.85. This completed wave ((c)) of 2 in higher degree. The Index has turned higher now in wave 3 of (3). Near term, as far as pivot at 3937.85 low stays intact, expect dips to find support in 3, 7, or 11 swing for further upside.
SPX 30 Minutes Hour Elliott Wave Chart
https://www.youtube.com/watch?v=LIwRaYGTksw
AUD/CAD and AUD/NZD near downside breakout after RBA
Australian Dollar weakened broadly despite RBA's rate hike. This is attributed to the less hawkish statement by RBA indicating a "lower risk of a cycle in which prices and wages chase one another".
As AUD/CAD nears a breakthrough of 0.9099 temporary low, a deeper decline is expected as long as 0.9214 resistance holds. The next target for the fall from 0.9545 is 61.8% retracement of 0.8596 to 0.9545 at 0.8959. Bullish convergence conditions in 4 hour MACD suggest that stronger support may be seen there to bring a rebound.
Likewise, AUD/NZD is poised to break through 1.0794, with the decline from 1.1085 targeting the 1.0735 support or further to the 61.8% retracement of 1.0469 to 1.1085 at 1.0704. Sustained break there could pave the way to retest 1.0469 low. The near-term outlook will remain bearish as long as the 1.0890 resistance holds.
RBA hikes 25bps, notes lower risk of prices-wages spiral
RBA raised the cash rate target by 25bps to 3.60%, which was widely anticipated. The bank also signaled the need for further tightening of monetary policy. Nevertheless, there was a notable dovish twist in the the statement about a lower risk of prices-wages spiral.
The central bank said monthly CPI indicator suggested that "inflation has peaked in Australia". The central forecasts is for inflation to decline this year and next to around 3% in mid-2025. Medium-term inflation expectations remain "well anchored".
Growth over the next couple of years is expected to be "below trend". Labor markets remains "very tight, although conditions have eased a little". Wage growth is "still consistent with the inflation target" and "recent data suggest a lower risk of a cycle in which prices and wages chase one another".
It indicated that "further tightening of monetary policy will be needed". The timing and extent of further interest rate hikes will depend on "developments in the global economy, trends in household spending and the outlook for inflation and the labour market".
(RBA) Statement by Philip Lowe, Governor: Monetary Policy Decision
At its meeting today, the Board decided to increase the cash rate target by 25 basis points to 3.60 per cent. It also increased the interest rate on Exchange Settlement balances by 25 basis points to 3.50 per cent.
Global inflation remains very high. In headline terms it is moderating, although services price inflation remains elevated in many economies. It will be some time before inflation is back to target rates. The outlook for the global economy remains subdued, with below average growth expected this year and next.
The monthly CPI indicator suggests that inflation has peaked in Australia. Goods price inflation is expected to moderate over the months ahead due to both global developments and softer demand in Australia. Services price inflation remains high, with strong demand for some services over the summer. Rents are increasing at the fastest rate in some years, with vacancy rates low in many parts of the country. The central forecast is for inflation to decline this year and next, to be around 3 per cent in mid-2025. Medium-term inflation expectations remain well anchored, and it is important that this remains the case.
Growth in the Australian economy has slowed, with GDP increasing by 0.5 per cent in the December quarter and 2.7 per cent over the year. Growth over the next couple of years is expected to be below trend. Household consumption growth has slowed due to the tighter financial conditions and the outlook for housing construction has softened. In contrast, the outlook for business investment remains positive, with many businesses operating at a very high level of capacity utilisation.
The labour market remains very tight, although conditions have eased a little. The unemployment rate remains at close to a 50-year low. Employment fell in January, but this partly reflects changing seasonal patterns in labour hiring. Many firms continue to experience difficulty hiring workers, although some report a recent easing in labour shortages. As economic growth slows, unemployment is expected to increase.
Wages growth is continuing to pick up in response to the tight labour market and higher inflation. At the aggregate level, wages growth is still consistent with the inflation target and recent data suggest a lower risk of a cycle in which prices and wages chase one another. The Board, however, remains alert to the risk of a prices-wages spiral, given the limited spare capacity in the economy and the historically low rate of unemployment. Accordingly, it will continue to pay close attention to both the evolution of labour costs and the price-setting behaviour of firms.
The Board recognises that monetary policy operates with a lag and that the full effect of the cumulative increase in interest rates is yet to be felt in mortgage payments. There is uncertainty around the timing and extent of the slowdown in household spending. Some households have substantial savings buffers, but others are experiencing a painful squeeze on their budgets due to higher interest rates and the increase in the cost of living. Household balance sheets are also being affected by the decline in housing prices. Another source of uncertainty is how the global economy responds to the large and rapid increase in interest rates around the world. These uncertainties mean that there are a range of potential scenarios for the Australian economy.
The Board's priority is to return inflation to target. High inflation makes life difficult for people and damages the functioning of the economy. And if high inflation were to become entrenched in people's expectations, it would be very costly to reduce later, involving even higher interest rates and a larger rise in unemployment. The Board is seeking to return inflation to the 2–3 per cent target range while keeping the economy on an even keel, but the path to achieving a soft landing remains a narrow one.
The Board expects that further tightening of monetary policy will be needed to ensure that inflation returns to target and that this period of high inflation is only temporary. In assessing when and how much further interest rates need to increase, the Board will be paying close attention to developments in the global economy, trends in household spending and the outlook for inflation and the labour market. The Board remains resolute in its determination to return inflation to target and will do what is necessary to achieve that.
GBP/USD Aims Recovery Above 1.2100, Oil Price Rallies
Key Highlights
- GBP/USD is attempting a recovery wave above the 1.2000 resistance zone.
- A major bearish trend line is forming with resistance near 1.2060 on the 4-hours chart.
- EUR/USD recovered above the 1.0680 resistance zone.
- Crude oil price rallied above the $80.00 resistance zone.
GBP/USD Technical Analysis
The British Pound remained well bid above the 1.1920 zone against the US Dollar. GBP/USD formed a base and recently started an upside correction above 1.1980.
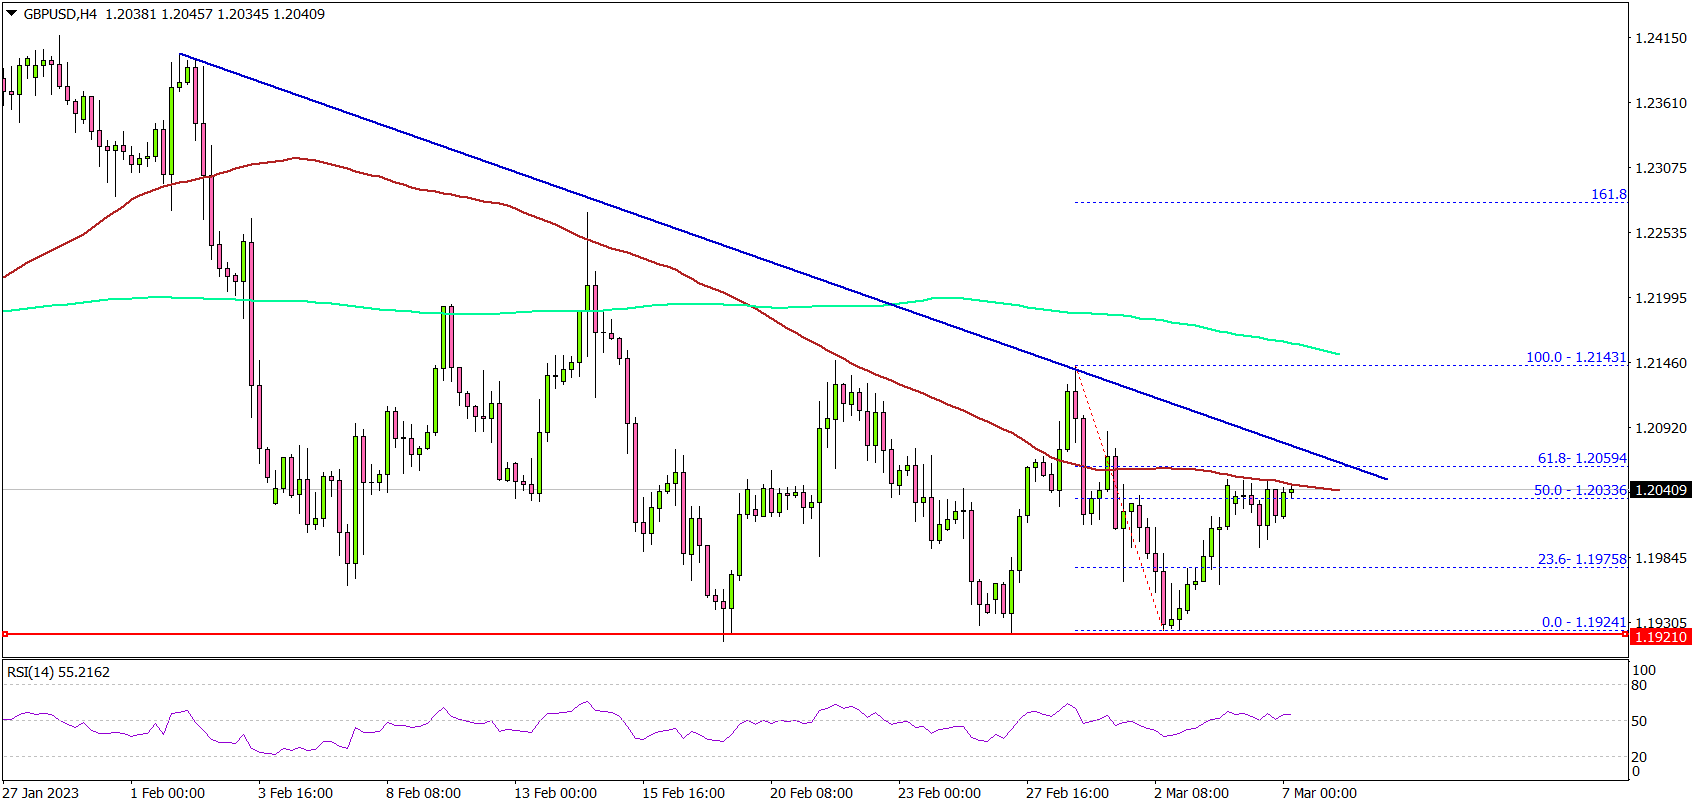
Looking at the 4-hours chart, the pair was able to clear the 1.2000 resistance zone. The pair is now testing the 50% Fib retracement level of the downward move from the 1.2143 swing high to 1.1924 low.
The 100 simple moving average (red, 4-hours) is also acting as a resistance near 1.2040. The next major resistance is near the 1.2060 level. There is also a major bearish trend line forming with resistance near 1.2060 on the same chart.
A clear move above the 1.2060 resistance might start a steady increase towards the 1.2120 zone. Any more gains might send the pair towards 1.2180.
On the downside, an immediate support is near the 1.2000 level. The next major support is near the 1.1975 level, below which there is a risk of a move towards the 1.1925 level. Any more losses could open the doors for a drop towards 1.1840.
Looking at crude oil price, there was a strong upward move and the price was able to clear the $80.00 resistance zone.
Economic Releases
- UK Halifax House Price Index for Feb 2023 (MoM) - Forecast +0.4%, versus 0% previous.
- UK Halifax House Price Index for Feb 2023 (3m/YoY) - Forecast +2%, versus +1.9% previous.