

Sample Category Title
Gold Price Recovery Could Face Hurdles, PMI’s Next
Key Highlights
- Gold price started an upside correction from the $1,805 zone.
- It broke a major bearish trend line with resistance near $1,815 on the 4-hours chart.
- EUR/USD and GBP/USD started a decent recovery wave.
- The US ISM Manufacturing Index could increase from 47.4 to 48.0 in Feb 2023.
Gold Price Technical Analysis
Gold price gained bearish momentum after it broke the $1,840 support against the US Dollar. The price traded close to the $1,800 level before the bulls appeared.
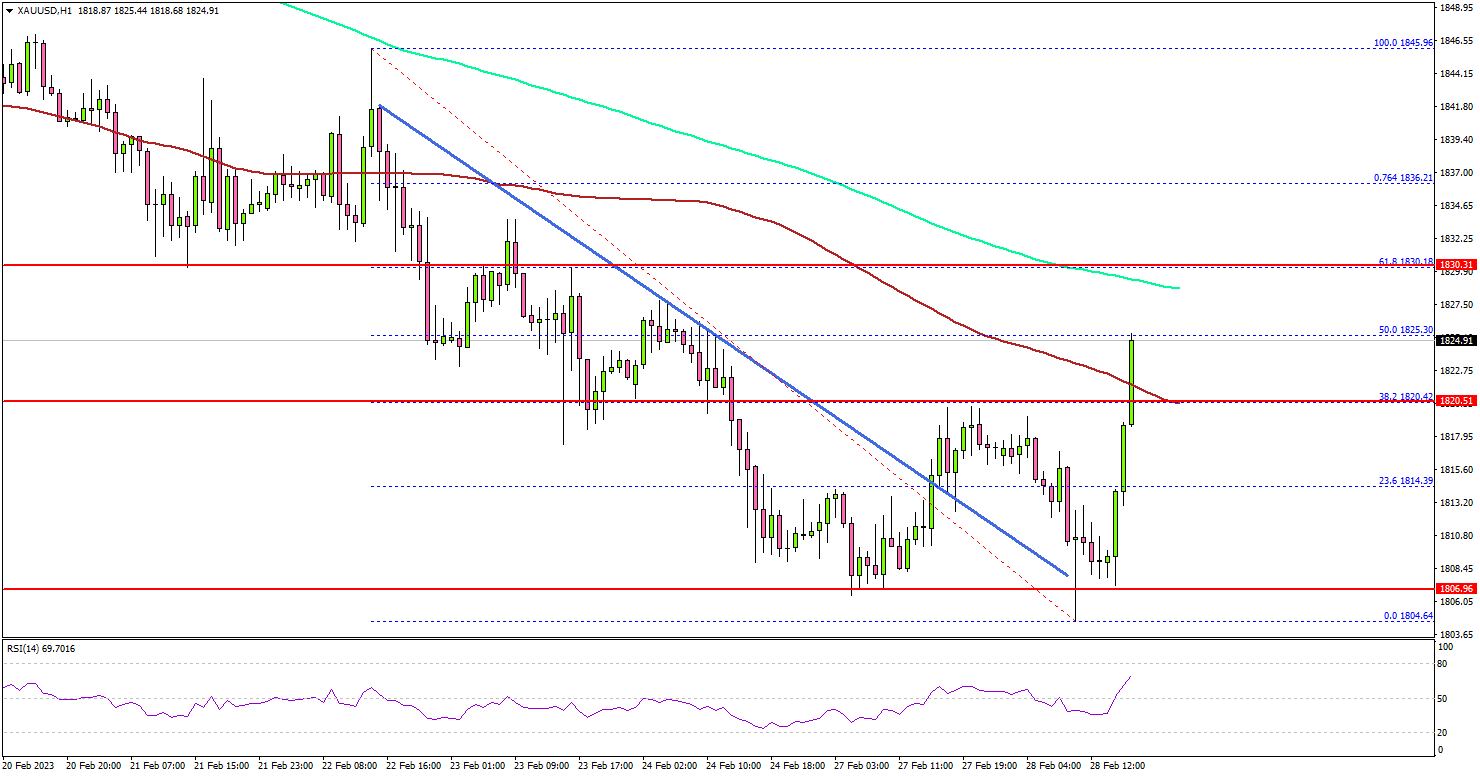
The 4-hours chart of XAU/USD indicates that the price traded as low as $1,804. It settled below the 100 simple moving average (red, 4-hours) and the 200 simple moving average (green, 4-hours).
Recently, there was an upside correction above the $1,815 level. The price broke a major bearish trend line with resistance near $1,815 on the 4-hours chart. There was a test of the 50% Fib retracement level of the downward move from the $1,845 swing high to $1,804 low.
The price is now facing resistance near the $1,830 level and the 200 simple moving average (green, 4-hours). The main resistance is near the $1,845 zone and the, above which the price might gain bullish momentum.
On the downside, an initial support is near the $1,815 level. The next major support is near the $1,805 level, below which gold price might struggle to stay above the $1,800 zone. In the stated case, gold price could slide towards the $1,780 support.
Looking at EUR/USD, the pair started a recovery wave from the 1.0535 zone and might rise further towards the 1.0680 resistance.
Economic Releases to Watch Today
- Germany’s Manufacturing PMI for Feb 2023 - Forecast 46.5, versus 46.5 previous.
- Euro Zone Manufacturing PMI for Feb 2023 – Forecast 48.5, versus 48.5 previous.
- UK Manufacturing PMI for Feb 2023 – Forecast 49.2, versus 49.2 previous.
- US ISM Manufacturing Index for Feb 2023 – Forecast 48.0, versus 47.4 previous.
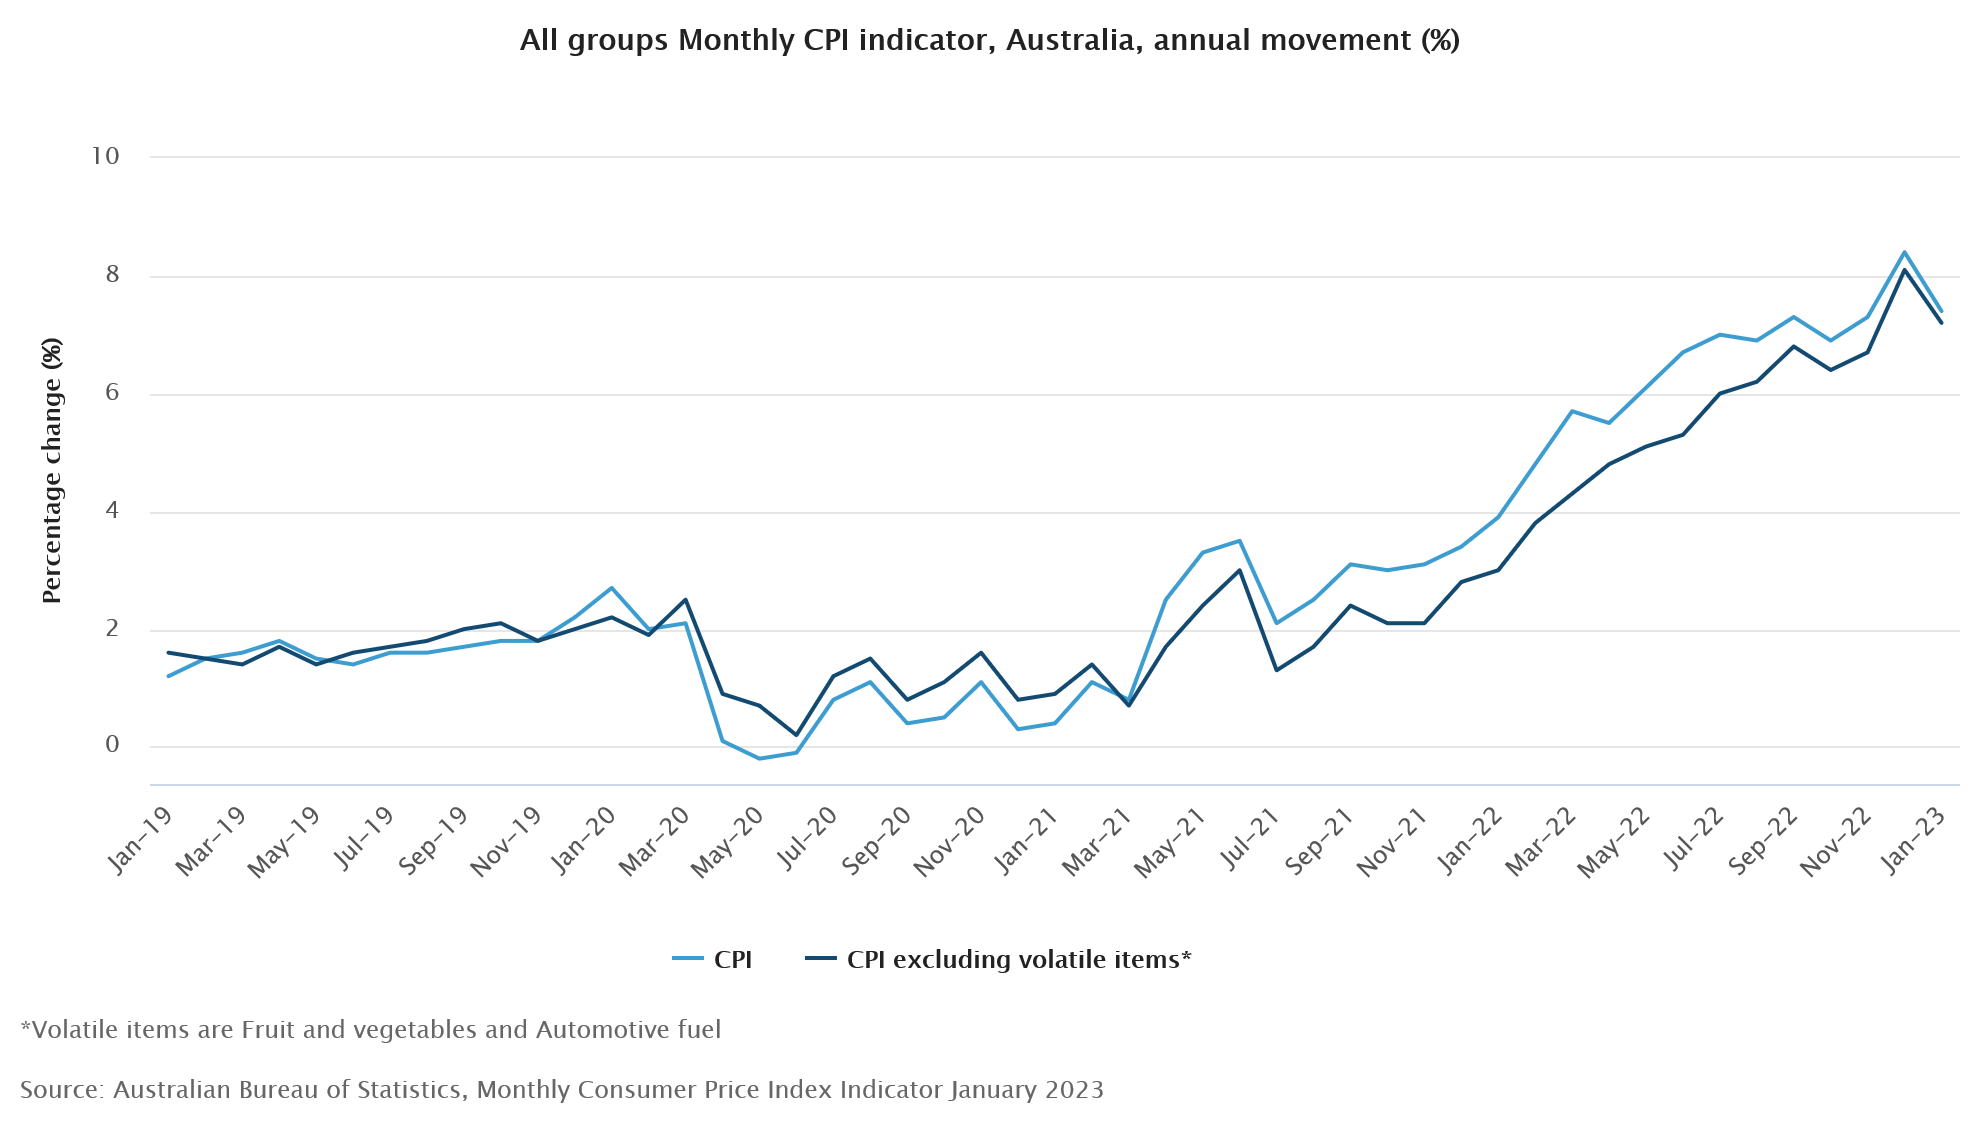
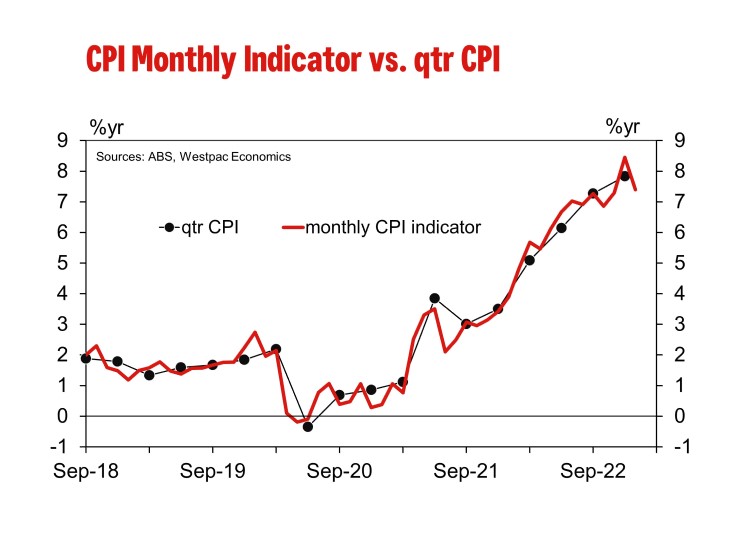
Australia CPI slowed to 7.4% yoy in Jan, ex-volatile items down to 7.2% yoy
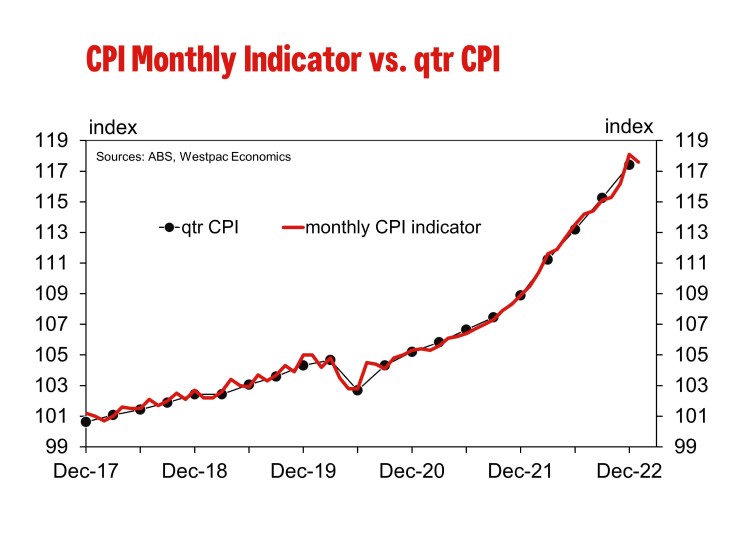
Australia monthly CPI indicator slowed from 8.4% yoy to 7.4% yoy in January, below expectation of 8.1% yoy. CPI excluding volatile items (i.e. excludes Fruit and vegetables and Automotive fuel) slowed from 8.1% yoy to 7.2% yoy.
The most significant contributors to the annual increase in the January monthly CPI indicator were Housing (9.8%), Food and non-alcoholic beverages (8.2%) and recreation and culture (10.2%).
Australia GDP grew 0.5% qoq in Q4, domestic prices grew fastest since 1990
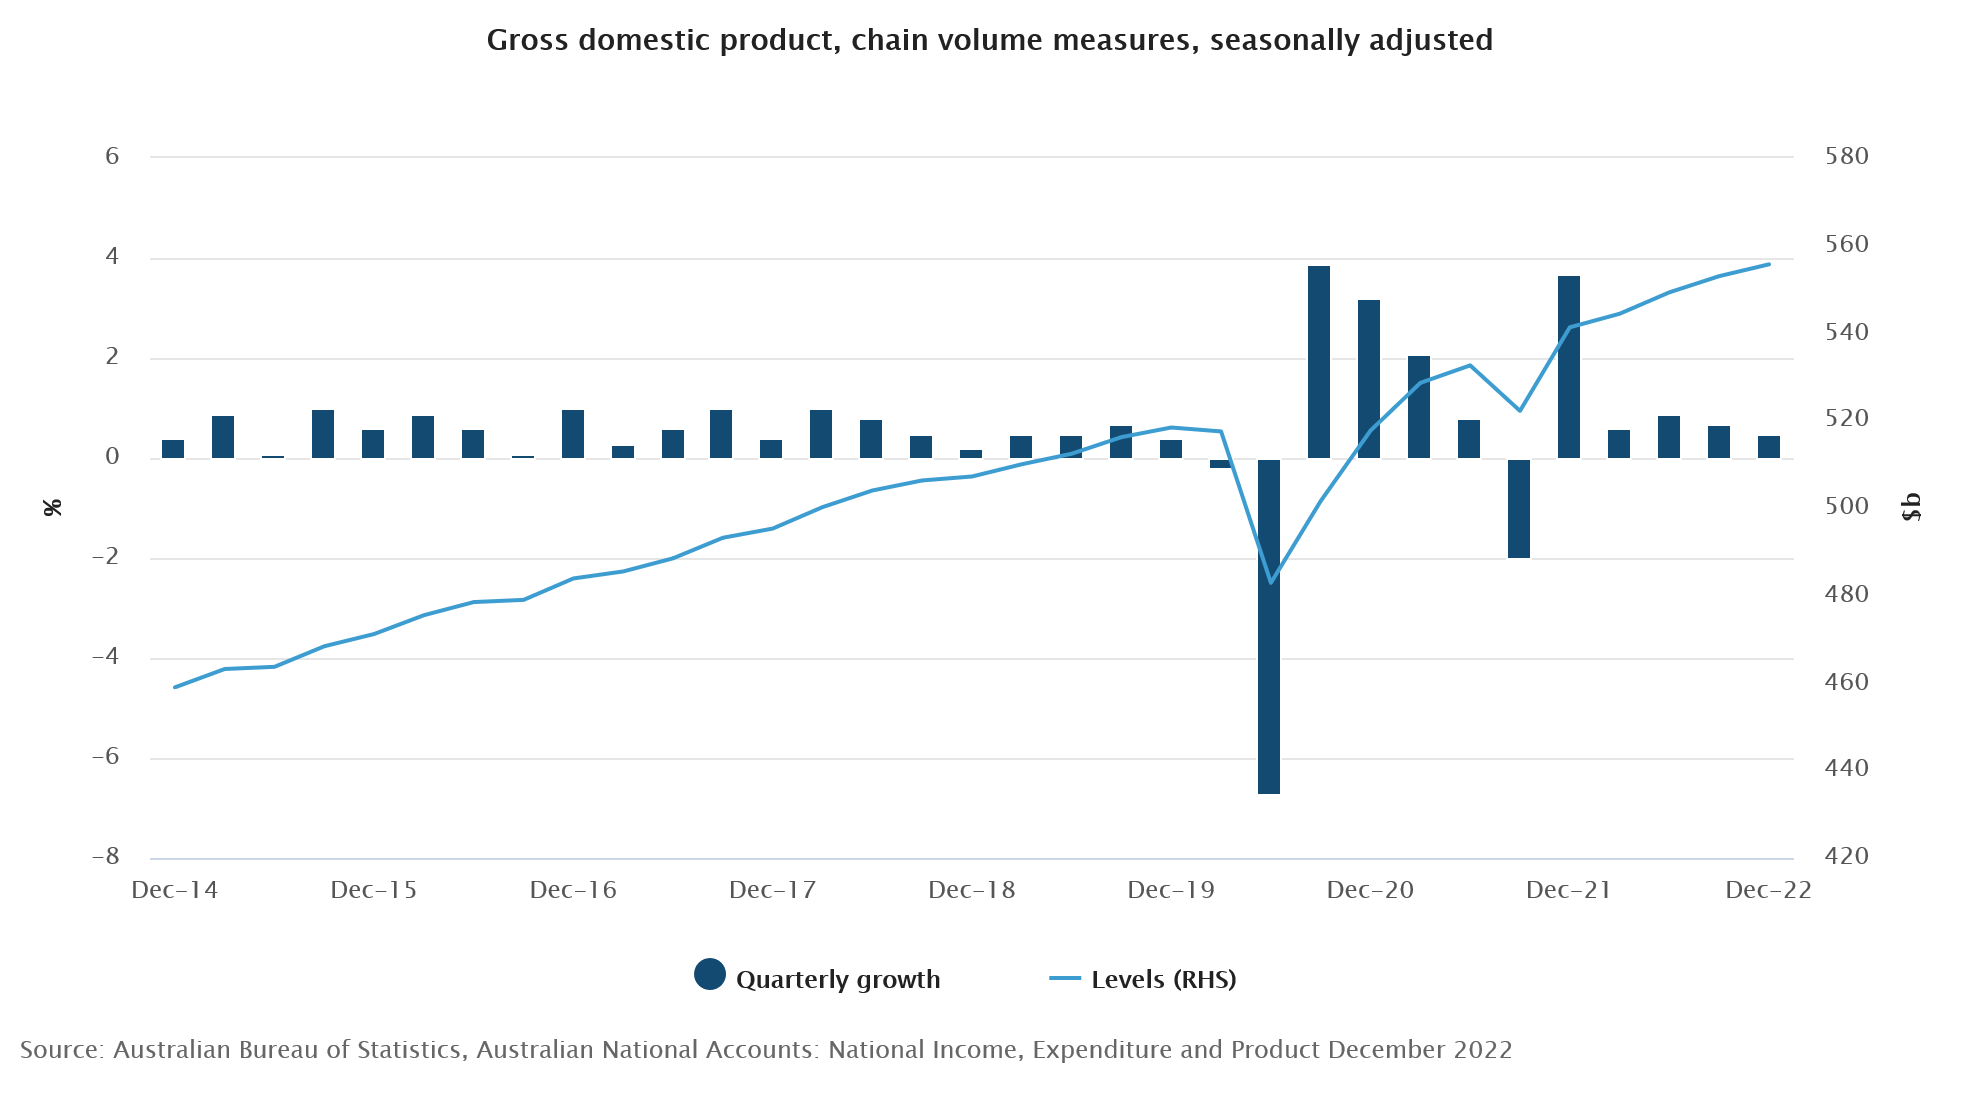
Australia GDP grew 0.5% qoq in Q4, below expectation of 0.8% qoq. Through the year, GDP grew 2.7% yoy. GDP Implicit price deflator (IPD) rose 1.6% qoq and 9.1% yoy. Domestic prices grew 1.4% qoq and 6.6 yoy, highest annual growth since 1990.
Katherine Keenan, ABS head of National Accounts, said, "the 0.4 per cent rise in total consumption and 1.1 per cent rise in exports were the primary contributors to GDP growth in the December quarter...
"Continued growth in household and government spending drove the rise in consumption, while increased exports of travel services and continued overseas demand for coal and mineral ores drove exports."
Australia Monthly CPI – Softer than Expected as Holiday Travel Prices Pull Back
January surprised to the downside with some sign the inflationary pulse may be starting to ease.
The Monthly CPI Indicator rose 7.4% in the year to January compared to Westpac’s 7.9%yr forecast and the market’s 8.0%yr.
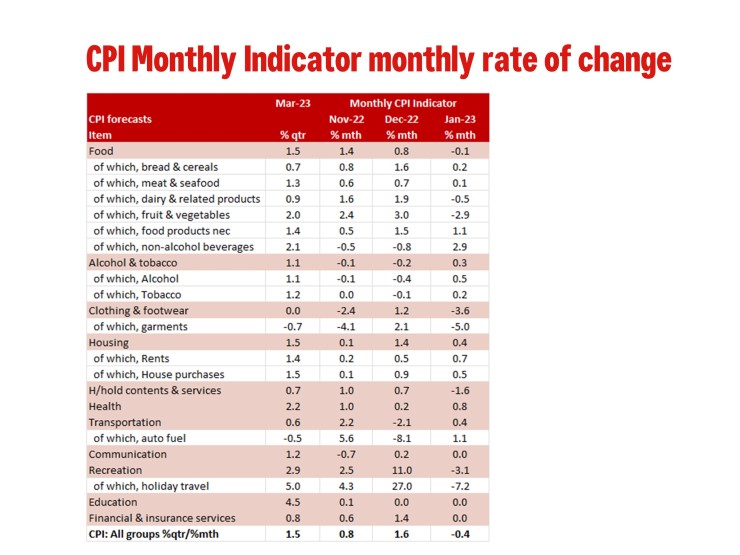
Diving into the detail this was the index fell 0.4% in January compared to 0.1% rise forecast by Westpac; we assume the market median would have been around 0.2% given the 8.0%yr forecast. This is a moderation from the 3.0% rise in December, 2.4% increase in November and a 6.3% decline in October. The Monthly CPI Indicator can be very volatile month to month as it is not a true monthly price index but rather the released of data for the quarterly CPI as it becomes available hence it can be very volatile month to month depending on the timing of the price surveys. This may be way the ABS only reference the annual pace of growth.
The most significant contributions to the annual rise in January were: housing (+9.8%yr), food & non-alcoholic beverages (+8.2%yr) and recreation a& culture (+10.2%yr).
The ABS noted that the annual increase for the housing group in January was lower than December (+10.1%yr) due to a moderation in new dwellings and rents. In monthly terms, both dwelling (+0.5%) and rents (+0.7%) rose in January. However, rents are now growing more strongly than they were a year ago while the increases in dwelling prices are moderating.
Food & non-alcoholic beverages rose 8.2%yr in January, a moderation from the 9.5%yr increase in December. The ABE noted that in the month most food & non-alcoholic beverages prices rose. The main exception was fruit & vegetables which fell 2.3%.
As we expected there was a moderation in price inflation for recreation & cultural with holiday travel & accommodation rising 17.8%yr to January, a moderation from the 29.3%yr pace to December. In January holiday travel & accommodation prices fell 7.2% following a 29.3% increase in December.
Outside of the above contributions to the monthly increase in January worth noting is the 3.6% fall in clothing & footwear on the back of a 5% fall in garments; a 1.1% rise in auto fuel prices and a very modest 0.2% rise in tobacco. Please refer to the included table for a further breakdown on the Monthly CPI indicator and its comparison to our current CPI forecast for Q1.
The ABE no longer publishes an estimation of a Trimmed Mean CPI Indicator as the variation in the timing of price surveys resulted in a meaningful different result from Monthly Trimmed Mean compared to the quarterly Trimmed Mean.
We are processing the Monthly CPI Indicator data to incorporate it into a complete Q1 CPI preview. Our current published inflation forecast for Q1 are 1.5%qtr/7.2%yr for the CPI and 1.3%qtr/6.6%yr for the Trimmed Mean.
First Impressions: Australian Q4 GDP
Australia’s economy expanded by a modest 0.5%, which was softer than anticipated. Conditions were soft in late 2022, with the adverse impacts of high inflation and sharply higher interest rates becoming apparent. Consumer spending grew by only 0.3%, while total domestic demand stalled. .
The Australian economy expanded by a modest 0.5% in the December quarter.
That was softer than anticipated, Westpac 0.8% and market median 0.8%, range (0.4% to 1.0%).
Annual growth is 2.7%. The level of activity is 7.2% above levels prior to the pandemic, at the end of 2019. Note, that Q3 GDP growth was revised up a fraction, to a gain of 0.7% from 0.6%.
Key surprise: The consumer was the key surprise, with only a tepid 0.3% rise in overall spending. Services were the key disappointment, with only a modest rise. Also, income growth was weaker than anticipated and the decline in the household saving ratio was more pronounced.
While nominal gross household income grew by 1.6%, real household disposable income contracted by a hefty -2.2%.
Hours worked: The National Accounts estimate that hours worked expanded by 2%, eclipsing the Labour Force survey estimate of 1.4%, after a rise of 0.5% in Q3 (a result held back by covid related elevated absenteeism). Over the year, hours worked grew by 6.5%.
Consumer spending grew by only 0.3% in the quarter, well short of our expectation, a plus 0.8%.
The ABS report that growth in discretionary spending (+0.4%) slowed to be more in line with essential spending (+0.3%).
The ABS add, discretionary spending was led by hotels, cafes and restaurants (+1.6%) and transport services (+5.7%), reflecting residual post-lockdown demand. Spending in these categories slowed following four consecutive quarters of strong demand.
Other discretionary spending on recreation and culture (-1.4%), clothing and footwear (-2.7%), and furnishings and household equipment (-1.2%) fell as cost-of-living pressures began to weigh on household budgets.
The household saving ratio moved lower still, down from 7.1% to 4.5%, a reading below the “equilibrium”, judged to be around 6%. This ends a period of excess savings, which has been a feature during the pandemic.
Expenditure detail:
Domestic demand stalled in the December quarter, the weakest result outside of a lockdown period since June 2014. This indicates that the economy hit a soft spot at the end of 2022.
Net exports added a hefty 1.1ppts, on a lift in services led 1.1% rise in exports and a pull-back in imports, (-4.3%), albeit they still rose strongly over the year (+12.1%).
Total inventories subtracted -0.5ppts from activity on a correction of non-farm business inventories after a Q3 run-up centred on some one-offs.
Home building activity declined, down by -0.9%,, with a further pull-back in renovations work, -4.2%, more than offsetting a lift in new home building work, +1.4%.
The real estate sector – in the form of Ownership Transfer Costs (turnover in the property sector) - fell a further -6.2% after the -11.2% plunge in Q3 as rapid interest rate rises bite.
Business investment contracted, declining by -0.8%, led lower by a fall in construction work, as well a dip in equipment spending, -0.2%.
Public demand is cresting at a high level, up only 0.2% in both Q3 and Q4, following a -0.5% for Q2. This follows rapid growth up to the March quarter 2022, boosted by the response to the pandemic.
FOMC Will Stay Hawkish as Inflation Remains High
Last year, the US inflation rate was at a 40-year peak while posting the lowest unemployment rate in several decades. The FOMC board has conversely tackled the inflation rates by adopting hawkish policies and increasing interest rates. Today's analysis will examine how the Dollar performs ahead of the ISM Manufacturing PMI release.
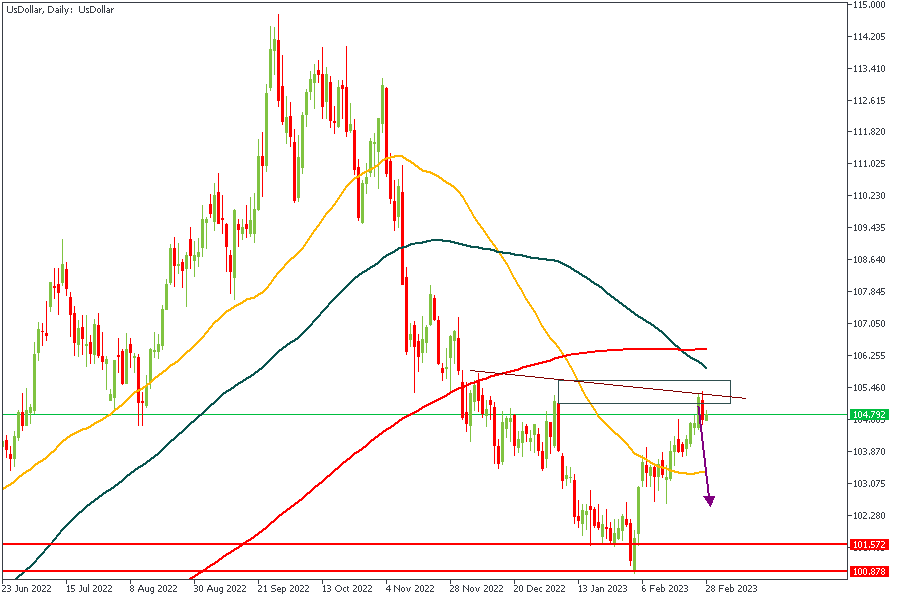
US Dollar - DXY
Here on the daily timeframe of the DXY, the price can be seen already reacting to the rally-base-drop supply zone. The 88% of the Fibonacci retracement and the 100-Day moving average were an added confluence for the bearish sentiment. Based on this analysis, we can expect bullish price action from the XXX-USD pairs.
USDCAD
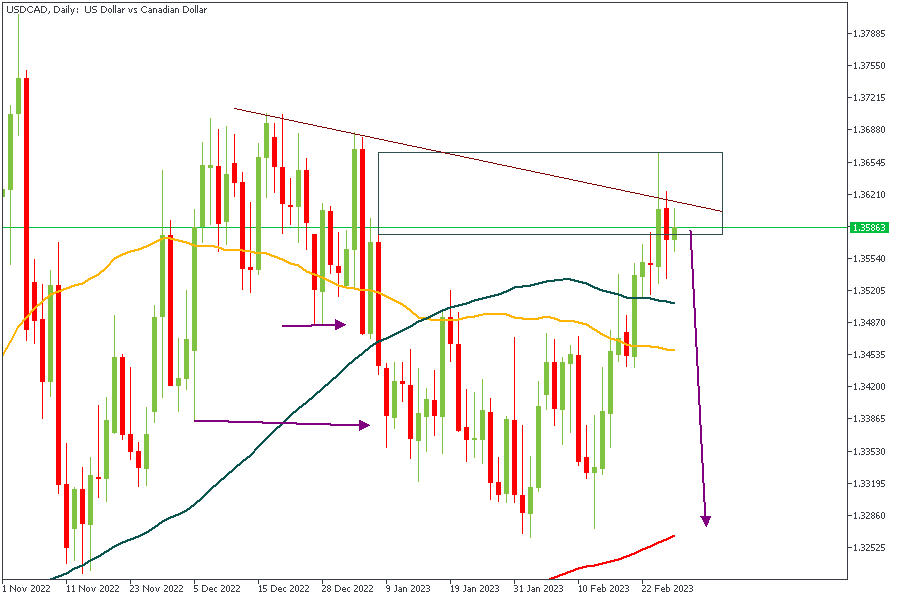
USDCAD has bumped into the supply zone following the bearish structure break at the highlighted horizontal arrows. The 50-Day moving average locates below the 100-Day moving average, indicating a bearish sentiment. The trendline resistance is the third signal for a bearish price movement.
Analysts’ Expectations:
- Direction: Bearish
- Target: 1.32800
- Invalidation: 1.36400
USDJPY
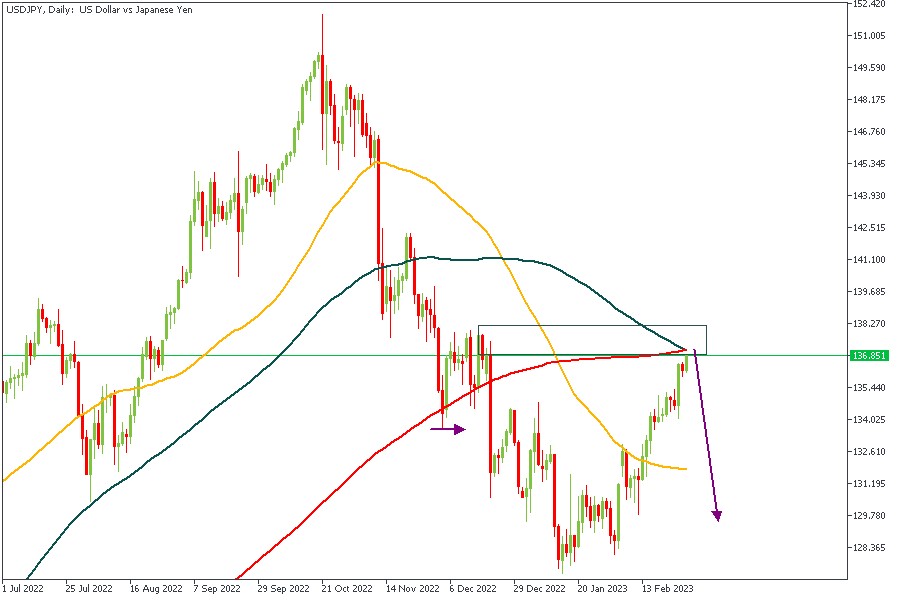
We can see price stalling near the rally-base-drop supply zone in line with the bias formed from the DXY chart. There is also a confluence of factors that indicate a possible bearish sentiment, including the crossing of the 100 and 200 Day moving averages, the 88% Fibonacci retracement level, and the resistance from the two moving averages.
Analysts’ Expectations:
- Direction: Bearish
- Target: 130
- Invalidation: 138.2
USDCHF
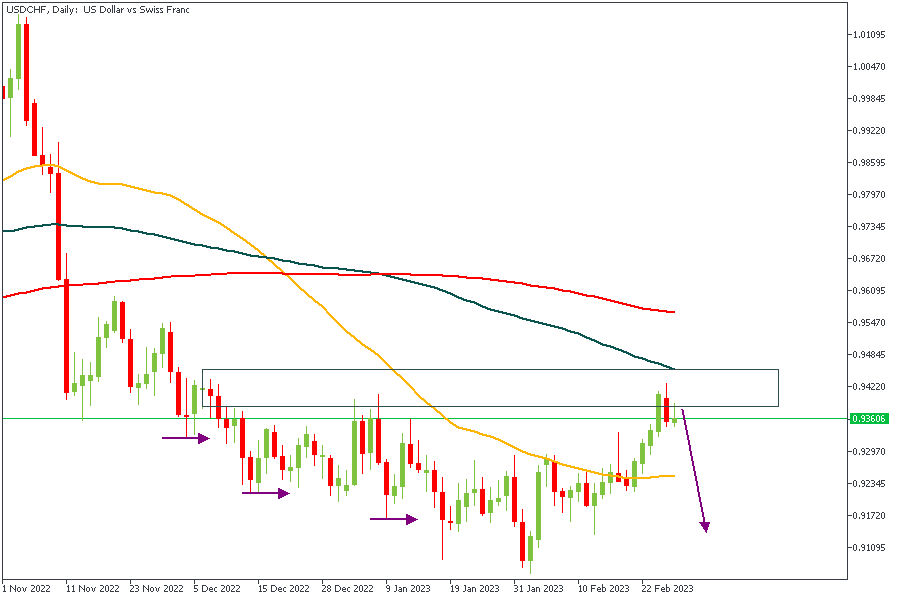
As I noticed above, a weakness in DXY will lead to a bearish reaction on charts of currency pairs with the USD as its Base currency. From a technical standpoint, based on the Daily timeframe of USDCHF, I expect to see some bearish movement based on the confluence of the rally-base-drop supply zone, the 100-Day moving average resistance, and the 88% Fibonacci retracement.
Analysts’ Expectations:
- Direction: Bearish
- Target: 0.91100
- Invalidation: 0.94845
CONCLUSION
The trading of CFDs comes at a risk. Thus, to succeed, you have to manage risks properly. To avoid costly mistakes while you look to trade these opportunities, be sure to do your due diligence and manage your risk appropriately.
NZDCHF Wave Analysis
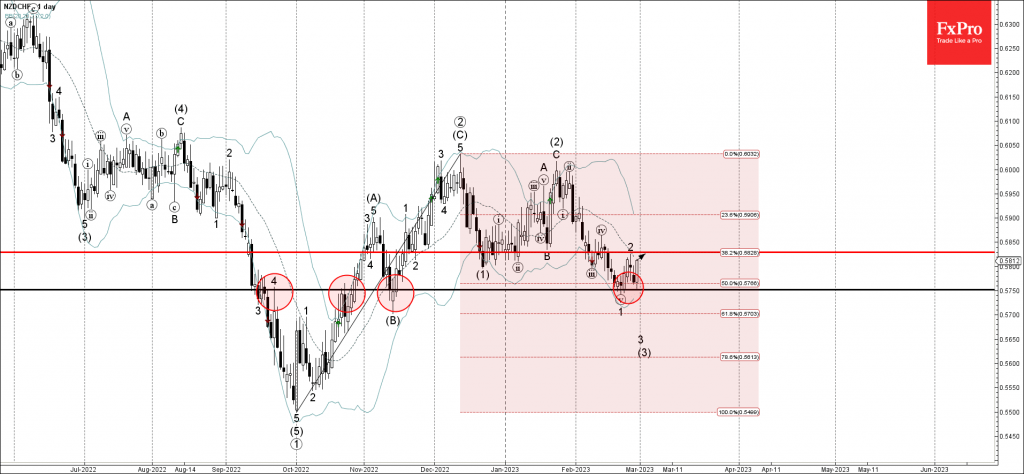
- NZDCHF reversed from support level 0.5750
- Likely to rise to resistance level 0.5830
NZDCHF recently reversed up from the key support level 0.5750 (former resistance from September, which also stopped the previous minor impulse wave 1).
The support level 0.5750 coincided with the 50% Fibonacci correction of the previous upward ABC correction from the start of October.
NZDCHF can be expected to rise further toward the next resistance level 0.5830 (top of the previous wave 2).
AUDCHF Wave Analysis
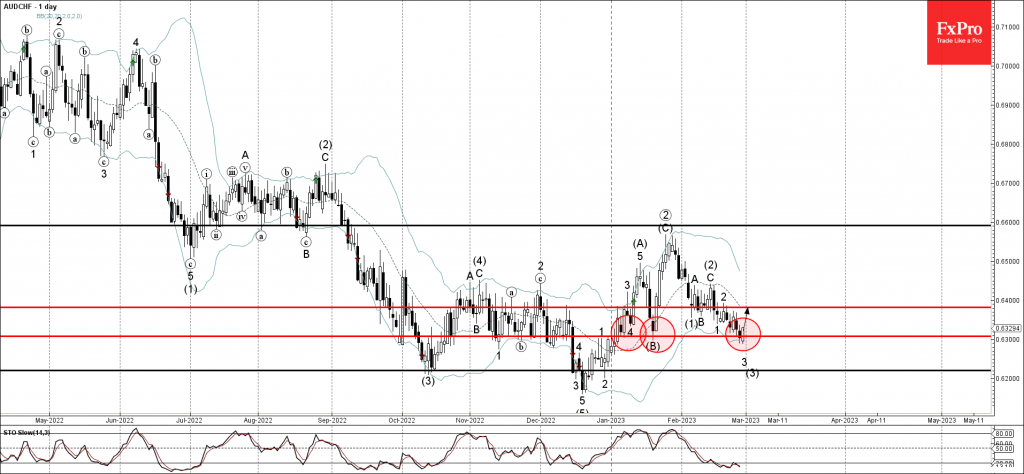
- AUDCHF reversed from support level 0.6300
- Likely to rise to resistance level 0.6380
AUDCHF recently reversed up from the key support level 0.6300 (which has been reversing the price from the end of December).
The upward reversal from the support level 0.6300 is likely to form the daily Bullish Engulfing – which will mark the end of the previous minor impulse wave 3.
Given the oversold daily Stochastic, AUDCHF can be expected to rise further toward the next resistance level 0.6380 (top of the previous minor correction 2).
BoE Mann: No automatic relationship between recessions and bringing inflation down
BoE MPC member Catherine Mann said, "falling natural gas and electricity costs "might be good from the standpoint of making households feel more comfortable."
But, "on the other hand, what they aren't going to spend on energy, they're going to spend on something else... That translates something that I do not control, which is external energy prices, into something that looks a whole lot more like what I'm supposed to control, which is domestically generated inflation."
"A recession is a particularly dramatic way of disciplining the pricing structure of firms, but it's not the only way," Mann said. "I would like to see more on the supply side in order to give us a faster speed limit to work with as a central bank. It's not like there's an automatic relationship between recessions and bringing inflation down."