Sample Category Title
EUR/USD Daily Outlook
Daily Pivots: (S1) 1.0552; (P) 1.0598; (R1) 1.0623; More...
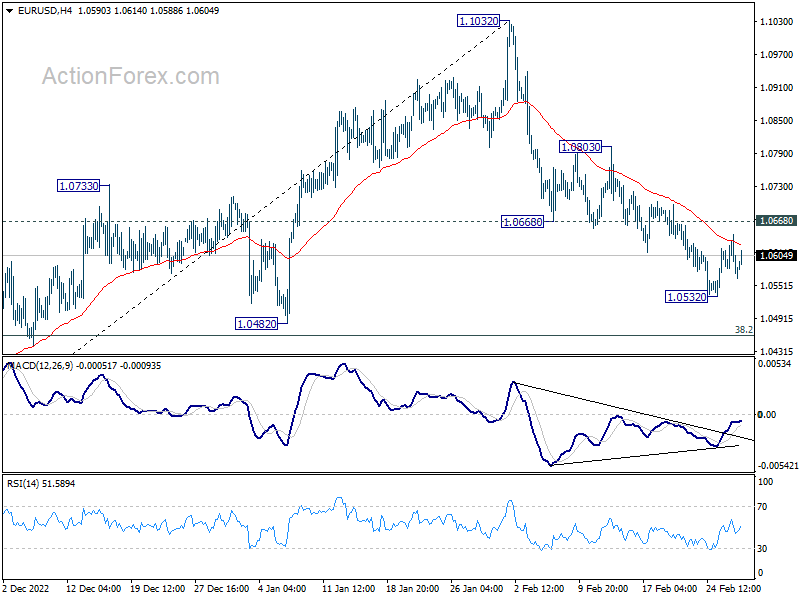
Intraday bias in EUR/USD remains neutral as range trading continues above 1.0532 temporary low. The decline from 1.1032 might still extend lower, but strong support could be seen around 38.2% retracement of 0.9534 to 1.1032 at 1.0463 to bring rebound, at least on first attempt. Break of 1.0668 support turned resistance will turn bias back to the upside for 1.0803 resistance and above. However, sustained break of 1.0463 will carry larger bearish implications.
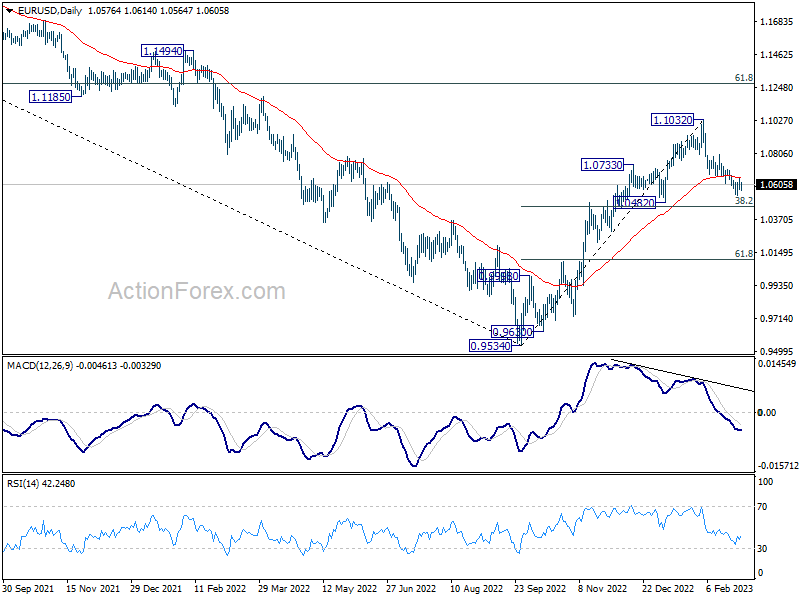
In the bigger picture, as long as 1.0482 support holds, rise from 0.9534 (2022 low) should continue to 61.8% retracement of 1.2348 (2021 high) to 0.9534 at 1.1273. However, sustained break of 1.0482 will bring deeper fall to 61.8% retracement of 0.9534 to 1.1032 at 1.0106, even as a corrective pull back.
GBP/USD Daily Outlook
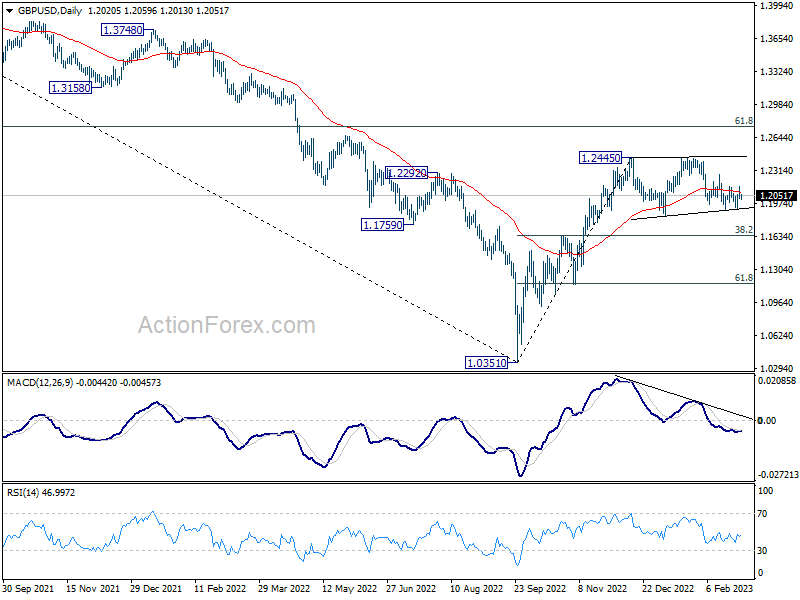
Daily Pivots: (S1) 1.1980; (P) 1.2061; (R1) 1.2106; More...
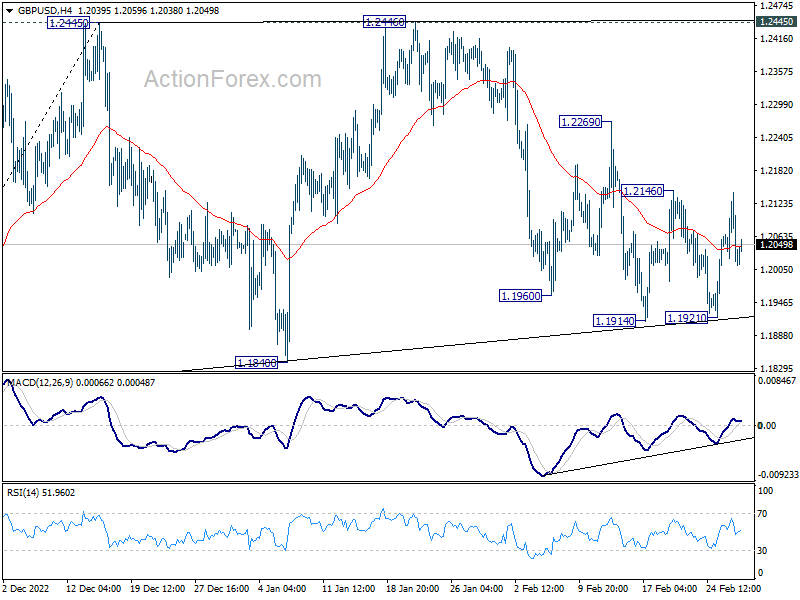
Range trading continues in GBP/USD and intraday bias remains neutral. On the downside, break of 1.1914 will resume the decline from 1.2446 for 1.1840 support and possibly below. On the upside, break of 1.2146 resistance will turn bias back to the upside for further rebound to 1.2269 and above.
In the bigger picture,as long as 1.1840 support holds, rise from 1.0351 medium term bottom (2022 low) should still continue to 61.8% retracement of 1.4248 (2021 high) to 1.0351 at 1.2759. However, decisive break of 1.1840 will complete a double top pattern (1.2445, 1.2446) after rejection by 55 week EMA (now at 1.2251). Deeper decline should be seen back to 38.2% retracement of 1.0351 to 1.2445 at 1.1645.
USD/CHF Daily Outlook
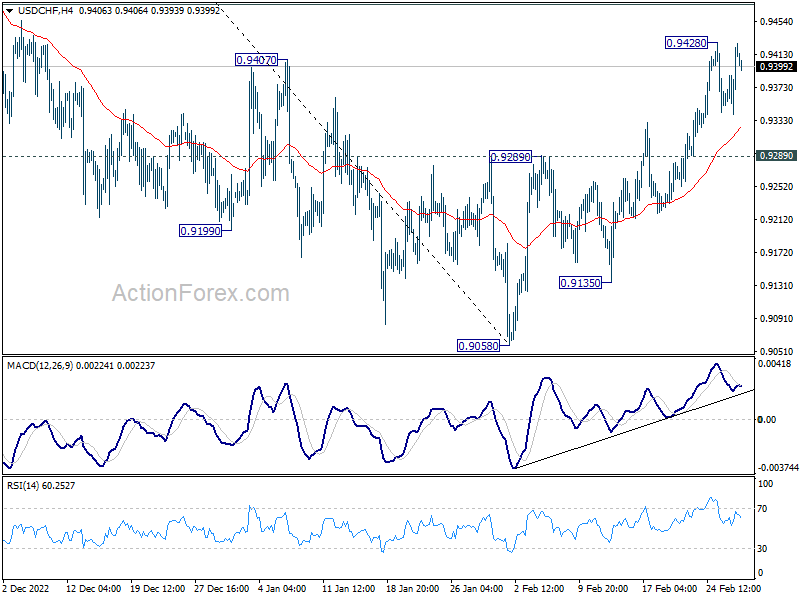
Daily Pivots: (S1) 0.9368; (P) 0.9396; (R1) 0.9449; More...
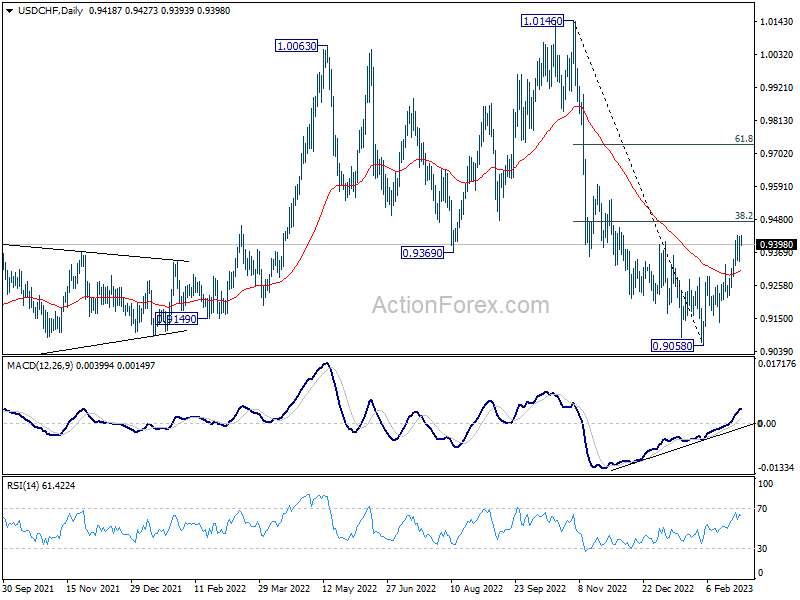
Intraday bias in USD/CHF remains neutral a this point. Break of 0.9428 will resume the rebound form 0.9058. But strong resistance could be seen at 38.2% retracement of 1.0146 to 0.9058 at 0.9474 to limit upside. Break of 0.9289 resistance turned support will indicate completion of the rebound and turn bias back to the downside. However, decisive break of 0.9474 will carry larger bullish implications and target 61.8% retracement at 0.9730.
In the bigger picture, decline from 1.0146 is seen as part of a long term sideway pattern. As long as 38.2% retracement of 1.0146 to 0.9058 at 0.9474 holds, another fall is in favor through 0.9058. However, sustained trading above 0.9474 will indicate that the medium term trend has reversed, and open up further rally to 61.8% retracement at 0.9730 and above.
USD/JPY Daily Outlook
Daily Pivots: (S1) 135.68; (P) 136.30; (R1) 136.86; More...
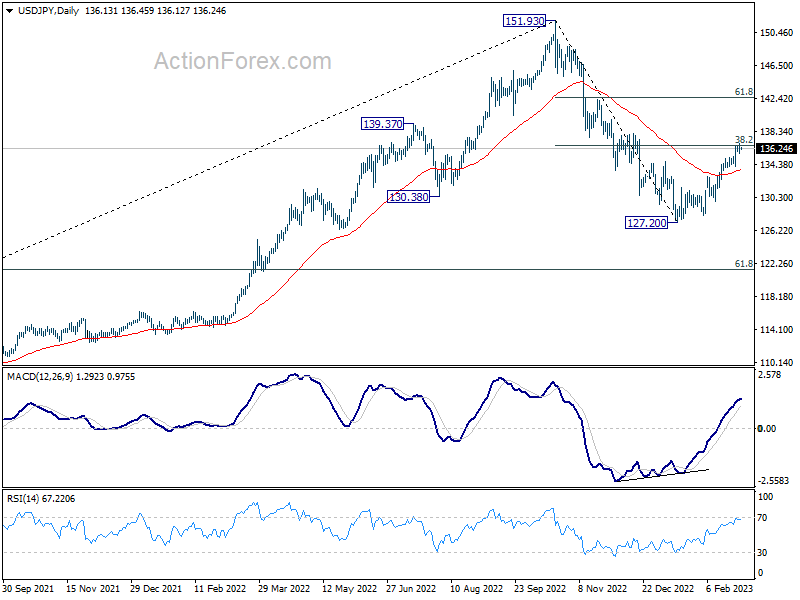
Intraday bias in USD/JPY is turned neutral first. Focus is staying on 38.2% retracement of 151.93 to 127.20 at 136.64. Rejection by this fibonacci level, followed by break of 134.04 support, will argue that such rebound from 127.20 has completed, and turn bias back to the downside. However, sustained trading above 136.64 will indicate that fall from 151.93 has completed, and bring further rally to 61.8% retracement at 142.48.
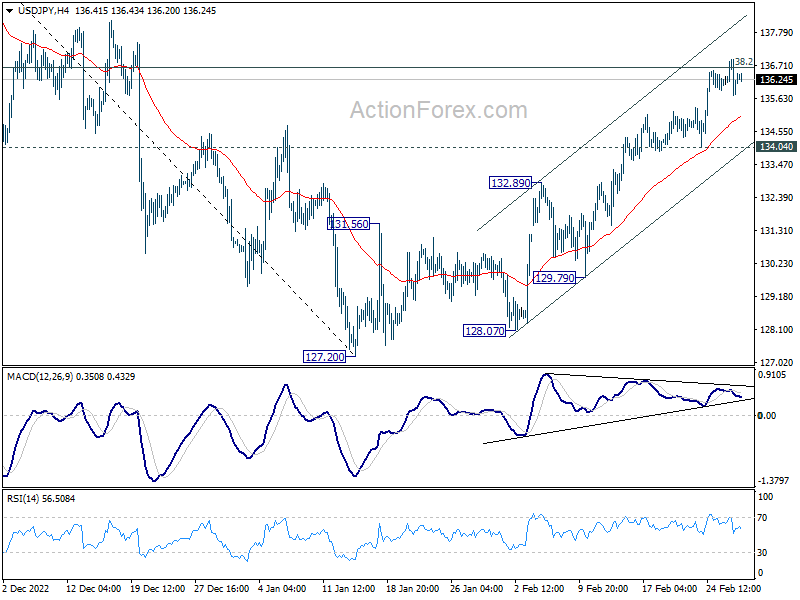
In the bigger picture, focus is now on 38.2% retracement of 151.93 to 127.20 at 136.64. Sustained break there will indicate that price actions from 151.93 medium term are merely a corrective pattern. Such development will maintain long term bullishness. Rejection by 136.64 will, on the downside, extend the fall from 151.93 to 61.8% retracement of 102.58 to 151.93 at 121.43 at a later stage.
USD/CAD Daily Outlook
Daily Pivots: (S1) 1.3588; (P) 1.3619; (R1) 1.3676; More....
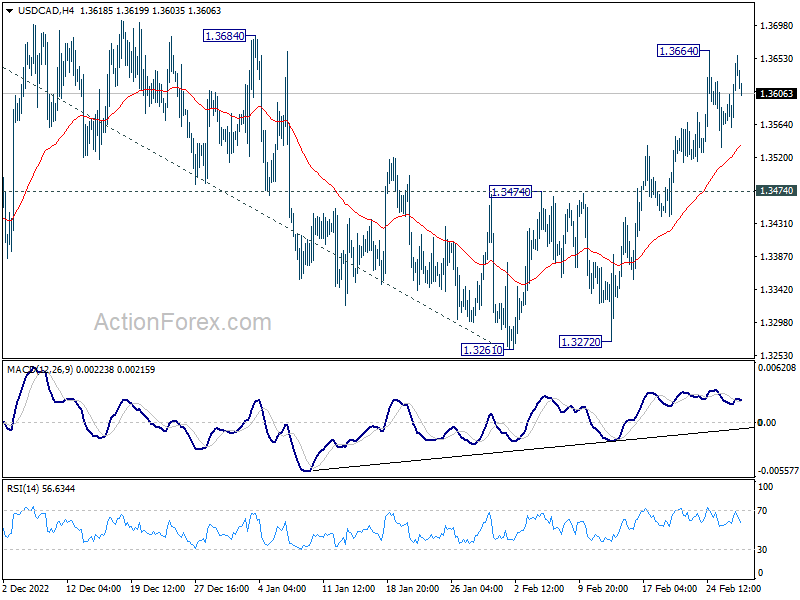
Intraday bias in USD/CAD remains neutral first as consolidation from 1.3664 temporary top is extending. Further rally is in favor as long as 1.3474 resistance turned support holds. Break of 1.3664 will resume the rise from 1.3261. Sustained trading above 1.3684 will confirm that corrective pattern from 1.3976 has completed, and bring retest of this high.
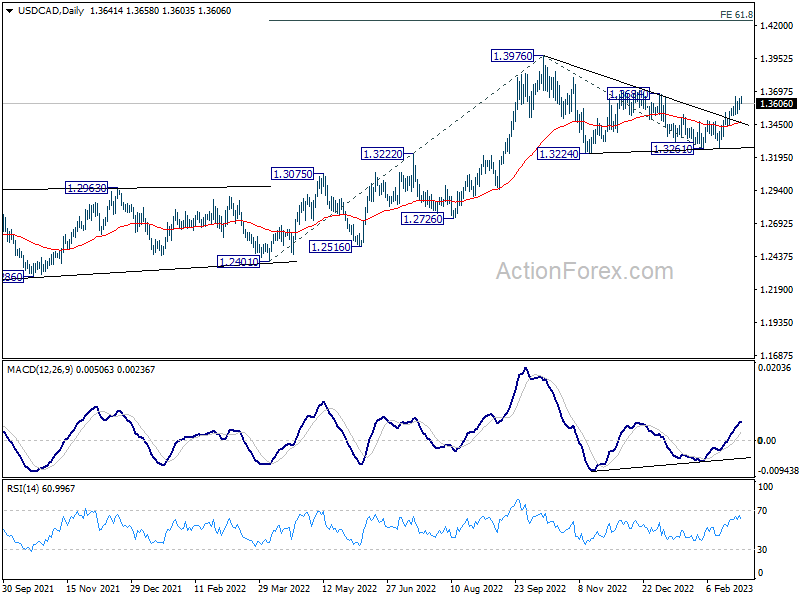
In the bigger picture, outlook stays bullish with 1.3222 cluster support (38.2% retracement of 1.2005 to 1.3976 at 1.3223) intact. Break of 1.3976 resistance will resume larger up trend from 1.2005 (2021 low) to 61.8% projection of 1.2401 to 1.3976 from 1.3261 at 1.4234.
AUD/USD Daily Report
Daily Pivots: (S1) 0.6703; (P) 0.6730; (R1) 0.6757; More...
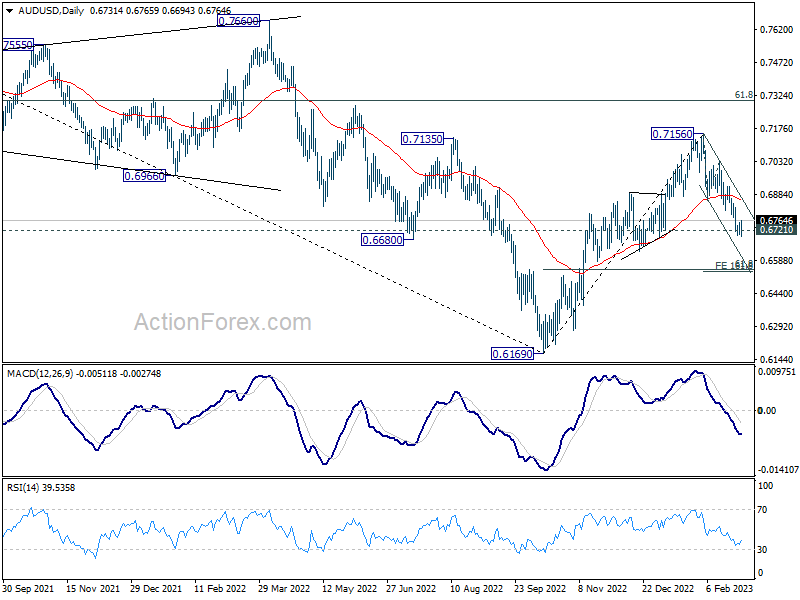
AUD/USD recovered after hitting 0.6693 and intraday bias is turned neutral first. Deeper decline is expected as long as 0.6854 support turned resistance holds. Break of 0.6693 will resume the fall from 0.7156 to 161.8% projection of of 0.6854 to 0.7028 from 0.6854 at 0.6539. Nevertheless, firm break of 0.6854 will argue that such decline is finished, and revive near term bullishness.
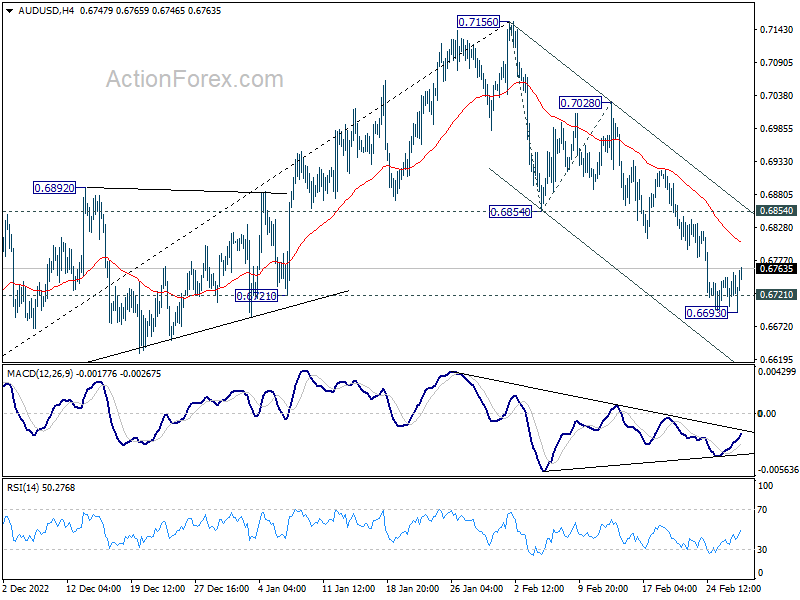
In the bigger picture, focus is now on 0.6721 structural support. Sustained break there will argue that whole rise from 0.6169 (2022 low) has completed at 0.7156, after rejection by 55 month EMA (now at 0.7179). Deeper decline would then be see back to 61.8% retracement of 0.6169 to 0.7156 at 0.6546, even as a corrective fall. Nevertheless, strong rebound from current level will retain medium term bullishness for another rise through 0.7156 later.
China Data Lifts Sentiment, Dollar in Retreat
Asian markets traded on a positive note as sentiment was lifted by better-than-expected economic data from China. The strong performance of Hong Kong stocks was a clear indication of the positive outlook Commodity currencies staged a remarkable rebound, as led by New Zealand Dollar. In contrast, the Yen and the Dollar experienced mild weakness during the session. European majors, we showed a mixed performance with the Swiss Franc lagging behind as the relatively weaker one for the week.
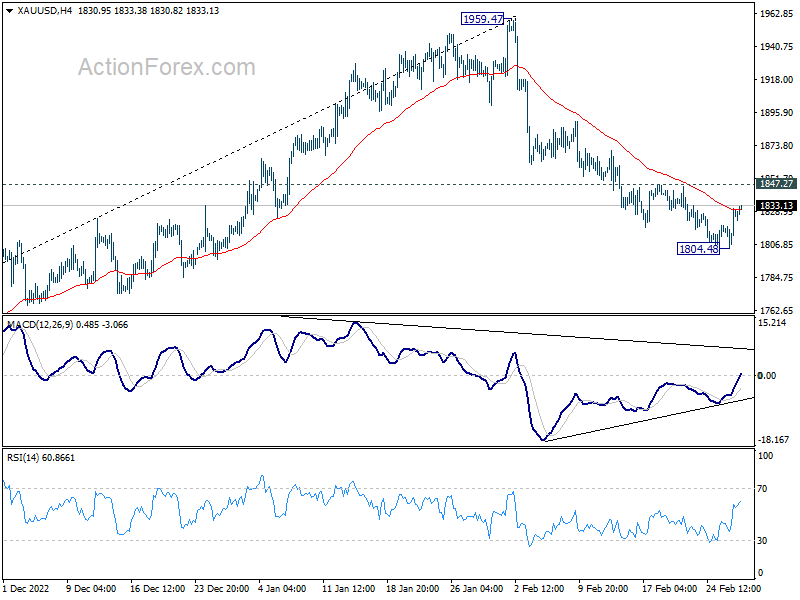
Technically, Dollar's retreat is so far shallow, with EUR/USD holding below 1.0068 support turned resistance, GBP/USD below 1.2146 resistance, and AUD/USD well below 0.6854 support turned resistance. USD/CHF is indeed pressing 0.9428 temporary top while USD/JPY and USD/CAD are trading well above 134.04 and 1.3474 support levels respectively. Similarly, while Gold recovered after hitting 1804.48, upside is limited below 1847.27 resistance. Fall from 1959.47 is still in favor to continue. Nevertheless, break of 1847.27 will indicate short term bottoming in Gold, and possibly short term topping in Dollar too.
In Asia, Nikkei closed up 0.26%. Hong Kong HSI is up 3.79%. China Shanghai SSE is up 0.80%. Singapore Strait Times is up 0.03%. Japan 10-year JGB yield is up 0.0017 at 0.505. Overnight DOW dropped -0.71%. S&P 500 dropped -0.30%. NASDAQ dropped -0.10%. 10-year yield dropped -0.006 to 3.916
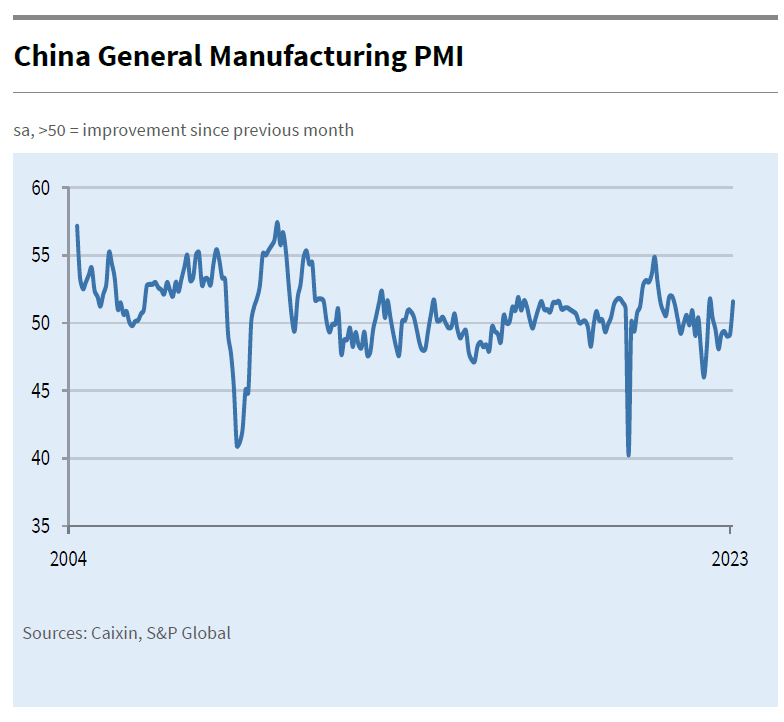
China PMI manufacturing rose to 52.6, highest since 2012
China official PMI Manufacturing rose from 50.1 to 52.6, above expectation of 50.7. That's also the highest reading since April 2012. PMI Non-Manufacturing rose from 54.4 to 56.3, highest since March 2021. PMI Composite rose from 52.9 to 56.4.
"In February, the economic stabilisation policy measures further took effect, coupled with the epidemic's impact receding and other favourable factors, the speed of enterprises to resume production accelerated, meaning China's economic prosperity level continued to rebound," said senior NBS statistician Zhao Qinghe.
Also released, Caixin PMI Manufacturing rose from 49.2 to 51.6 in February, slightly above expectation of 51.3. That the first expansion reading in 7 months, and the second-highest since May 2021. Caixin added there were renewed increases in output, new orders and employment. Suppliers' delivery times improved at the quickest rate for eight years. Business confidence also strengthened to near two-year high.
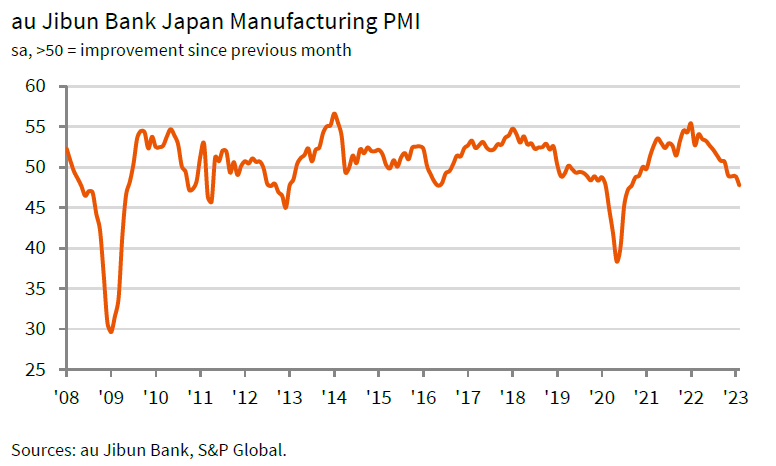
Japan PMI manufacturing finalized at 47.7 in Feb, continually deteriorating activity
Japan PMI Manufacturing was finalized at 47.7 in February, down from January's 48.9. That's also the worst reading since September 2020. S&P Global also noted that backlogs of work decreased at quickest pace for 29 months. Input prices had the slowest rise for a year-and-a-half.
Usamah Bhatti, Economist at S&P Global Market Intelligence, said: "Latest data pointed to continually deteriorating activity in the Japanese manufacturing sector midway through the first quarter of 2023. Both new orders and production levels, which make up 55% of the headline PMI figure, fell at the fastest pace since July 2020 as weak domestic demand and a global economic slowdown hindered sales and output volumes.
"Moreover, the dip is likely to be sustained in the near-term as the absence of new orders amid dampened client confidence lifted capacity pressure on manufacturers further and led to the sharpest reduction in outstanding business in nearly two-and- a-half years."
Australia CPI slowed to 7.4% yoy in Jan, ex-volatile items down to 7.2% yoy
Australia monthly CPI indicator slowed from 8.4% yoy to 7.4% yoy in January, below expectation of 8.1% yoy. CPI excluding volatile items (i.e. excludes Fruit and vegetables and Automotive fuel) slowed from 8.1% yoy to 7.2% yoy.
The most significant contributors to the annual increase in the January monthly CPI indicator were Housing (9.8%), Food and non-alcoholic beverages (8.2%) and recreation and culture (10.2%).
Australia GDP grew 0.5% qoq in Q4, domestic prices grew fastest since 1990
Australia GDP grew 0.5% qoq in Q4, below expectation of 0.8% qoq. Through the year, GDP grew 2.7% yoy. GDP Implicit price deflator (IPD) rose 1.6% qoq and 9.1% yoy. Domestic prices grew 1.4% qoq and 6.6 yoy, highest annual growth since 1990.
Katherine Keenan, ABS head of National Accounts, said, "the 0.4 per cent rise in total consumption and 1.1 per cent rise in exports were the primary contributors to GDP growth in the December quarter...
"Continued growth in household and government spending drove the rise in consumption, while increased exports of travel services and continued overseas demand for coal and mineral ores drove exports."
Looking ahead
Swiss retail sales and manufacturing PMI will be released in European session. Germany will release CPI and unemployment. Eurozone will release PMI manufacturing final. UK will release PMI manufacturing final today too. Later in the day, Canada will release PMI manufacturing. US will release ISM manufacturing and construction spending.
AUD/USD Daily Report
Daily Pivots: (S1) 0.6703; (P) 0.6730; (R1) 0.6757; More...
AUD/USD recovered after hitting 0.6693 and intraday bias is turned neutral first. Deeper decline is expected as long as 0.6854 support turned resistance holds. Break of 0.6693 will resume the fall from 0.7156 to 161.8% projection of of 0.6854 to 0.7028 from 0.6854 at 0.6539. Nevertheless, firm break of 0.6854 will argue that such decline is finished, and revive near term bullishness.
In the bigger picture, focus is now on 0.6721 structural support. Sustained break there will argue that whole rise from 0.6169 (2022 low) has completed at 0.7156, after rejection by 55 month EMA (now at 0.7179). Deeper decline would then be see back to 61.8% retracement of 0.6169 to 0.7156 at 0.6546, even as a corrective fall. Nevertheless, strong rebound from current level will retain medium term bullishness for another rise through 0.7156 later.
Economic Indicators Update
| GMT | Ccy | Events | Actual | Forecast | Previous | Revised |
|---|---|---|---|---|---|---|
| 21:45 | NZD | Building Permits M/M Jan | -1.50% | -7.20% | ||
| 00:30 | AUD | GDP Q/Q Q4 | 0.50% | 0.80% | 0.60% | 0.70% |
| 00:30 | AUD | Monthly CPI Y/Y Jan | 7.40% | 8.10% | 8.40% | |
| 00:30 | JPY | Manufacturing PMI Feb F | 47.7 | 47.4 | 47.4 | |
| 01:00 | CNY | NBS Manufacturing PMI Jan | 52.6 | 50.7 | 50.1 | |
| 01:00 | CNY | Non-Manufacturing PMI Jan | 56.3 | 55.0 | 54.4 | |
| 01:45 | CNY | Caixin Manufacturing PMI Feb | 51.6 | 51.3 | 49.2 | |
| 07:30 | CHF | Real Retail Sales Y/Y Jan | -2.20% | -2.80% | ||
| 08:30 | CHF | Manufacturing PMI Feb | 50.4 | 49.3 | ||
| 08:45 | EUR | Italy Manufacturing PMI Feb | 50.9 | 50.4 | ||
| 08:50 | EUR | France Manufacturing PMI Feb F | 47.9 | 47.9 | ||
| 08:55 | EUR | Germany Manufacturing PMI Feb F | 46.5 | 46.5 | ||
| 08:55 | EUR | Germany Unemployment Change Jan | 9K | -22K | ||
| 08:55 | EUR | Germany Unemployment Rate Jan | 5.50% | |||
| 09:00 | EUR | Eurozone Manufacturing PMI Feb F | 48.5 | 48.5 | ||
| 09:30 | GBP | Mortgage Approvals Jan | 36K | 36K | ||
| 09:30 | GBP | M4 Money Supply M/M Jan | -0.90% | -0.80% | ||
| 09:30 | GBP | Manufacturing PMI Feb F | 49.2 | 49.2 | ||
| 13:00 | EUR | Germany CPI M/M Feb P | 0.80% | 1.00% | ||
| 13:00 | EUR | Germany CPI Y/Y Feb P | 8.70% | 8.70% | ||
| 14:30 | CAD | Manufacturing PMI Feb | 51 | |||
| 14:45 | USD | Manufacturing PMI Feb F | 47.8 | 47.8 | ||
| 15:00 | USD | ISM Manufacturing PMI Feb | 47.9 | 47.4 | ||
| 15:00 | USD | ISM Manufacturing Prices Paid Feb | 45.2 | 44.5 | ||
| 15:00 | USD | ISM Manufacturing Employment Index Feb | 50.6 | |||
| 15:00 | USD | Construction Spending M/M Jan | 0.20% | -0.40% | ||
| 15:30 | USD | Crude Oil Inventories | 1.7M | 7.6M |
Technical Outlook and Review
USD/JPY:
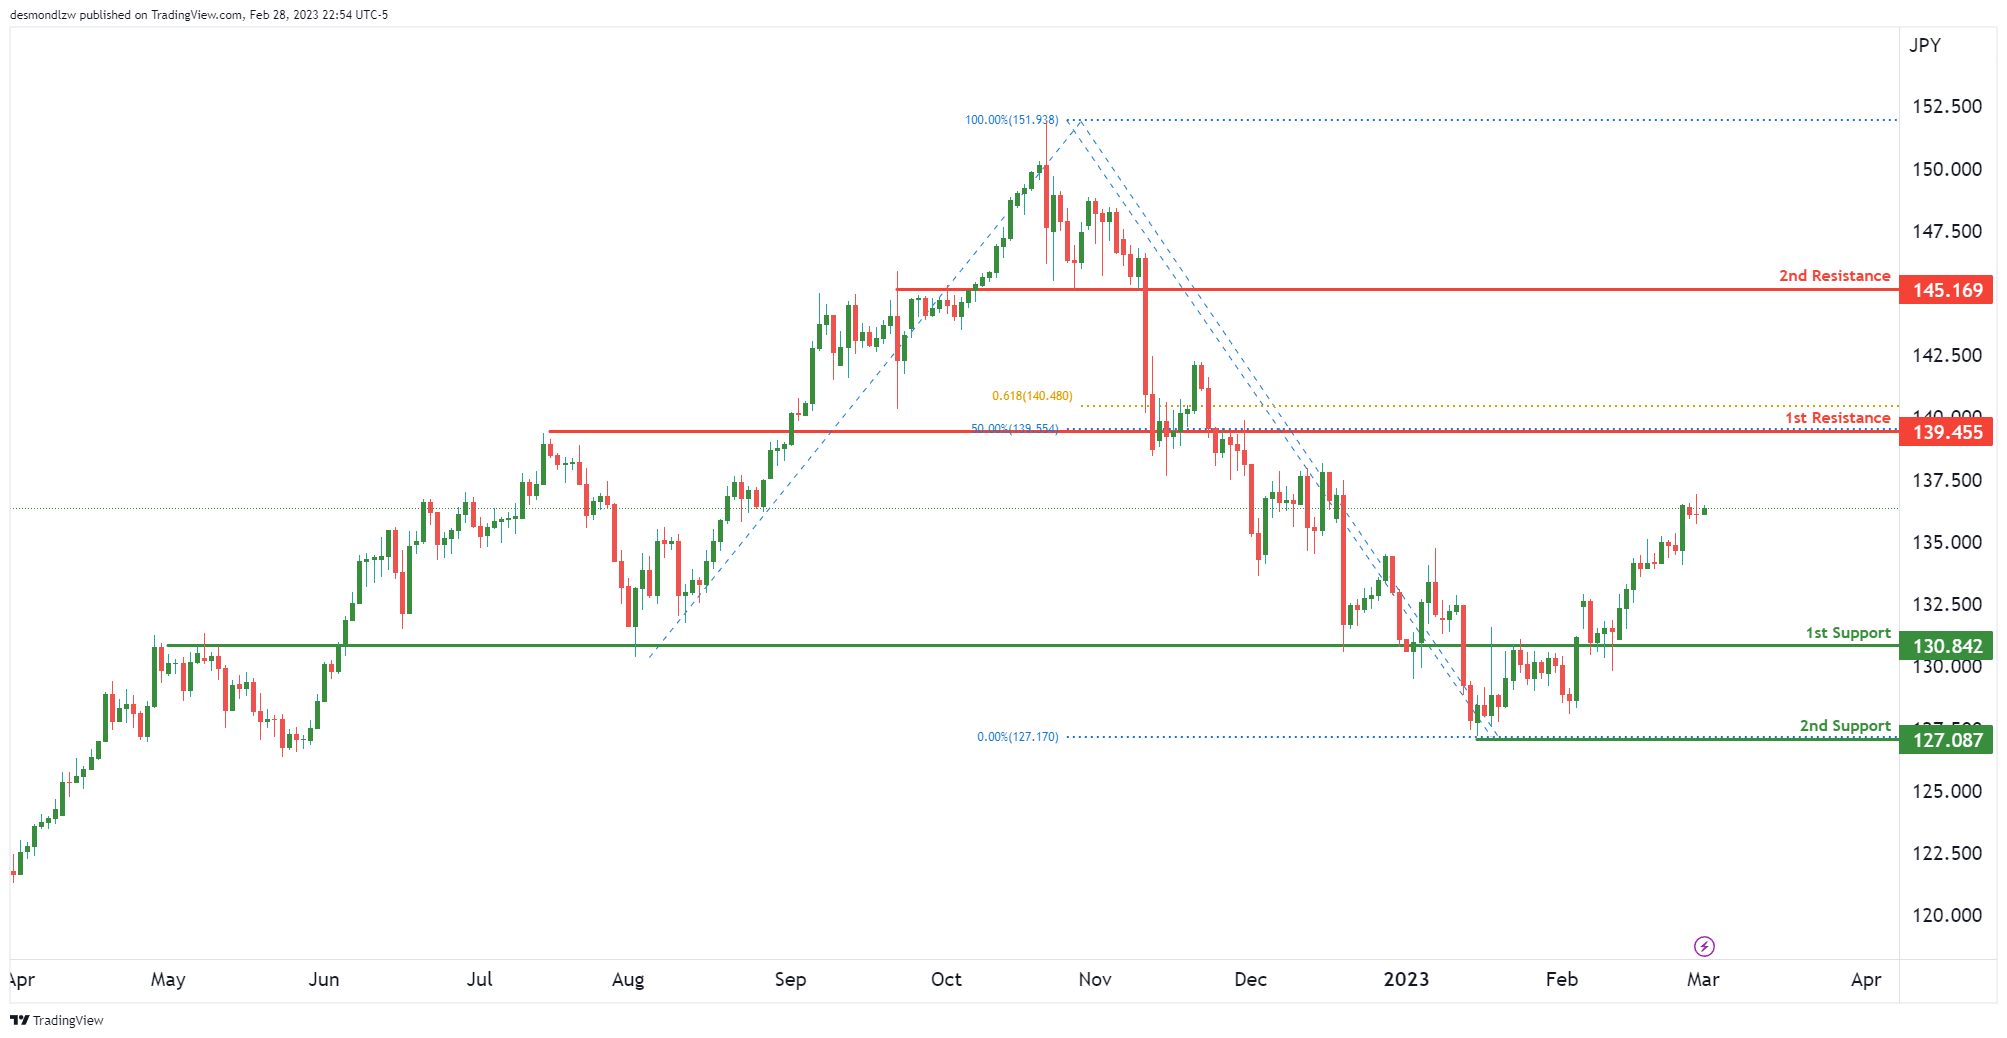
We’re seeing price approach our 1st resistance at 139.45. This is in line with the 50% Fibonacci retracement and 61.8% Fibonacci projection. If price breaks this level, the next big resistance is at 145.16 which is an overlap resistance.
In terms of support, there’s a nice overlap at 130.84 which serves as our 1st support. The next key support is the major swing low at 127.08.
DXY:
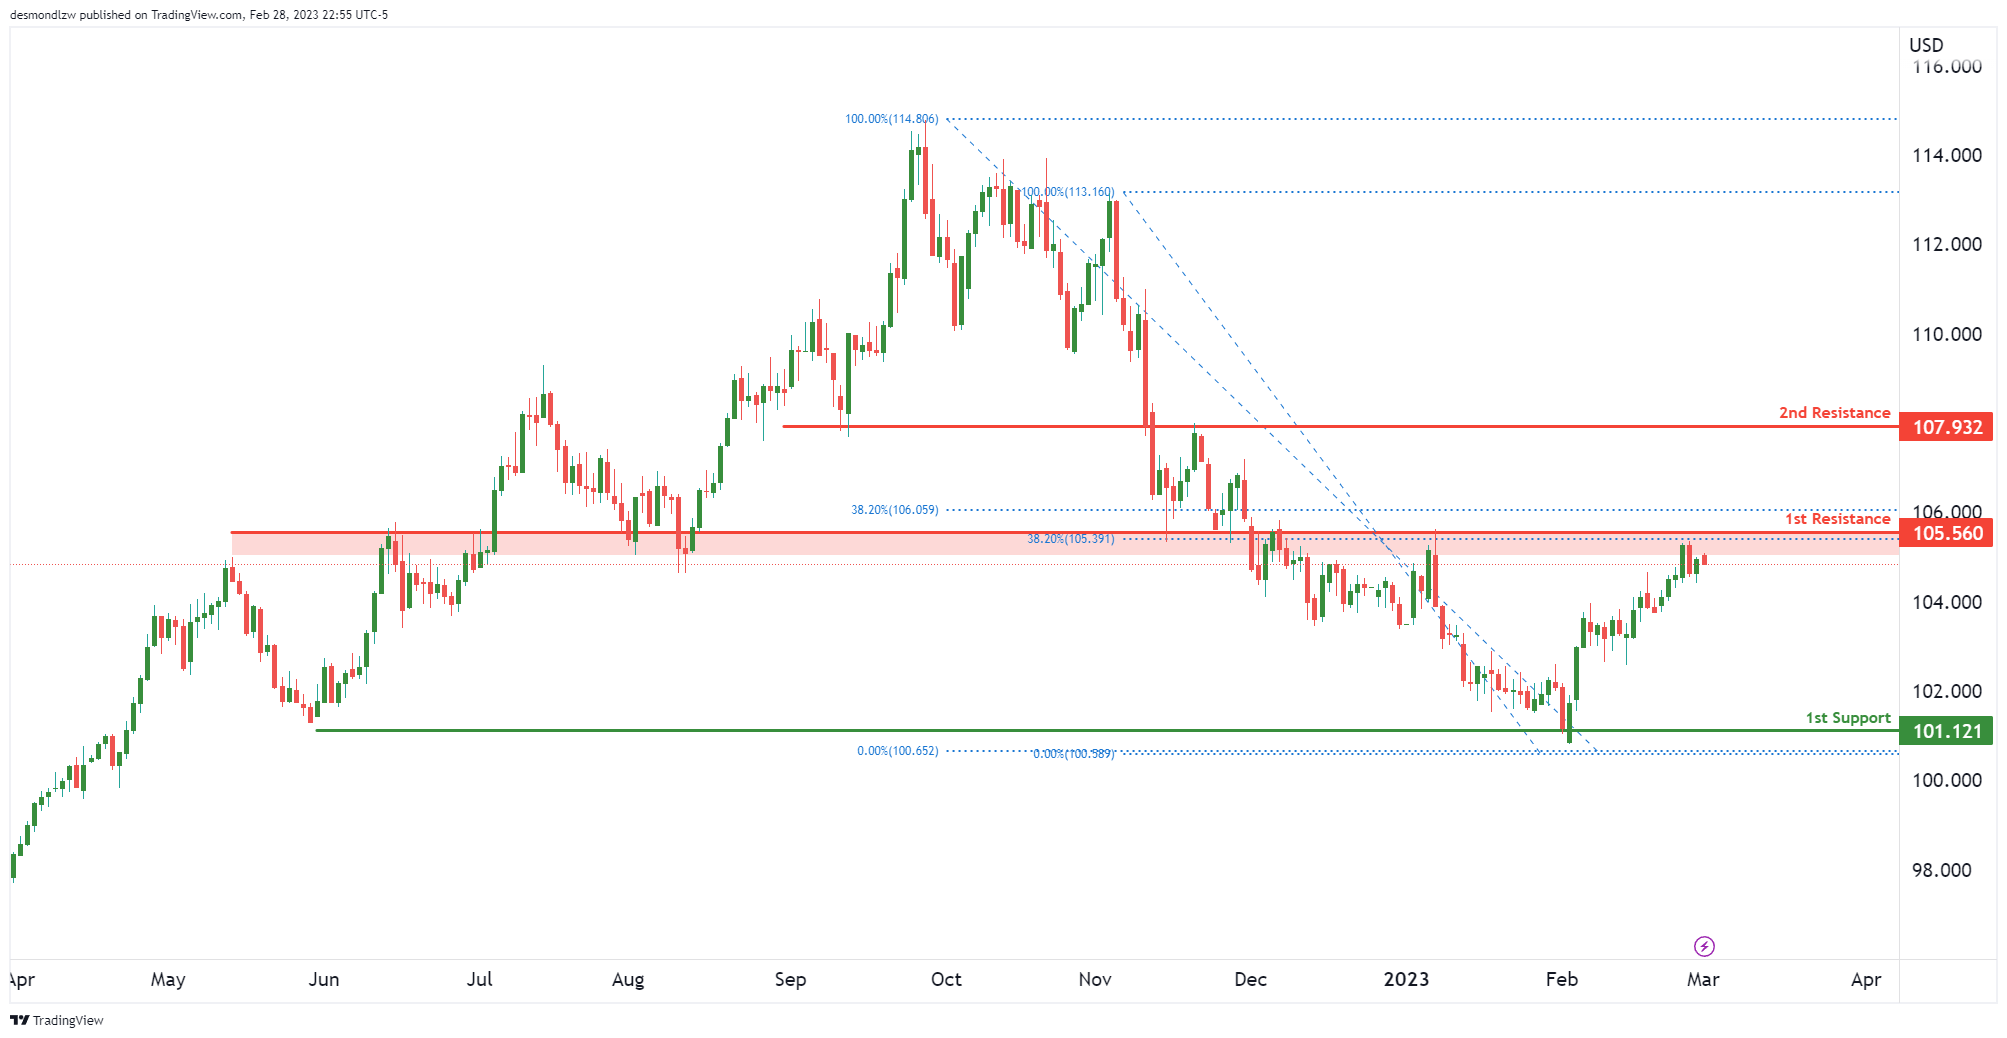
Price is testing the 1st resistance at 105.56. This is a strong overlap resistance which also coincides what multiple 38% Fibonacci retracements. If price were to break this level, we could see if make a push up to 107.93.
In terms of support, a reversal from here would see prices drop to 101.12 which is a major double swing low support.
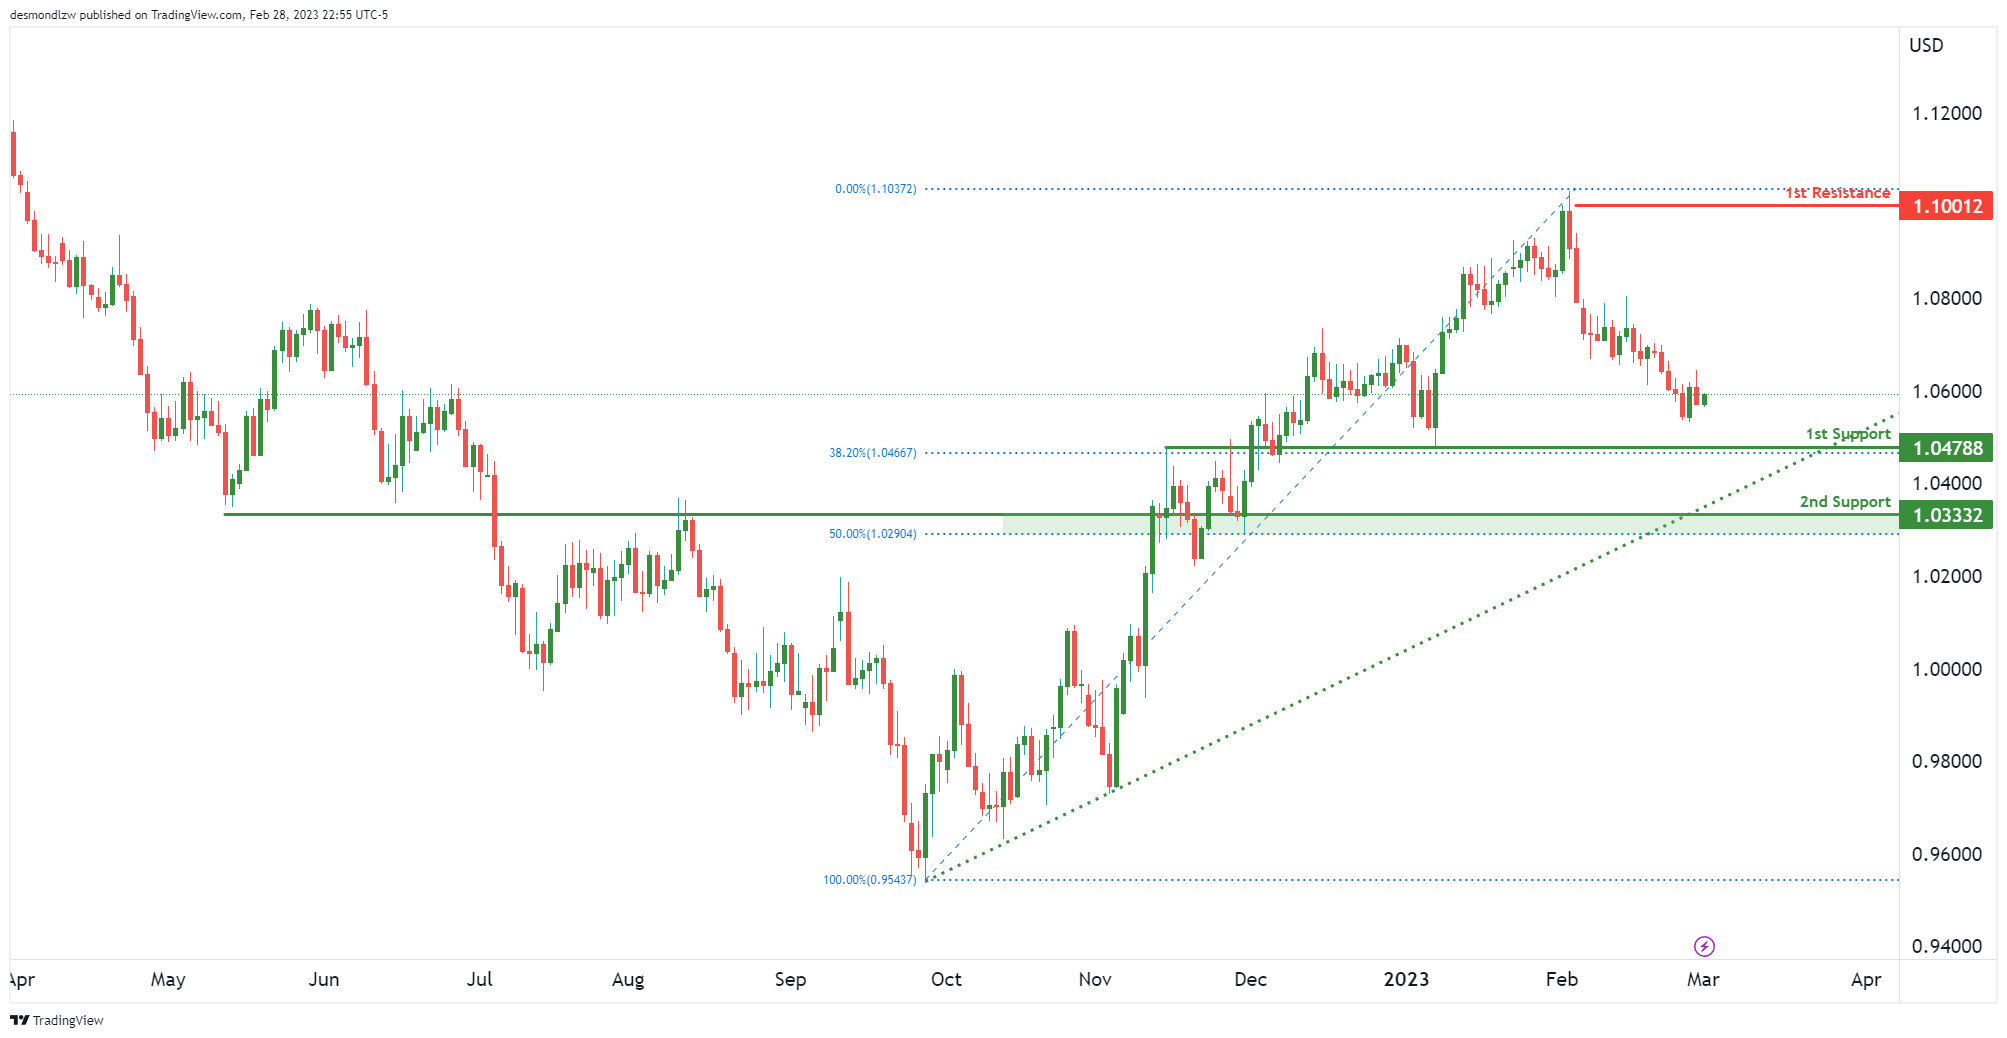
EUR/USD:
Price is approaching our 1st support at 1.0578 which is an overlap support that lines up with a 38.2% Fibonacci retracement. It’s worth noting that price is also seeing bullish pressure from the ascending support line.
The 2nd support is down at 1.0333 which is a strong overlap support and a 50% Fibonacci retracement too.
In terms of resistance, the closest resistance is at 1.1001 which is a recent swing high resistance.
GBP/USD:
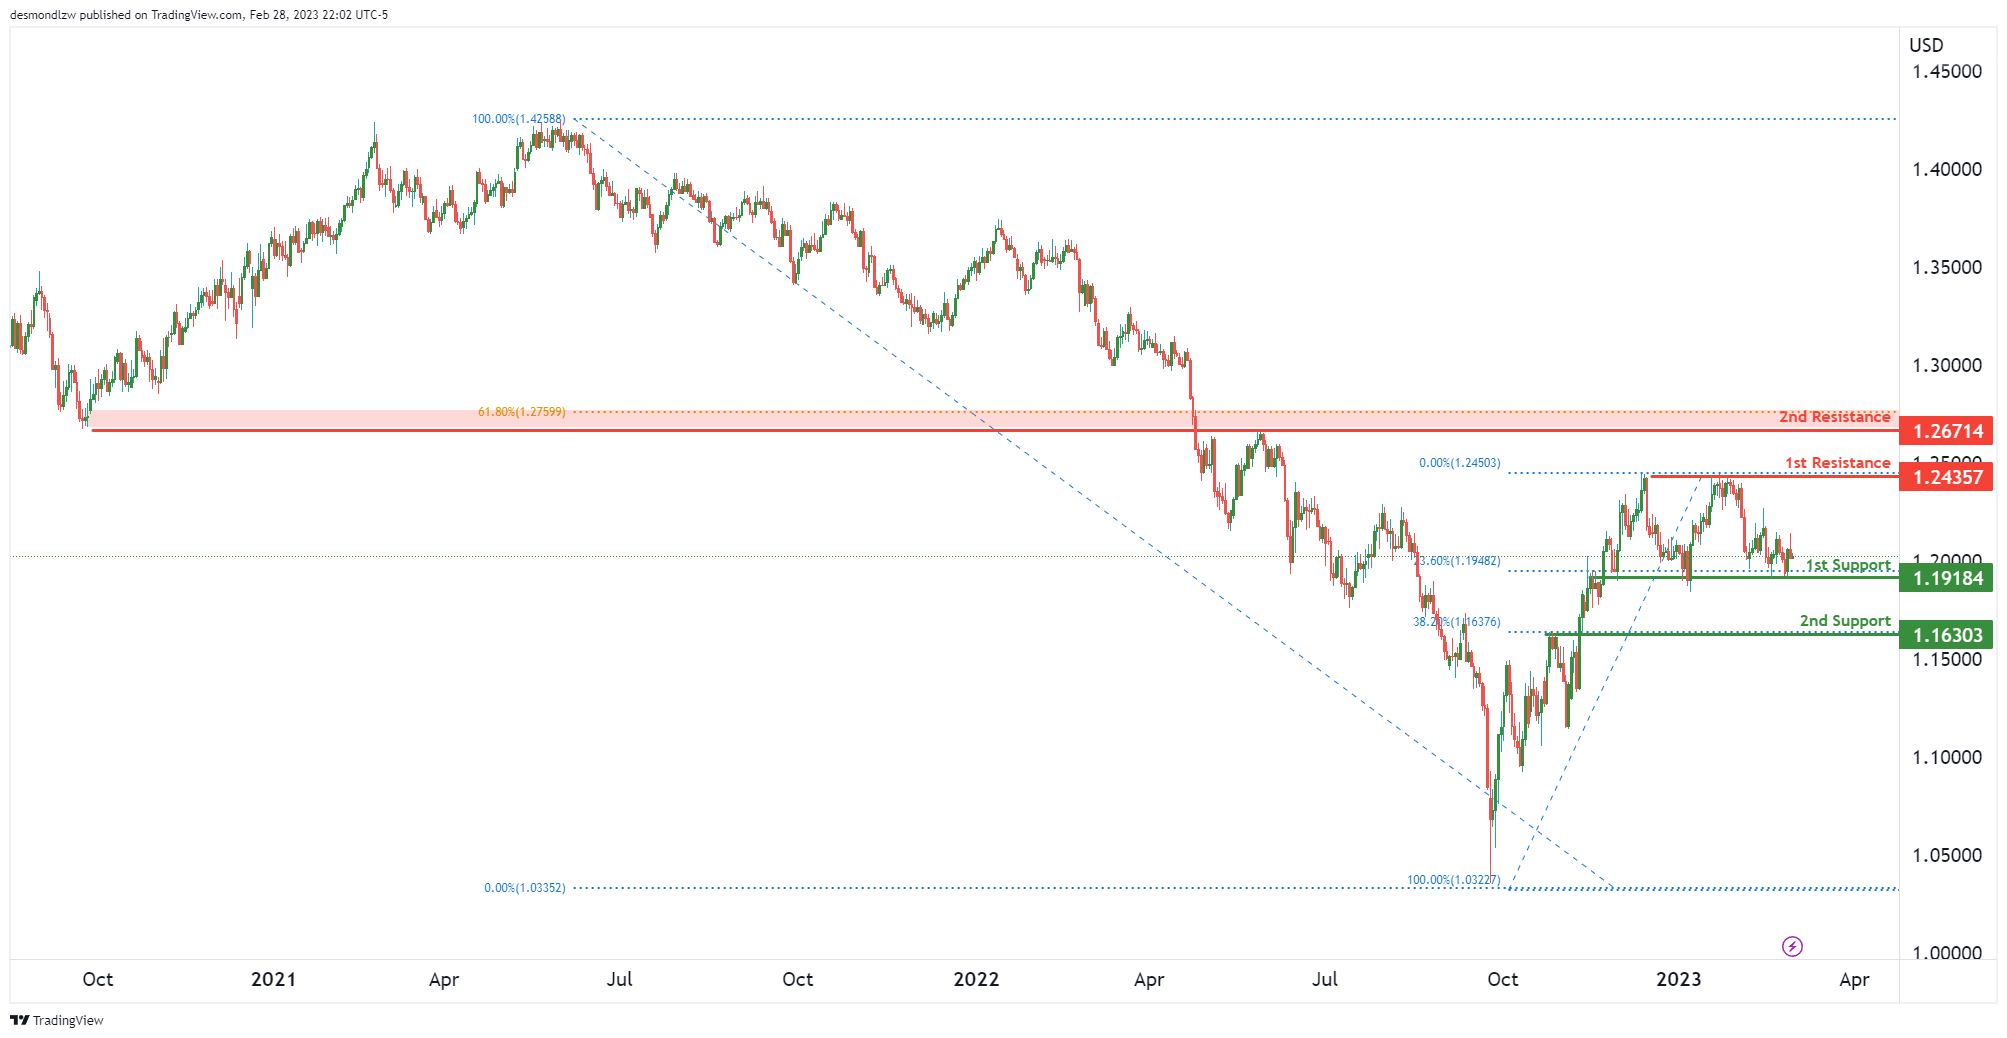
Price is ranging between the 1st support at 1.1918 which is an overlap support and a strong 23.6% Fibonacci retracement and the 1st resistance at 1.2435 – which coincides with 2 swing high resistance.
If price were to break the 1st support, we’re likely to see a double top reversal pattern and price could drop to 1.1630 which also lines up with the 38% Fibonacci retracement.
However, if price were to break the 1st resistance, we could see a push up to 2nd resistance at 1.2671 which is a strong pullback resistance that lines up with the major 61.8% Fibonacci retracement.
USD/CHF:
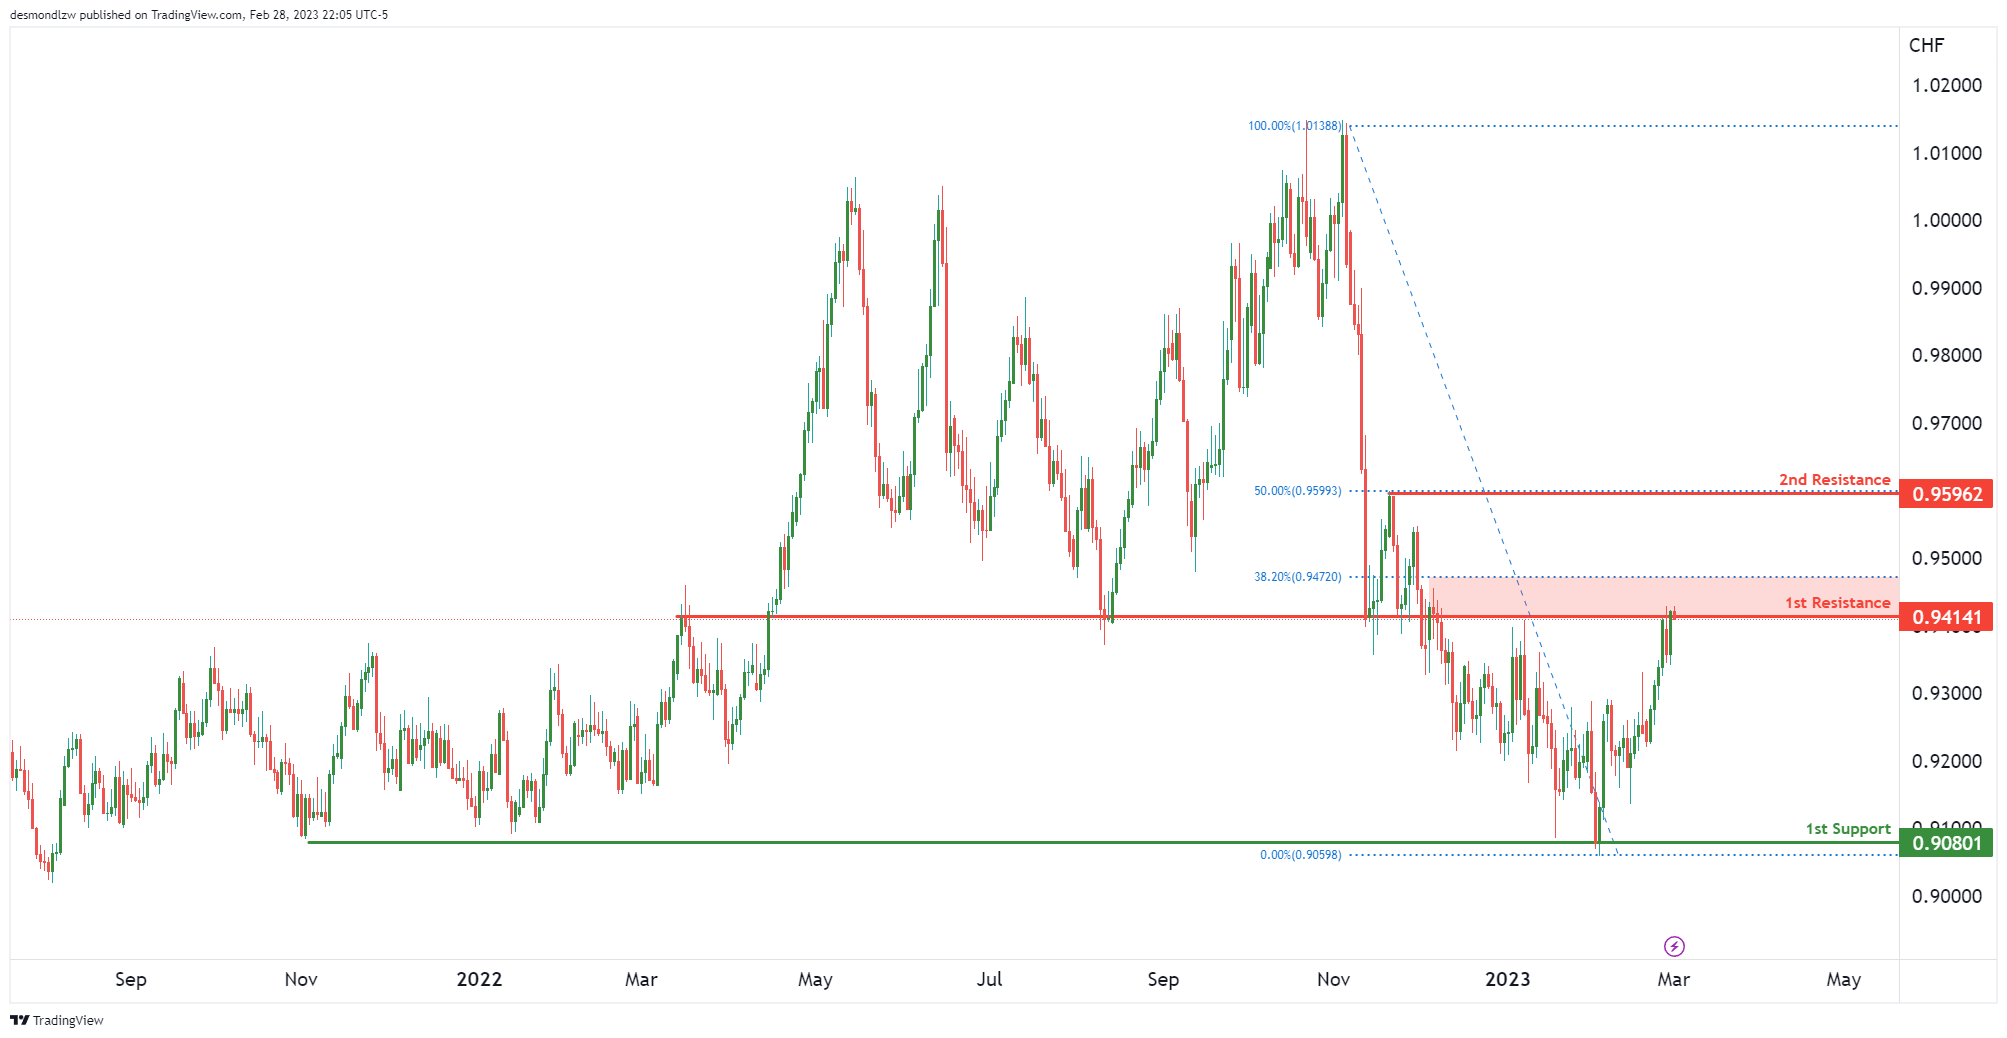
Price is now testing the 1st resistance at 0.9414. This is an overlap resistance and along with that, a 38.2% Fibonacci retracement. If price were to break this resistance, the next key resistance it could rise to is 0.9596 which is a small swing high resistance and a 50% Fibonacci retracement.
It’s worth noting that if price were to reverse from ehre, we could see it drop nicely down to 0.9080 which is our 1st support. This 1st support lines up nicely with a couple of recent swing lows.
AUD/USD:
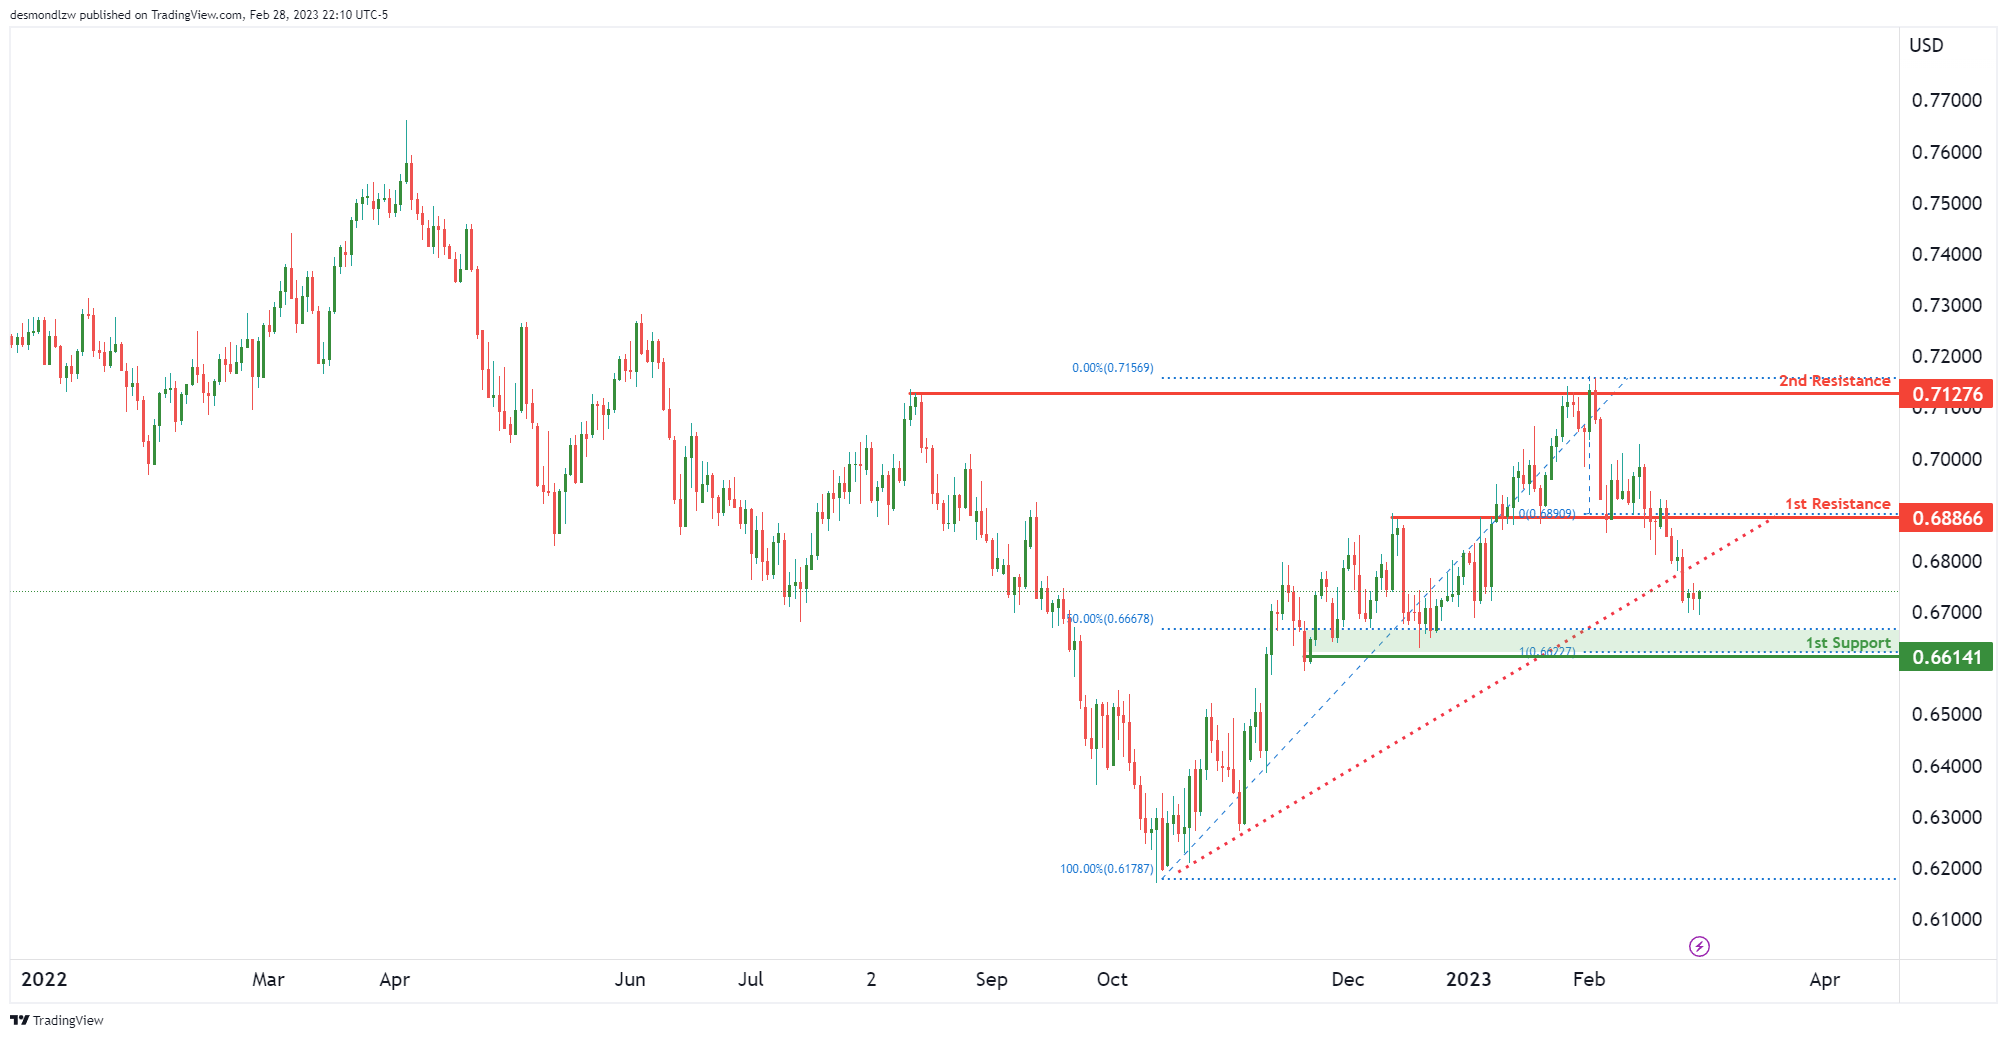
Price has broken our ascending support line and is enroute to our 1st support at 0.6614. This level lines up with the head and shoulders exit potential along with a 50% Fibonacci retracement. If price were to bounce from there, the 1st resistance we should take note of is at 0.6886 which is a strong overlap resistance and the level which formed the head and shoulders reversal.
NZD/USD:
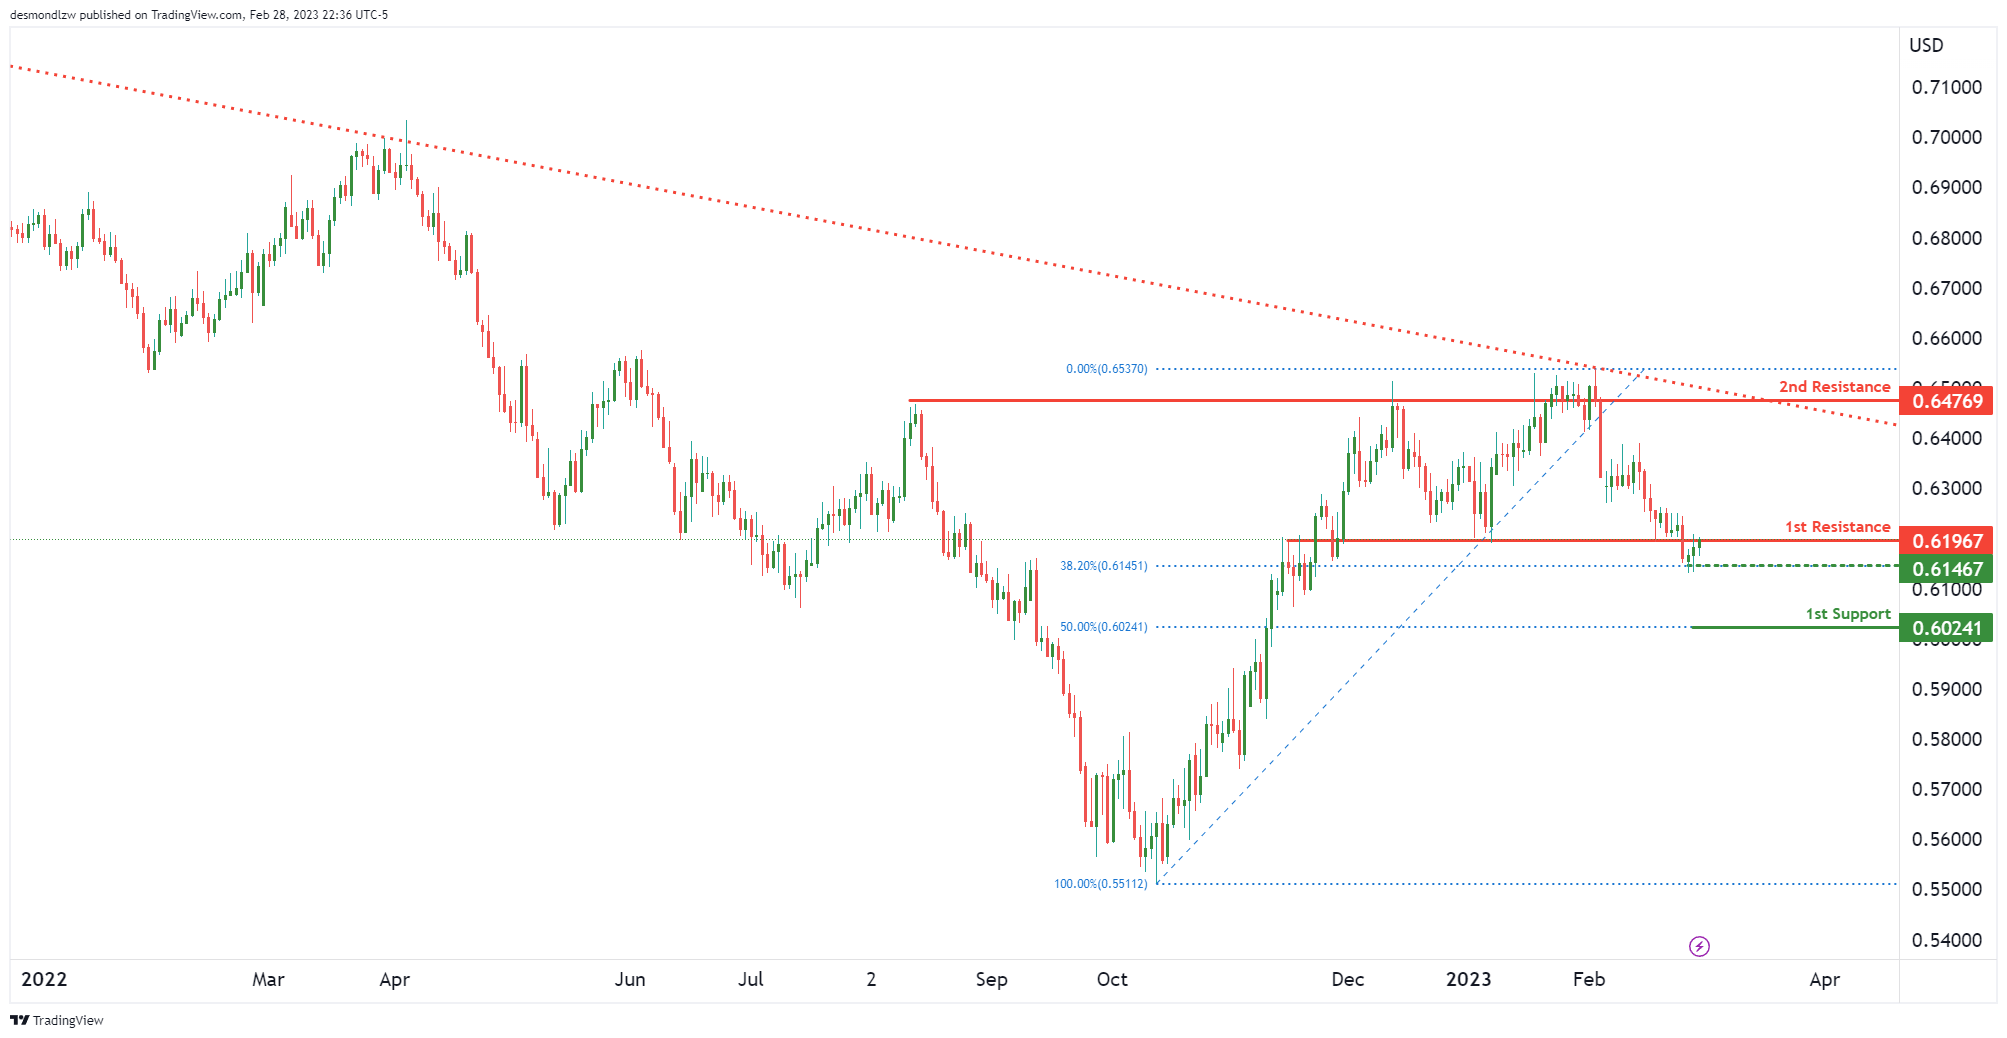
Price has broken the 1st support-turned-resistance at 0.6196 which would lead us to think we could be seeing a double top reversal. However, there is an intermediate support at 0.6146 which is line with the 38.2% Fibonacci retracement. Price needs to break this intermediate support to confirm a double top reversal which might push prices down to 1st support at 0.6024 – which also happents to line up with the 50% Fibonacci retracement.
However, if prices were to rise from here, we could see if rise to the 2nd resistance at 0.6474 which has seen multiple swing highs react off it in the past.
USD/CAD:
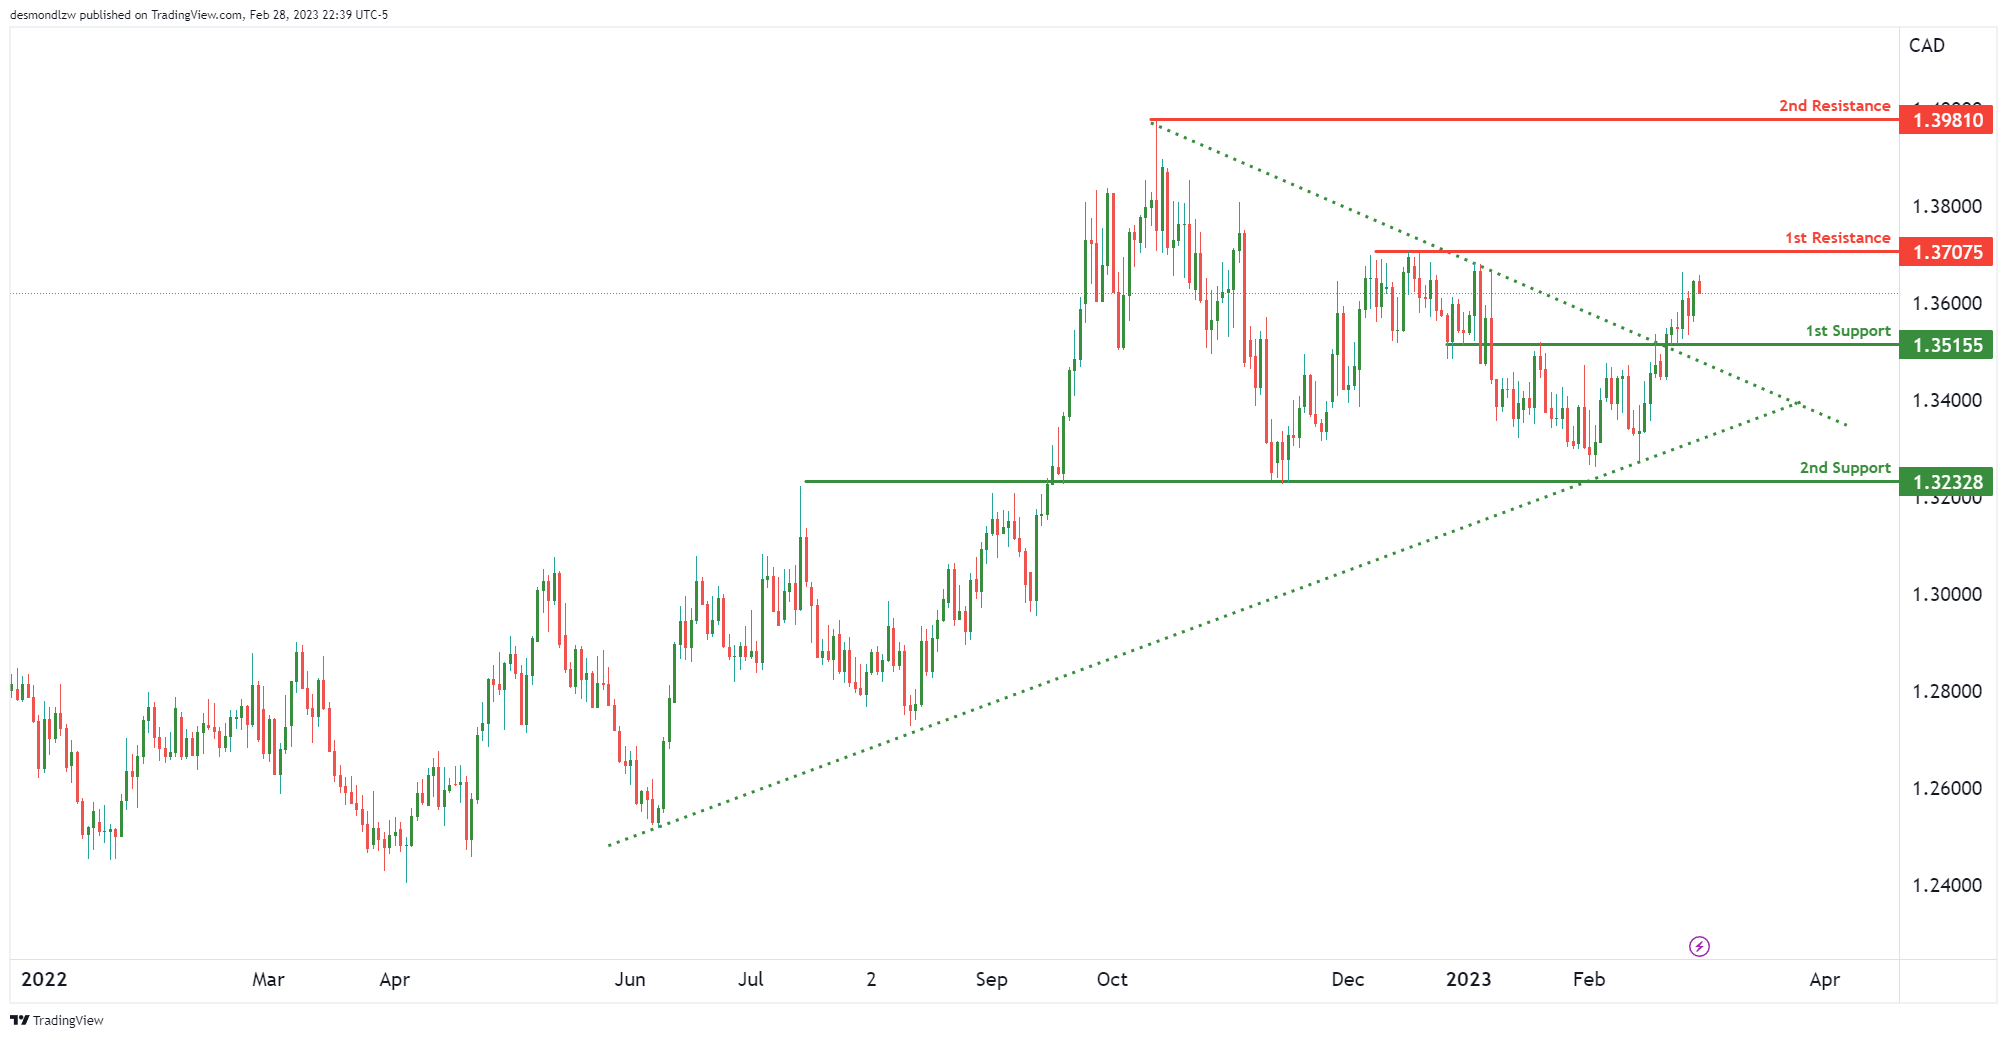
We can see an ascending support line push prices up stretching all the way back to June 2022. Along with that, price has also recently broke a descending resistance-turned-support line with our 1st support at 1.3515 which is the breakout level + the overlap support.
The 1st resistance to take note of is at 1.37070 which is a recent swing high. Price needs to break this to trigger a bigger move up to 1.3981.
DJ30:
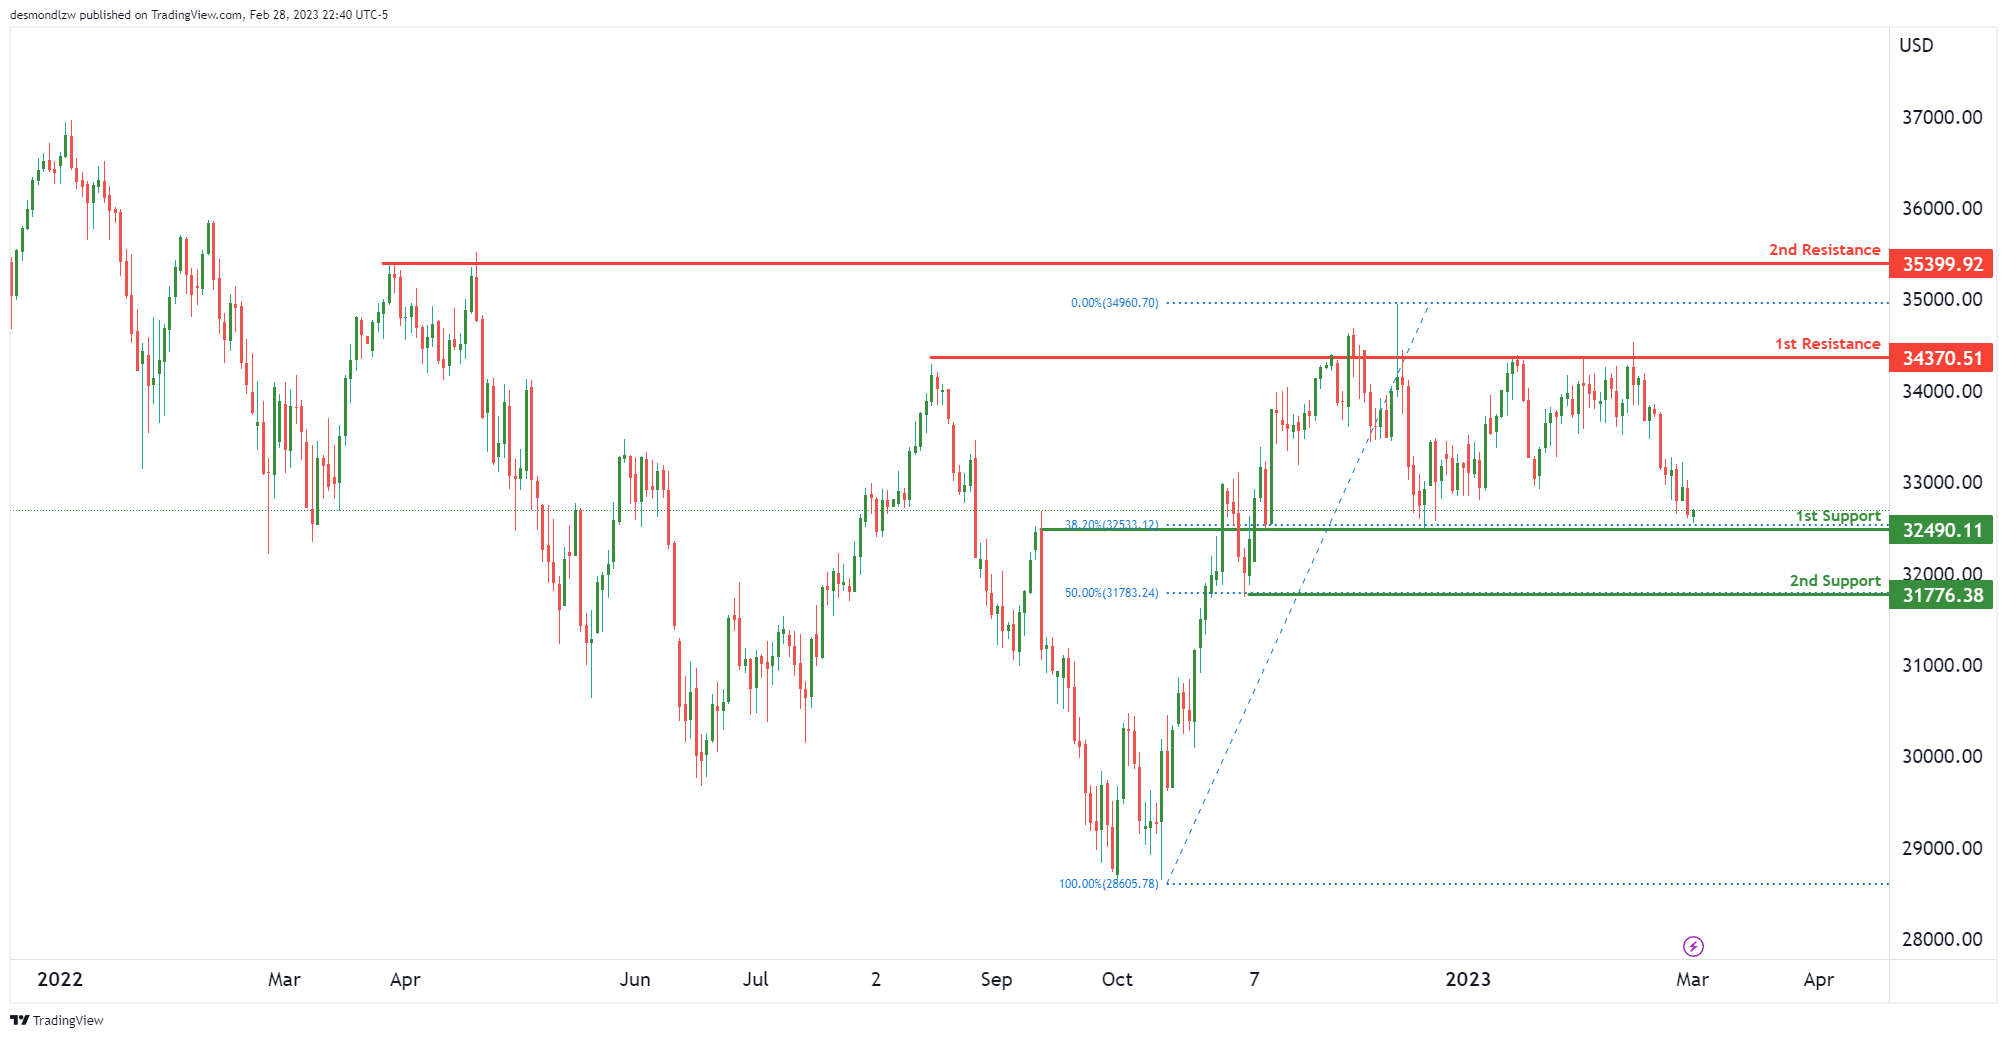
Price is testing our 1st support at 32490 which is a strong overlap support that also lines up with our 38.2% Fibonacci retracement. Price needs to break this level to trigger a small drop to 2nd support at 1.31776 which is a small swing low support lining up with the 50% Fibonacci retracement.
If price were to bounce from here, we could see a push up to 34370 which is our 1st resistance with multiple swing highs reacting off that level. Breaking that level, the next resistgance would be at 35399 which is also another swing high.
DAX:
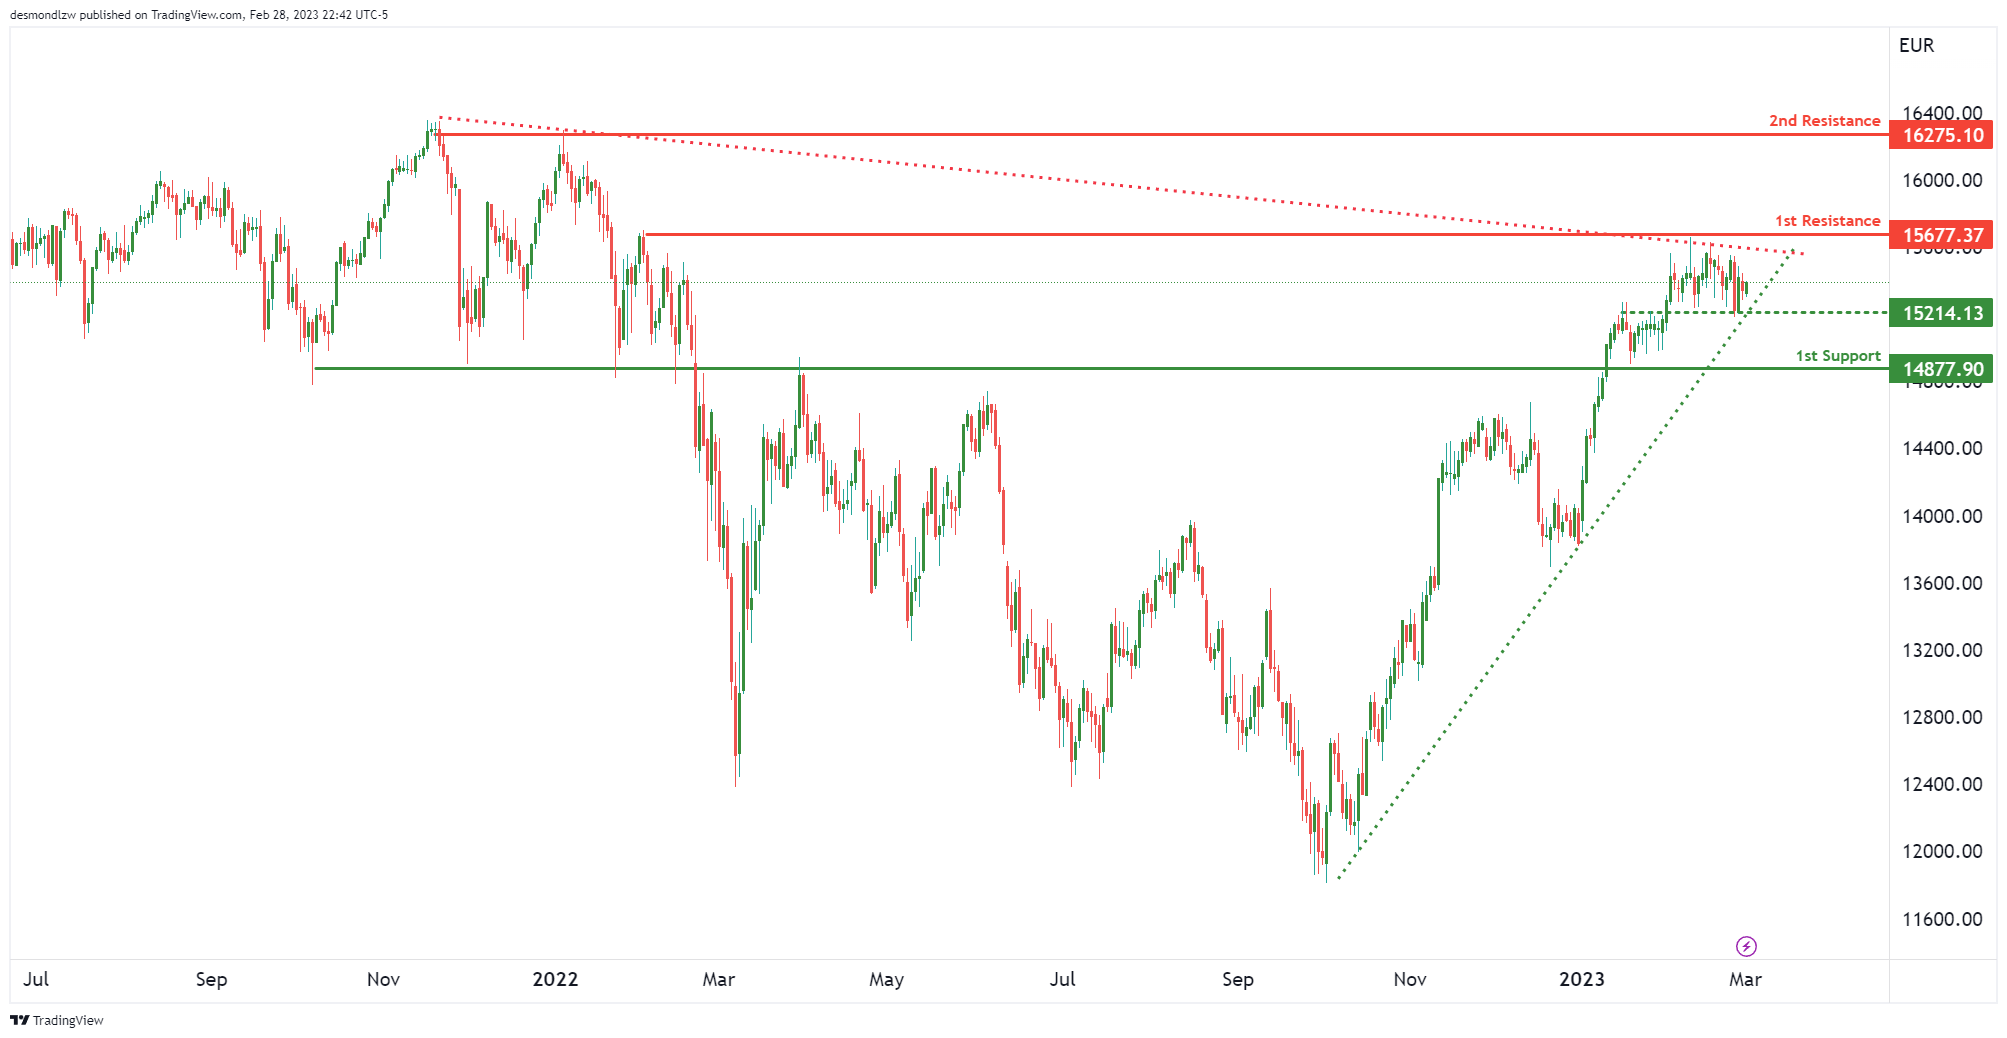
We can see prices being squeezed between an ascending support line and a descending resistance line. In terms of key levels, 15677 is our 1st resistance and 15214 is our intermediate support. If price were to break this intermediate support and the ascending support line, the first level price might drop to is at 14877 which is a strong overlap support.
In terms of resistance, if price were to break 15677, we could see a push up towards 16275 which is our 2nd resistance that lines up with multiple swing highs.
S&P500:
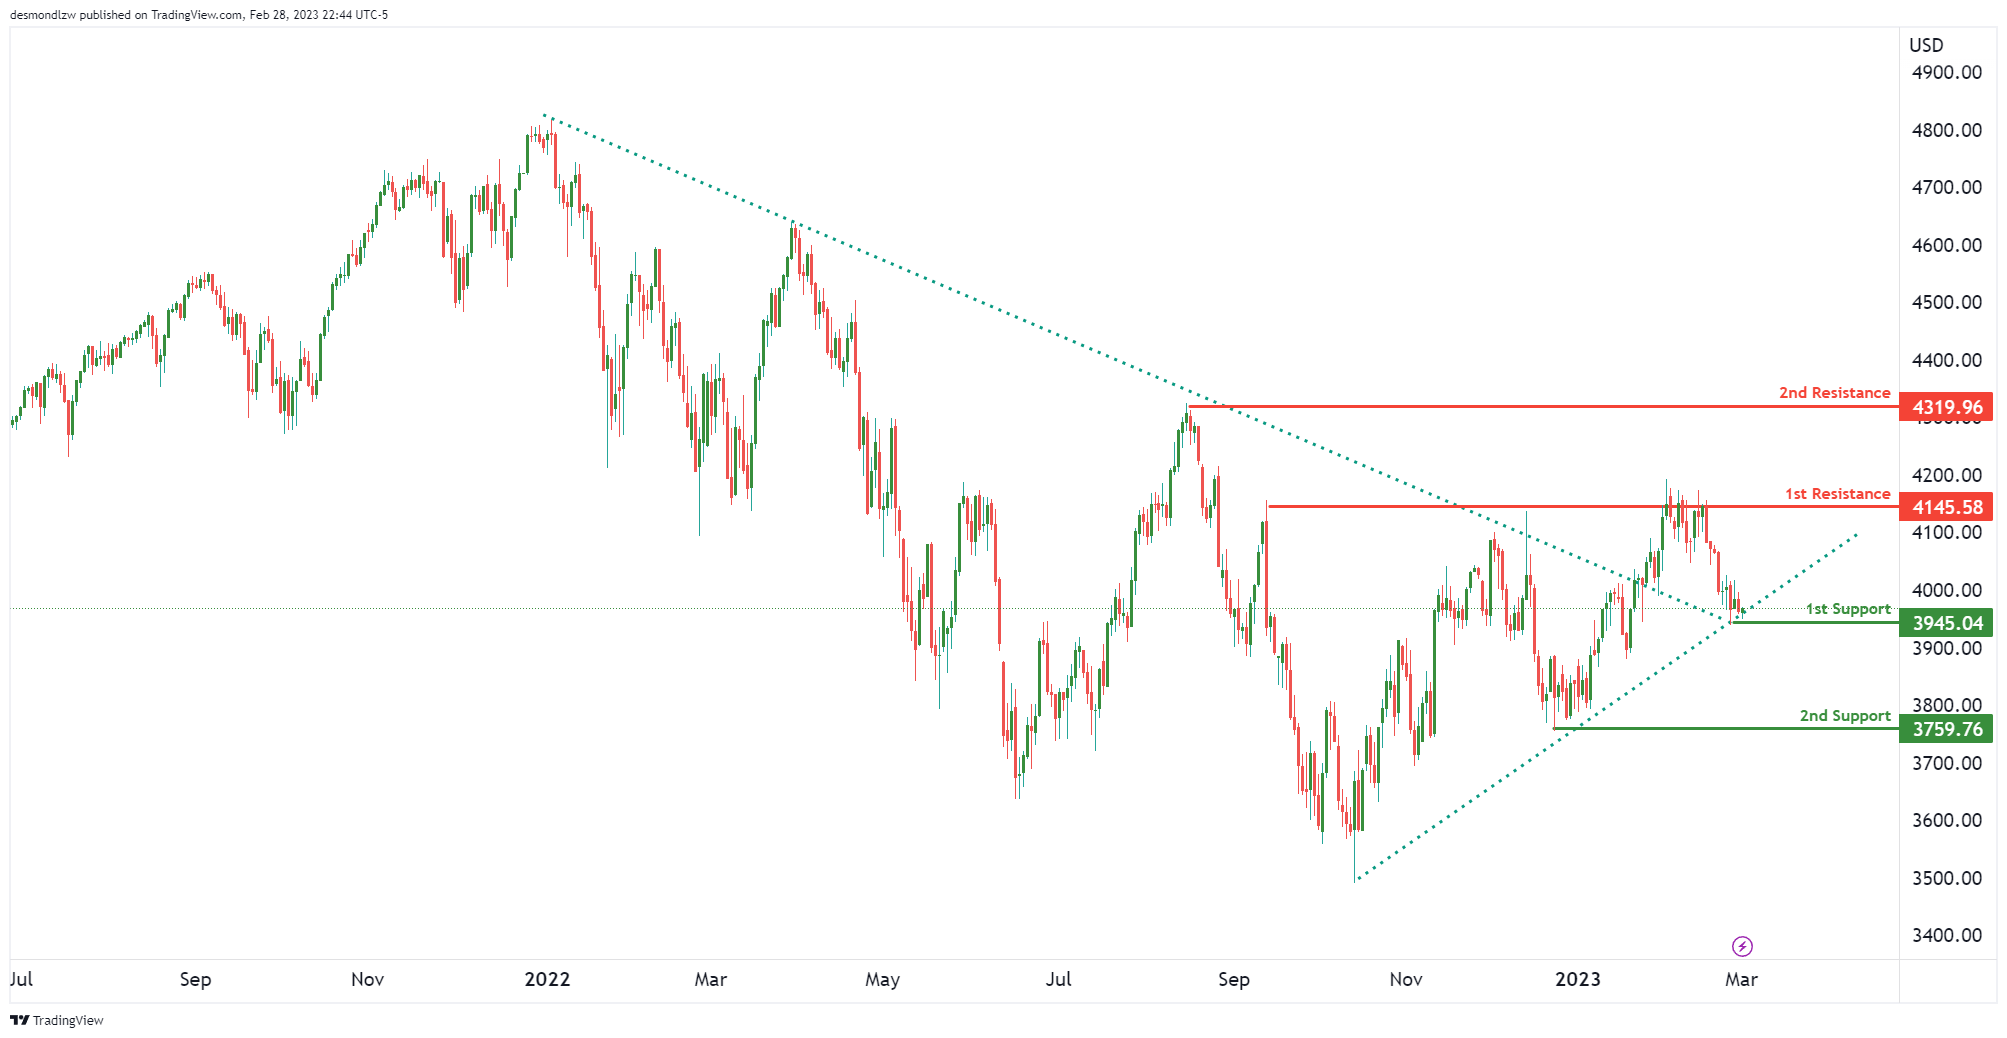
Price has broken our of our long term descending resistance-turned-support line and is also seeing a short term support line holding prices up quite nicely. Our 1st support is at 3945 and a bounce from here could see prices rise up to 4145 which is our 1st resistance htat lines up with multiple swing highs.
If prices were to break the ascending support line and our 1st support, we could see prices drop to the 2nd support at 3759 which lines up with a recent swing low.
BTC/USD:
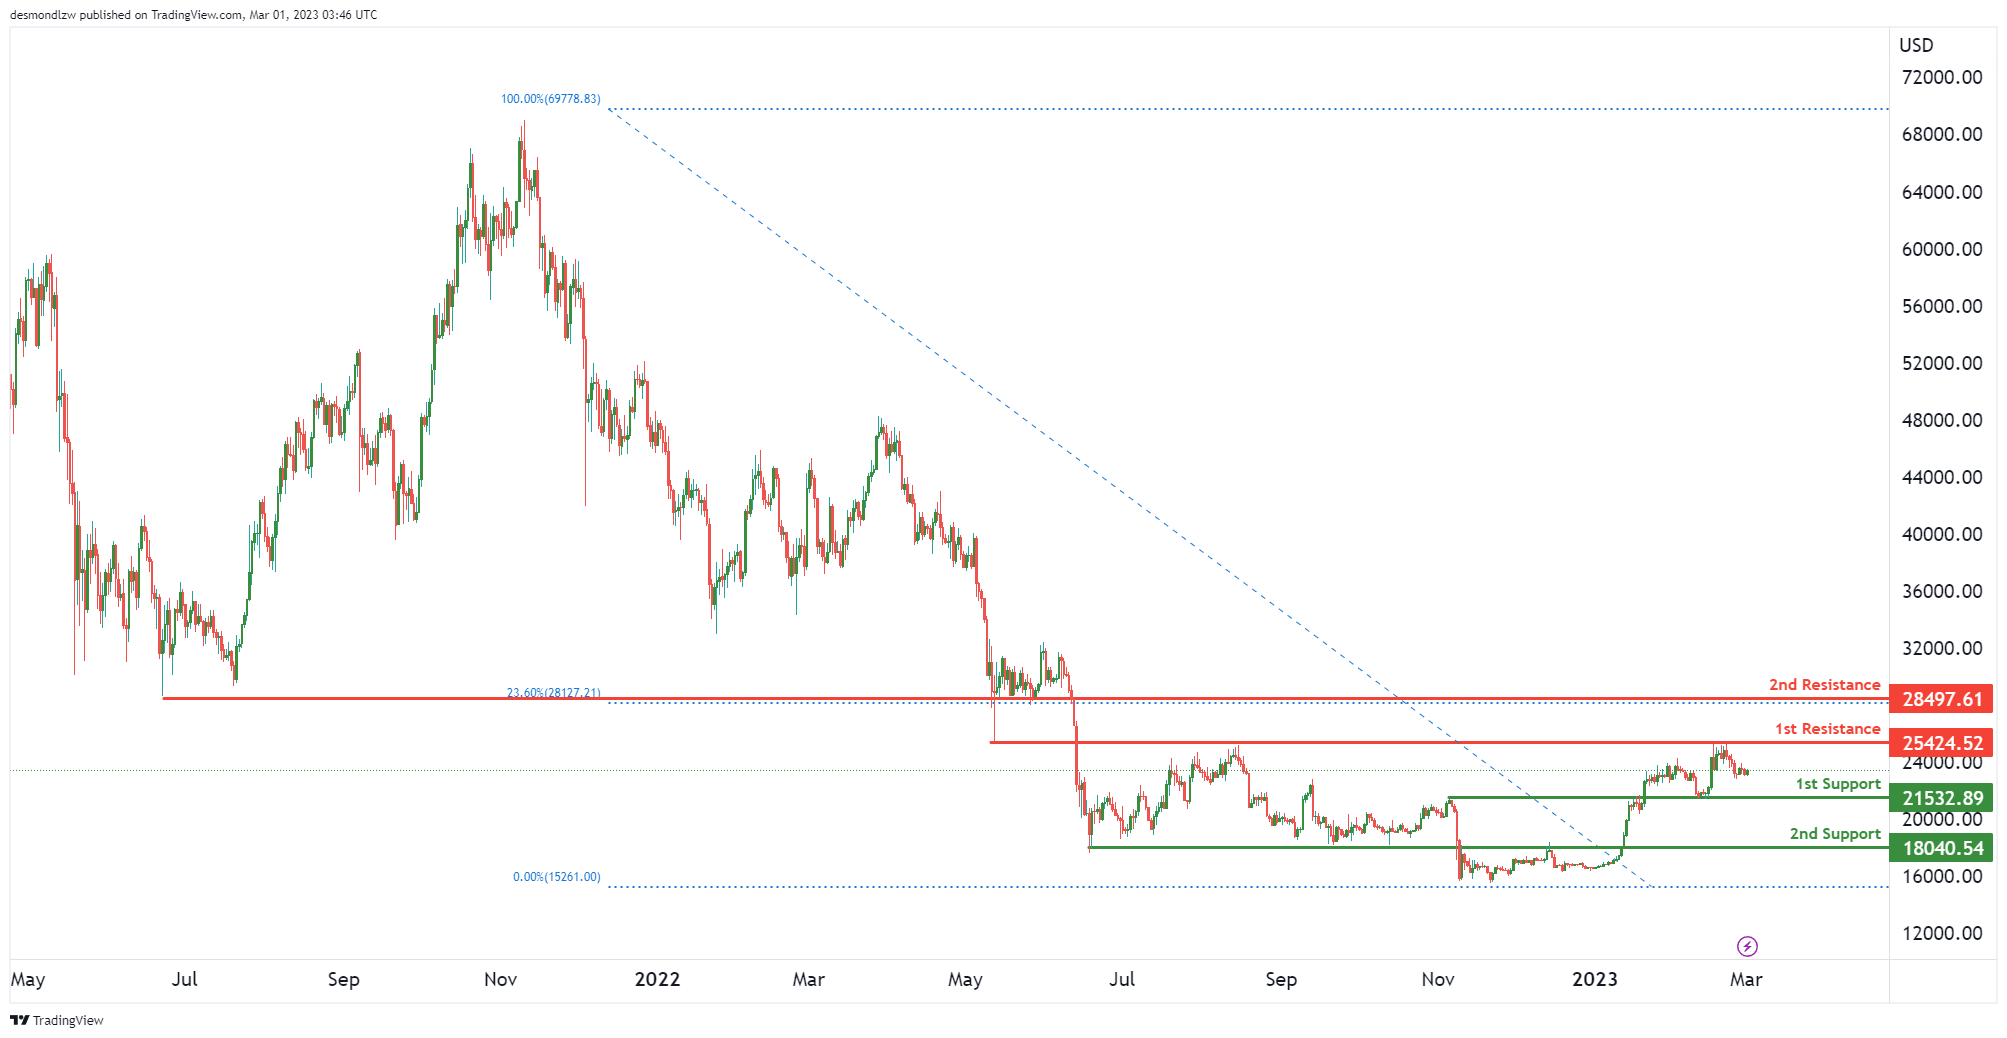
Price is in a bit of a range with the 1st key resistance at 25424 – which is an overlap resistance. If price were to break through this level, we could see it rise quite nicely to our 2nd resistance at 28497 which is a 23.6% Fibonacci retracement.
Our 1st support is at 21532 and a break of this level could see prices drop to 18040 – a strong overlap support.
ETH/USD:
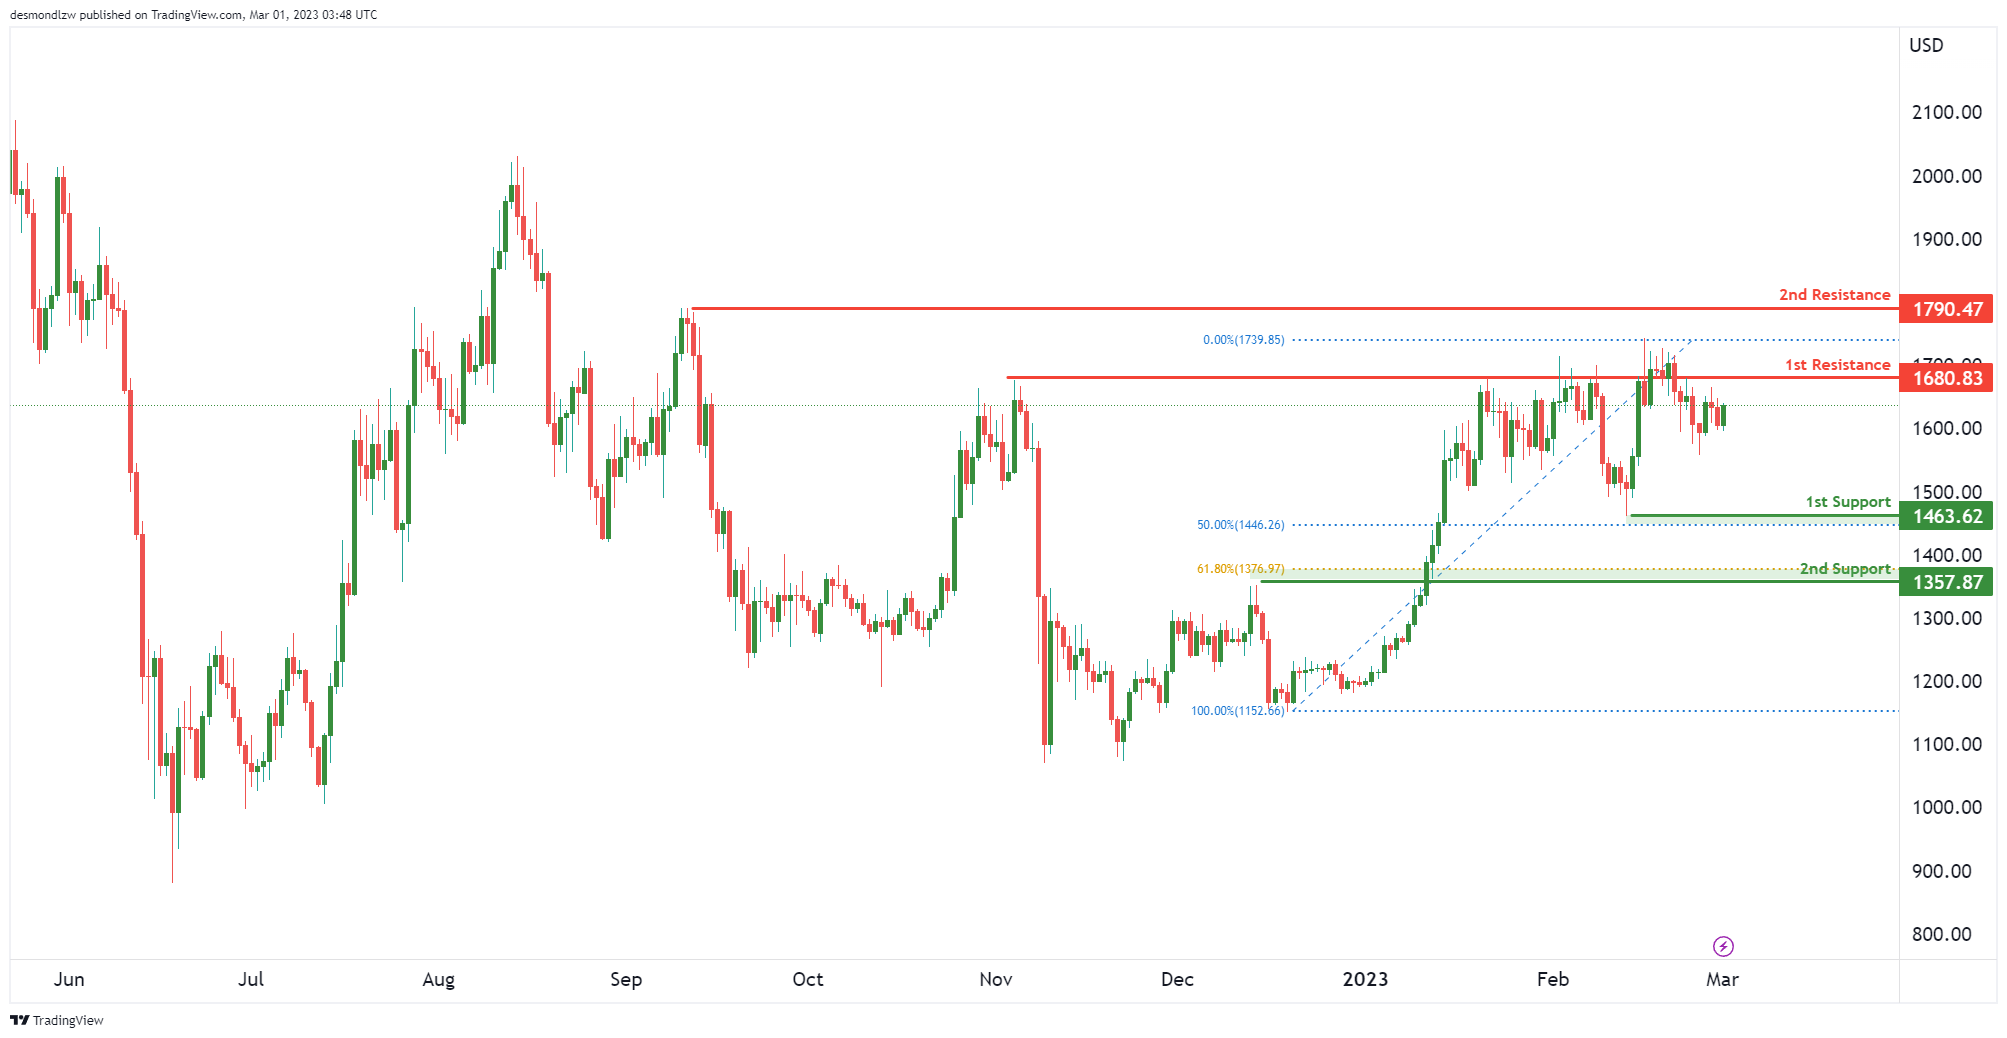
Price is testing a key resistance at 1680 which is a swing high resistance. A reversal from here could see prices first test the 1st support at 1463 which lines up with a 50% Fibonacci retracement and if prices were to break that, the next support would be a pullback support at 1357 that lines up with a 61.8% Fibonacci retracement.
BCO/USD:
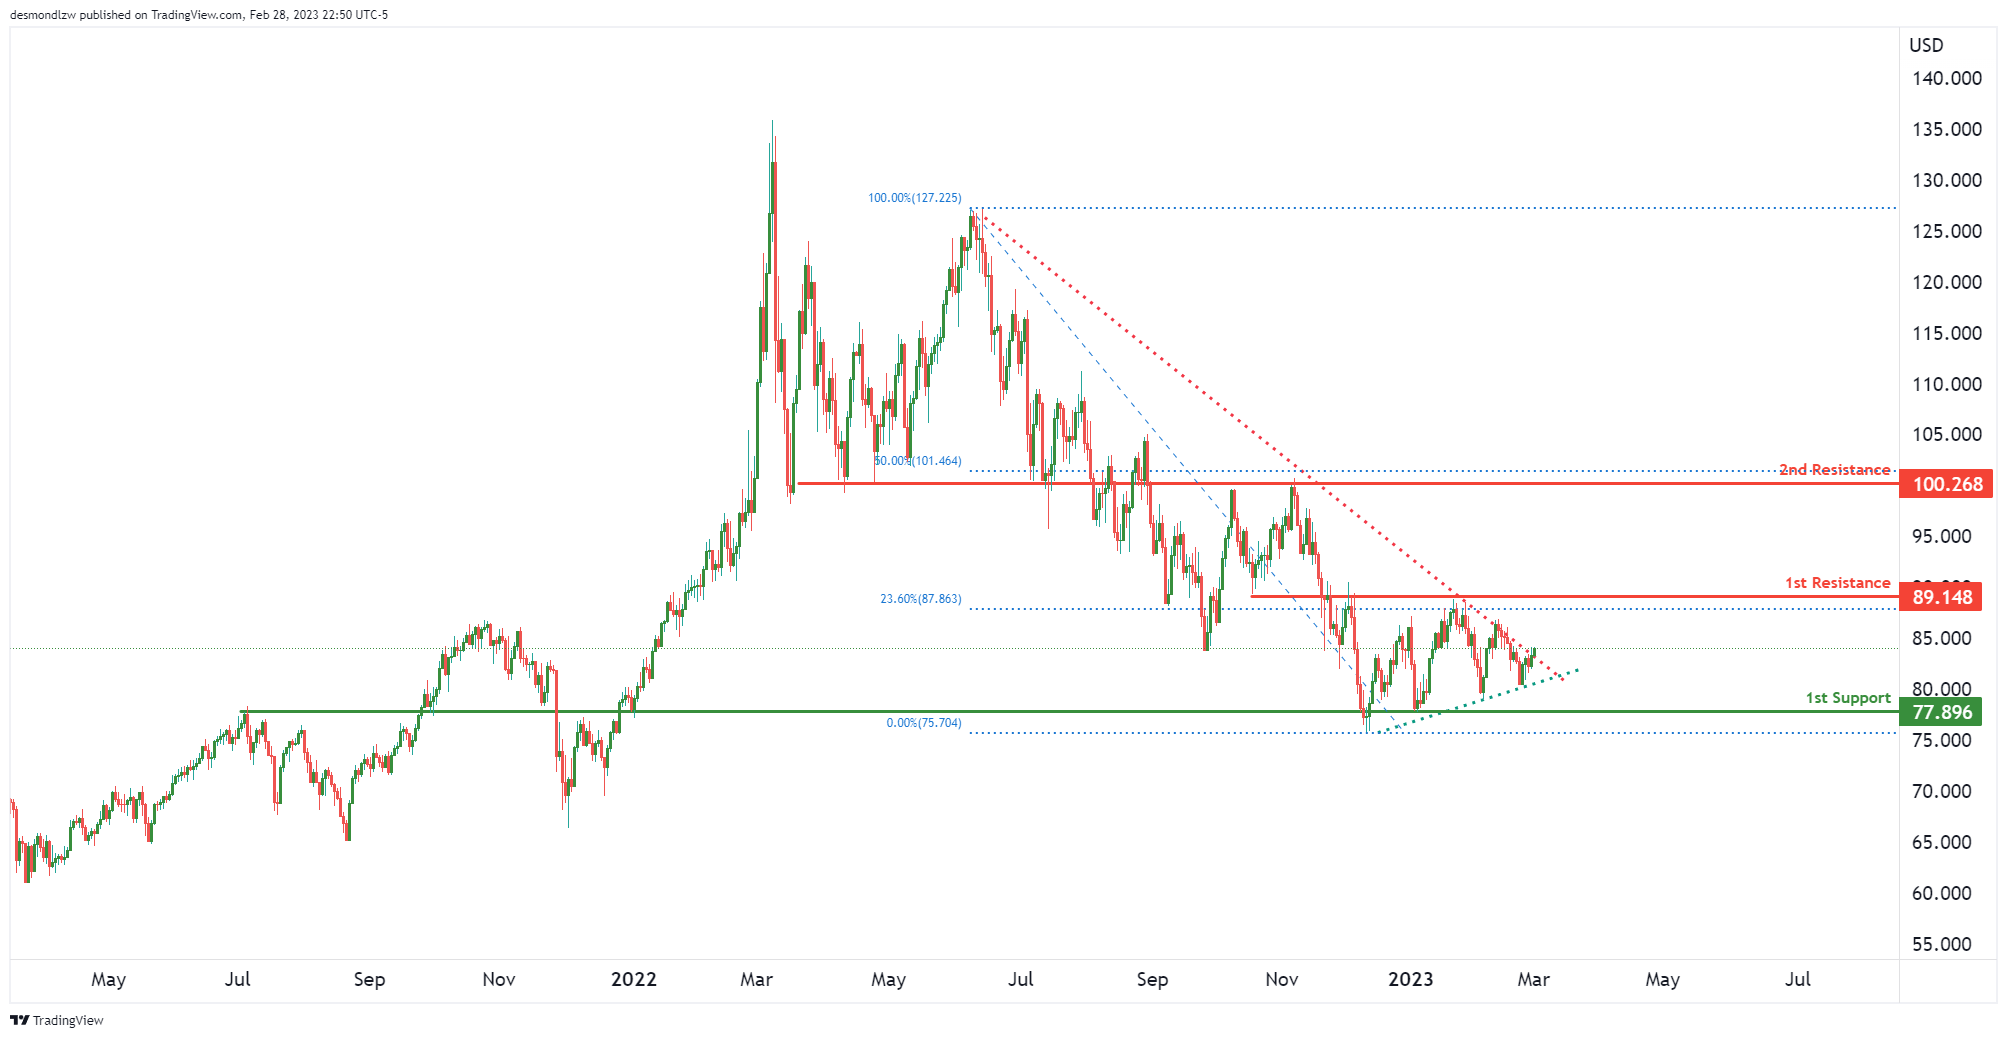
We’re seeing price being squeezed from an ascending support and a descending resistance. In terms of key levels, the 1st key resistance is at 89.14 which is an overlap resistance lining up with a 23.6% Fibonacci retracement. Breaking that level could suggest prices might make a push up to 2nd resistance at 100.26 which is the 50% Fibonacci retracement.
In terms of support levels, the key one we’re looking at is at 77.89 which is an overlap support.
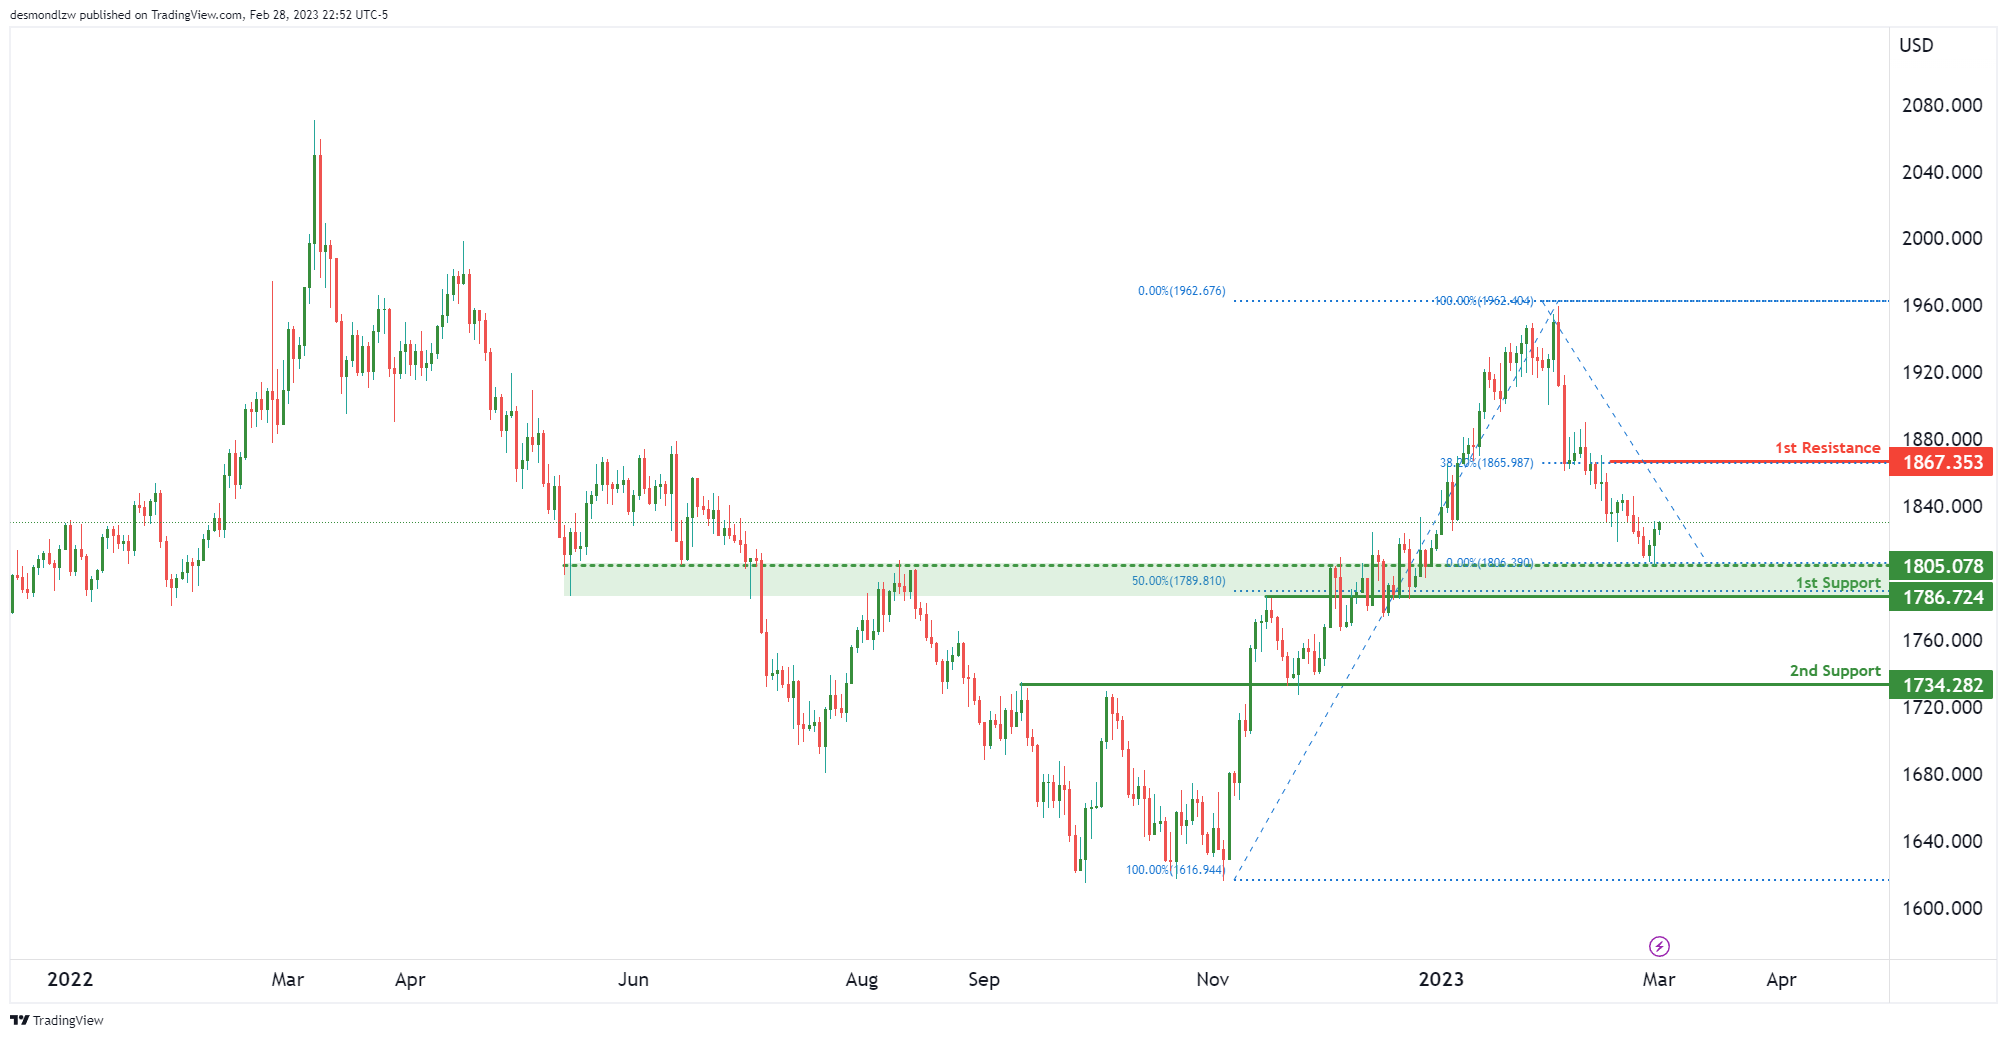
XAU/USD (GOLD):
Price is testing a key 1st support at 1786 area which is a 50% Fibonacci retracement lining up with an overlap support. If price were to bounce from here, it could potentially rise to 1st resistance at 1867 which is a 38.2% Fibonacci retracement.
Breaking the 1st support might trigger a move down to 2nd support at 1734 – this is an overlap support that is slightly below the key 61.8% Fibonacci retracement.
China PMI manufacturing rose to 52.6, highest since 2012
China official PMI Manufacturing rose from 50.1 to 52.6, above expectation of 50.7. That's also the highest reading since April 2012. PMI Non-Manufacturing rose from 54.4 to 56.3, highest since March 2021. PMI Composite rose from 52.9 to 56.4.
"In February, the economic stabilisation policy measures further took effect, coupled with the epidemic's impact receding and other favourable factors, the speed of enterprises to resume production accelerated, meaning China's economic prosperity level continued to rebound," said senior NBS statistician Zhao Qinghe.
Also released, Caixin PMI Manufacturing rose from 49.2 to 51.6 in February, slightly above expectation of 51.3. That the first expansion reading in 7 months, and the second-highest since May 2021. Caixin added there were renewed increases in output, new orders and employment. Suppliers' delivery times improved at the quickest rate for eight years. Business confidence also strengthened to near two-year high.
Japan PMI manufacturing finalized at 47.7 in Feb, continually deteriorating activity
Japan PMI Manufacturing was finalized at 47.7 in February, down from January's 48.9. That's also the worst reading since September 2020. S&P Global also noted that backlogs of work decreased at quickest pace for 29 months. Input prices had the slowest rise for a year-and-a-half.
Usamah Bhatti, Economist at S&P Global Market Intelligence, said: "Latest data pointed to continually deteriorating activity in the Japanese manufacturing sector midway through the first quarter of 2023. Both new orders and production levels, which make up 55% of the headline PMI figure, fell at the fastest pace since July 2020 as weak domestic demand and a global economic slowdown hindered sales and output volumes.
"Moreover, the dip is likely to be sustained in the near-term as the absence of new orders amid dampened client confidence lifted capacity pressure on manufacturers further and led to the sharpest reduction in outstanding business in nearly two-and- a-half years."