

Sample Category Title
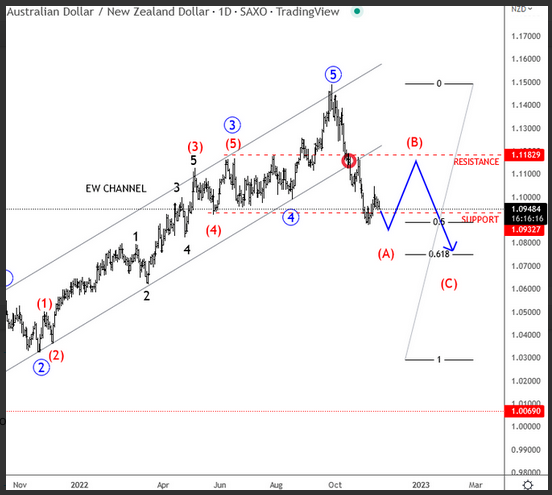
AUDNZD Turning Bearish, More Weakness after Rally
AUDNZD has been trading nicely higher since start of the year and formed a clear bullish impulse. Notice that price also reached the upper trendline of an EW channel which is usually the ending point of a higher degree structure. We talked about this in our past updates and warned about a bearish turning point which is now in full progress and will most likely resume much lower as pair came sharply out of an upward channel. However, nothing moves in a straight line, so ideally wave A is now approaching some support, thus we can see a rally in (B) in the next few weeks.
AUD/USD Daily Report
Daily Pivots: (S1) 0.6711; (P) 0.6752; (R1) 0.6784; More...
A temporary top is in place at 0.6796 with current retreat. Intraday bias in AUD/USD is turned neutral for consolidations. Further rally is expected as long as 0.6521 resistance turned support holds. Above 0.6796 will resume the rise from 0.6169 to 0.6871 fibonacci level.
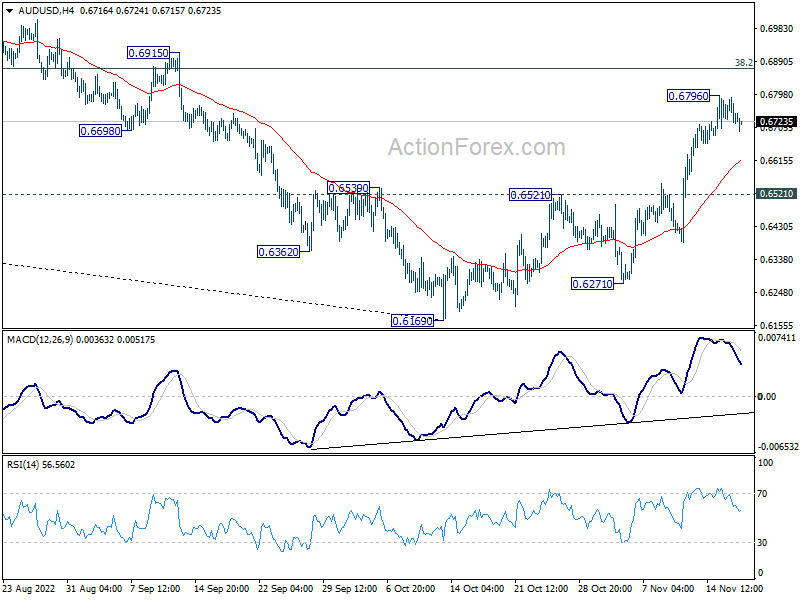
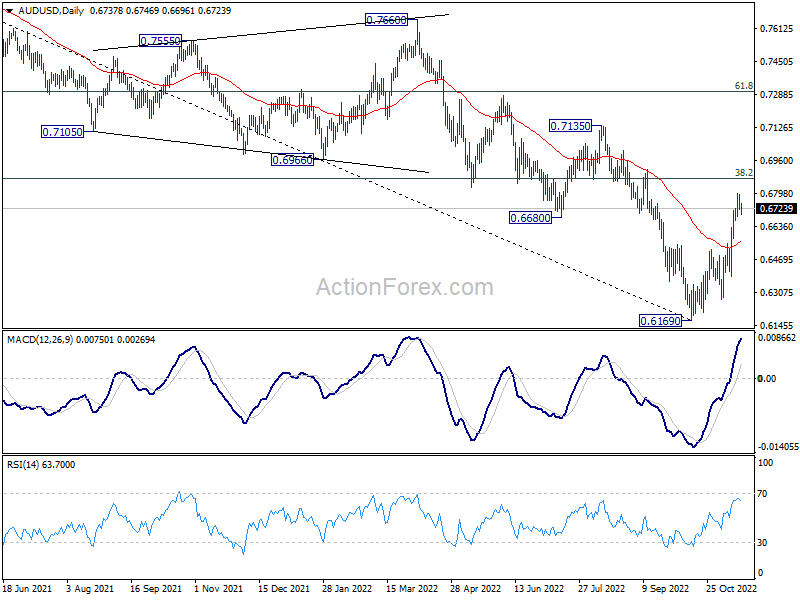
In the bigger picture, the break of 0.6680 support turned resistance confirms medium term bottoming at 0.6169. It's too early to call for trend reversal. But even as a corrective move, rise from 0.6169 should target 38.2% retracement of 0.8006 to 0.6169 at 0.6871. Sustained trading above 55 week EMA (now at 0.6934) will raise the chance of the start of a bullish up trend. This week now remain the favored case as long as 0.6521 resistance turned support holds.
Aussie Dips Despite Solid Job Data, Markets in Consolidations
The forex markets are still engaging in corrective trading in Asian session today. Despite stronger than expected job data, Aussie trades lower following mild risk-off sentiment. Kiwi, Loonie and Sterling are are softer. On the other hand, Dollar, Yen and Swiss Franc are the firmer ones, while Euro is mixed. For now, the selling in Dollar should have been exhausted, and consolidation would likely extend for a while. The question is how much the greenback could recover during this phase.
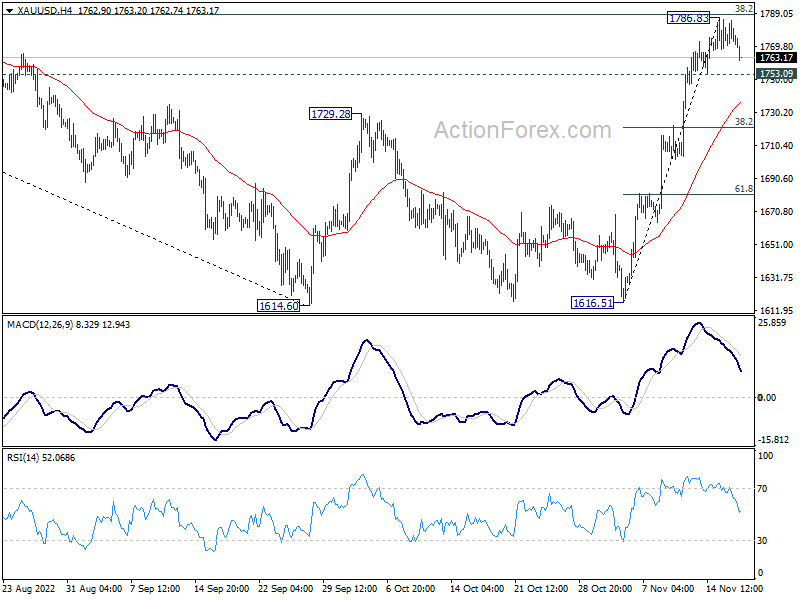
Technically, Gold's development is so far in line with expectation. 1768.83 looks increasing likely a short term top, just ahead of 38.2% retracement of 2070.06 to 1614.60 at 1788.58. Break of 1753.09 minor support will bring deeper fall to 4 hour 55 EMA (now at 1734.49). The key line of defense will be at 38.2% retracement of 1616.51 to 1786.83 at 1721.76. As long as this fibonacci support holds, another rise is still in favor, and that will suggests that recovery in Dollar would be limited.
In Asia, at the time of writing, Nikkei is down -0.31%. Hong Kong HSI is down -2.21%. China Shanghai SSE is down-0.68%. Singapore Strait Times is up 0.53%. Japan 10-year JGB yield is up 0.0004 at 0.246. Overnight, DOW dropped -0.12%. S&P 500 dropped -0.83%. NASDAQ dropped -1.54%. 10-year yield drooped -0.0107 to 3.692.
Fed Waller more comfortable to hike 50bps in Dec, but no judgement before more data
Fed Governor Christopher Waller said in a speech that while the slowdown in CPI in October was "welcome news", "we must be cautious about reading too much into one inflation report"
"I don't know how sustained this deceleration in consumer prices will be," he said. And, it's "way too early to conclude that inflation is headed sustainably down"
Despite raising interest rates from near 0% to 3.75-4.00% in nine months, "policy is barely in restrictive territory today, so more interest rate hikes are needed to get inflation down," he said.
"The Committee will reach the terminal rate well before inflation reaches 2 percent because of the abundance of evidence that it takes months, and perhaps even longer, for the full effects of a rate increase to work through the economy."
"Looking toward the FOMC's December meeting, the data of the past few weeks have made me more comfortable considering stepping down to a 50-basis-point hike. But I won't be making a judgement about that until I see more data, including the next PCE inflation report and the next jobs report."
BoJ Kuroda: May take a long time to achieve price stability with wage hikes
BoJ Governor Haruhiko Kuroda told the parliament that it may "take a long time" to achieve the "price stability target, involving wage hikes". He reiterated that the central bank needs to continue with its monetary easing to support a fragile recovery.
At the same session, Executive Director Shinichi Uchida said it was too early to discuss exit from monetary stimulus. "When exiting, the point will be adjusting long-term and short-term policy rates and the BoJ's balance sheet," Uchida said. "The order and mixture of those factors would differ depending on economy, prices and financial situations at the time."
Japan trade deficit hit another record as import surged
Japan's exports rose 25.3% yoy to JPY 9.00T in October, after shipments of cars and electronics components increased. Imports rose 53.5% yoy to JPY 11.16T, hitting a historical high, as led by crude oil, liquefied natural gas and coal.
Trade deficit came in at JPY -2.16T, a record for the month. Also, Japan has seen as record trade deficit for each month in the past six months, on rising energy and raw material costs, as well as weak Yen exchange rates.
US-bound exports rose 36.5% yoy to JPY 1.78T while imports rose 47.1% yoy to JPY 1.06T. Exports to China rose 7.7% yoy to JPY 1.72T while imports rose 39.3% yoy to JPY 2.39T.
In seasonally adjusted term, exports rose 2.2% mom to JPY 8.91T. Imports rose 4.2% mom to JPY 11.21T. Trade deficit came in at JPY -2.30T.
Australia employment grew 32.3k in Oct, unemployment rate dropped to 3.4%
Australia employment rose 32.2k in October, above expectation of 15.0k. Unemployment rate dropped from 3.5% to 3.4%, below expectation of 3.5%. Participation rate was unchanged at 66.5%. Monthly hours worked in all jobs rose 2.3% mom.
"Although employment in seasonally adjusted terms rose 0.2 per cent in October 2022, the underlying trend estimate was monthly growth of around 0.12 per cent. This was below the average for the 20 years prior to the pandemic of 0.16 per cent," Bjorn Jarvis, head of labour statistics at the ABS said.
"This indicates that while employment has continued to grow, the rate of growth has slowed to below the longer-term average. It has been below this average for the past 5 months."
Looking ahead
Swiss trade balance, Italy trade balance, and Eurozone CPI final will be released in European session. Later in the day, US will release building permits and housing starts, jobless claims, and Philly Fed survey.
AUD/USD Daily Report
Daily Pivots: (S1) 0.6711; (P) 0.6752; (R1) 0.6784; More...
A temporary top is in place at 0.6796 with current retreat. Intraday bias in AUD/USD is turned neutral for consolidations. Further rally is expected as long as 0.6521 resistance turned support holds. Above 0.6796 will resume the rise from 0.6169 to 0.6871 fibonacci level.
In the bigger picture, the break of 0.6680 support turned resistance confirms medium term bottoming at 0.6169. It's too early to call for trend reversal. But even as a corrective move, rise from 0.6169 should target 38.2% retracement of 0.8006 to 0.6169 at 0.6871. Sustained trading above 55 week EMA (now at 0.6934) will raise the chance of the start of a bullish up trend. This week now remain the favored case as long as 0.6521 resistance turned support holds.
Economic Indicators Update
| GMT | Ccy | Events | Actual | Forecast | Previous | Revised |
|---|---|---|---|---|---|---|
| 21:45 | NZD | PPI Input Q/Q Q3 | 0.80% | 2.60% | 3.10% | |
| 21:45 | NZD | PPI Output Q/Q Q3 | 1.60% | 2.10% | 2.40% | |
| 23:50 | JPY | Trade Balance (JPY) Oct | -2.30T | -2.23T | -2.01T | -2.04T |
| 00:30 | AUD | Employment Change Oct | 32.2K | 15.0K | 0.9K | -3.8K |
| 00:30 | AUD | Unemployment Rate Oct | 3.40% | 3.50% | 3.50% | |
| 07:00 | CHF | Trade Balance (CHF) Oct | 3.70B | 4.0B | ||
| 09:00 | EUR | Italy Trade Balance (EUR) Sep | -4.05B | -9.57B | ||
| 10:00 | EUR | Eurozone CPI Y/Y Oct F | 10.70% | 10.70% | ||
| 10:00 | EUR | Eurozone CPI Core Y/Y Oct F | 5.00% | 5.00% | ||
| 13:30 | USD | Building Permits Oct | 1.52M | 1.56M | ||
| 13:30 | USD | Housing Starts Oct | 1.42M | 1.44M | ||
| 13:30 | USD | Initial Jobless Claims (Nov 11) | 220K | 225K | ||
| 13:30 | USD | Philadelphia Fed Survey Nov | -6 | -8.7 | ||
| 15:30 | USD | Natural Gas Storage | 66B | 79B |
Technical Outlook and Review
USD/JPY:
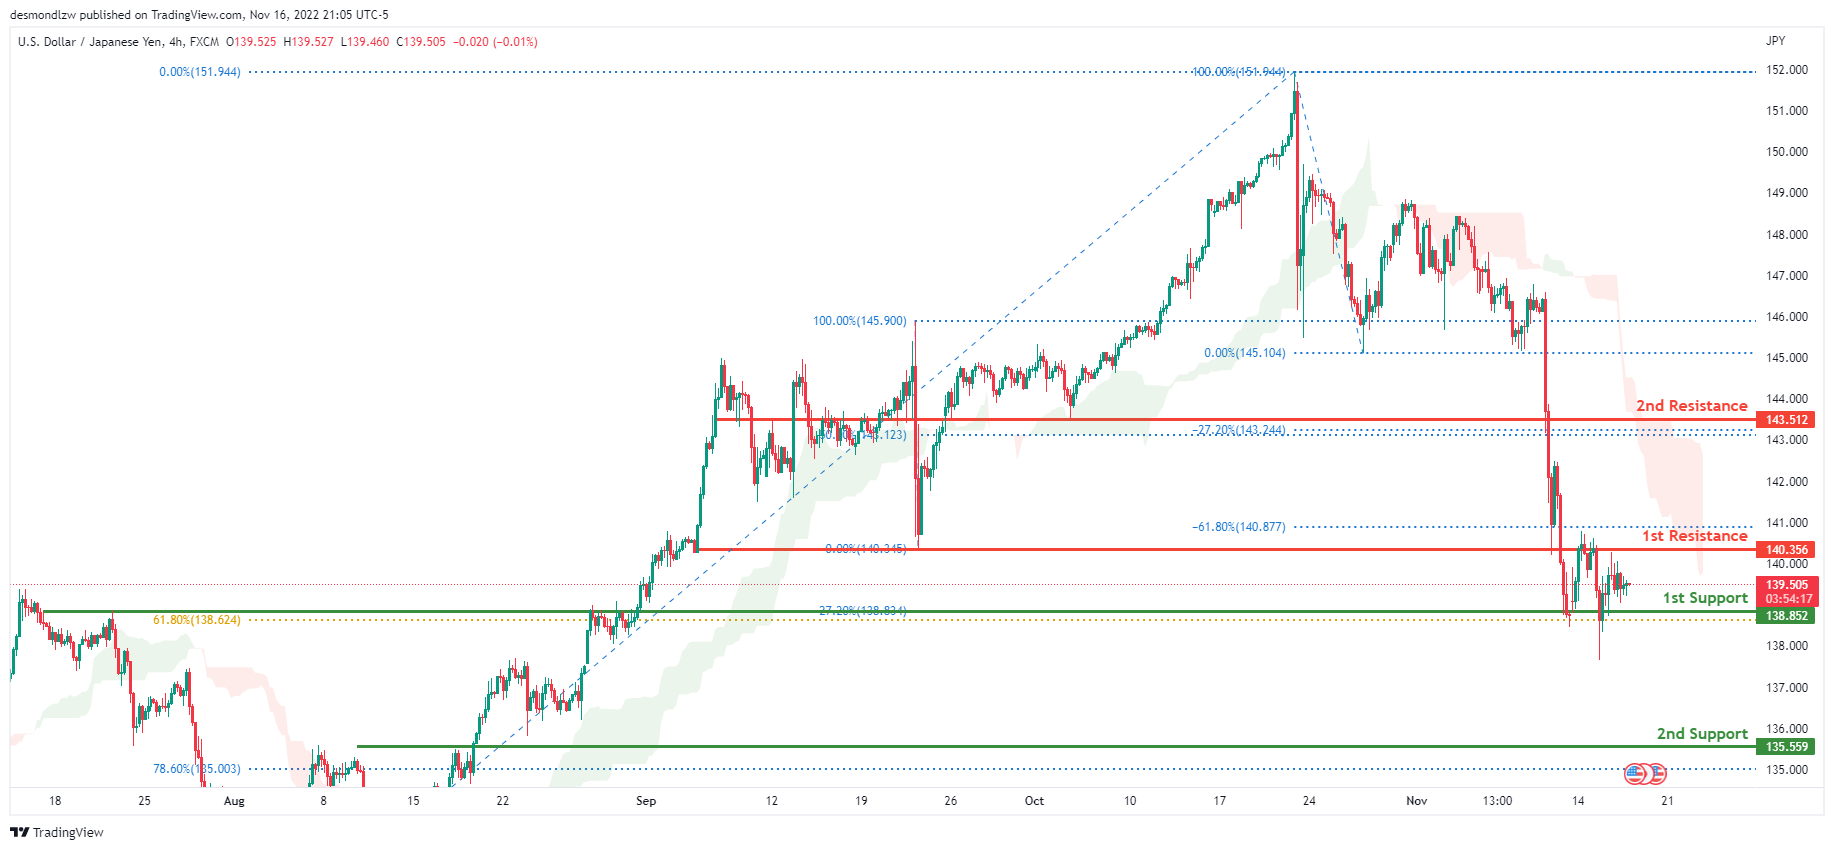
The current general bias for USDJPY on the H4 chart is bearish. To add confluence to this, the price is below the Ichimoku cloud which indicates a bearish market. If the bearish momentum continues, expect USDJPY to break the 1st support line at 138.852 where the -27.2% Fibonacci expansion line is located and head towards the 2nd support line at 135.554 where the 78.6% Fibonacci line is located. In an alternative scenario, price could go back up to break the 1st resistance at 140.356, where the -61.8% Fibonacci expansion line and previous low are located before heading towards the 2nd resistance line at 143.512 where the -27.2% Fibonacci expansion line and 50% Fibonacci line are located.
Areas of consideration:
- H4 time frame, 1st resistance at 140.356
- H4 time frame, 2nd resistance at 143.512
- H4 time frame, 1st support at 138.852
- H4 time frame, 2nd support at 135.554
DXY:
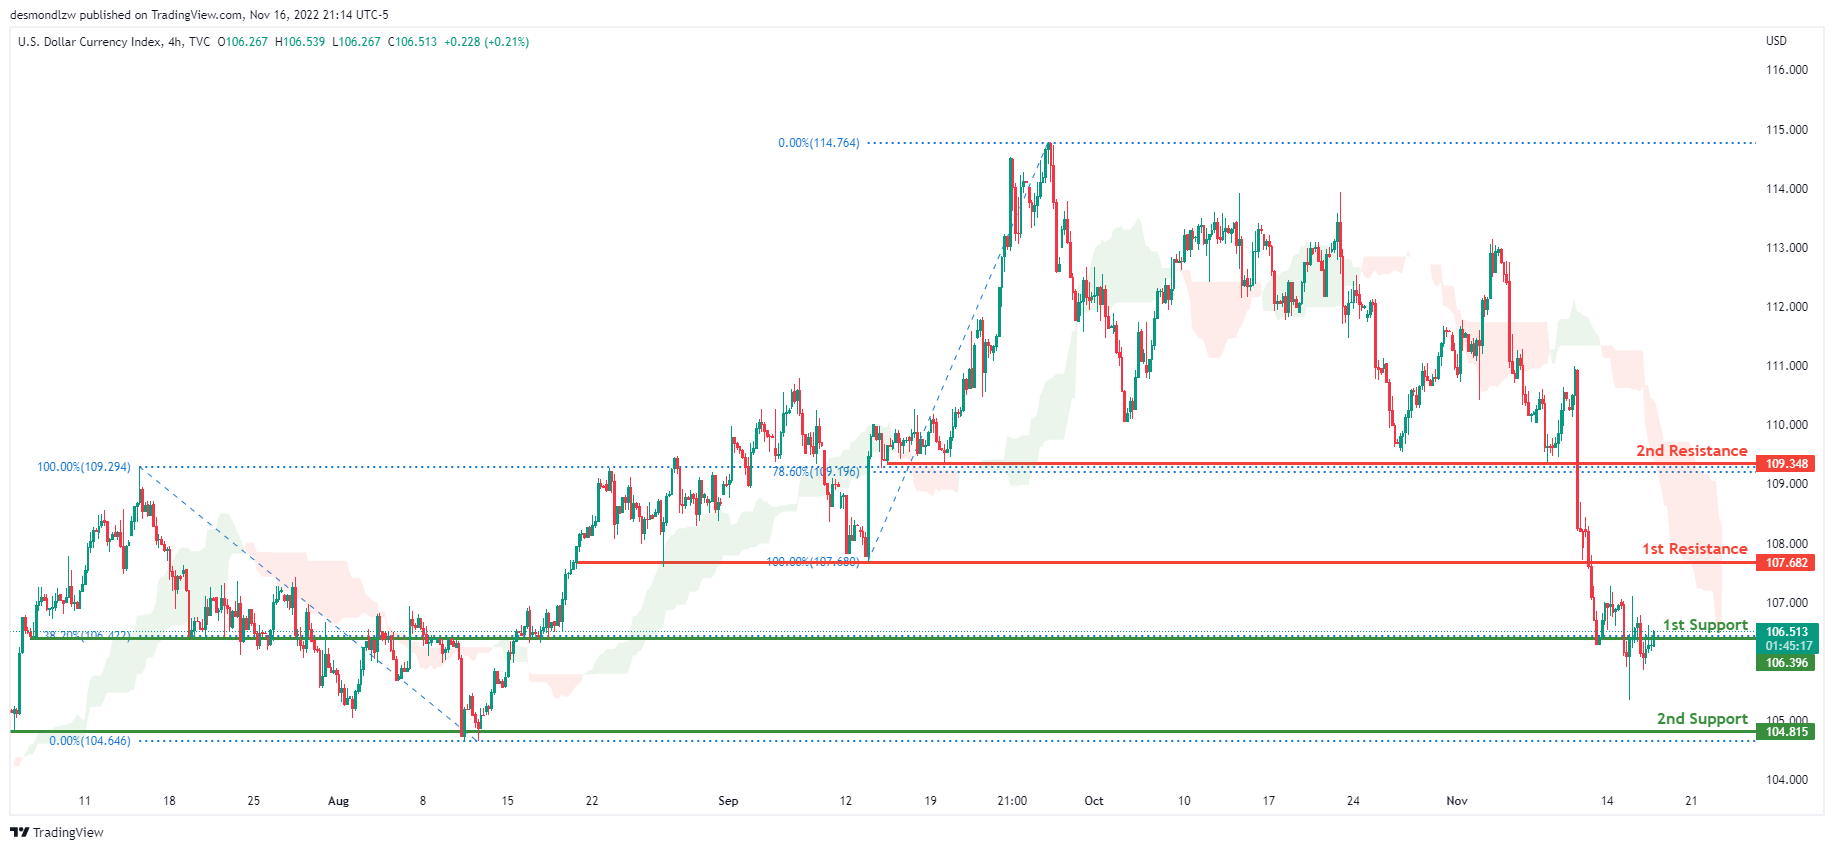
On the H4 chart, the overall bias for DXY is bearish. To add confluence to this, the price is below the Ichimoku cloud which indicates a bearish market. If this bearish momentum continues, price could break the 1st support line at 106.396 where the 38.2% fibonacci line is located, before heading towards the 2nd support at 104.815 where the previous low and the 0% Fibonacci line are located. In an alternative scenario, price could head back up and retest the 1st resistance line at 107.682, where the previous low and 100% Fibonacci line are located.
Areas of consideration:
- H4 time frame, 1st resistance at 107.682
- H4 time frame, 1st support at 106.396
- H4 time frame, 2nd support at 104.815
EUR/USD:
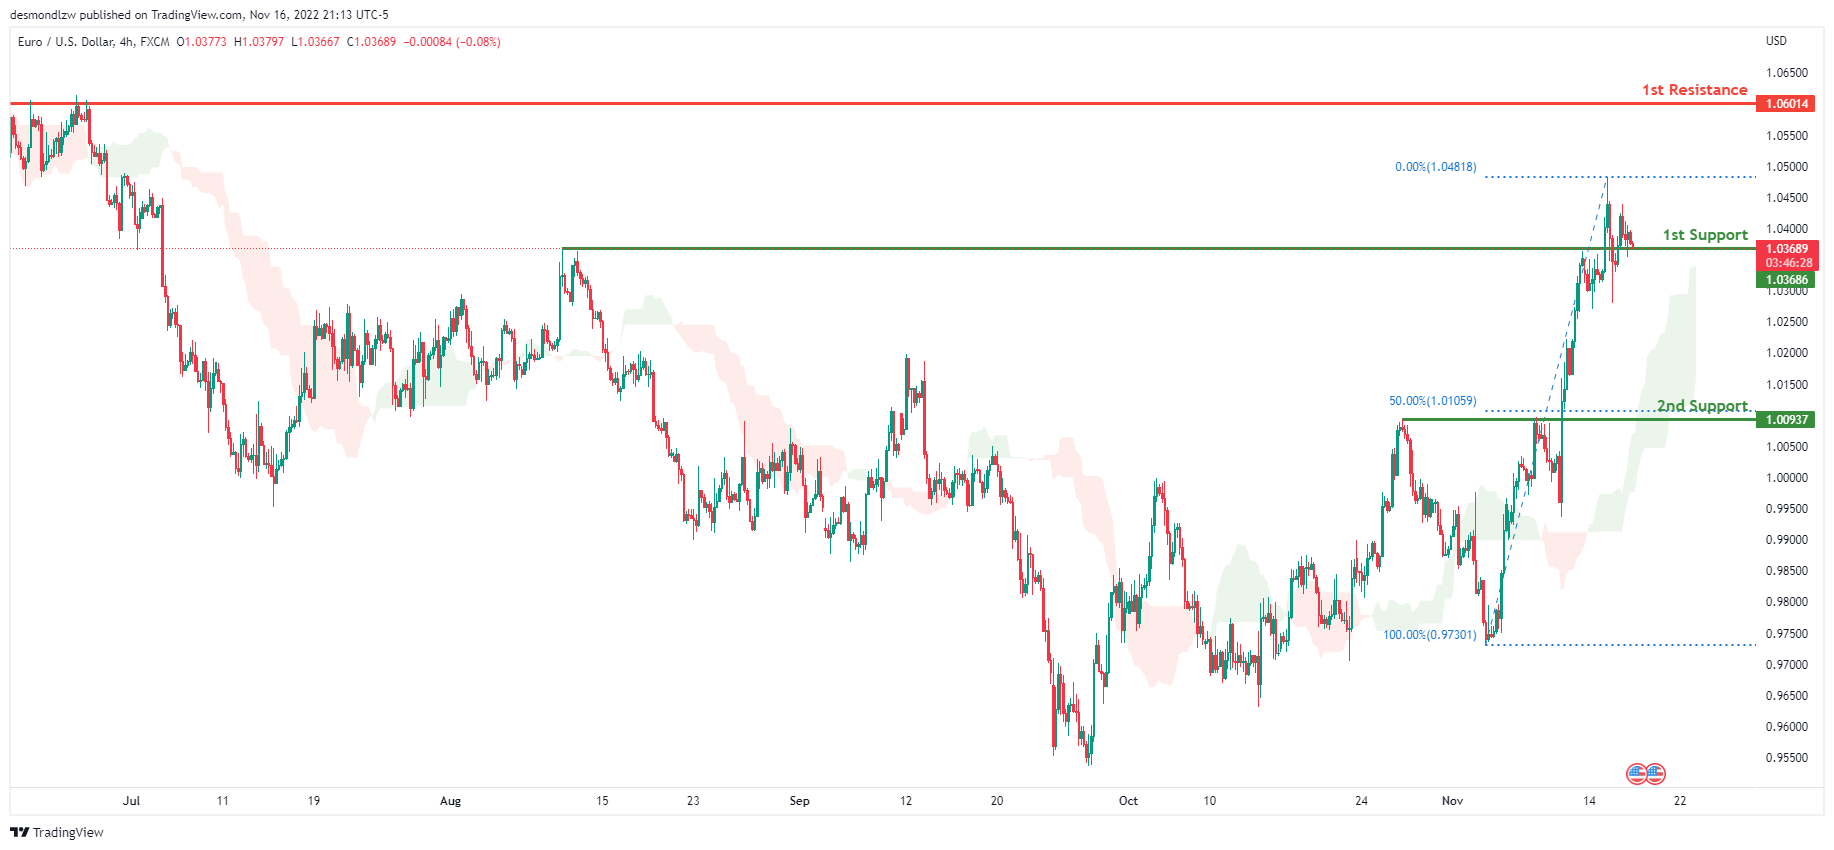
On H4, with the price moving above the ichimoku cloud, we have a bullish bias that the price may head towards the first resistance level at 1.06014, the previous swing high is. Alternatively, the price could break the first support level at 1.03686, which corresponds to the previous swing high and the 0% fibonacci extension, before heading towards the 2nd support at 1.00937 where the 50% Fibonacci lies.
Areas of consideration :
- H4 1st resistance at 1.06014
- H4 1st support at 1.03686
- H4 2nd support at 1.00937
GBP/USD:
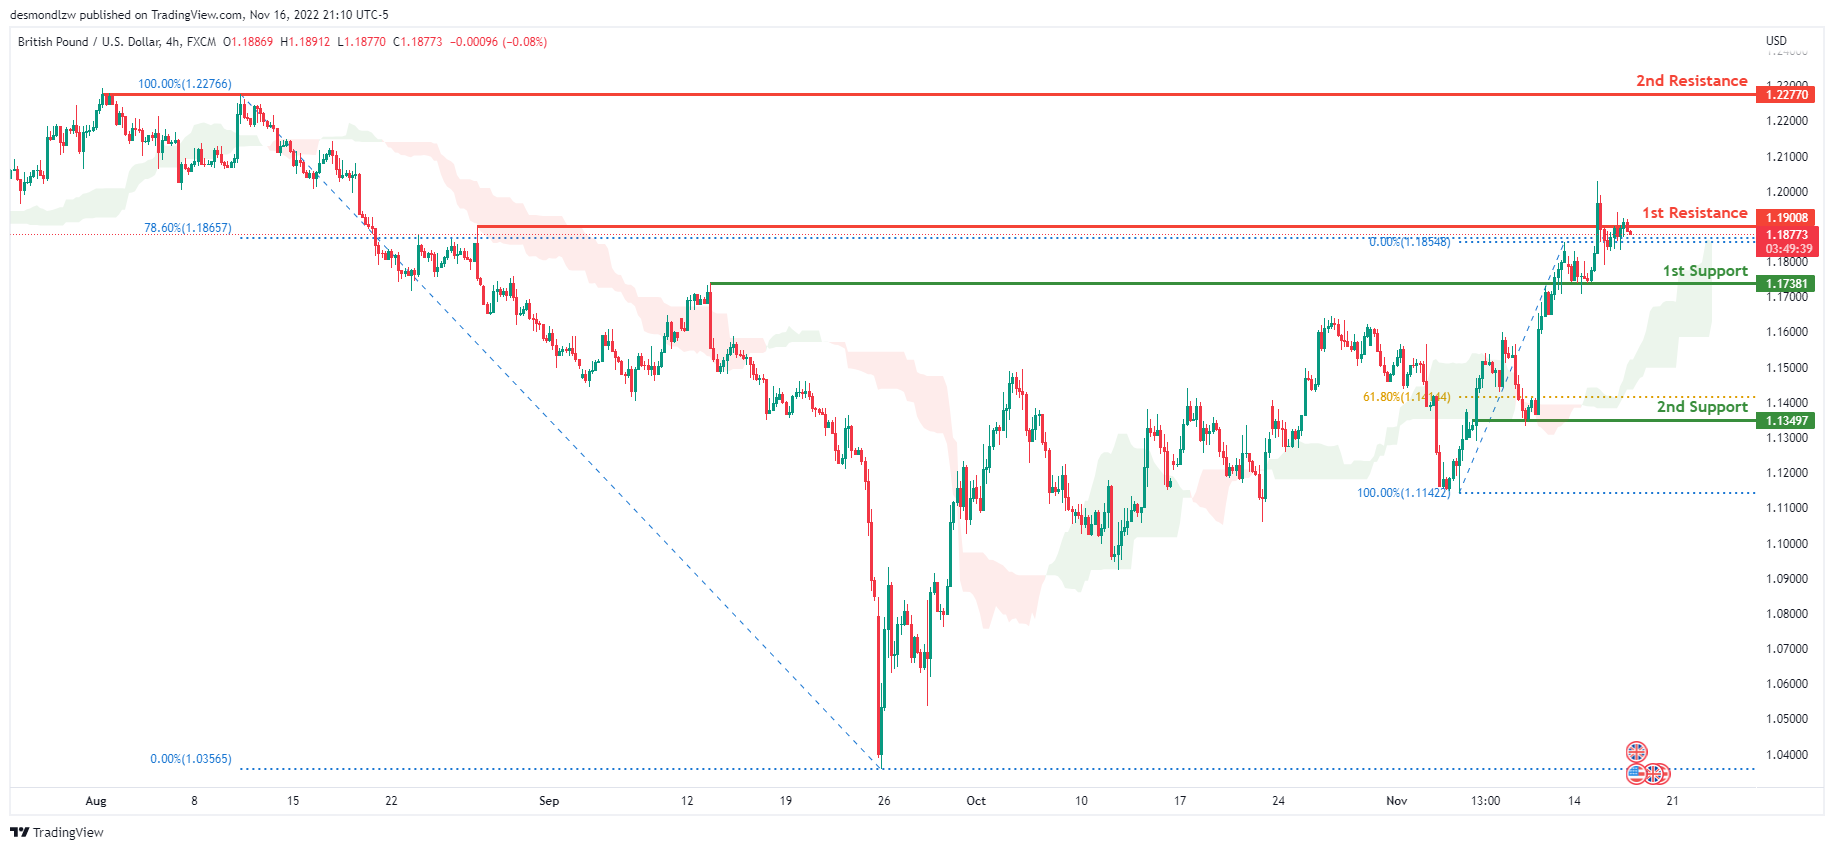
On the H4, the price is moving above the ichimoku cloud, suggesting that the price may break the first resistance level at 1.19008, which corresponds to the 78.6% fibonacci and the previous swing high, before heading to the 2nd resistance line at 1.22770, where the previous swing high is. Alternatively, the price may break the first support level at 1.17381, which is the previous swing high, before moving on to the second support level at 1.13497, which is the 61.8% Fibonacci line.
Areas of consideration:
- H4 1st resistance at 1.19008
- H4 2nd resistance at 1.22770
- H4 1st support at 1.17381
USD/CHF:
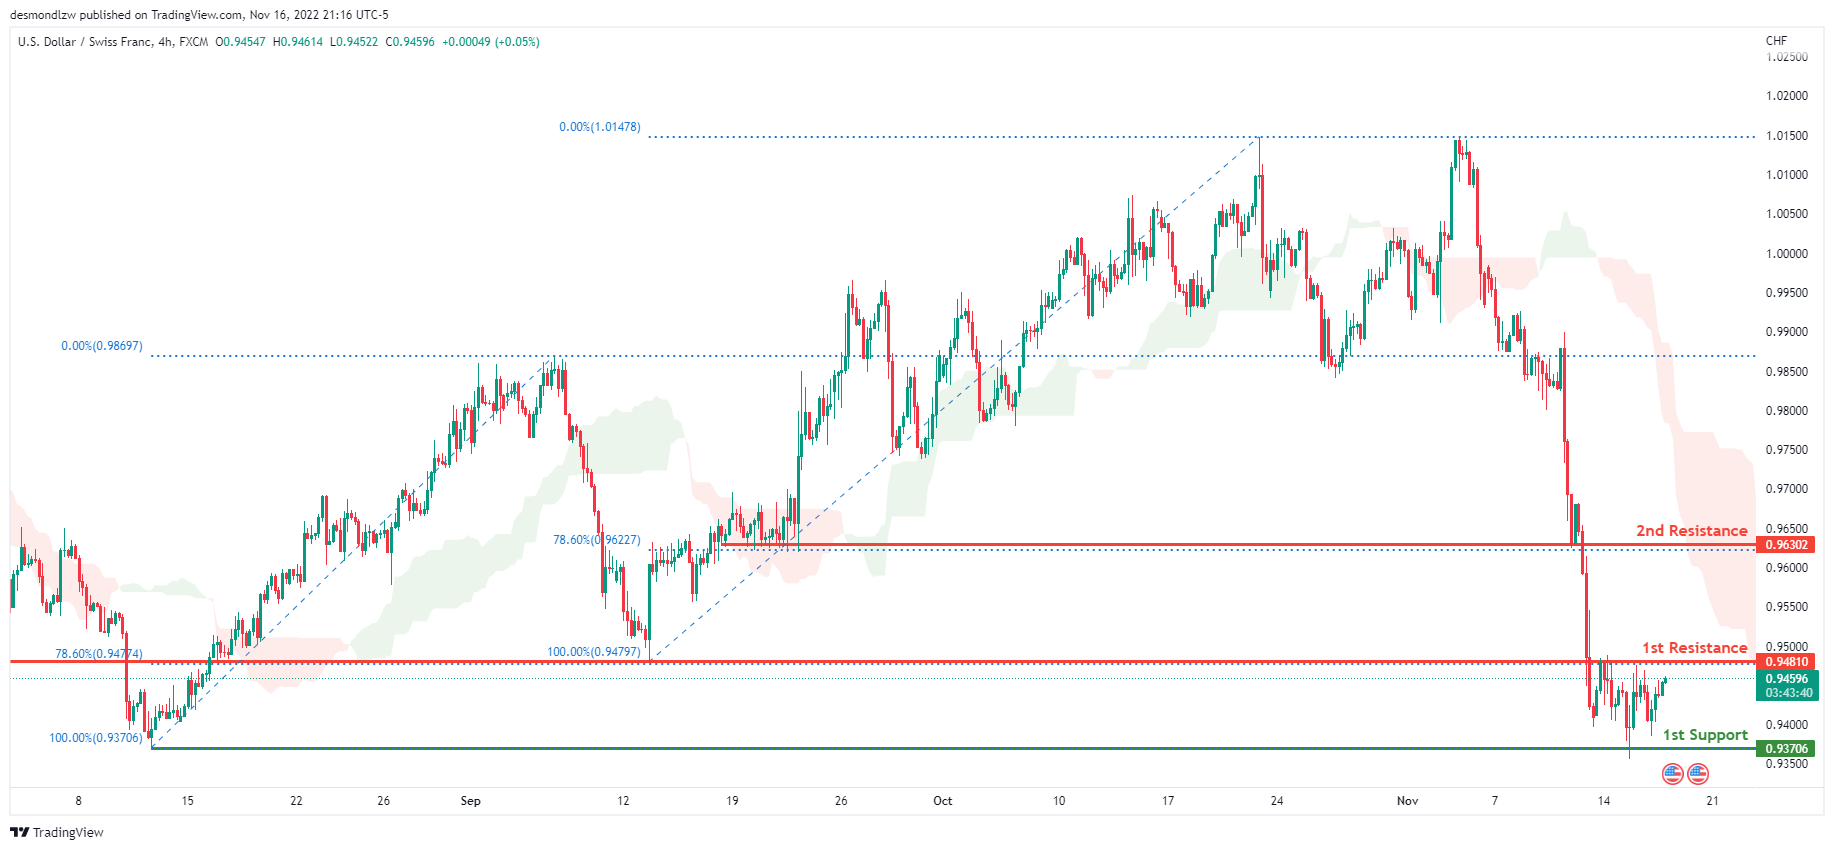
The overall bias for USDCHF on the H4 chart is bearish. In addition, the price is below the Ichimoku cloud, indicating a bearish market. If the current bearish trend continues, the price might move back down to retest the first support line at 0.93706, where the previous low was located. In an alternate scenario, price could rise to retest the first resistance line at 0.94810, which is also the 78.6% Fibonacci line. If the first resistance line is broken, the second resistance line is at 0.96302, which is the 78.6% Fibonacci line.
Areas of consideration
- H4 1st support at 0.93706
- H4 1st resistance at 0.94810
- H4 2nd resistance at 0.96302
XAU/USD (GOLD):
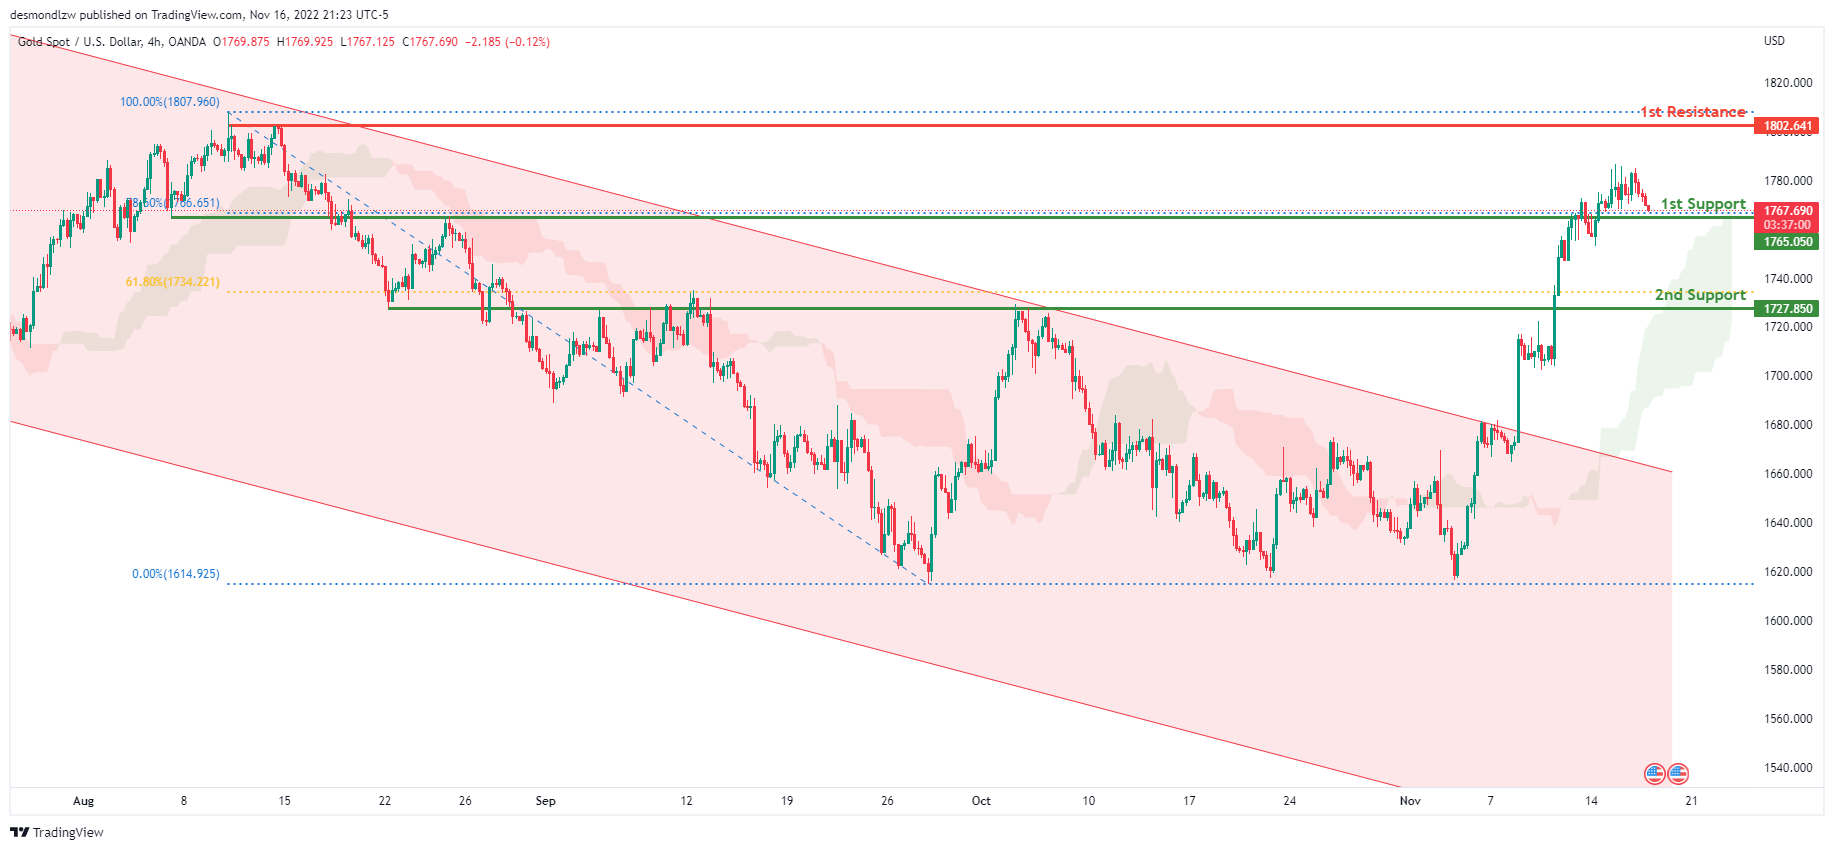
On H4, with the price breaking the descending channel and above the ichimoku cloud, we can expect the price to rise towards the 1st resistance at 1802.641, where the previous swing high is. Alternatively, the price may break the 1st support at 1765.050, which is in line with the 78.6% fibonacci line, before heading towards the 2nd support at 1727.850, where the 61.8% Fibonacci line is.
Areas of consideration:
- H4 time frame, 1st resistance at 1765.483
- H4 time frame, 1st support at 1765.050
- H4 time frame, 2nd support at 1727.850
AUD/USD:
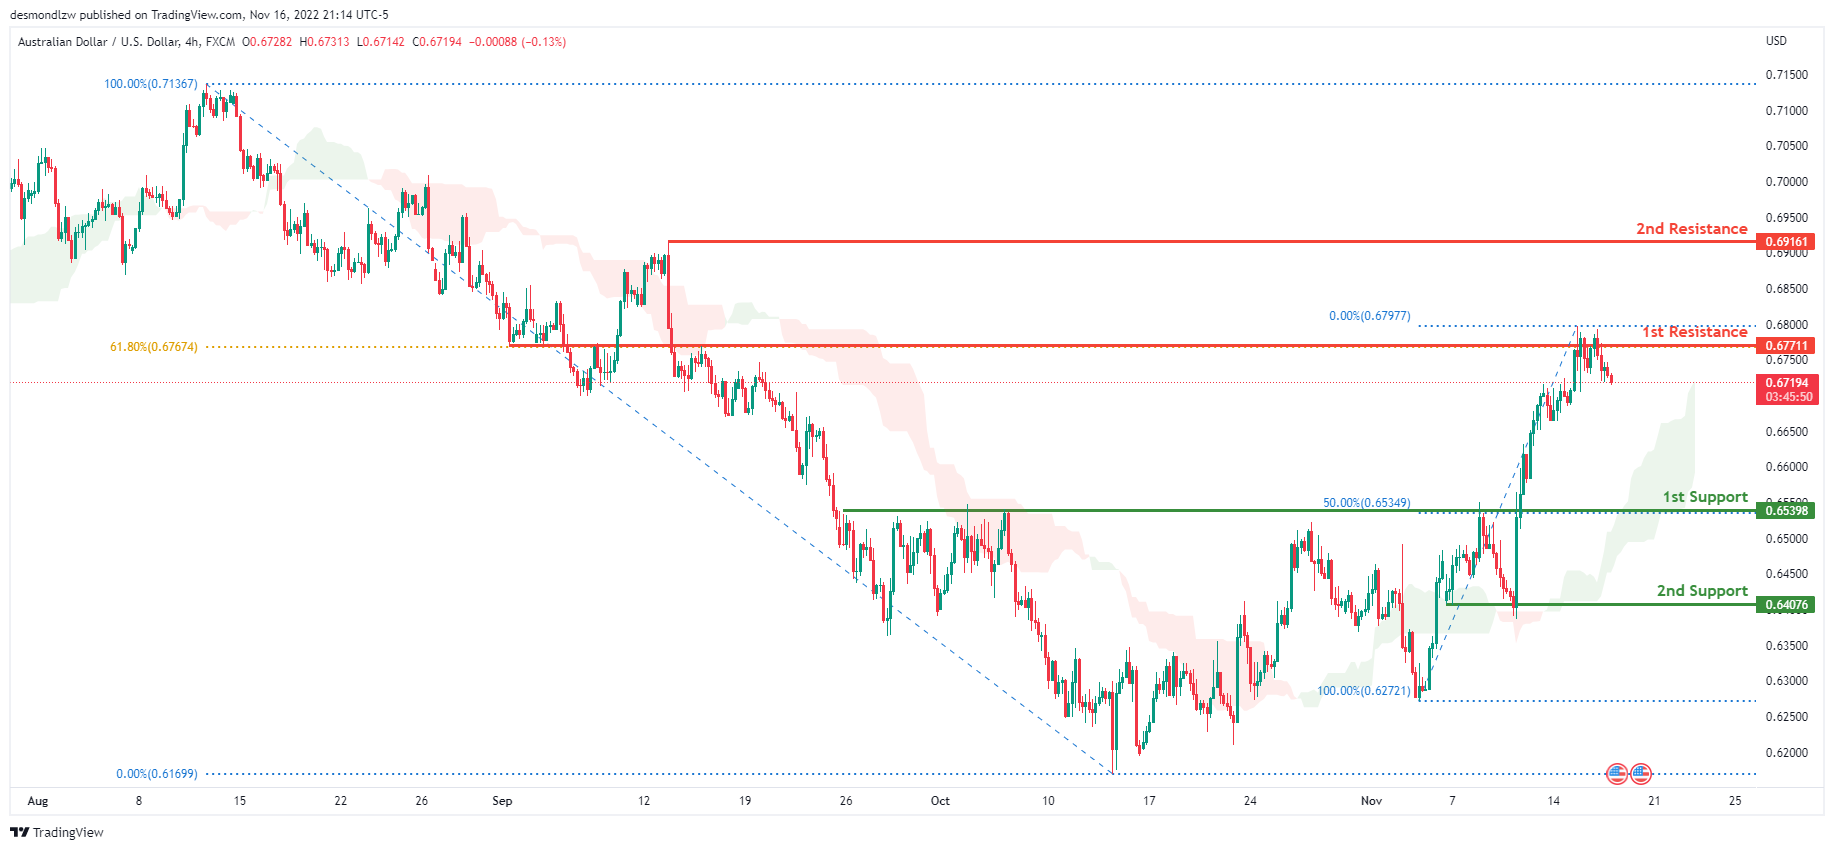
With the price moving above the ichimoku cloud on the H4, we have a bullish bias that the price may break the first resistance at 0.67711, which is in line with the 61.8% fibonacci line, before heading towards the 2nd resistance line at 0.69161, the previous swing high. Alternatively, the price could fall to the first support level at 0.65398, which is marked by the 50% Fibonacci line.
Areas of consideration
- H4, 1st resistance at 0.67711
- H4, 2nd resistance at 0.69161
- H4, 1st support at 0.65398
NZD/USD:
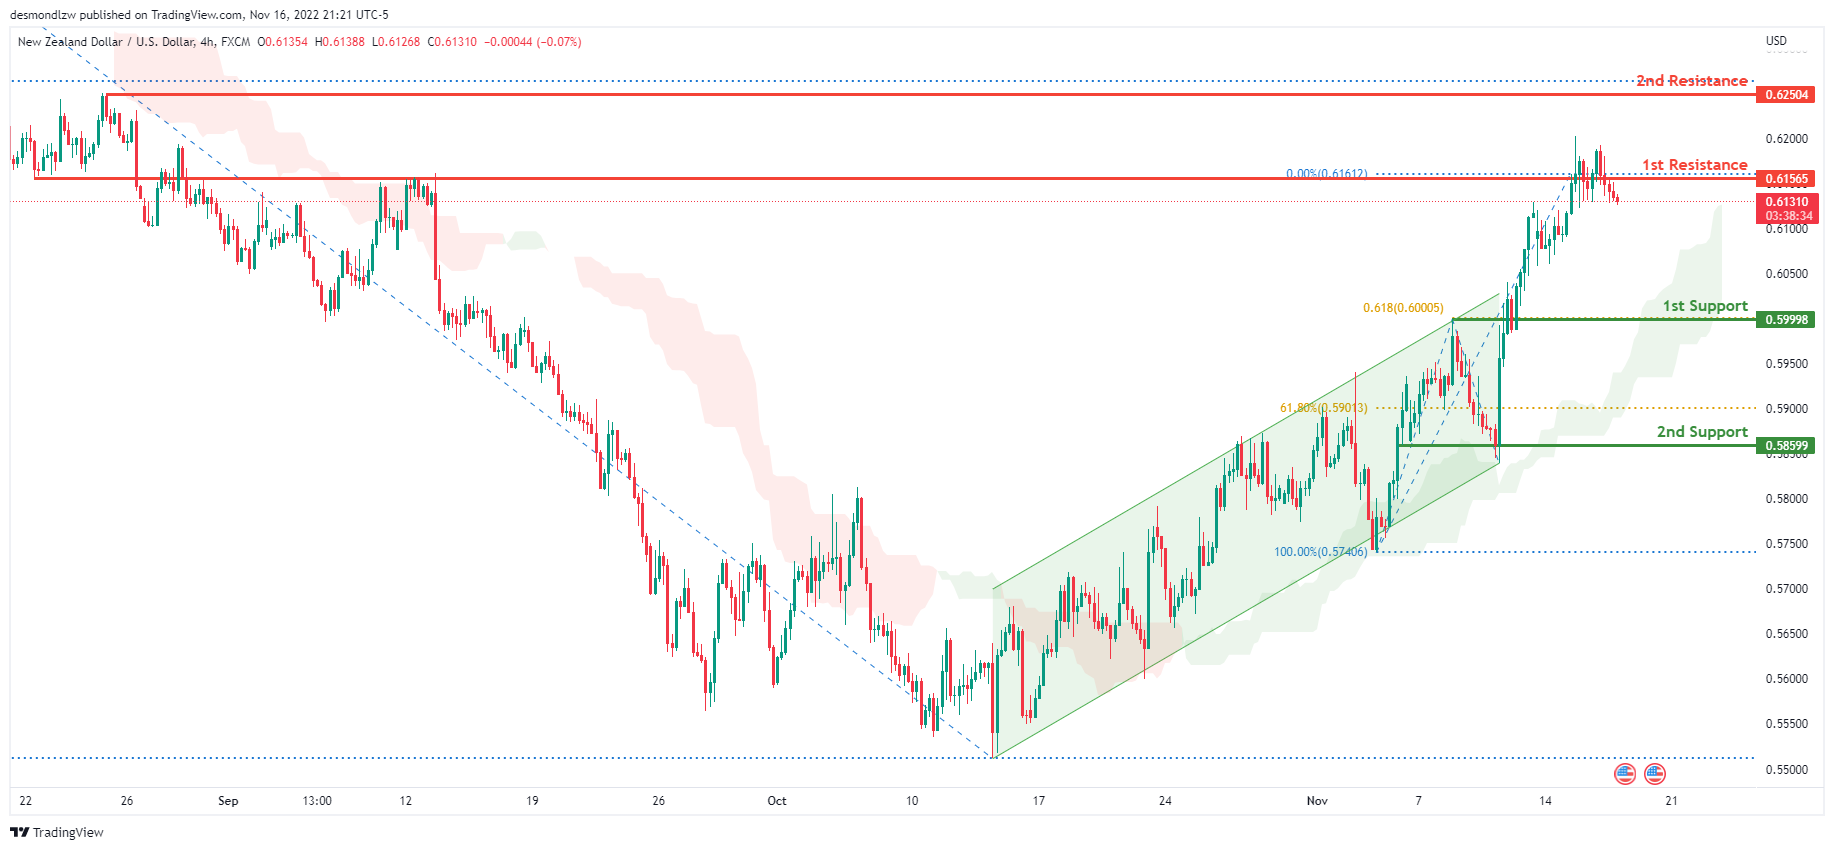
On the H4 chart, the price is moving above the Ichimoku cloud and has broken out of the ascending channel. If this bullish momentum continues, the price may break the 1st resistance at 0.61565, which is in line with the previous swing high and 0% fibonacci line, before heading towards the 2nd resistance line at 0.62504, where the 78.6% Fibonacci line is. Alternatively, the price may head back towards the 1st support at 0.59998, where the 61.8% Fibonacci projection line is located.
Areas of consideration:
- H4 time frame, 1st resistance at 0.61565
- H4 time frame, 1st support at 0.59998
USD/CAD:
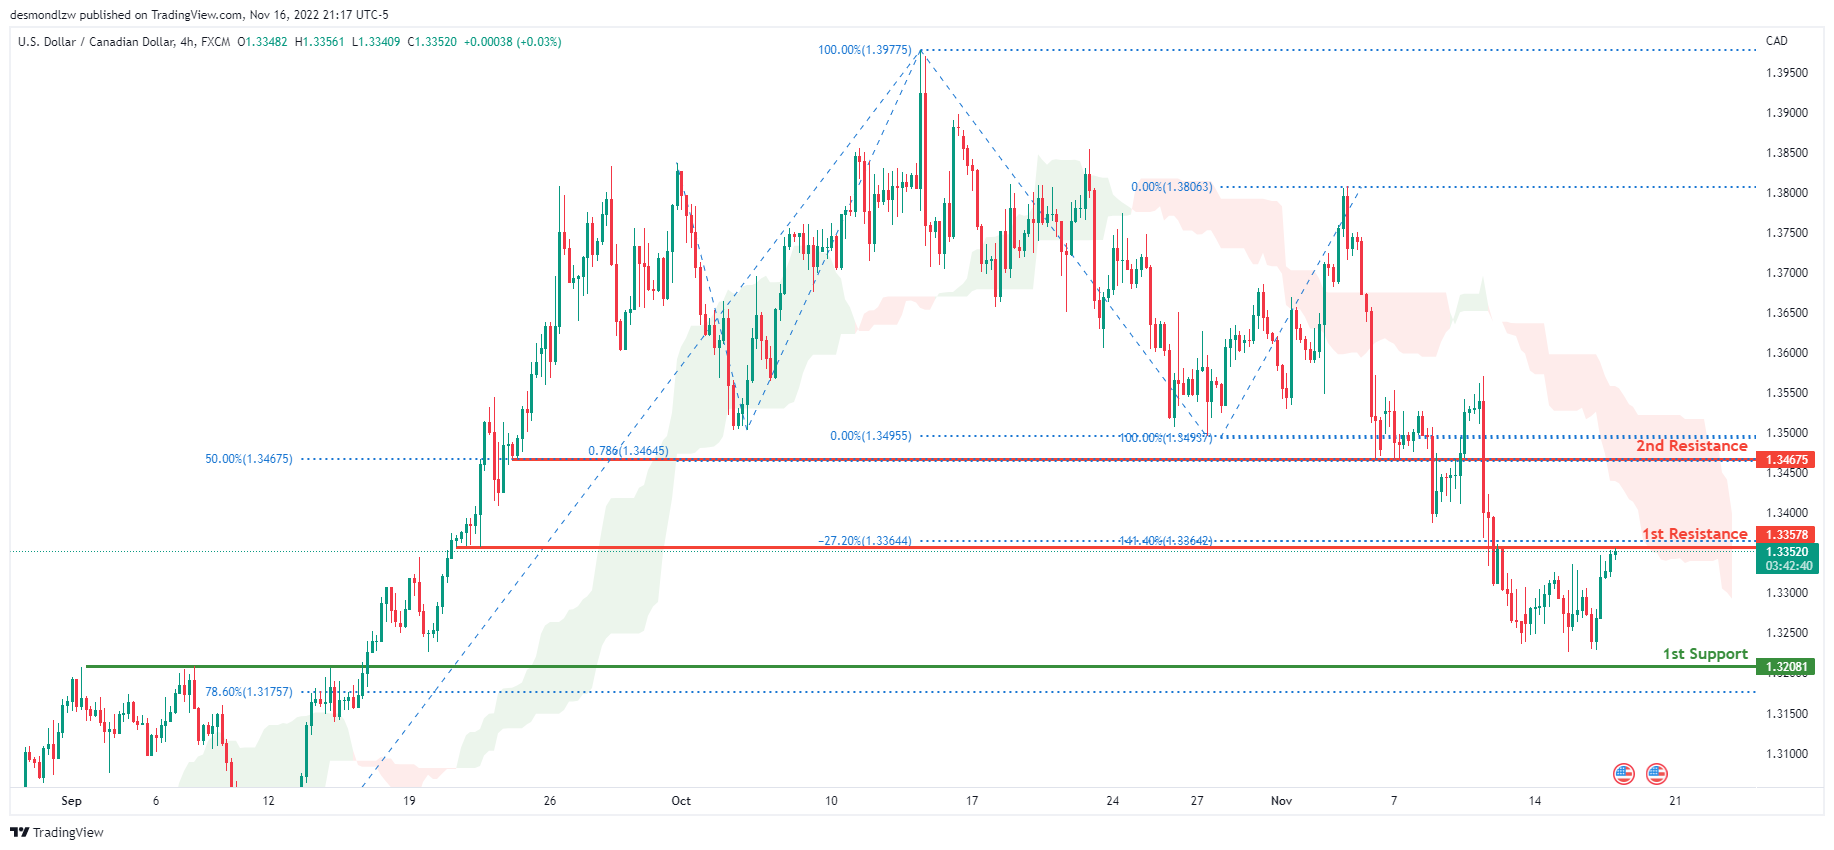
On the H4 chart, the overall bias for USDCAD is bearish. To add confluence to this, the price is below the Ichimoku cloud which indicates a bearish market. If this bearish momentum continues, expect the price to head down towards the 1st support line at 1.32081, where the 78.6% Fibonacci line is located. In an alternative scenario, price could head back up breaking the 1st resistance line at 1.33578, where the -27.2% Fibonacci expansion line and 141.4% Fibonacci line are located, before heading towards the 2nd resistance at 1.34675 where the 50% Fibonacci line and 78.6% Fibonacci projection line is.
Areas of consideration:
- H4 time frame, 1st resistance at 1.33578
- H4 time frame, 2nd resistance at 1.34675
- H4 time frame, 1st support at 1.32081
OIL:
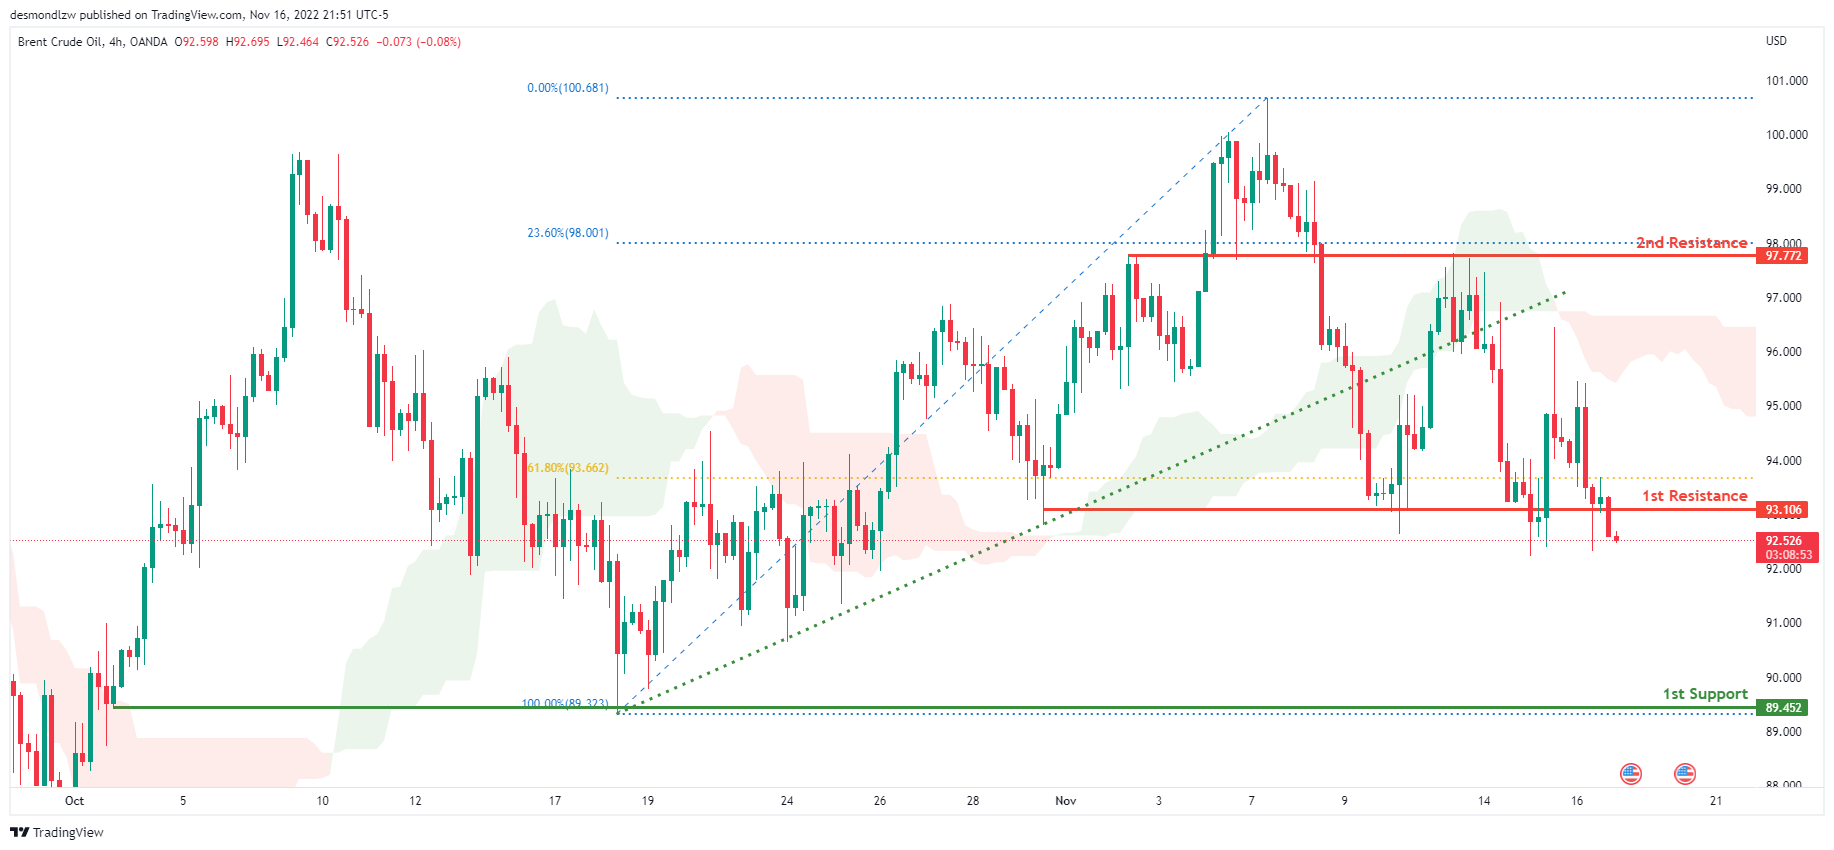
Looking at the H4 chart, the current overall bias for Oil is bearish. To add confluence to this, the price is below the Ichimoku cloud which indicates a bearish market. If this bearish momentum continues, expect price to head towards the 1st support at 89.452 where the previous swing low lies. In an alternative scenario, price might head back up to retest the 1st resistance line at 93.106, where the 61.8% Fibonacci line and previous low are.
Areas of consideration:
- H4 time frame, 1st resistance at 93.106
- H4 time frame, 1st support at 89.452
- H4 time frame, 2nd support at 89.452
Dow Jones Industrial Average:
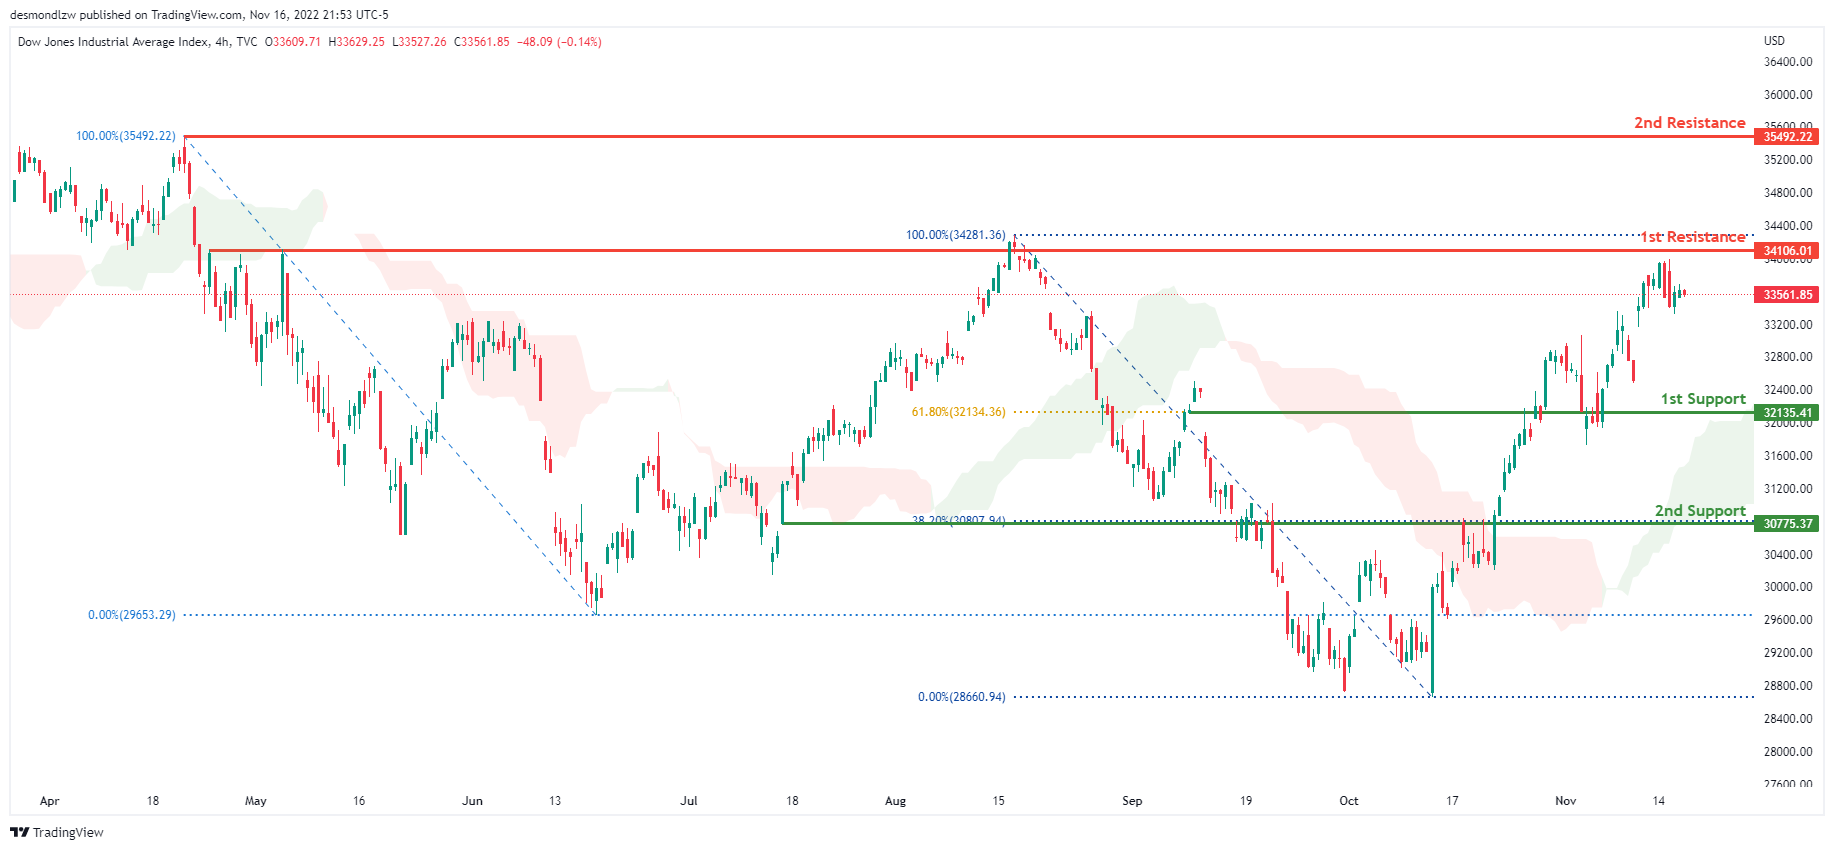
On the H4 chart, the overall bias for DJI is bullish. To add confluence to this, the price is above the Ichimoku cloud which indicates a bullish market. If this bullish momentum continues, expect the price to possibly head towards the 1st resistance at 34106.01 where the previous high and 100% Fibonacci line is located. In an alternative scenario, price could head towards the 1st support line at 32135.41, where the 61.8% Fibonacci line is located.
Areas of consideration:
- H4 time frame, 1st support at 32135.41
- H4 time frame, 1st Resistance at 34106.01
DAX:
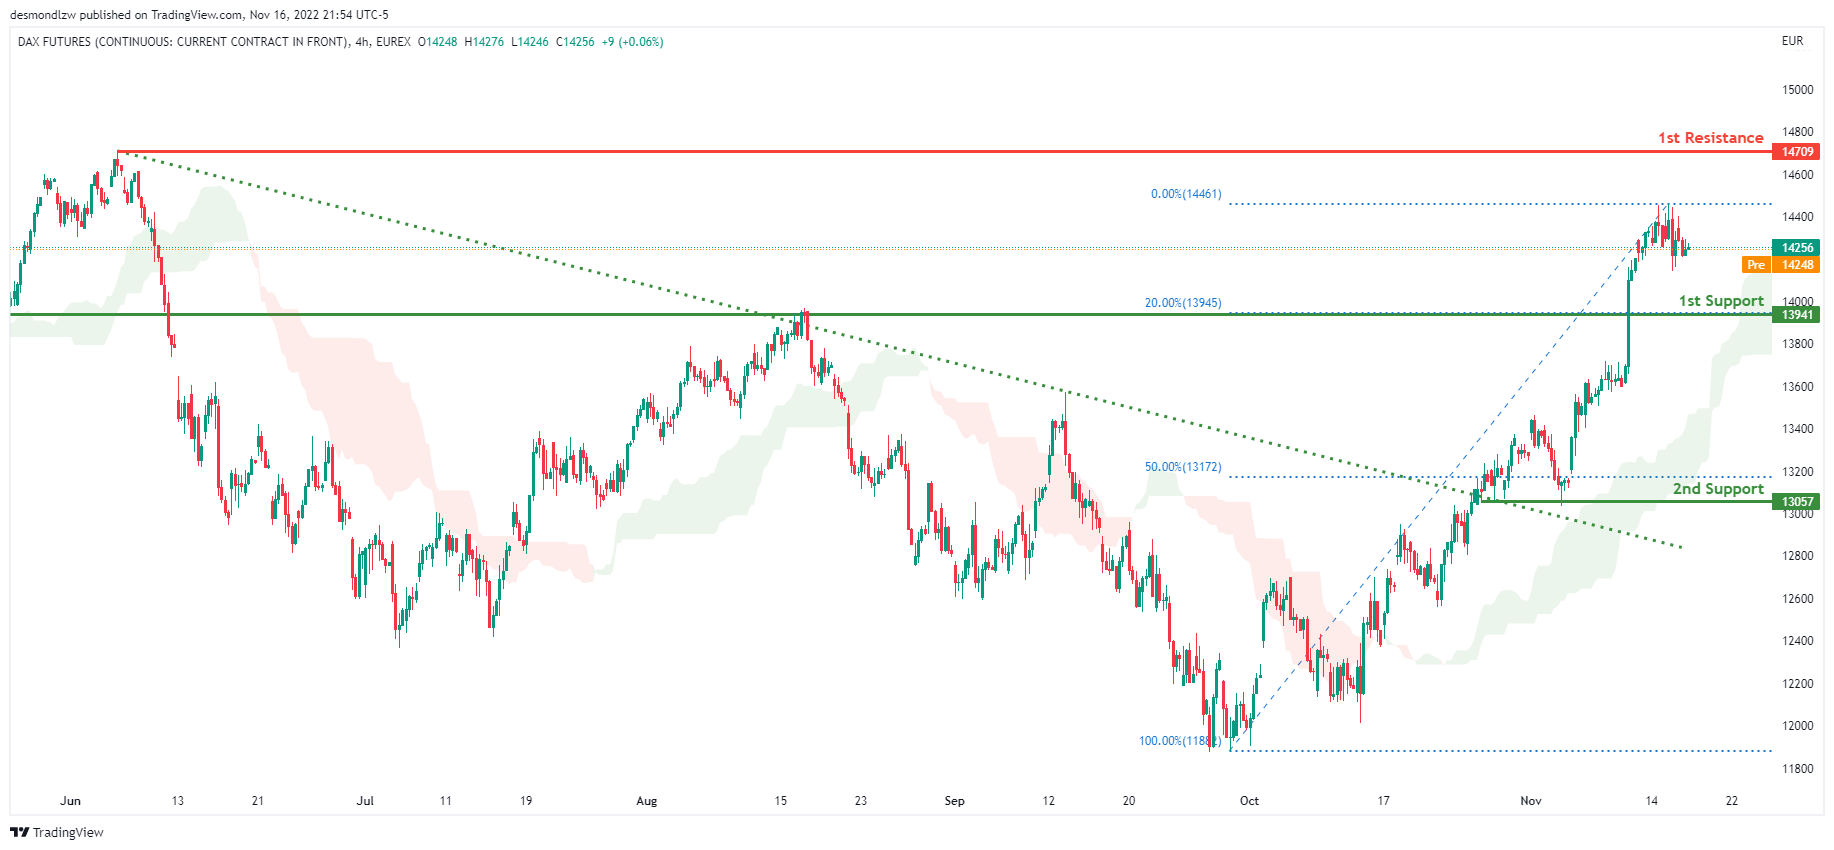
The H4 chart shows a bullish bias, with price breaking through the descending trendline and rising above the Ichimoku cloud. Price is expected to maintain its bullish momentum and rise to the first resistance level at 14709, where the previous swing high is located. Alternatively, the price could fall to the first support level at 13941, which corresponds to the 20% Fibonacci line.
Areas of consideration:
- H4 time frame, 1st resistance is at 14709
- H4 time frame, 1st support is at 13941
ETHUSD:
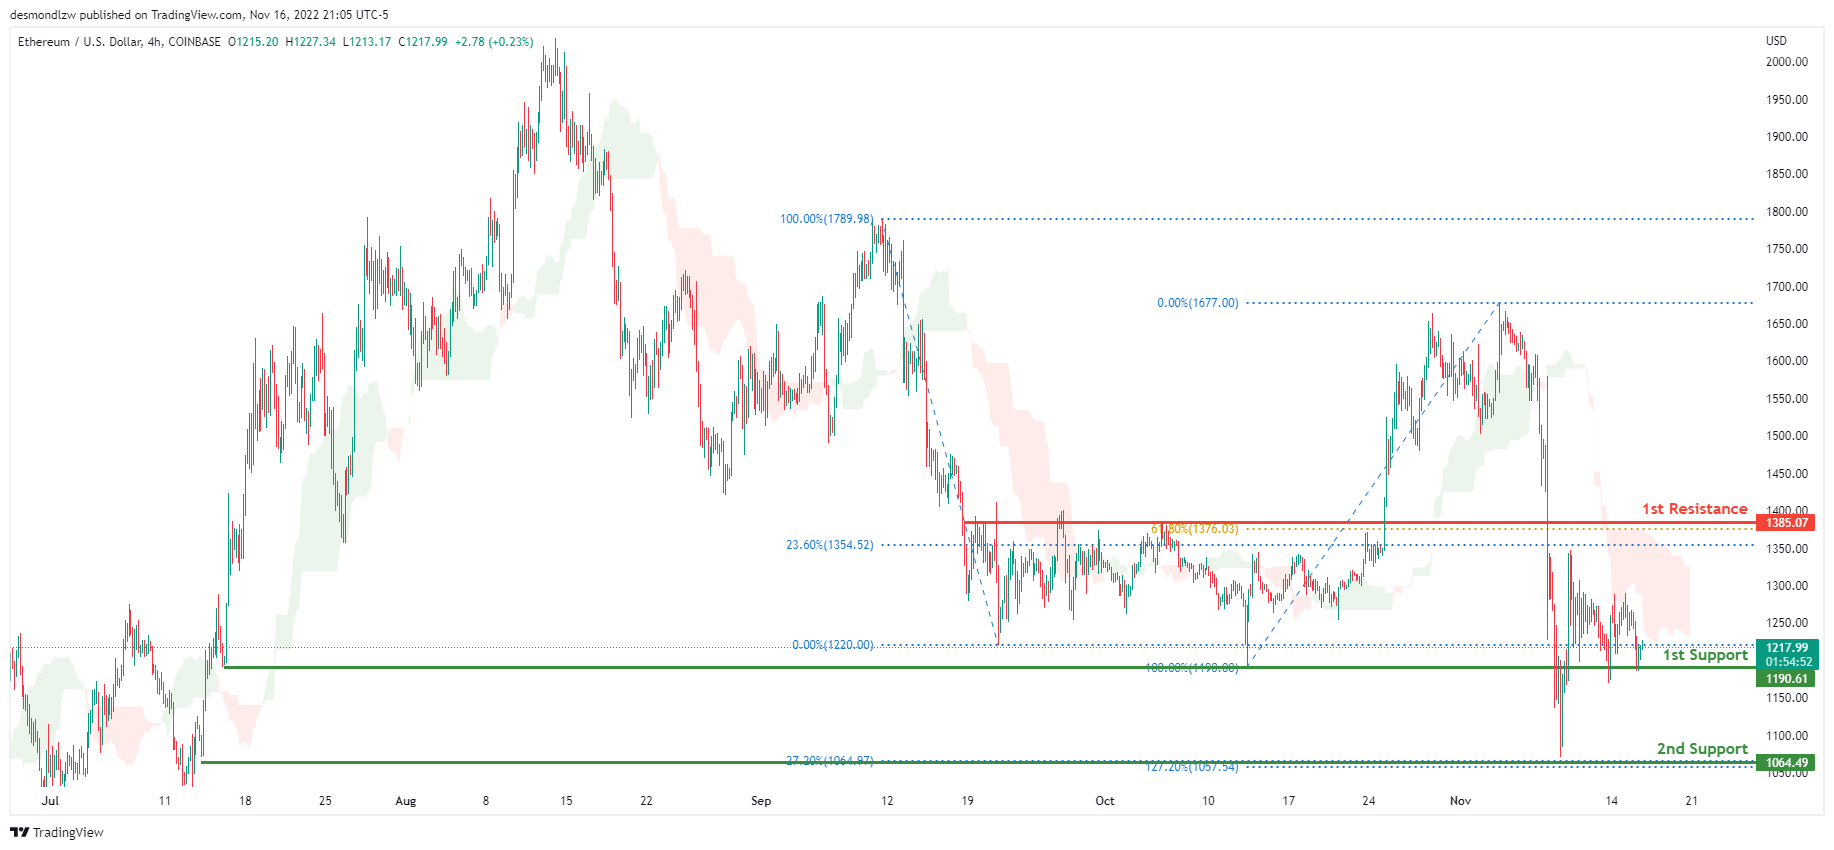
Looking at the H4 chart, the current overall bias for ETHUSD is bearish, with price currently under the Ichimoku cloud indicating a bearish market. If this bearish momentum continues, expect the price to break the 1st support line at 1190.61 where the previous low and 100% Fibonacci line was located and head towards the 2nd support at 1064.49 where the -27.2% Fibonacci expansion line and 127.2% Fibonacci extension line are located. In an alternative scenario, price could head back up to retest the 1st resistance line at 1385.07, where the 23.6% and 61.8% Fibonacci lines are located.
Areas of consideration:
- H4 time frame, 1st resistance of 1385.07
- H4 time frame, 1st support at 1190.61
- H4 time frame, 2nd support at 1064.44
BTCUSD:
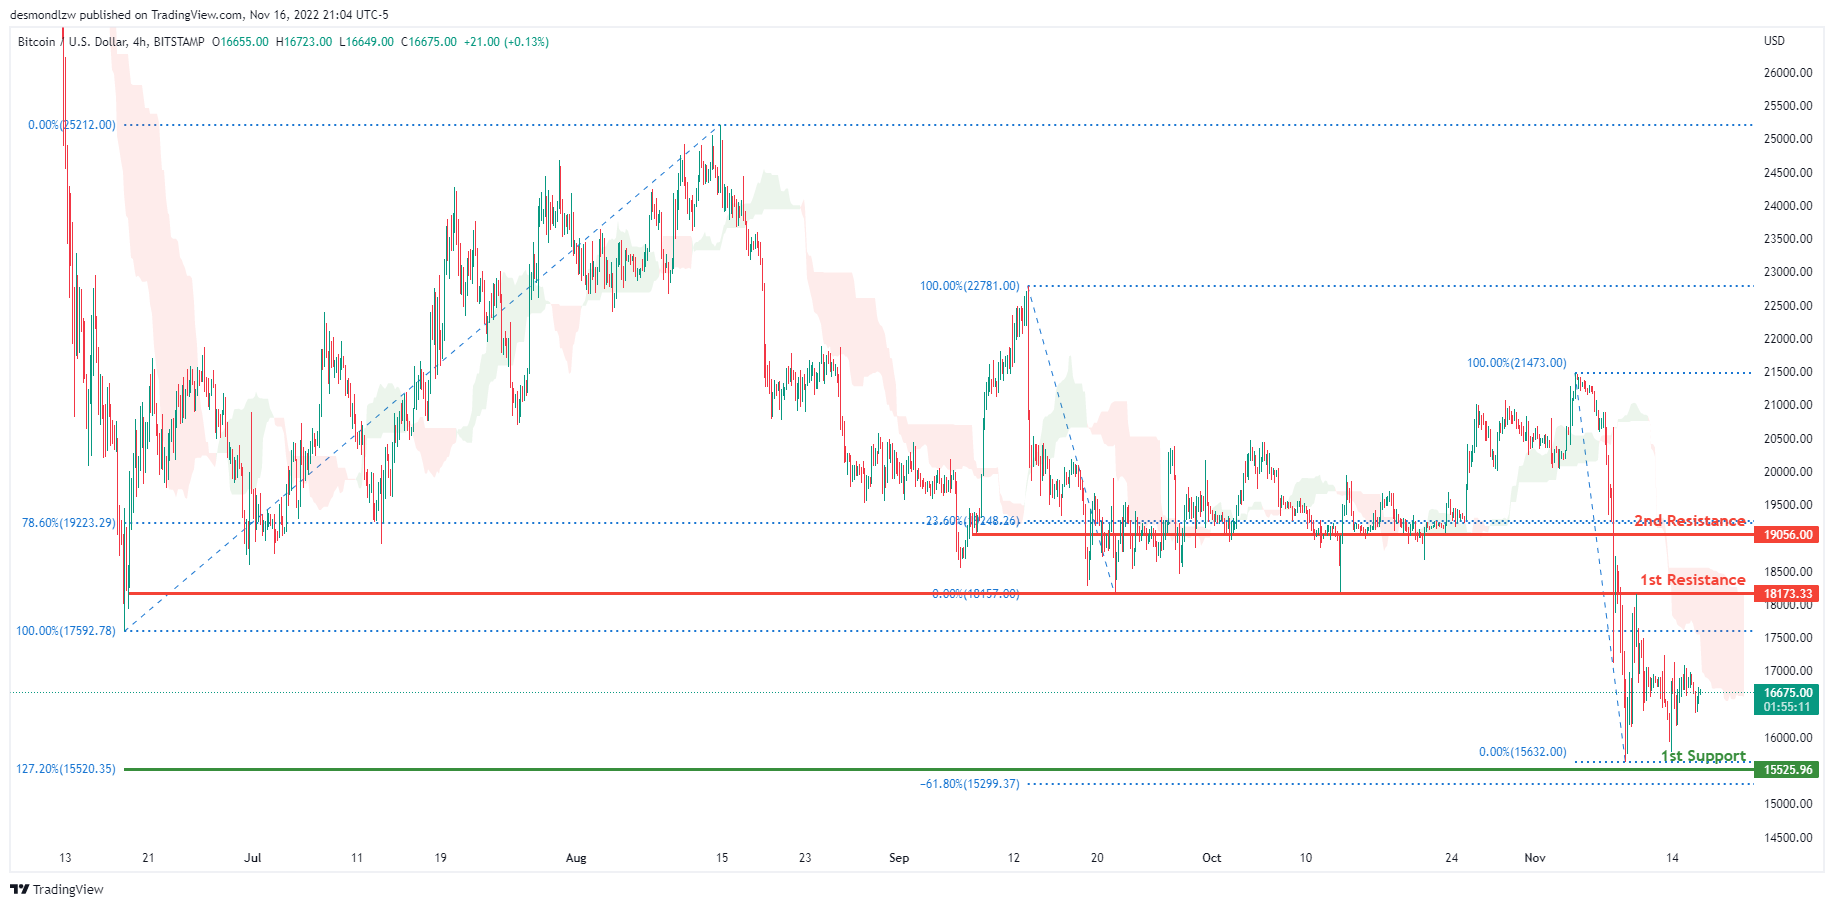
On the H4 chart, the overall bias for BTCUSD is bearish. To add confluence to this, the price is below the Ichimoku cloud which indicates a bearish market. If this bearish momentum continues, expect the price to head towards the 1st support line at 15525.96, where the 127.2% Fibonacci extension line and -61.8% Fibonacci expansion line is located. In an alternative scenario, price could head back up to retest the 1st resistance line at 18173.33, where the previous low and 0% Fibonacci line is located.
Areas of consideration:
- H4 time frame, 1st resistance 18173.33
- H4 time frame, 1st support at 15525.96
S&P 500:
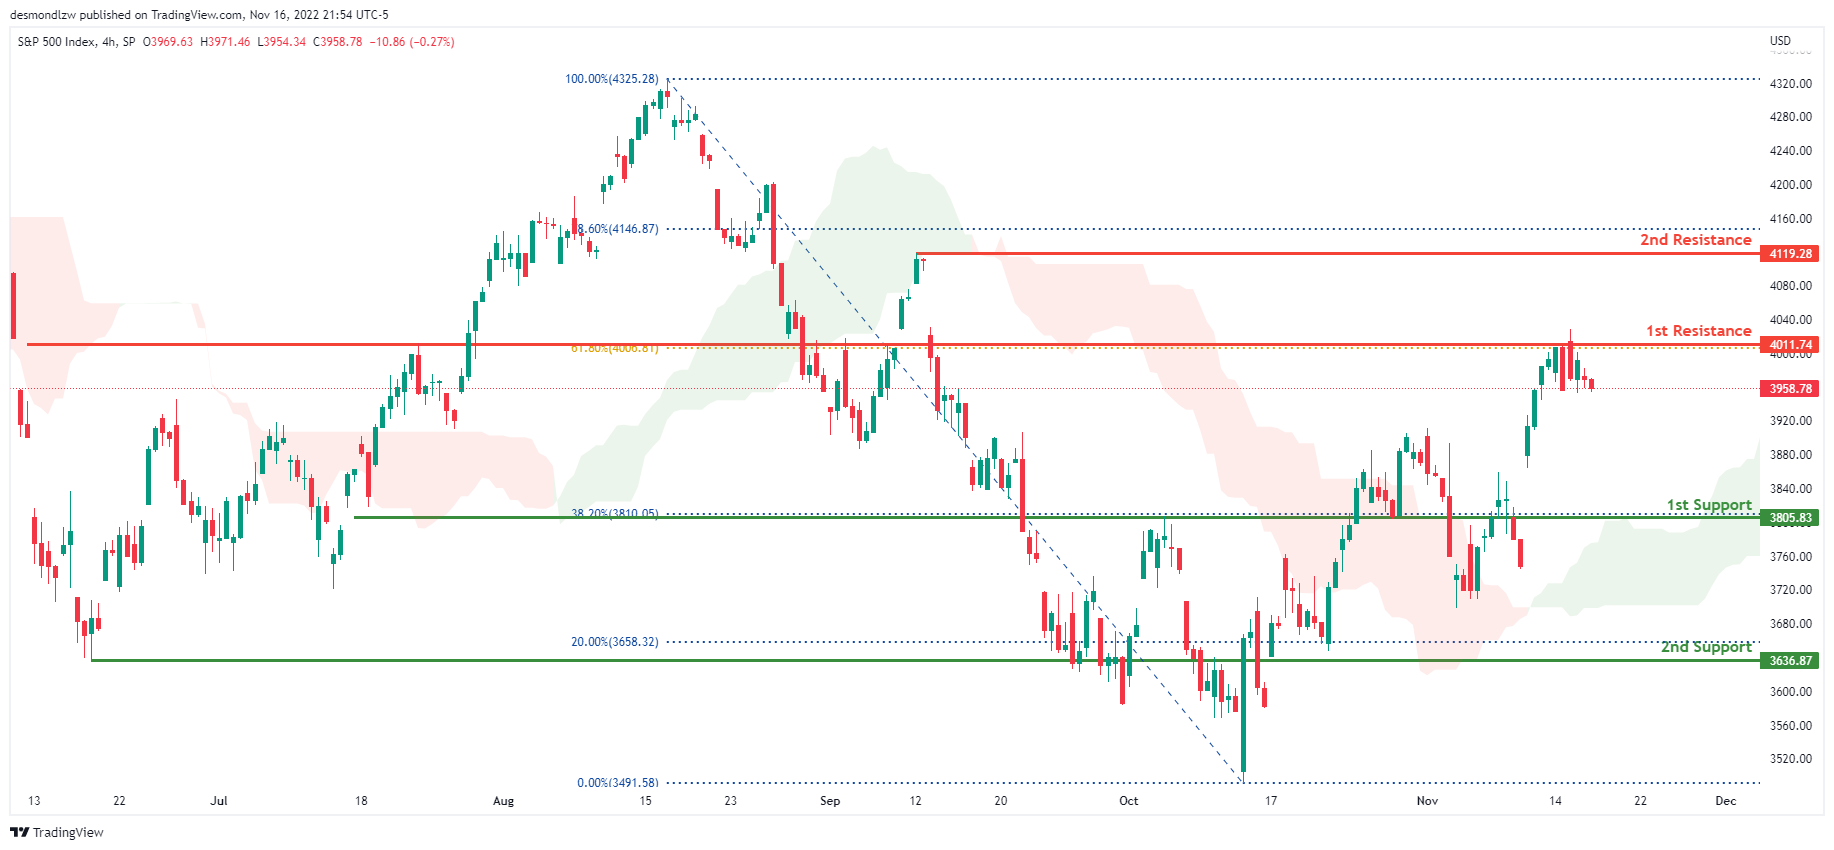
The overall bias for the S&500 on the H4 chart is bullish, with prices above the Ichimoku cloud. If the bullish momentum continues, the price will rise to the first resistance line at 4011.74, where the 61.8% Fibonacci line is located. If the first resistance line is broken, the second resistance line is at 4119.28, which is the previous swing high and the 78.6% Fibonacci line. In an alternate scenario, price could return to the first support line at 3805.83, where the 38.2% Fibonacci line is located.
Areas of consideration:
- H4 time frame, 1st support at 3805.83
- H4 time frame, 1st resistance at 4011.74
- H4 time frame, 2nd resistance at 4119.28
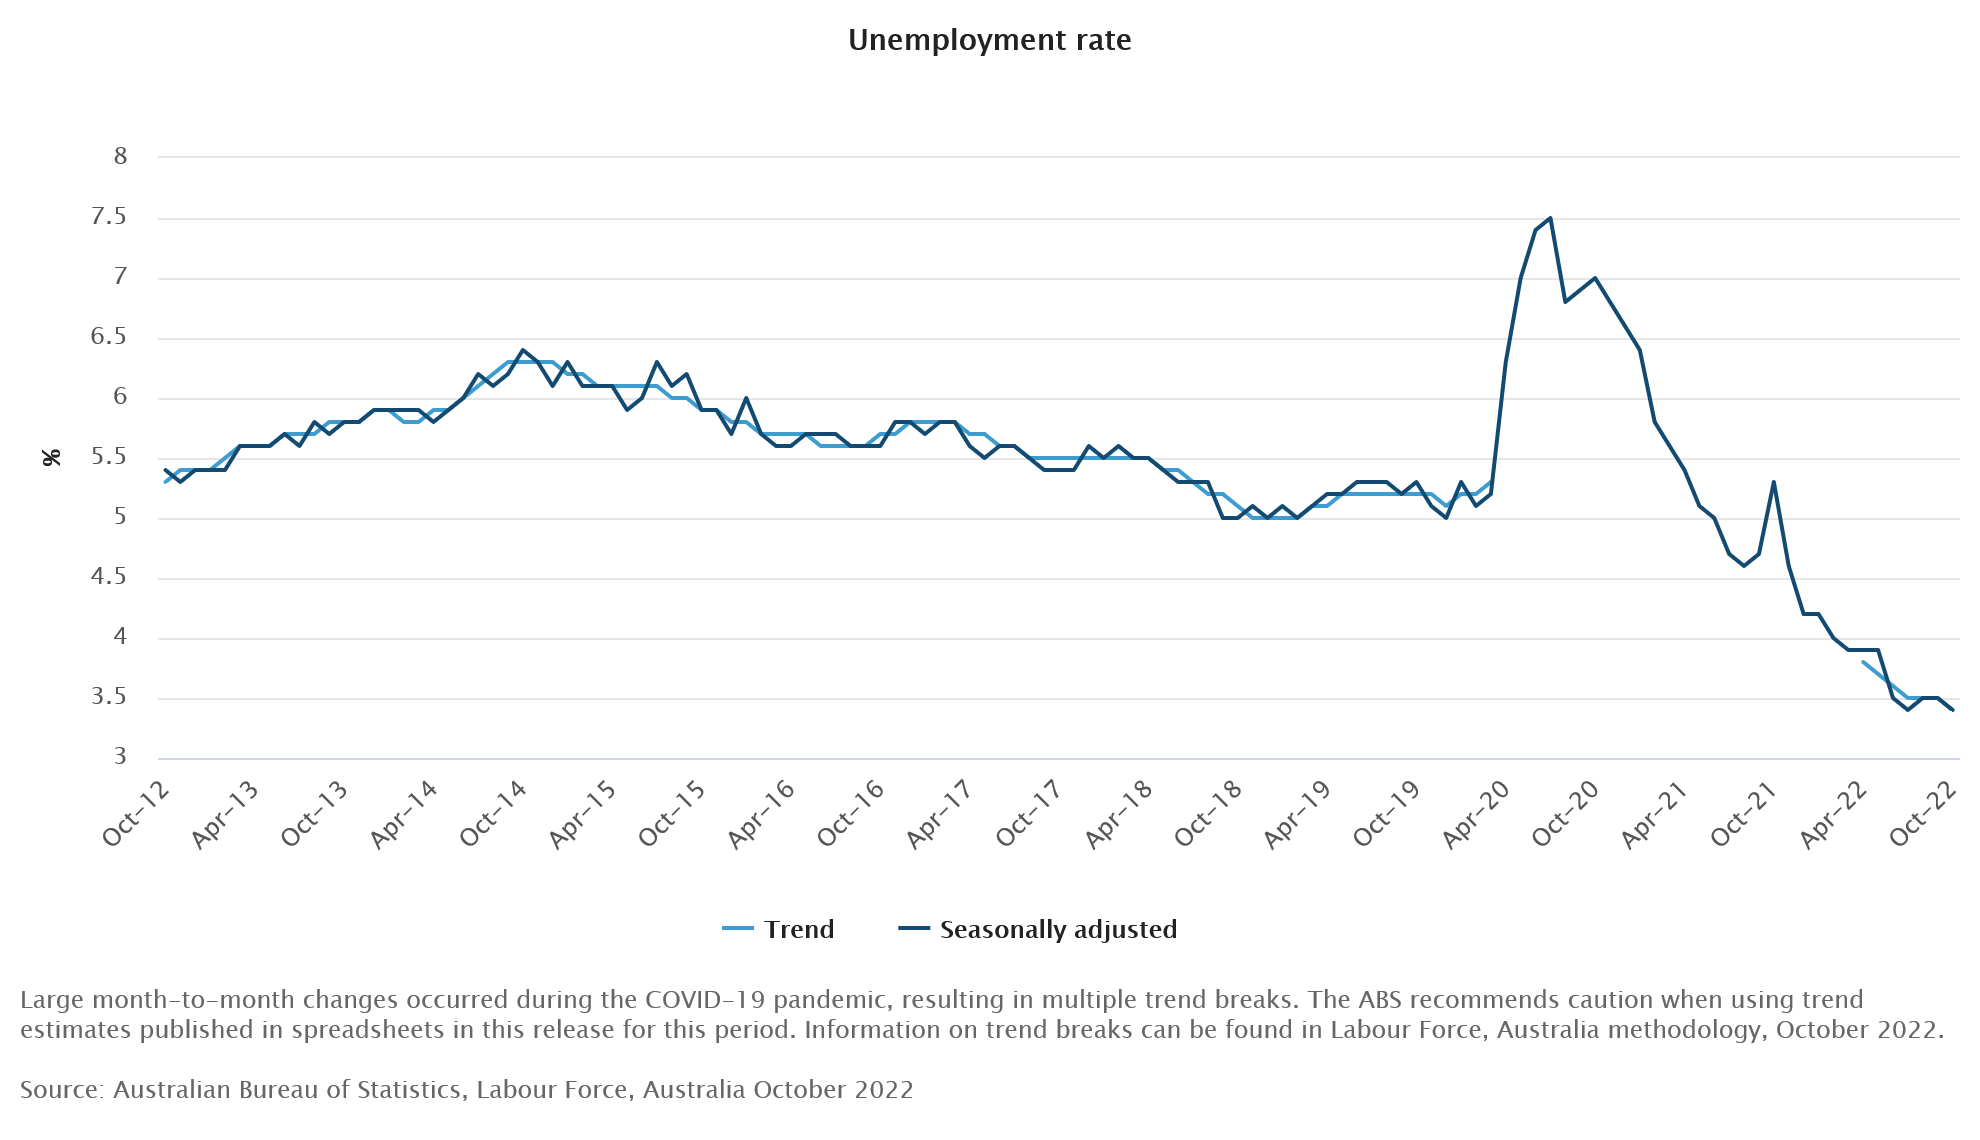
Australia employment grew 32.3k in Oct, unemployment rate dropped to 3.4%
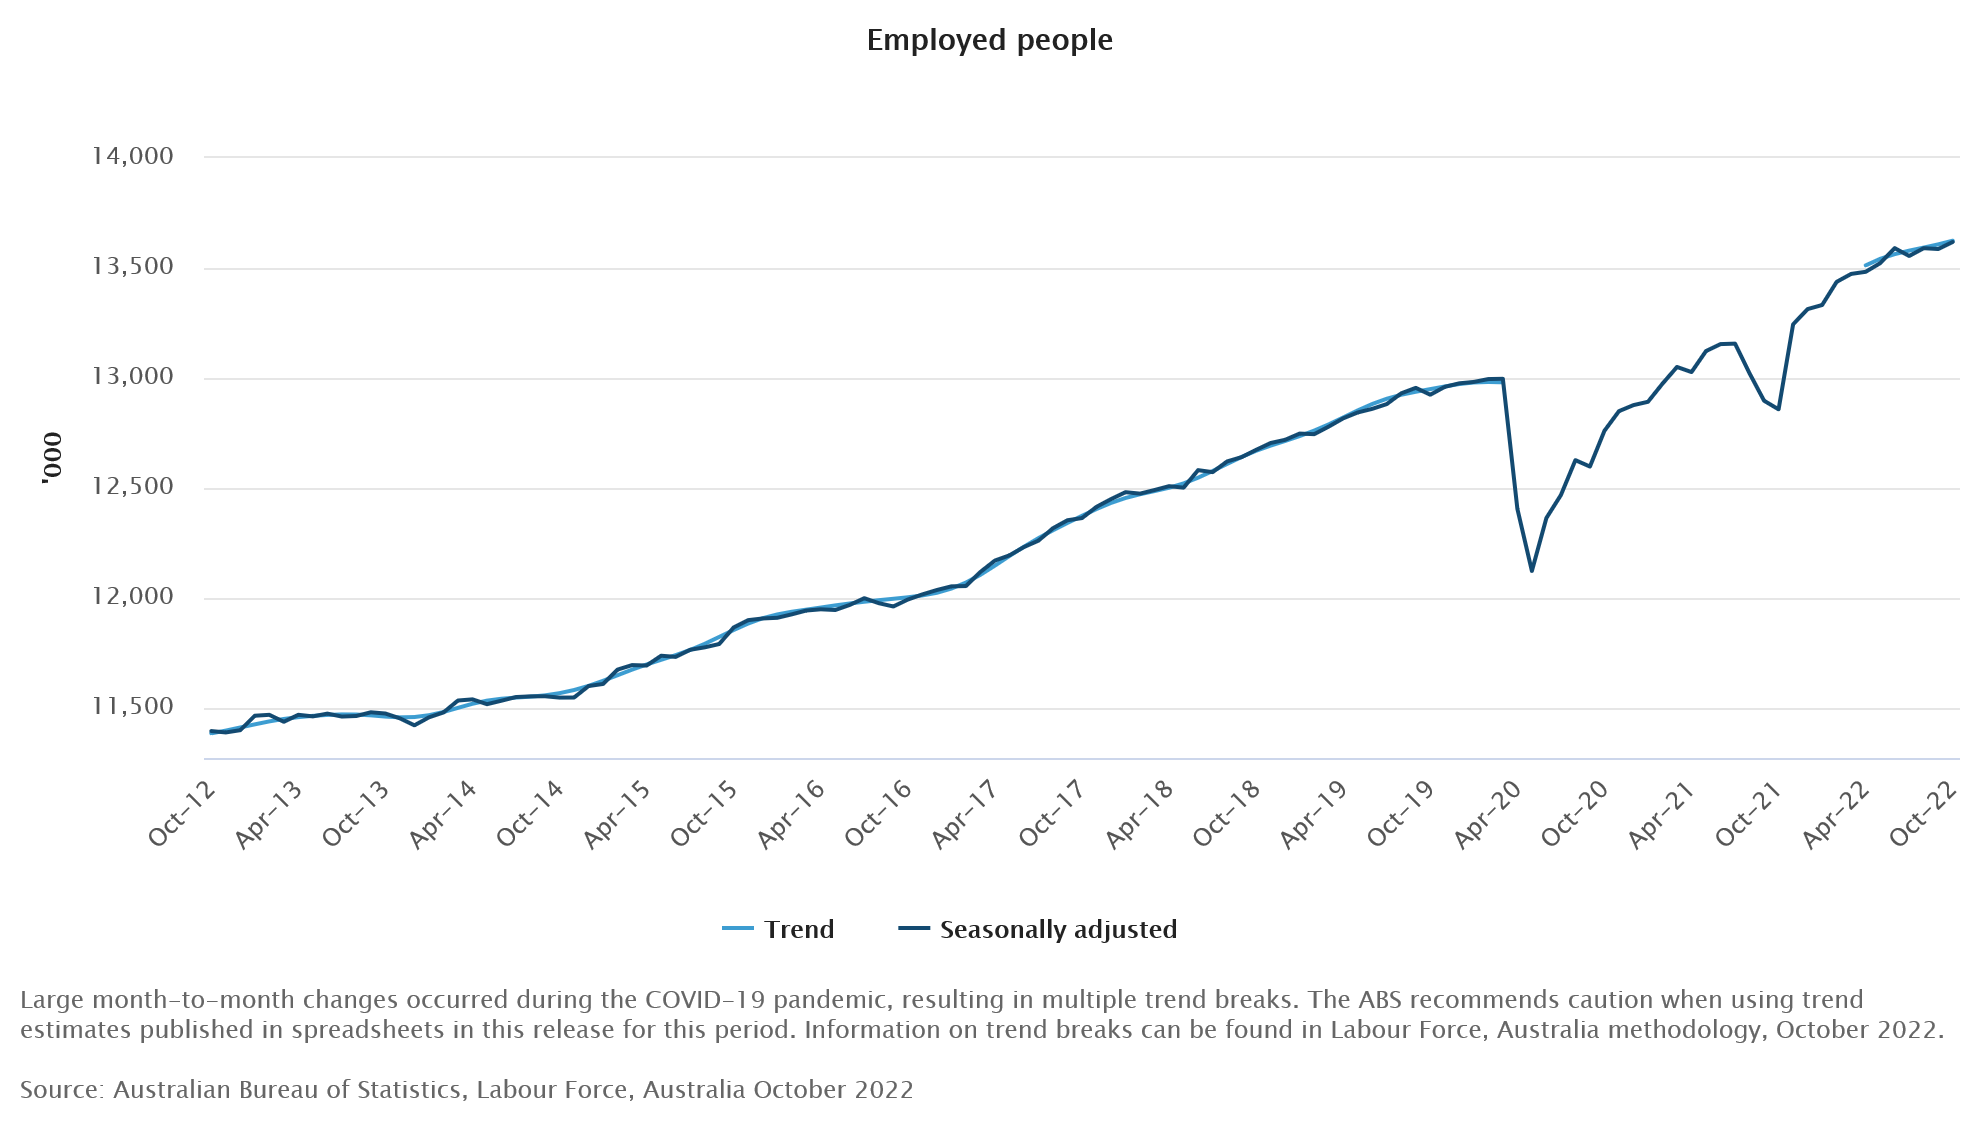
Australia employment rose 32.2k in October, above expectation of 15.0k. Unemployment rate dropped from 3.5% to 3.4%, below expectation of 3.5%. Participation rate was unchanged at 66.5%. Monthly hours worked in all jobs rose 2.3% mom.
"Although employment in seasonally adjusted terms rose 0.2 per cent in October 2022, the underlying trend estimate was monthly growth of around 0.12 per cent. This was below the average for the 20 years prior to the pandemic of 0.16 per cent," Bjorn Jarvis, head of labour statistics at the ABS said.
"This indicates that while employment has continued to grow, the rate of growth has slowed to below the longer-term average. It has been below this average for the past 5 months."
Japan trade deficit hit another record as import surged
Japan's exports rose 25.3% yoy to JPY 9.00T in October, after shipments of cars and electronics components increased. Imports rose 53.5% yoy to JPY 11.16T, hitting a historical high, as led by crude oil, liquefied natural gas and coal.
Trade deficit came in at JPY -2.16T, a record for the month. Also, Japan has seen as record trade deficit for each month in the past six months, on rising energy and raw material costs, as well as weak Yen exchange rates.
US-bound exports rose 36.5% yoy to JPY 1.78T while imports rose 47.1% yoy to JPY 1.06T. Exports to China rose 7.7% yoy to JPY 1.72T while imports rose 39.3% yoy to JPY 2.39T.
In seasonally adjusted term, exports rose 2.2% mom to JPY 8.91T. Imports rose 4.2% mom to JPY 11.21T. Trade deficit came in at JPY -2.30T.
BoJ Kuroda: May take a long time to achieve price stability with wage hikes
BoJ Governor Haruhiko Kuroda told the parliament that it may "take a long time" to achieve the "price stability target, involving wage hikes". He reiterated that the central bank needs to continue with its monetary easing to support a fragile recovery.
At the same session, Executive Director Shinichi Uchida said it was too early to discuss exit from monetary stimulus. "When exiting, the point will be adjusting long-term and short-term policy rates and the BoJ's balance sheet," Uchida said. "The order and mixture of those factors would differ depending on economy, prices and financial situations at the time."
Fed Waller more comfortable to hike 50bps in Dec, but no judgement before more data
Fed Governor Christopher Waller said in a speech that while the slowdown in CPI in October was "welcome news", "we must be cautious about reading too much into one inflation report"
"I don't know how sustained this deceleration in consumer prices will be," he said.And, it's "way too early to conclude that inflation is headed sustainably down"
Despite raising interest rates from near 0% to 3.75-4.00% in nine months, "policy is barely in restrictive territory today, so more interest rate hikes are needed to get inflation down," he said.
"The Committee will reach the terminal rate well before inflation reaches 2 percent because of the abundance of evidence that it takes months, and perhaps even longer, for the full effects of a rate increase to work through the economy."
"Looking toward the FOMC's December meeting, the data of the past few weeks have made me more comfortable considering stepping down to a 50-basis-point hike. But I won't be making a judgement about that until I see more data, including the next PCE inflation report and the next jobs report."
Australia: October Labour Force; Employment Lifts As Absences Fade
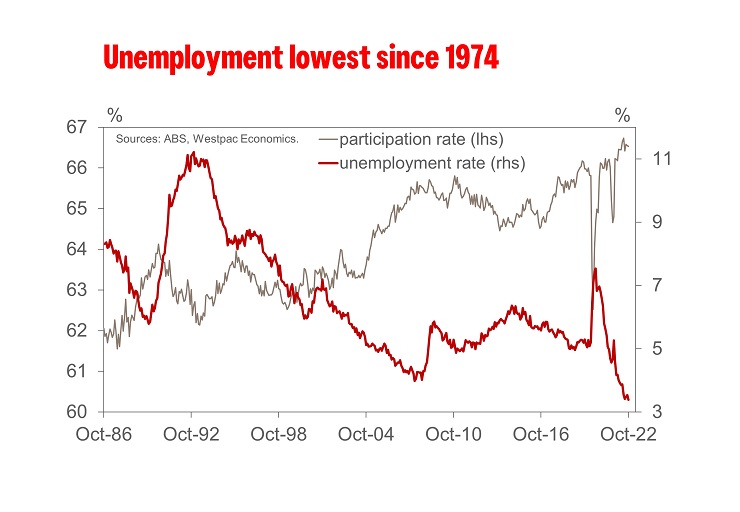
Total employment: 32.2k from -3.8k (revised from 0.9k); unemployment rate: 3.4% from 3.5% (unrevised 3.5%); participation rate: 66.5% from 66.5% (revised 66.6%). It was a strong update even though holidays, sickness and floods continue to hold back the recovery. Unemployment is now the lowest level since November 1974.
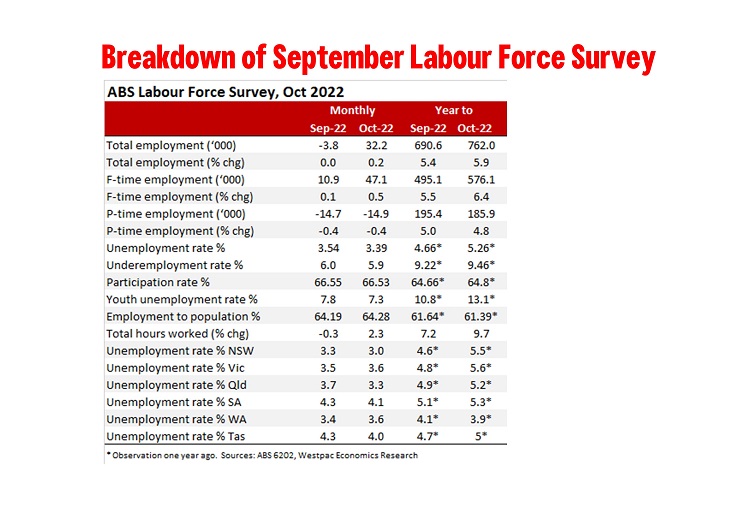
Total employment gained 32.2k or 0.2% in October while September employment was revised from 0.9k to -3.8k. In the year total employment has grown 762.0k or 5.9%.
The size of the gain in employment was enough to lift the employment to population ratio 0.1ppt to 64.3%
Participation was flat at 65.5% (at two decimal places it fell from 65.55% to 65.53) which is just under the historical high of 66.7%. Due to the moderation in participation there was a smaller 11.7k gain in the labour force resulting in a -20.6k drop in the number of unemployment with the unemployment rate falling 0.1ppt to 3.4% (3.54% and 3.39% respectively at two decimal places).
At 3.4% the unemployment rate is low the lowest since November 1974.
Westpac’s forecast unemployment rate at end 2022 is 3.3%.
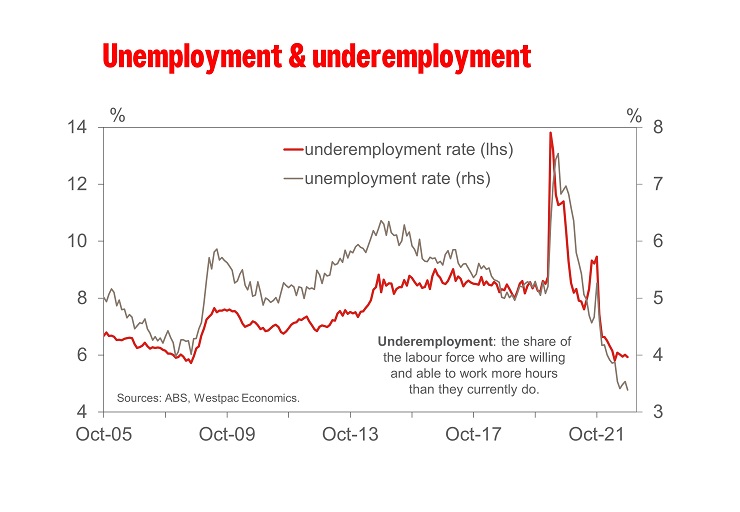
Underemployment, those employed who are willing and able to work more hours if offered them, fell 0.1ppt to 5.9%, 2.8ppt points below the pre-pandemic rate. However, as you can note in the chart, since May the unemployment rate has fallen 0.5ppt while the underemployment rate has been tracking sideways and is now up 0.1ppt. Given how tight the labour market is it is somewhat surprising we have not seen underemployment fall with unemployment.
The underutilisation rate, which combines the unemployment and underemployment rates, fell 0.2ppt 9.3% which is 4.6ppt below March 2020, and the lowest rate since March 1982.
There has been an interesting shift in gender outcomes. Since January 2021 female employment has grown much more strongly (+371.6k/6.1%) than males (338.9k/5.0%) but in October male employment lifted 24.0k/0.3% compared to the smaller 8.3k/0.1% gain for females. The saw the unemployment rate for men fall 0.3ppt to 3.2%, the lowest rate since November 1974. For women, unemployment was steady at 3.6%.
The participation rate fell 0.1ppt for men to 70.9% and was steady for women at 62.3%. A falling participation for men with a robust lift in employment suggest the gain was all demand driven and employers are facing, at the margin, a tighter labour market for males than females.
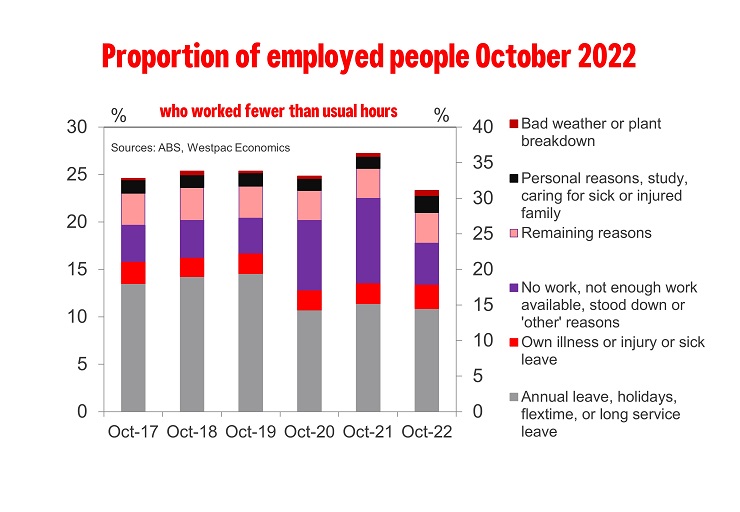
Seasonally adjusted monthly hours worked increased by 2.3 per cent, stronger than the growth in employment (0.2 per cent). This stronger growth in hours partly reflected fewer employed people than usual taking leave during October.
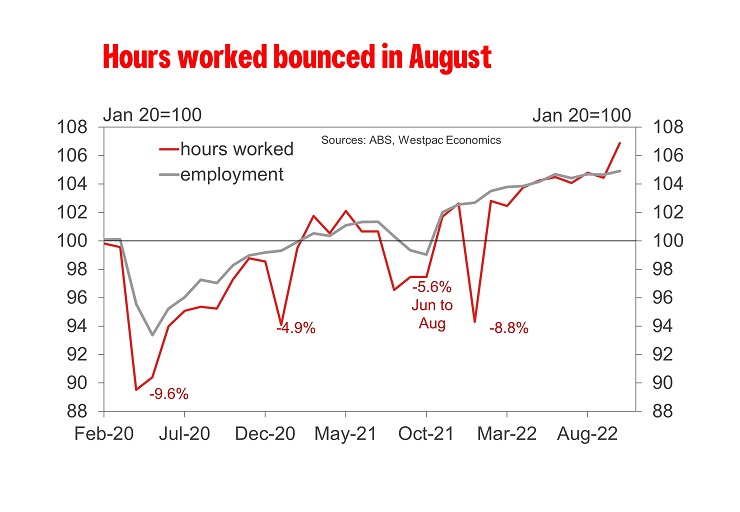
In September we noted that the number of people working fewer hours because they were sick was around 14% higher than the pre-COVID level. While still high it was down from the two to three times higher levels earlier in 2022.
For October, the ABS noted that the number of people working fewer hours because they were on annual leave increased between September and October, consistent with school holidays and public holidays. However, the number of people on annual leave in October 2022 was around 10% less than we typically see in October. Some of this difference may reflect people who would normally have taken annual leave being sick instead, with around 30% more people than usual working reduced hours in October due to sickness.
Again in October greater than usual sickness is still impacting on the data but it is no longer two-to-three times higher than usual as it was early 2022. October was the first month in 2022 where the number of people working less than usual dropped below 500k (467k).
The widespread catastrophic flood across NSW, Victoria and Tasmania saw the number of people working reduced hours due to bad weather increase from 66k in September to 100k in October.
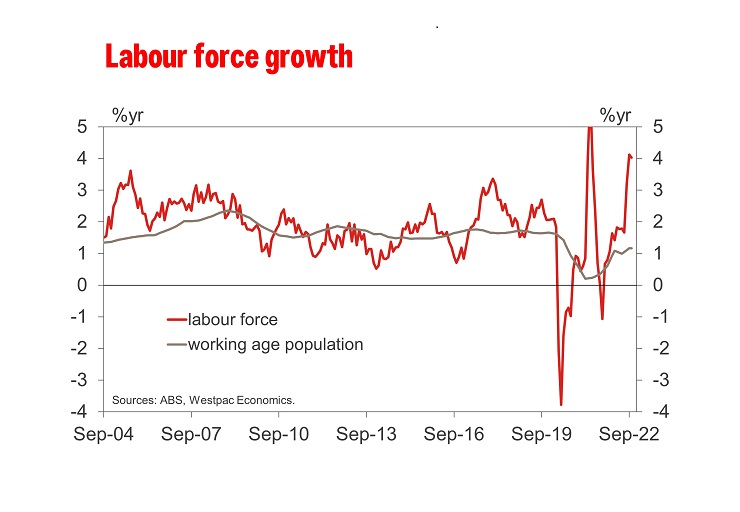
We should also note that the Labour Force Survey continues to report a pickup in immigration with annual growth in the working age population lifting from 0.6%yr last December to 1.2%yr in October. Prior to COVID annual growth in the working age population peaked at 1.7%yr in 2018/2019.
By state unemployment fell in NSW (-0.3ppt to 3.0%), Qld (-0.4ppt to 3.3%), SA (0.2ppt to 4.1%) and Tasmania (-0.3ppt to 4.0%) while it lifted in Victoria (0.1ppt to 3.6%) and WA (0.2ppt to 3.6%).
Crude Oil Price Dips, Can This Key Support Hold?
Key Highlights
- Crude oil price started a fresh decline from well above $90.
- A major bearish trend line is forming with resistance near $87.20 on the 4-hours chart.
- Gold price started a consolidation phase after a strong move above $1,750.
- Bitcoin price remains at risk of more losses unless it clears $17,500.
Crude Oil Price Technical Analysis
Crude oil price started a fresh decline from the $93.50 zone against the US Dollar. The price gained pace and traded below the $90.00 support zone.
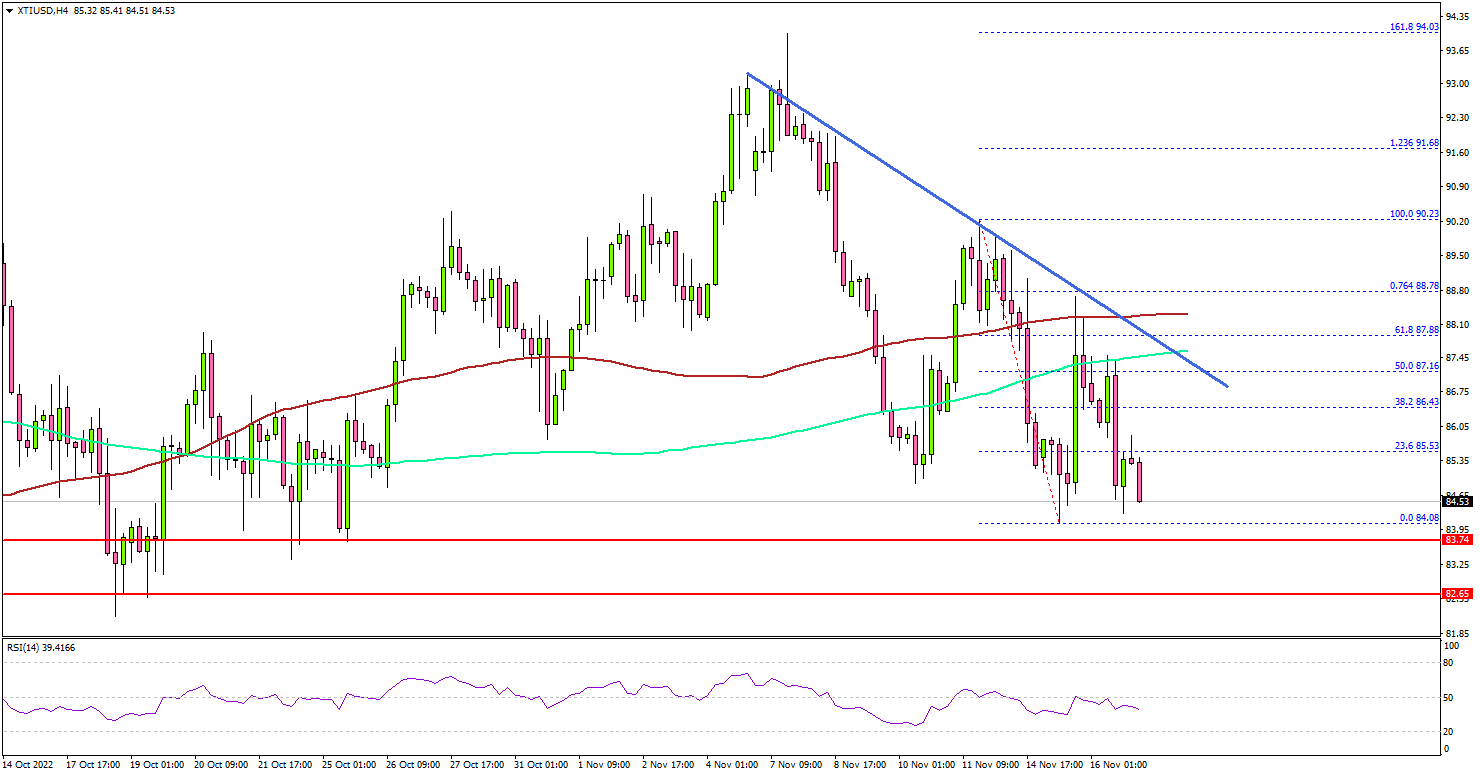
Looking at the 4-hours chart of XTI/USD, there was a break below the $88.80 support zone. The price even settled below the $88.00 level, the 100 simple moving average (red, 4-hours), and the 200 simple moving average (green, 4-hours).
The bears seem to be in control, with an immediate support near the $84.00 zone. The next major support is near $82.65 zone. Any more losses might call for a test of the $80.00 support zone in the coming days.
On the upside, the price might face sellers near the $86.50 zone. The next major resistance is near $87.00 and a connecting bearish trend line, above which the price could test the 100 simple moving average (red, 4-hours).
A clear move above the 100 simple moving average (red, 4-hours) and the $88.80 resistance could open the doors for a steady increase in the coming sessions.
Looking at gold price, there was a steady increase above the $1,750 and $1,760 resistance. It is now consolidating gains below the $1,800 level.
Economic Releases to Watch Today
- US Initial Jobless Claims - Forecast 225K, versus 225K previous.
- US Housing Starts for Oct 2022 (MoM) – Forecast 1.410M, versus 1.439M previous.
- US Building Permits for Oct 2022 (MoM) – Forecast 1.512M, versus 1.564M previous.