Sample Category Title
EURUSD: Double Failure at 200DMA and Overbought Conditions Warn of Pullback
The Euro is trading within a narrow range in early Thursday’s and still constructive, but warnings about bulls running out of steam are growing.
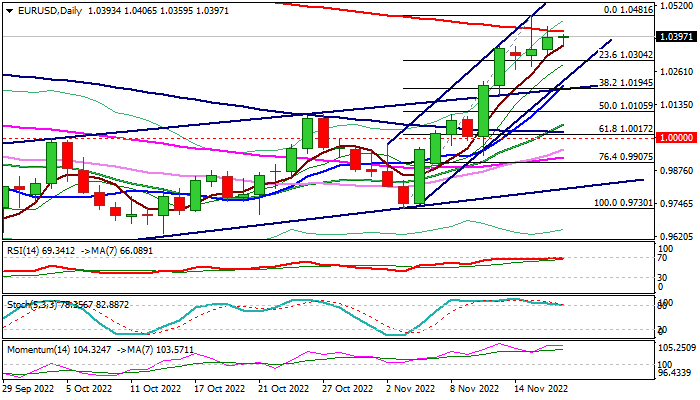
Long upper shadows of daily candles in past two days and double failure to register daily close above significant barrier provided by falling 200DMA (1.0417) add to risk of bull trap and possible pullback.
Stochastic is about to reverse from overbought territory and bullish momentum started to fade, adding to initial negative signals. Larger bulls are likely to take a breather on overextended daily studies and a partial profit-taking after the latest steep bullish acceleration from 0.9730 (Nov 3 trough).
Expect initial bearish signal on today’s bearish close, preferably below Fibo support 1.0304 (23.6% of 0.9730/1.0304, with dips to find firm ground at 1.0200 zone (rising 10DMA / broken bull-channel upper boundary trendline / Fibo 38.2%) and keep bulls in play.
Conversely, the pair would keep bullish bias while holding above 1.0304 pivot, but may hold in extended consolidation as long as action stays capped by 200DMA.
Bullish scenario requires final break of 200DMA to signal bullish continuation of recovery leg from 0.9535 (Sep 20 low) through pivotal 1.05 zone which would unmask June tops (lower platform at 1.0600/15 zone).
Res: 1.0417; 1.0491; 1.0550; 1.0614.
Sup: 1.0363; 1.0304; 1.0271; 1.0200.
GBP/JPY Daily Outlook
Daily Pivots: (S1) 165.22; (P) 165.80; (R1) 166.88; More...
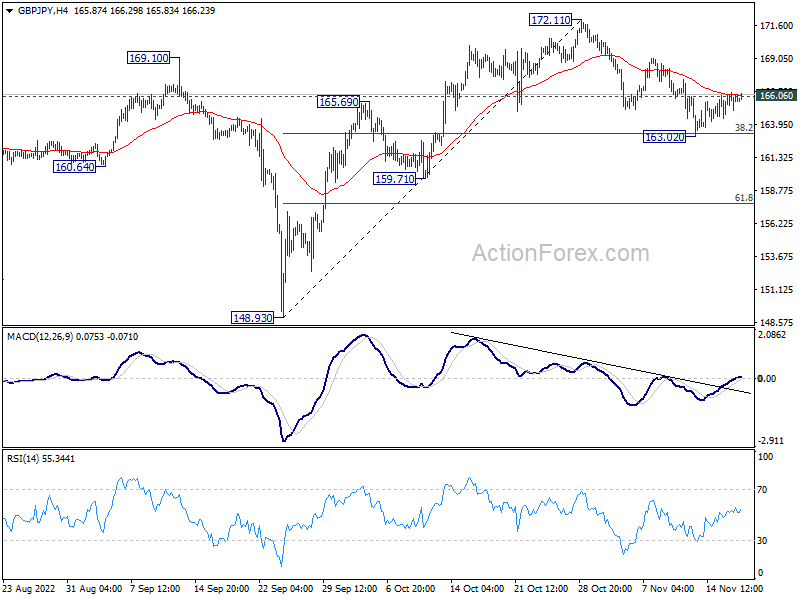
Intraday bias in GBP/JPY stays neutral first and outlook is unchanged. Strong rebound from current level, followed by break of 166.06 minor resistance will turn bias back to the upside for retesting 172.11 high. However, sustained trading below 38.2% retracement of 148.93 to 172.11 at 163.25 will bring deeper decline to 61.8% retracement at 157.78 and possibly below.
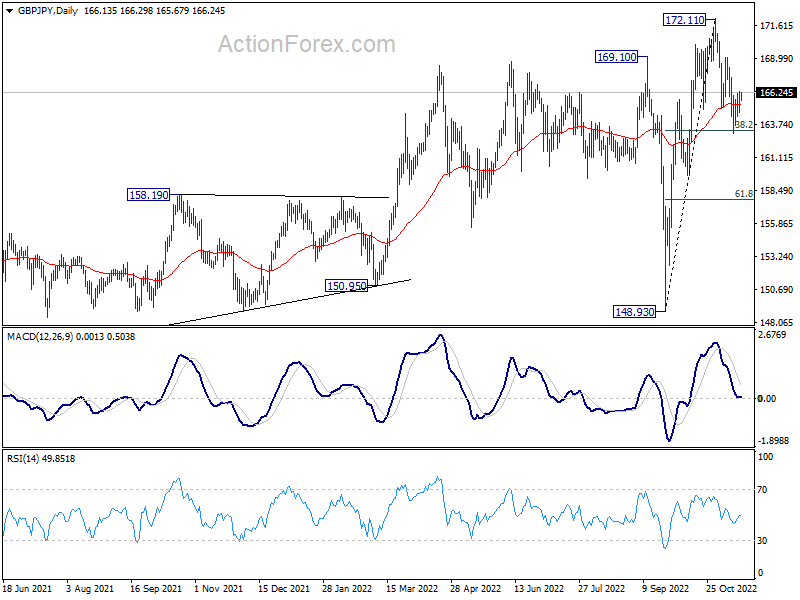
In the bigger picture, there is no clear sign of medium term topping yet. Up trend from 123.94 (2020 low) could still resume through 172.11 high at a later stage. However, firm break of 159.71 support will argue that it's already in correction to the up trend from 123.94, and deeper decline would be seen back towards 148.93 support.
EUR/JPY Daily Outlook
Daily Pivots: (S1) 143.91; (P) 144.70; (R1) 145.84; More....
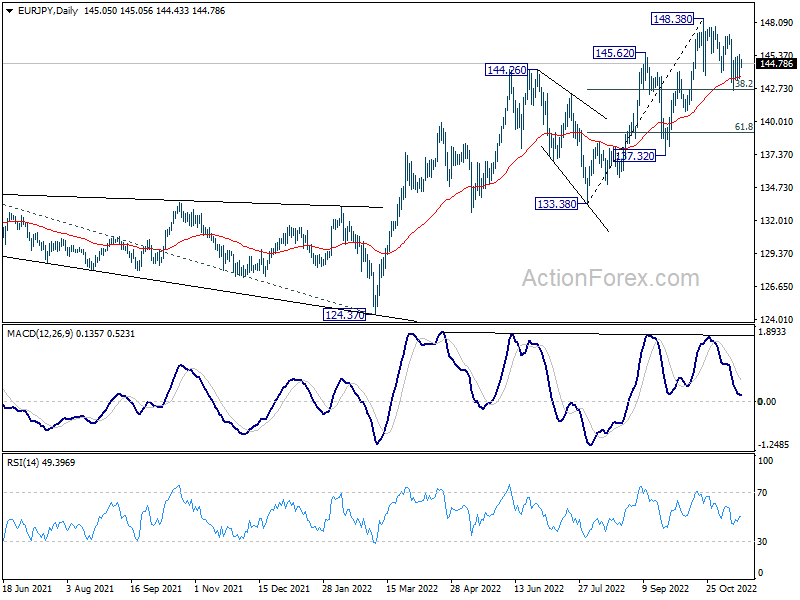
Outlook in EUR/JPY remains unchanged and intraday bias stays mildly on the upside. Correction from 148.38 might have completed at 142.54, after hitting 38.2% retracement of 133.38 to 148.38 at 142.65. Further rally would be seen to retest 148.38 high. However, on the downside, sustained break of 142.65 will bring deeper fall to 61.8% retracement at 139.11 and possibly below.
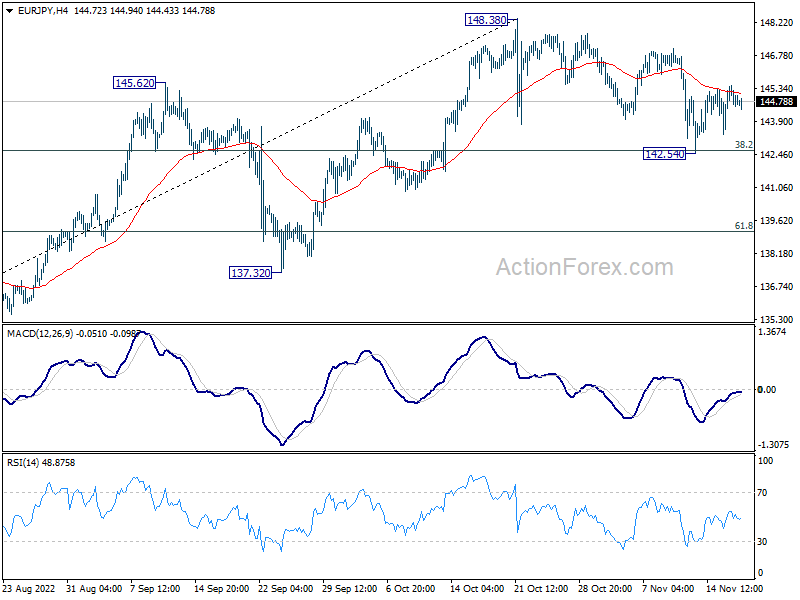
In the bigger picture, there is no clear sign of medium term topping yet. Up trend from 114.42 (2020 low) could still resume through1 48.38 to 149.76 (2014 high). However, break of 137.32 support argue that a medium term correction has already started to correct the whole up trend from 144.42.
EUR/GBP Daily Outlook
Daily Pivots: (S1) 0.8699; (P) 0.8737; (R1) 0.8761; More...
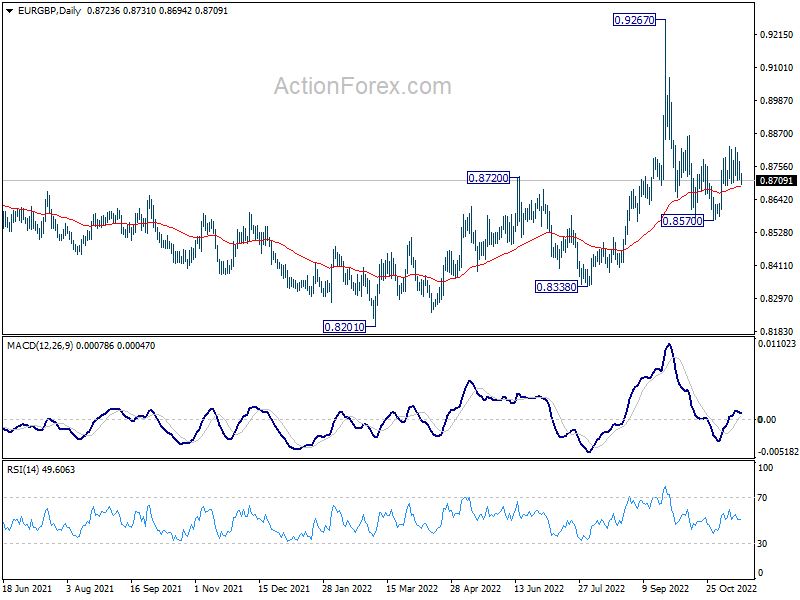
Outlook in EUR/GBP remains unchanged and intraday bias stays neutral. On the upside, break of 0.8827 will resume the rise from 0.8570 to 0.8869. Sustained break there will pave the way back to retest 0.9267 high. On the downside, below 0.8689 minor support will turn bias back to the downside for 0.8570 instead.
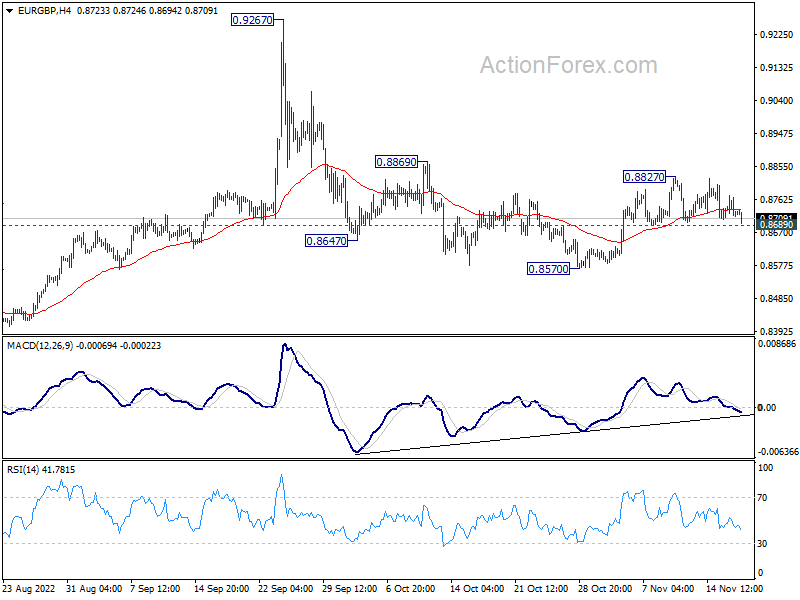
In the bigger picture, current development suggests that fall from 0.9267 is a down leg inside long term range pattern. Deeper fall could be seen towards 0.8201/8338 support zone. But strong support should be seen there to bring reversal. Nevertheless, firm break of 0.8869 resistance will turn favor to the case that such decline is merely a correction in the up trend from 0.8201. That is, further rally would be seen at a later stage through 0.9267.
EUR/AUD Daily Outlook
Daily Pivots: (S1) 1.5319; (P) 1.5384; (R1) 1.5484; More...
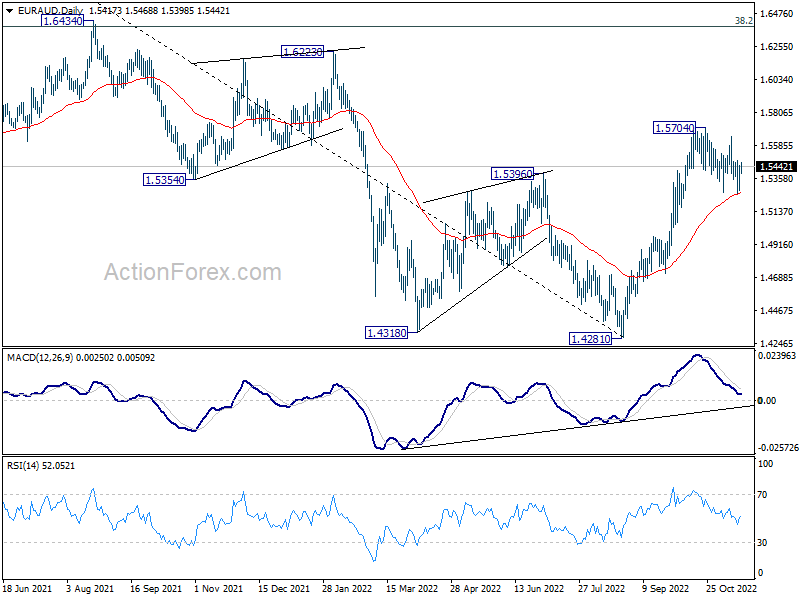
Intraday bias in EUR/AUD remains neutral for the moment. While corrective pattern from 1.5704 might extend, downside should be contained by 55 day EMA (now at 1.5265) to bring rebound. On the upside, break of 1.5704 will resume larger rise from 1.4281. However, sustained trading below 55 day EMA will bring deeper correction towards 1.4965 resistance turned support.
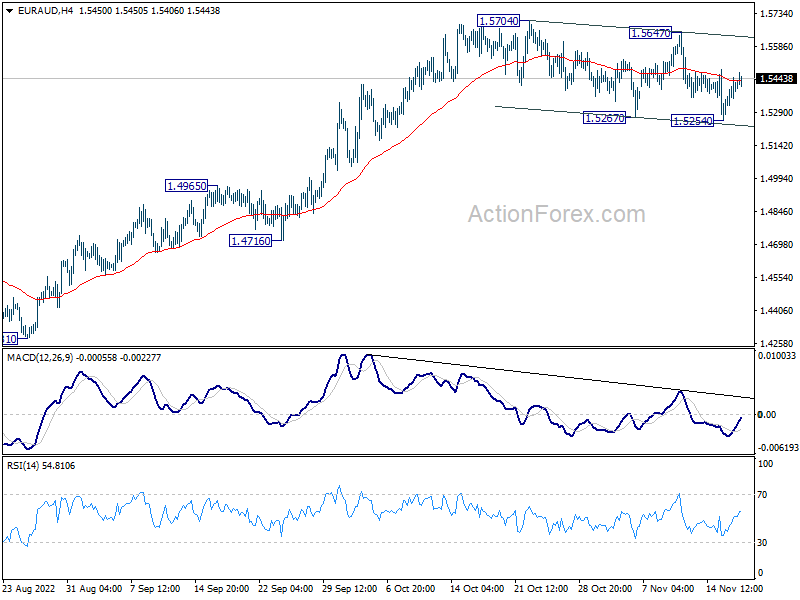
In the bigger picture, a medium term bottom should be in place at 1.4281, on bullish convergence condition in daily MACD. Further rise would be seen back to 1.6434 key resistance next. Break of 1.4965 resistance turned support is needed to indicate reversal. Otherwise, further rally will remain in favor.
EUR/CHF Daily Outlook
Daily Pivots: (S1) 0.9774; (P) 0.9799; (R1) 0.9844; More....
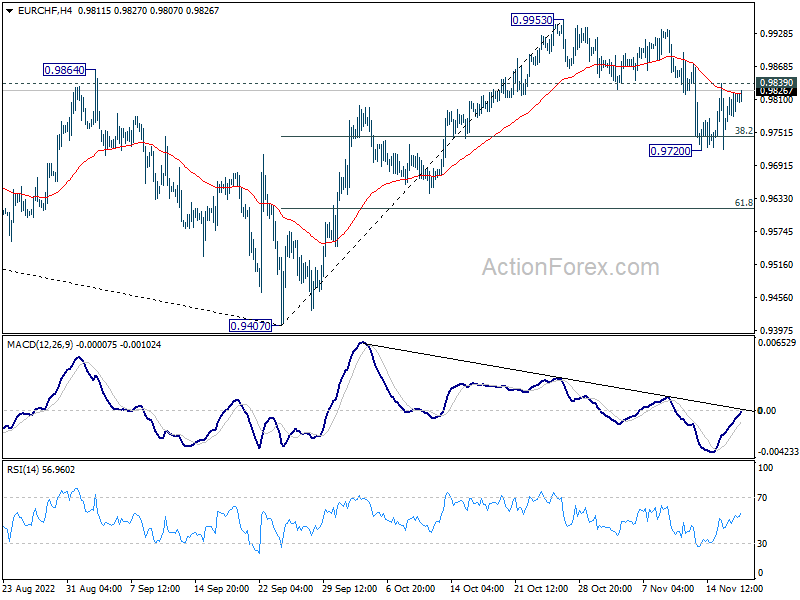
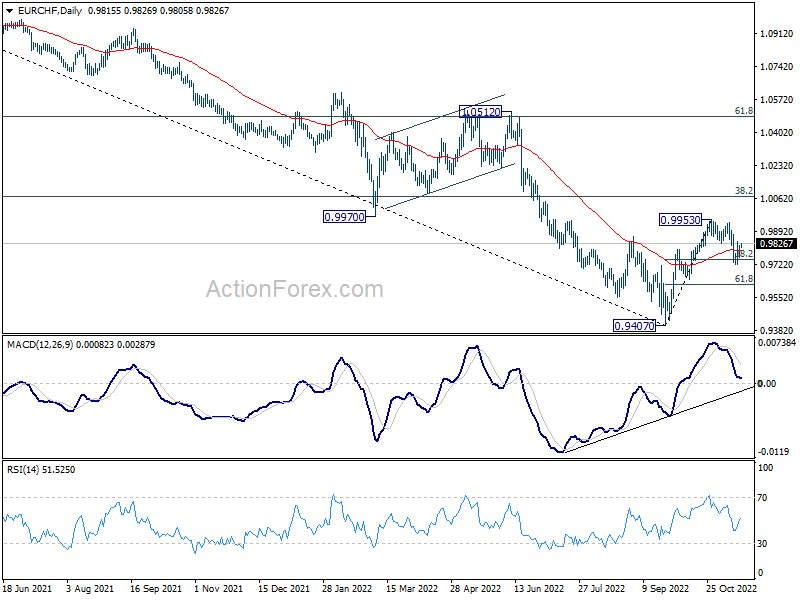
Intraday bias in EUR/CHF stays neutral for the moment. On the downside, break of 0.9720 will extend the fall from 0.9953 to 61.8% retracement at 0.9616, and possibly below. On the upside, however, break of 0.9839 resistance will turn bias back to the upside for retesting 0.9953 instead.
In the bigger picture, rejection by 0.9970 support turned resistance retains medium term bearishness. That is, while 0.9407 is a medium term bottom, price actions from there would develope into a corrective pattern rather than a reversal. That is, down trend resumption through 0.9407 is favored at a later stage. This will remain the favored case now, as long 38.2% retracement of 1.1149 to 0.9407 at 1.0072 holds.
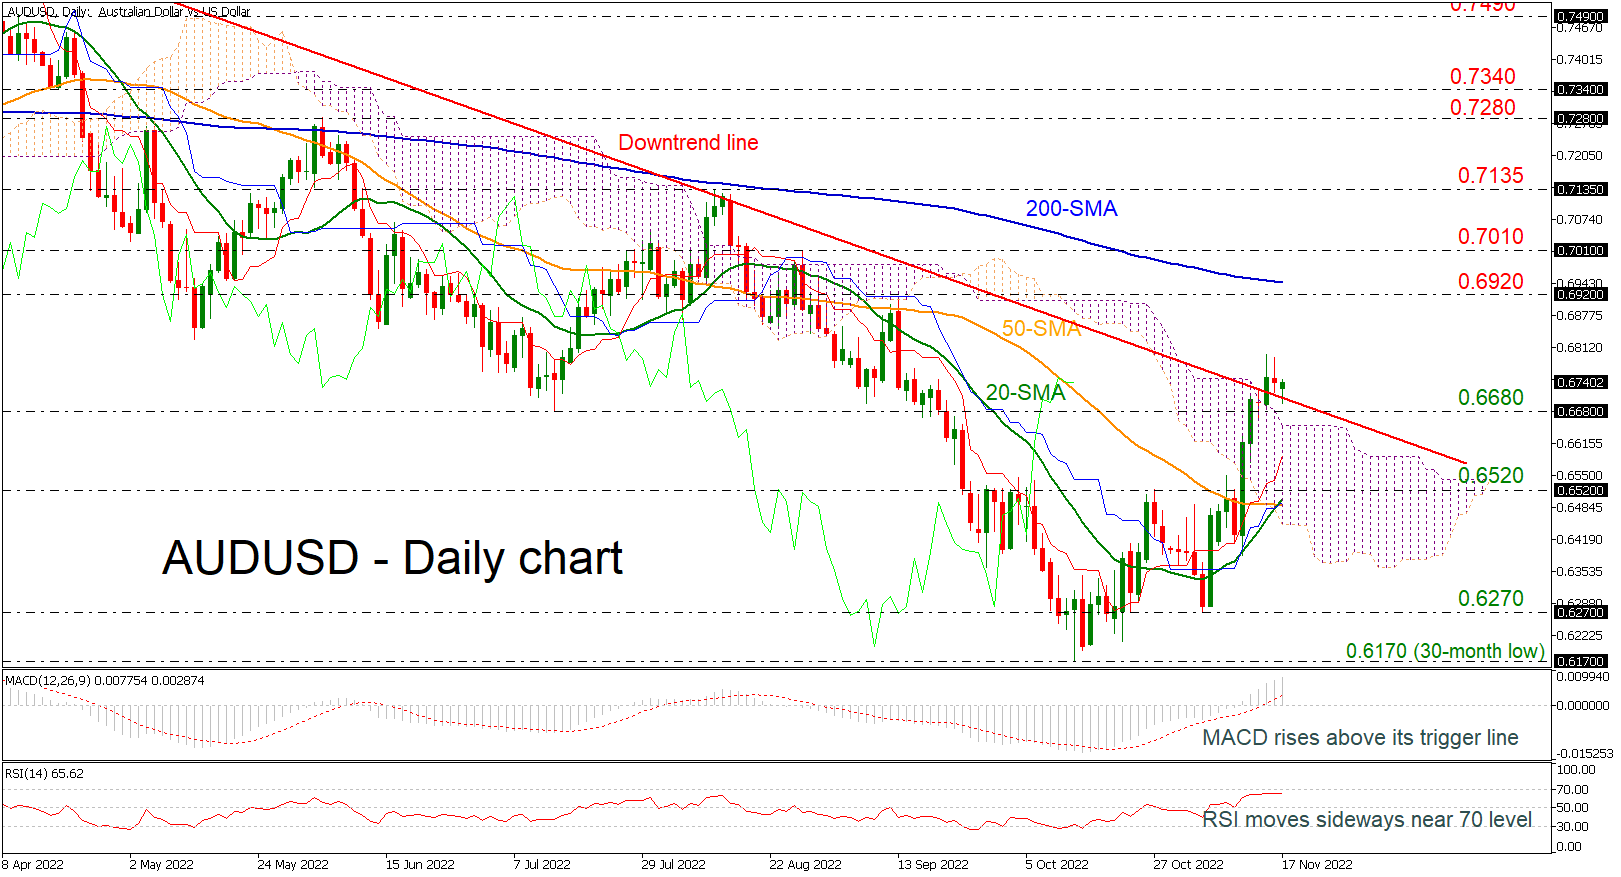
AUDUSD Remains Above Downtrend Line But With Weak Momentum
AUDUSD is still standing above the long-term downtrend line; however, the momentum is too weak to sustain the bullish movement that started after the bounce off the 0.6270 support level.
The MACD oscillator is strengthening the positive move above its trigger and zero lines, suggesting more gains, but, on the other hand, the RSI is sloping marginally down after several failed attempts to climb into the overbought region. In trend indicators, the 20- and 50-day simple moving averages (SMAs) created a bullish crossover, confirming the upside structure.
In the wake of negative pressures, the market could meet support at the 0.6680 barrier before it heads lower to the Ichimoku cloud and the 0.6520 support. A successful close below this level could see a retest of the SMAs at 0.6490, while in case of steeper declines, the pair could breach this region, diving to the 0.6270 mark.
On the flip side, a move to the upside could see immediate resistance at the 0.6920 level ahead of the 200-day SMA at 0.6940. Even higher, the 0.7010 line could be a strong obstacle as it could be the sign for switching the outlook to bullish.
Turning to the short-term picture, the market seems to be in bullish mode given that the pair trades above the downtrend line. In the bigger picture, a break above the 200-day SMA is expected to endorse the near-term outlook.
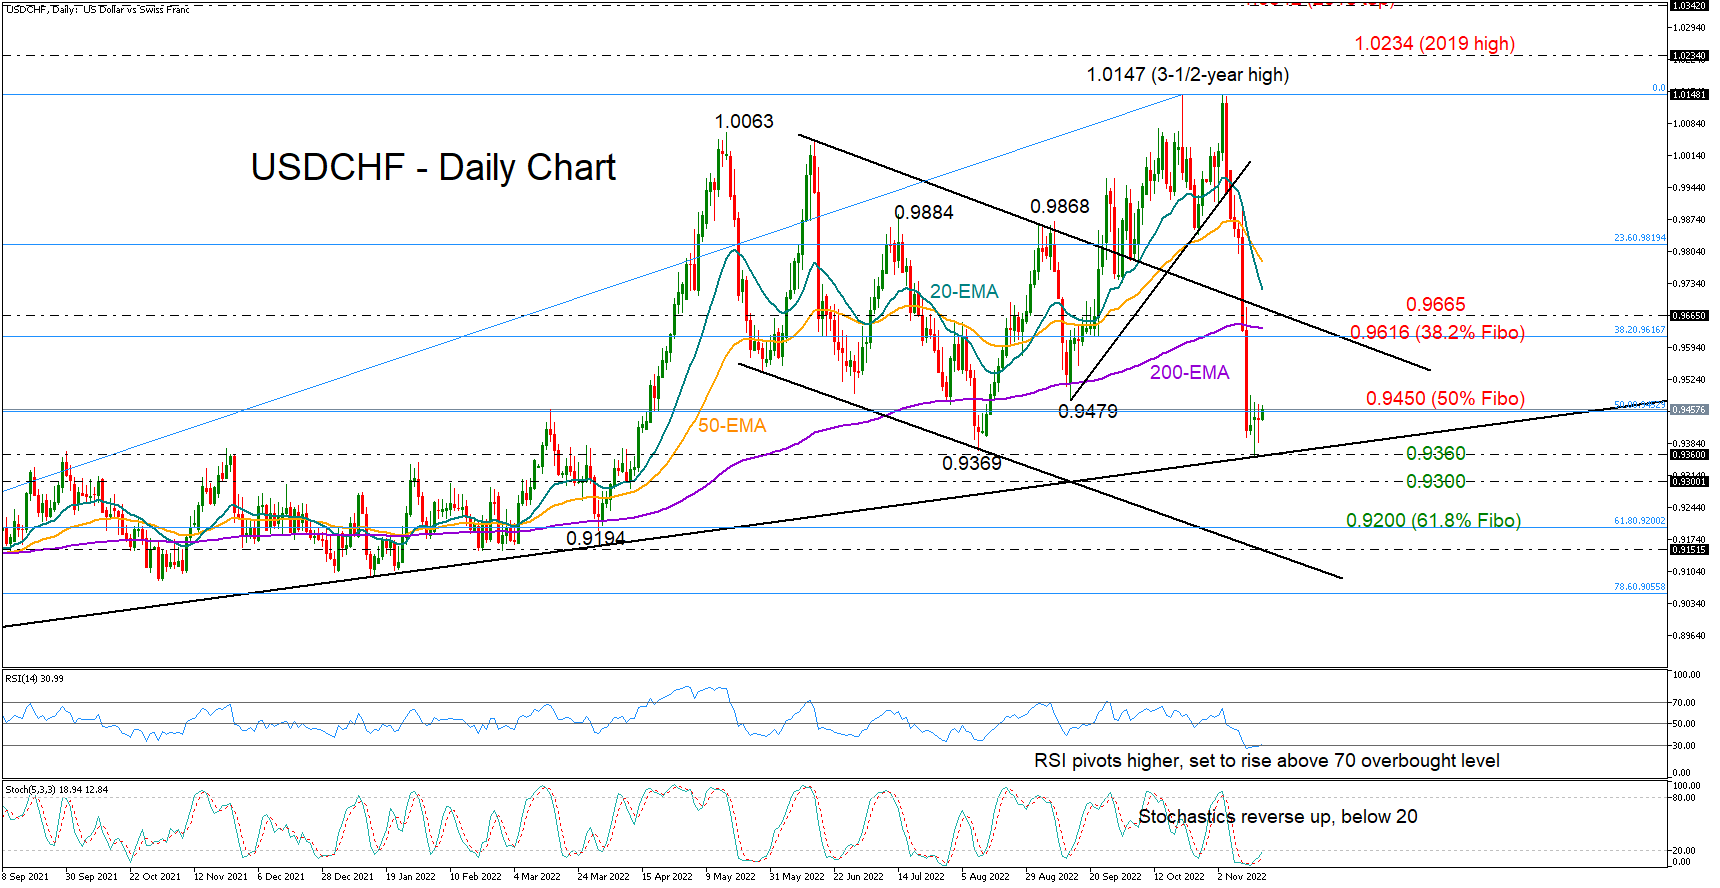
USDCHF Rebounds Near 2020 Support Trendline
USDCHF suffered a painful drop of 5% last week, but the 2020 support trendline came to the rescue, halting the freefall at a seven-month low of 0.9355.
Although in bearish territory, the RSI and the stochastics are pushing higher to exit the oversold region, reflecting fading selling forces.
The pair has been trapped below the familiar resistance of 0.9450 so far this week and a penetration of that wall is probably required to trigger the next bullish phase. Note that the 50% Fibonacci retracement of the 0.8814-1.0147 downleg is in the same location. Hence, a decisive close above it could see a direct flight towards the 38.2% Fibonacci level of 0.9616, where the 200-day exponential moving average (EMA) is converging. Slightly higher, the resistance trendline of the broken descending channel could be another key area to watch near 0.9665.
Should the bears retake control, all eyes will turn again to the long-term ascending trendline at 0.9360. Failure to pivot here this time could initially press the price towards the 0.9300 psychological mark and then squeeze it towards the 61.8% Fibonacci of 0.9200. The channel’s lower boundary could next come on the radar near 0.9130.
In brief, the odds for an upside reversal are increasing in USDCHF, with traders likely waiting for a decisive close above the 0.9450 bar to target higher levels.
EUR/USD Daily Outlook
Daily Pivots: (S1) 1.0338; (P) 1.0388; (R1) 1.0445; More...
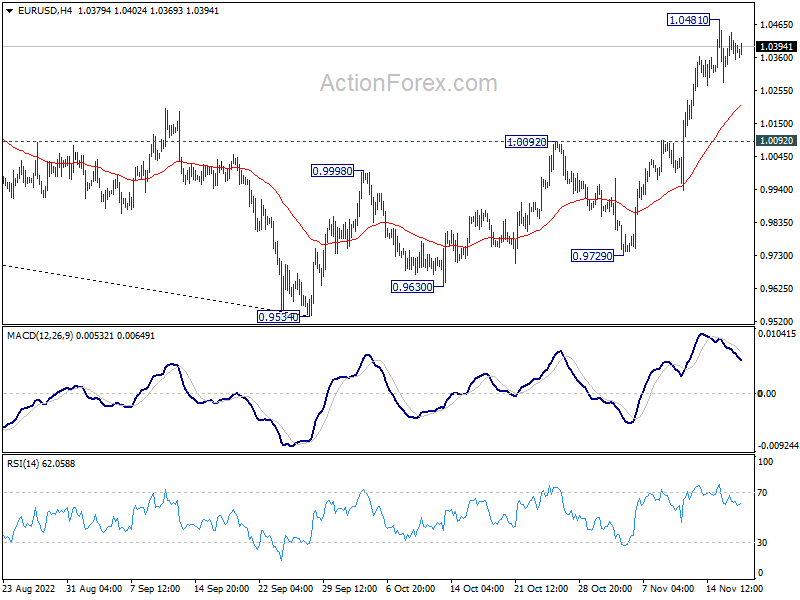
EUR/USD is staying in consolidation from 1.0481 and intraday bias remains neutral. Downside of retreat should be contained by 1.0092 resistance turned support to bring another rally. Break of 1.0481 will resume the rise from 0.9534 and target 1.0609 fibonacci level.
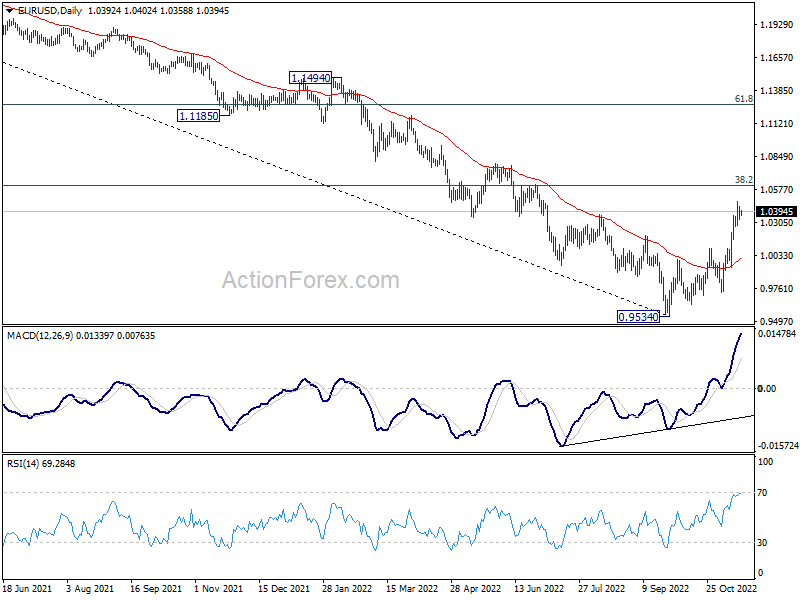
In the bigger picture, a medium term bottom was in place at 0.9534, on bullish convergence condition in daily MACD. Even as a corrective rise, rally from 0.9534 should target 38.2% retracement of 1.2348 (2021 high) to 0.9534 at 1.0609. Sustained trading above 55 week EMA (now at 1.0566) will raise the chance of trend reversal and target 61.8% retracement at 1.1273. This will now remain the favored case as long as 1.0092 resistance turned support holds.
GBP/USD Daily Outlook
Daily Pivots: (S1) 1.1851; (P) 1.1896; (R1) 1.1961; More...
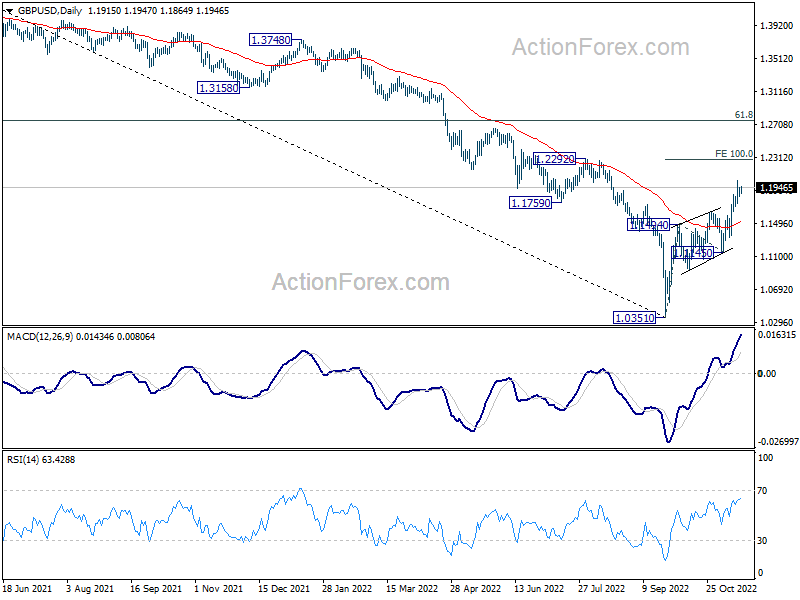
GBP/USD is staying in consolidation from 1.2028 and intraday bias stays neutral. Downside of retreat should be contained by 1.1597 minor support to bring another rally. On the upside, above 1.2028 will resume the rise from 1.0351 to 100% projection of 1.0351 to 1.1494 from 1.1145 at 1.2288.
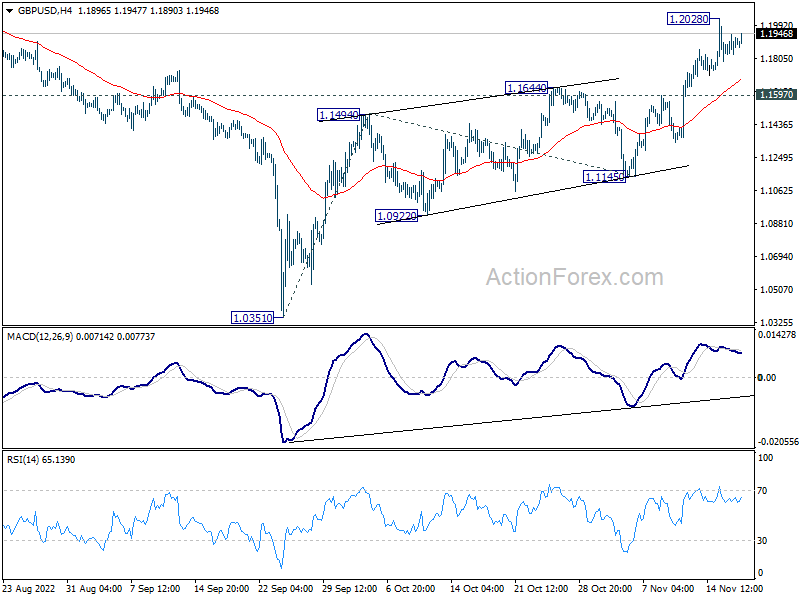
In the bigger picture, rise from 1.0351 medium term bottom is at least correcting whole down trend from 1.4248 (2021 high). Further rise is expected as long as 1.1145 support holds. Next target is 61.8% retracement of 1.4248 to 1.0351 at 1.2759.