Sample Category Title
Technical Outlook and Review
USD/JPY:
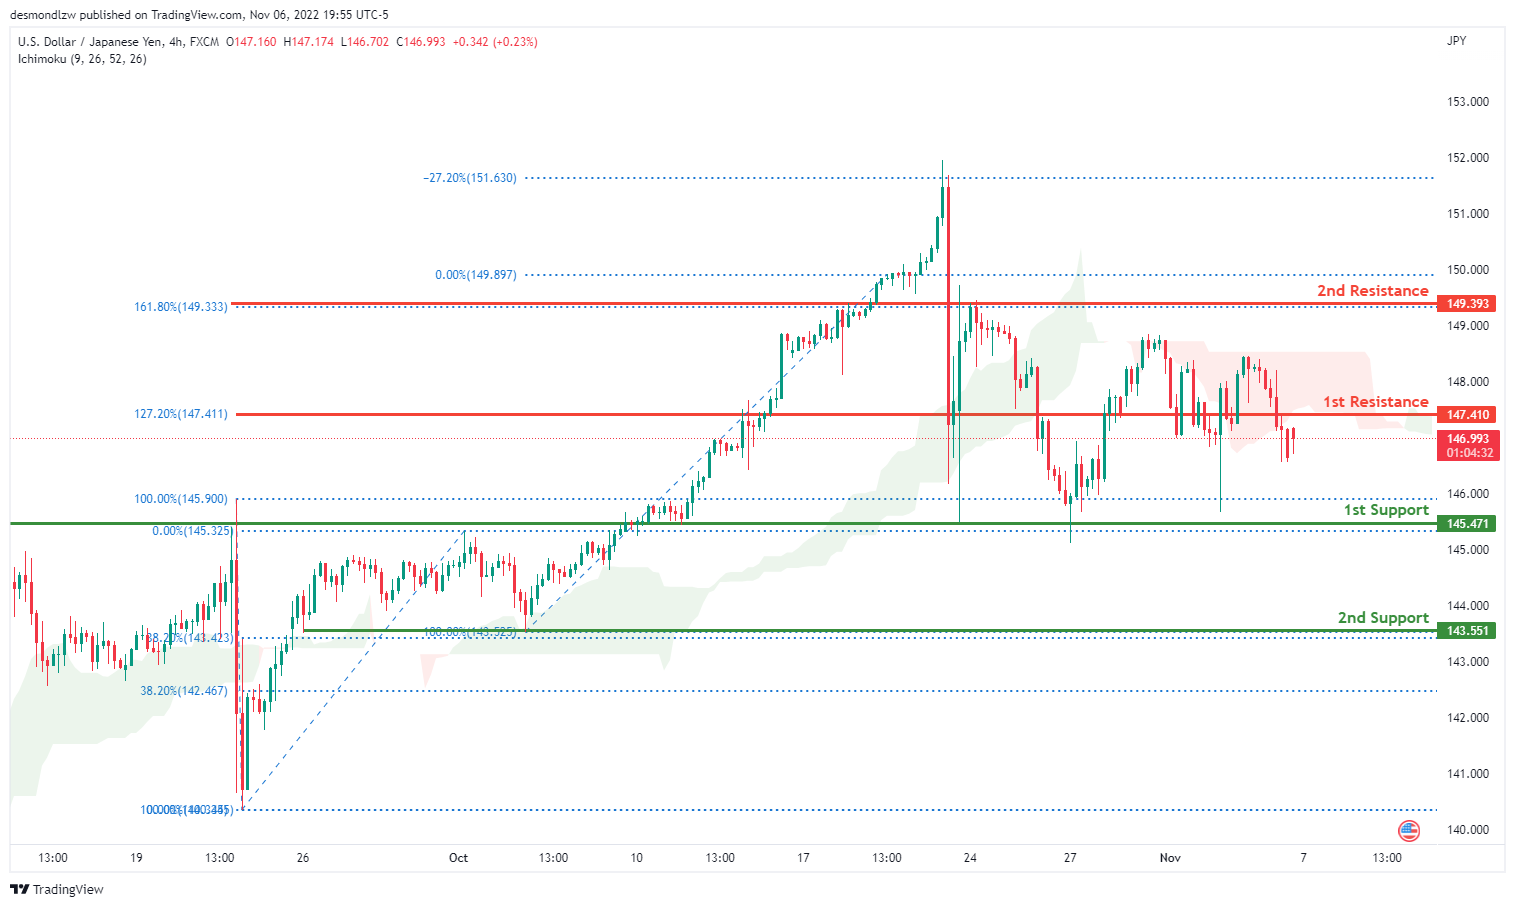
The current general bias for USDJPY on the H4 chart is bearish. To add confluence to this, the price is below the Ichimoku cloud which indicates a bearish market. Towards the end of last week, USDJPY experienced some bearish momentum due to the NFP data release with the price closing above the 1st resistance line at 147.410 where the 127.2% Fibonacci extension line is located. Price is currently trading at 147.005 at time of writing. If the bearish momentum continues, expect USDJPY to possibly head towards the 1st support line at 145.471, where the 100% and 0% Fibonacci lines are located. In an alternative scenario, price could break above the 1st resistance and head towards the 2nd resistance at 149.393 where the 161.8% and 0% Fibonacci lines are located.
Areas of consideration:
- H4 time frame, 1st resistance at 147.410
- H4 time frame, 1st resistance at 149.393
- H4 time frame, 1st support at 145.471
DXY:
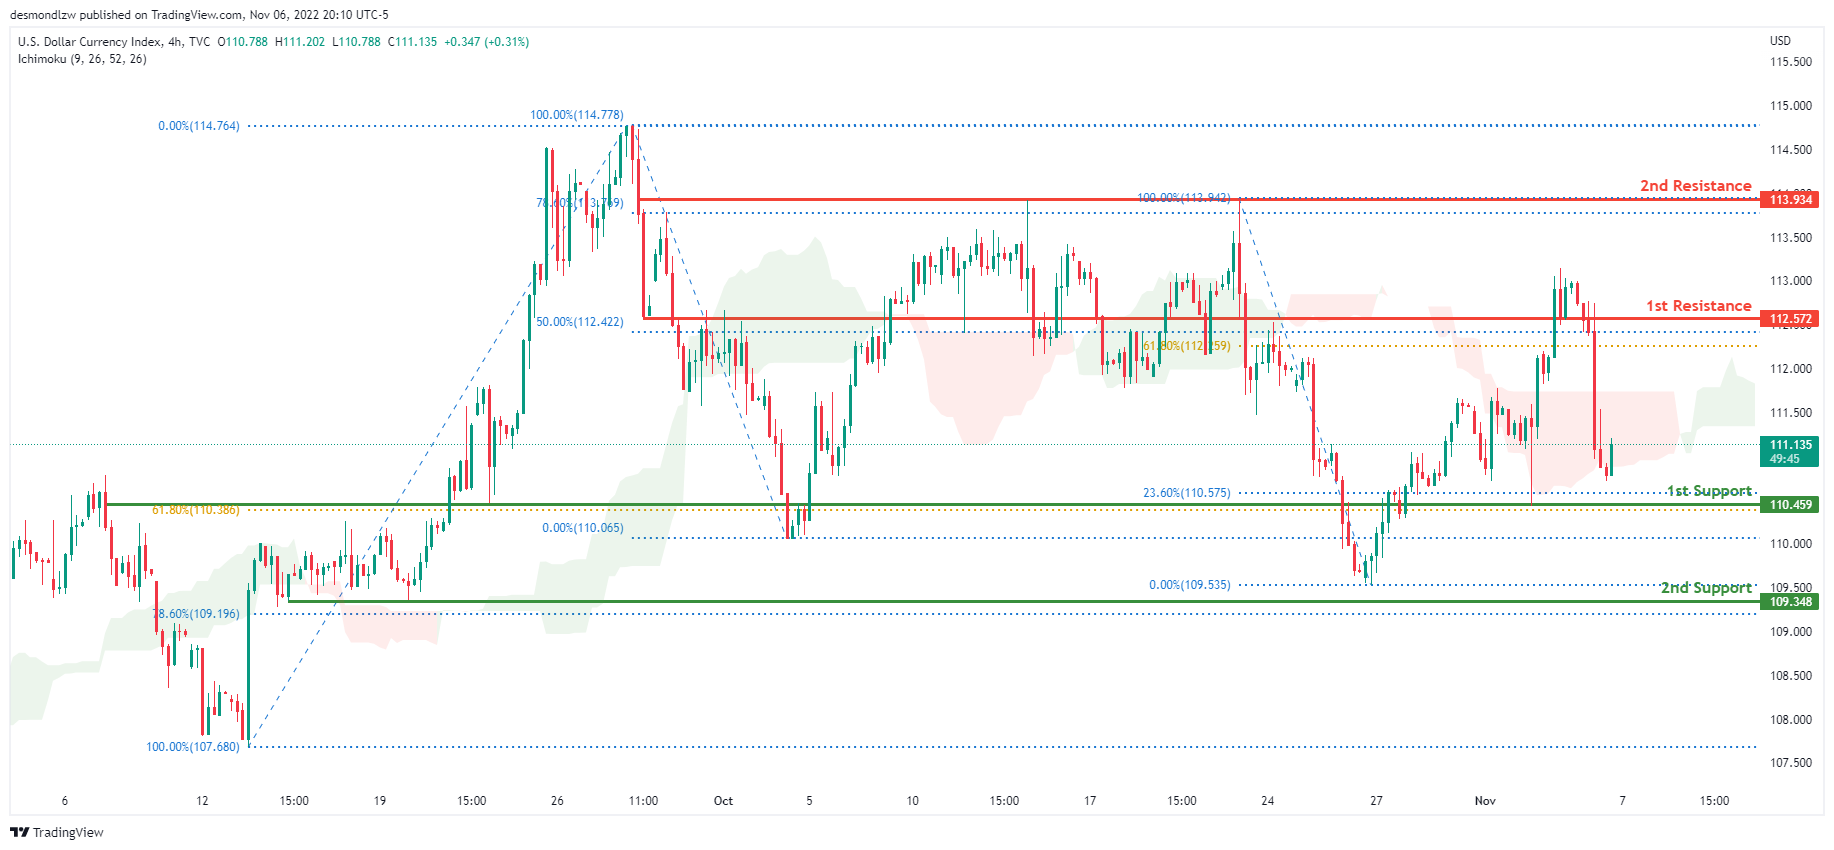
On the H4 chart, the overall bias for DXY is bearish. To add confluence to this, the price is crossing below the Ichimoku cloud which indicates a bearish market. Towards the end of last week, price had huge bearish momentum due to the release of the NFP data. The price is currently trading at 111.140 at the time of writing. If this bearish momentum continues, price could head towards the 1st support line at 110.459 where the 61.8% and 23.6% Fibonacci lines are located. In an alternative scenario, price could head back up towards the 1st resistance line at 112.572 where the 50% and 61.8% Fibonacci lines are located.
Areas of consideration:
- H4 time frame, 1st resistance at 112.572
- H4 time frame, 1st support at 110.459
EUR/USD:
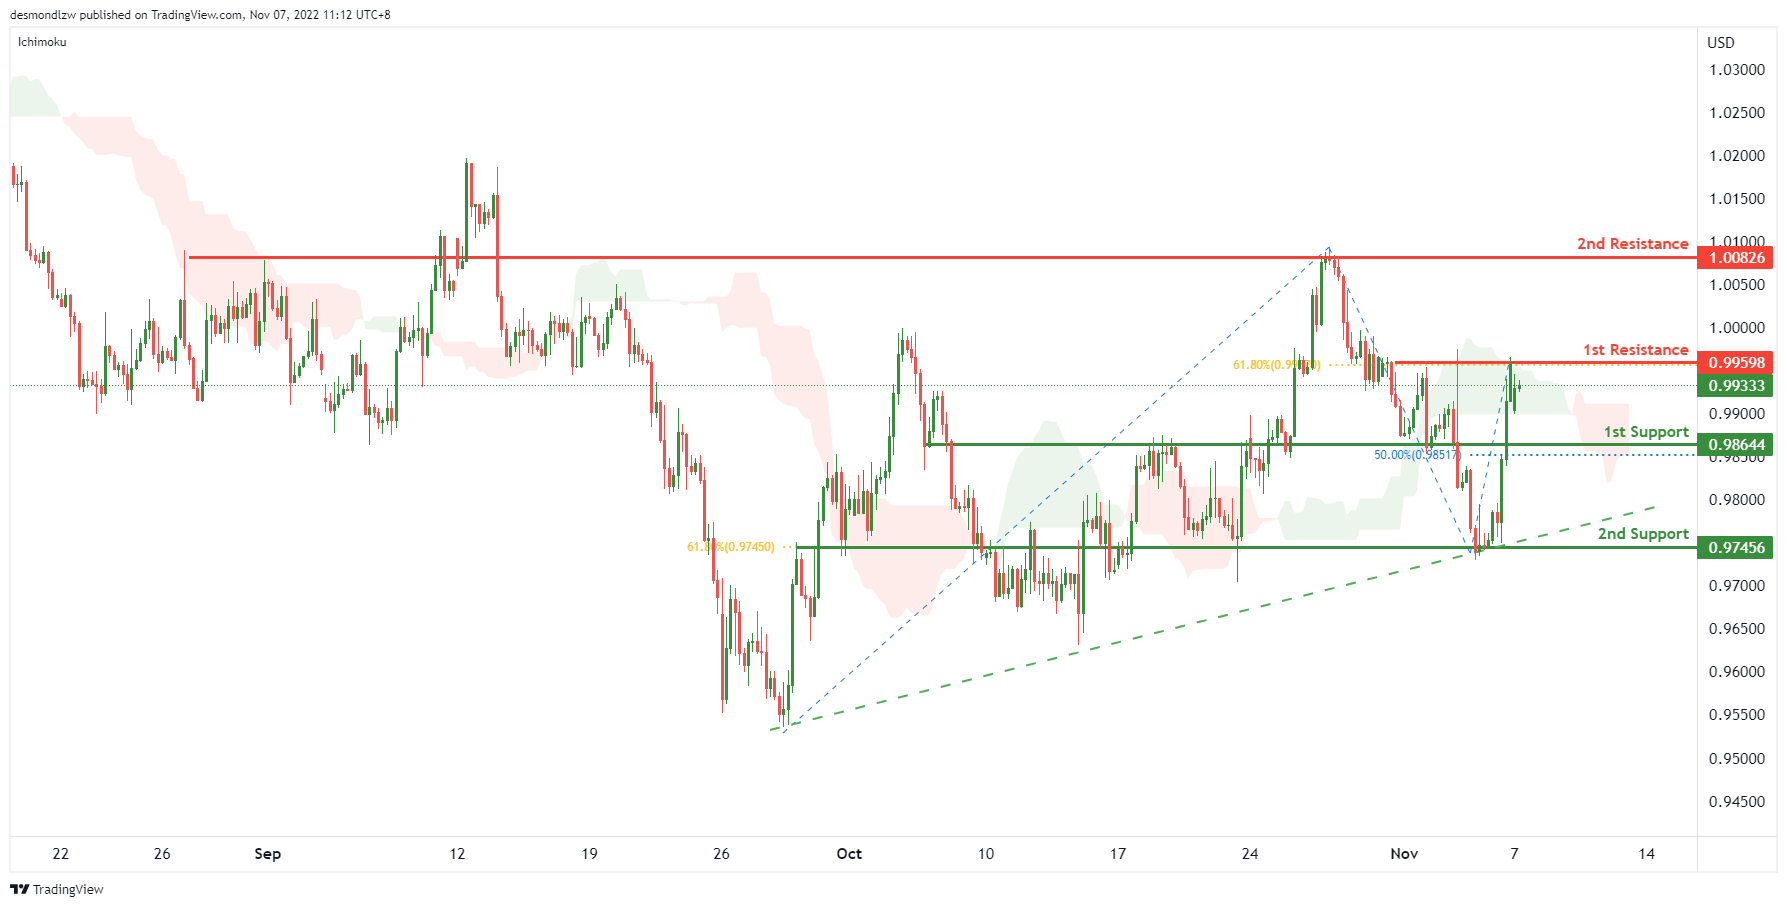
On the H4, with the price moving above the ascending trendline and above ichimoku cloud, we have a bullish bias that the price may break the 1st resistance at 0.99598, which is in line with the 61.8% fibonacci retracement and rise to the 2nd resistance at 1.00826, where the previous swing highs are. Alternatively, the price may drop to the 1st support at 0.98644, which is in line with the 50% fibonacci retracement and overlap support. If the 1st support is broken, the 2nd support is at 0.97456, which is in line with the swing low and 61.8% fibonacci
Areas of consideration :
- H4 1st support at 0.97456
- H4 2nd support is 0.96484,
GBP/USD:
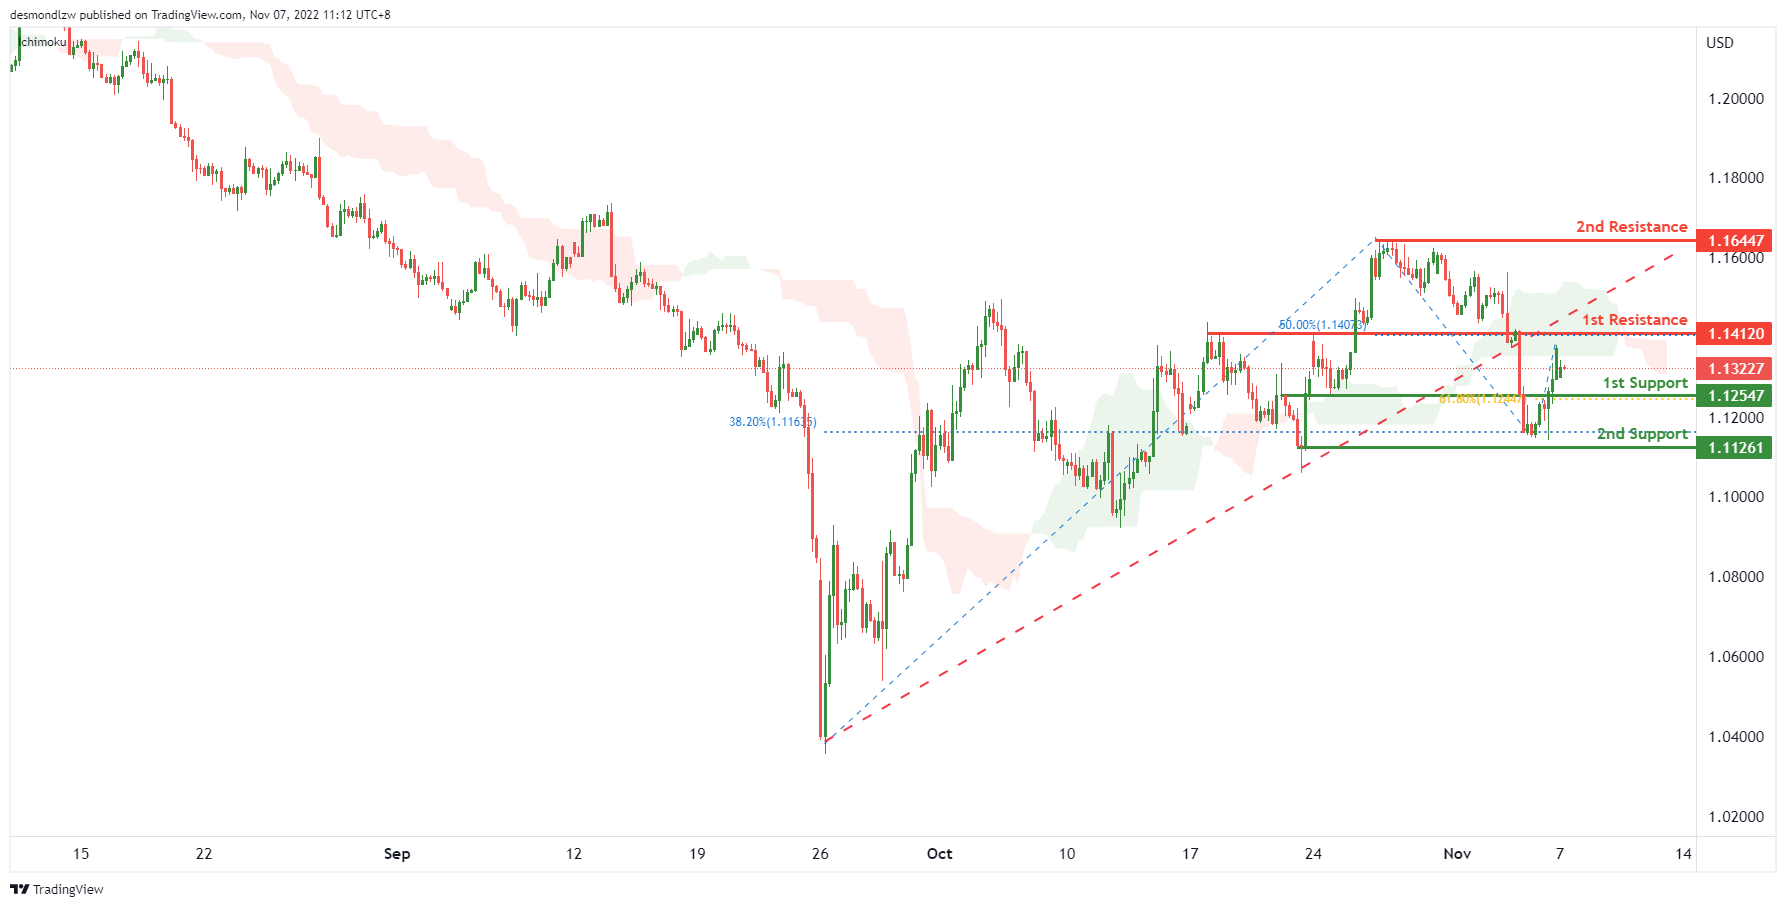
On the H4, price is below the ichimoku cloud and breaking the ascending trendline, we have a bearish bias that the price may rise to test the 1st resistance at 1.14120, which is in line with the 50% fibonacci retracement and overlap resistance and drop to the 1st support at 1.12547, which is in line with the 61.8% fibonacci retracement. If the 1st support is broken, the 2nd support is at 1.11261, where the swing low is. Alternatively, the price may break the 1st resistance and rise to the 2nd resistance at 1.16447, which is in line with the swing high.
Areas of consideration:
- H4 1st resistance at 1.14120
- H4 1st support at 1.12547
USD/CHF:
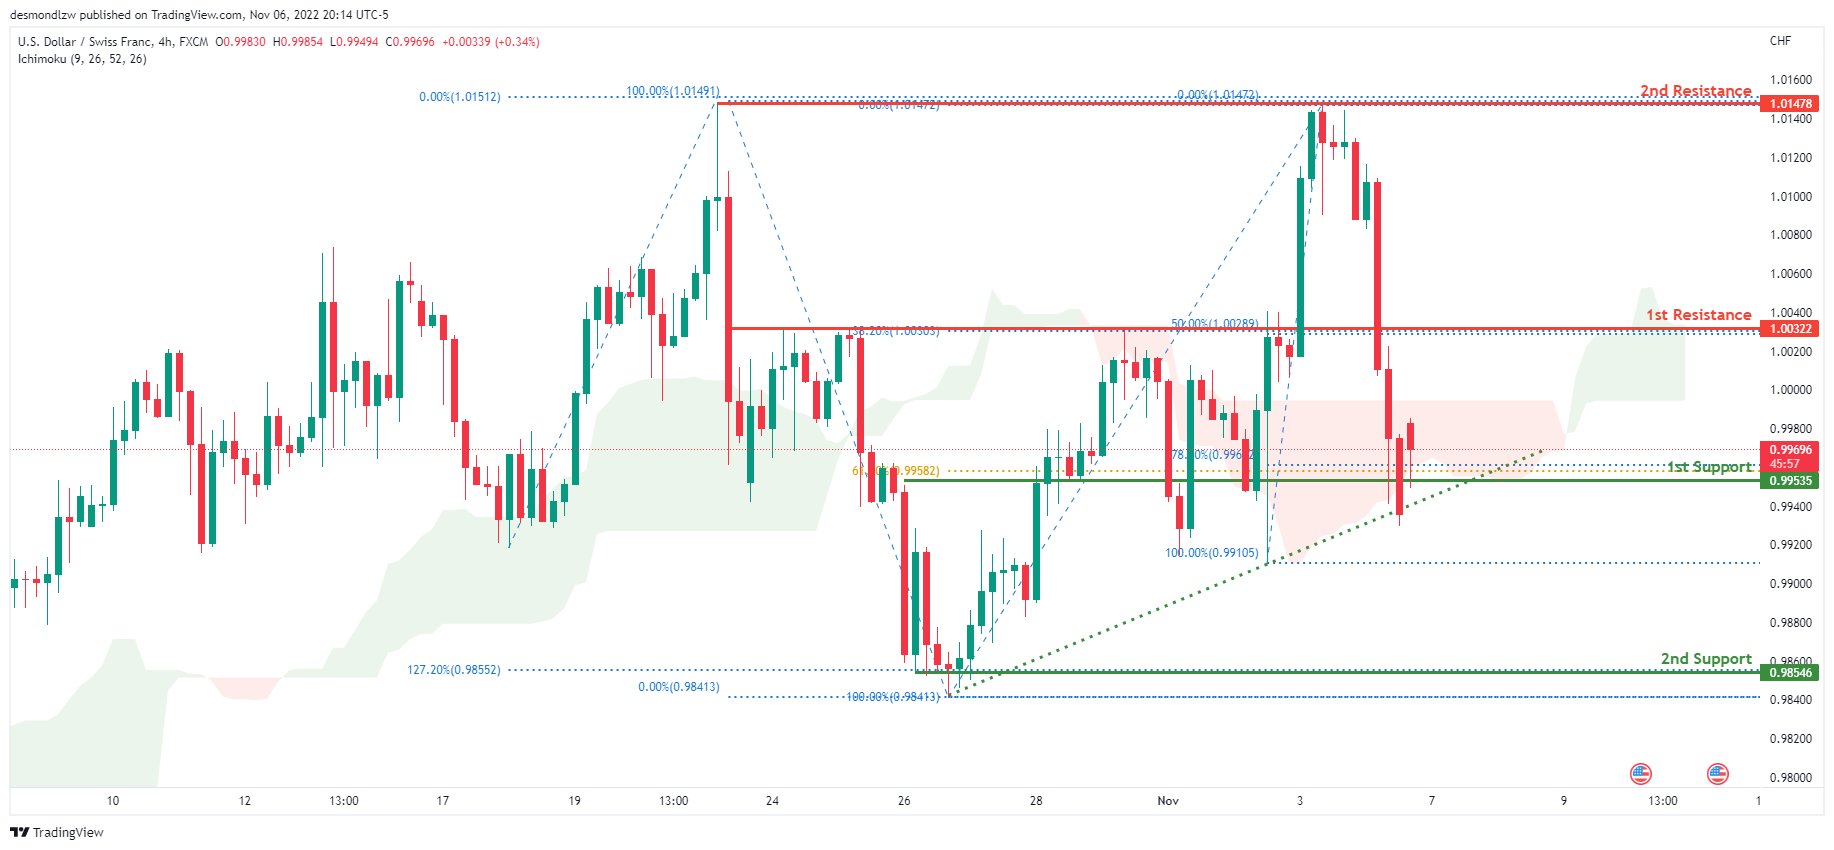
On the H4 chart, the overall bias for USDCHF is bearish. To add confluence to this, the price is below the Ichimoku cloud which indicates a bearish market. Towards the end of last week, price had huge bearish momentum downwards due to the release of the NFP data. The price is currently trading at 0.99716 at the time of writing. If this bearish momentum continues, expect price to break the 1st support line at 0.99535 where the 61.8% and 78.6% Fibonacci lines are located and head towards the 2nd support line at 0.98546, where the 127.2% Fibonacci extension line, 100% Fibonacci line and previous swing low are located. In an alternative scenario, price could head back up towards the 1st resistance line at 1.00322, where the 382% and 50% Fibonacci lines are located.
Areas of consideration
- H4 1st support at 0.99535
- H4 2nd support at 0.98546
- H4 1st resistance at 1.00322
XAU/USD (GOLD):
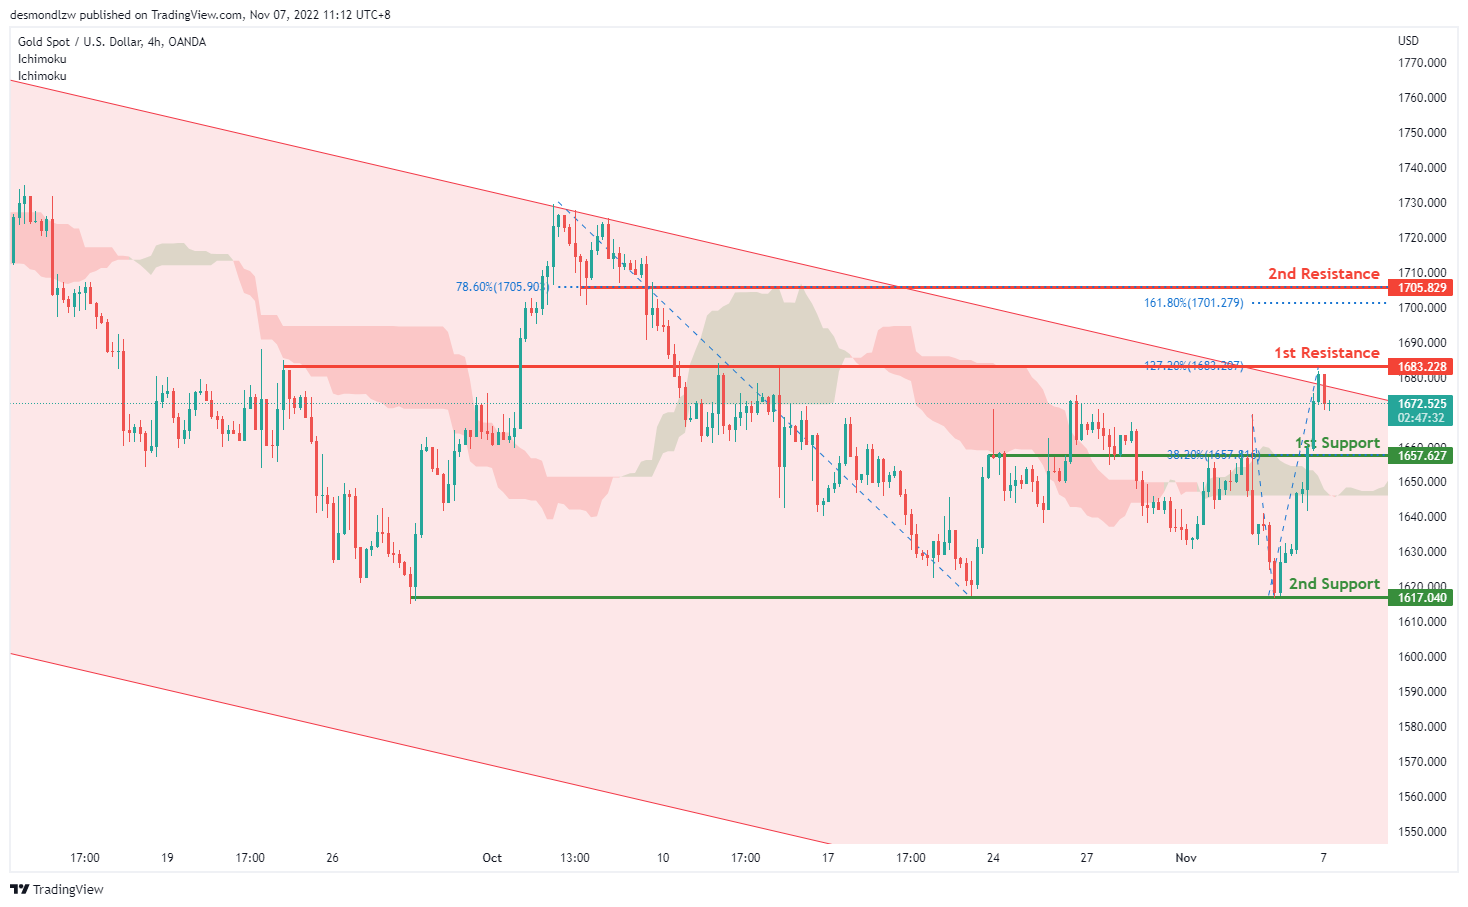
On H4, with the price breaking the descending channel and reversing from the 1st resistance, we can expect the price to drop to the 1st support at 1657.627, which is in line with the overlap support and 38.2% fibonacci retracement. If the 1st support is broken, we can expect the price drop to the 2nd support at 1617.040, where the previous swing lows are. Alternatively, the price may rise to retest the 1st resistance at 1683.228, which is in line with the previous swing high and 127.2% fibonacci extension. If the 1st resistance is broken, we can expect the bullish momentum to carry the price to the 2nd resistance at 1705.829, where the 78.6% fibonacci retracement and 161.8% fibonacci extension sit.
Areas of consideration:
- H4 time frame, 1st resistance at 1683.228
- H4 time frame, 1st support at 1657.627
AUD/USD:
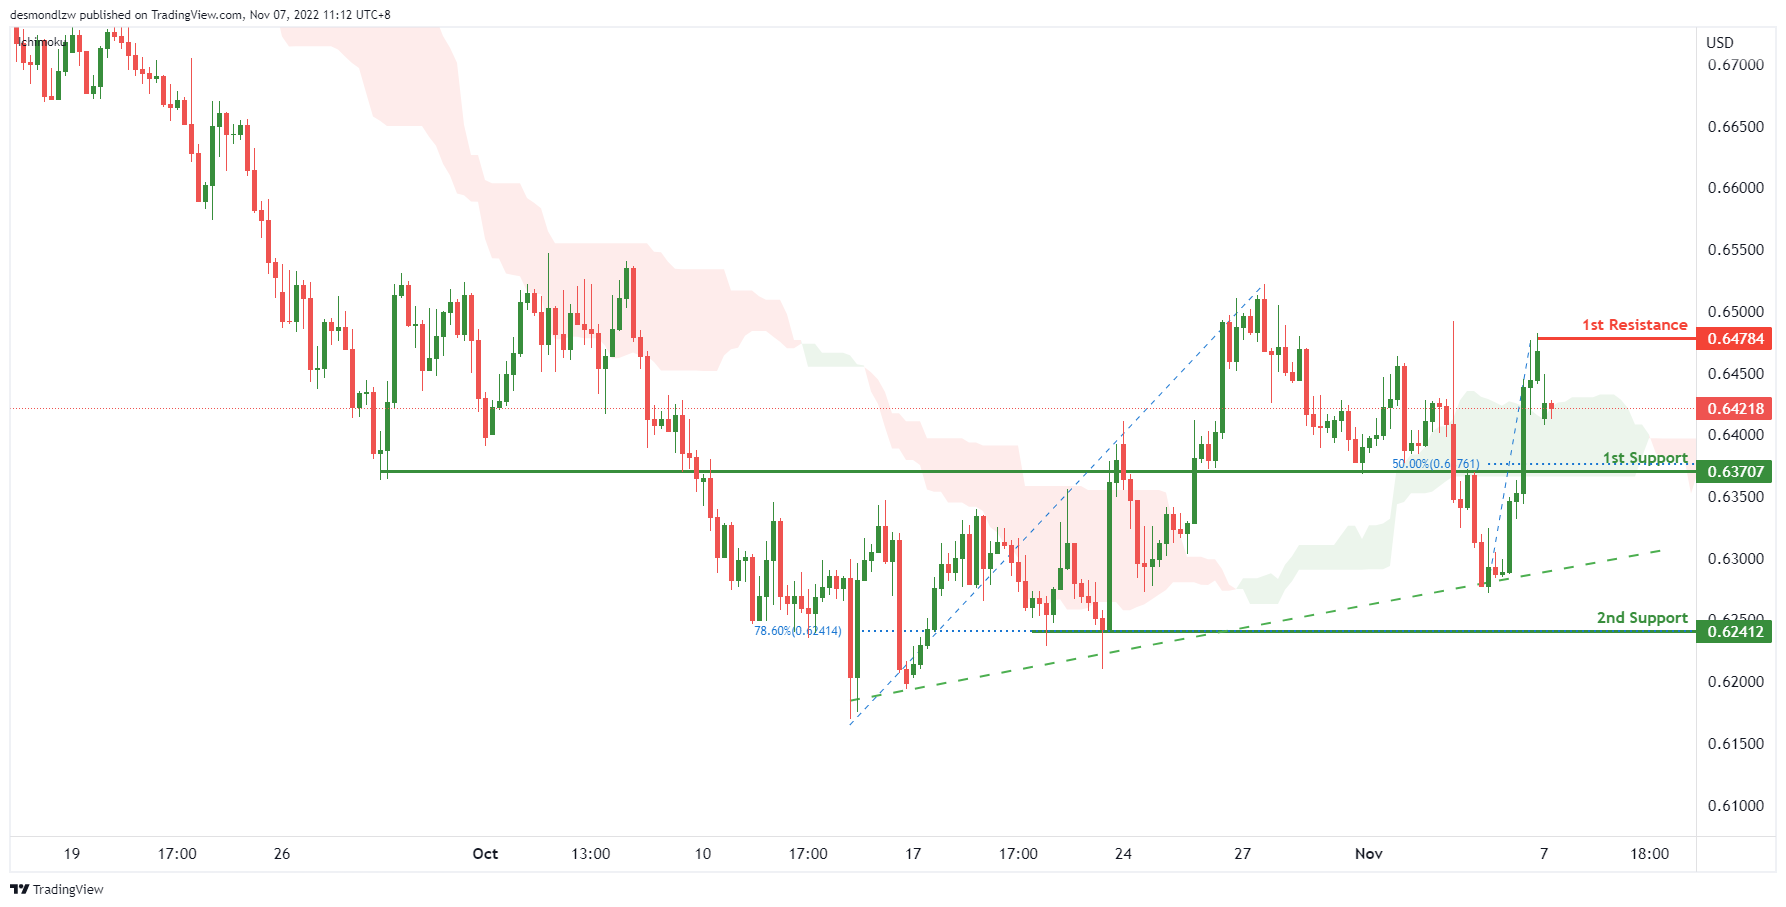
On the H4, with the price crossing the ichimoku cloud and moving above the ascending trendline, we can expect the price to rise to the 1st resistance at 0.64784, which is in line with the swing high. After testing the swing high, the price may reverse and drop to the 1st support at 0.63707, which is in line with the 50% fibonacci retracement and overlap support. If the 1st support is broken, the 2nd support is at 0.62412, where the 778.6% fibonacci retracement is.
Areas of consideration
- H4, 1st resistance at 0.64784
- H4, 1st support at 0.63707
NZD/USD:
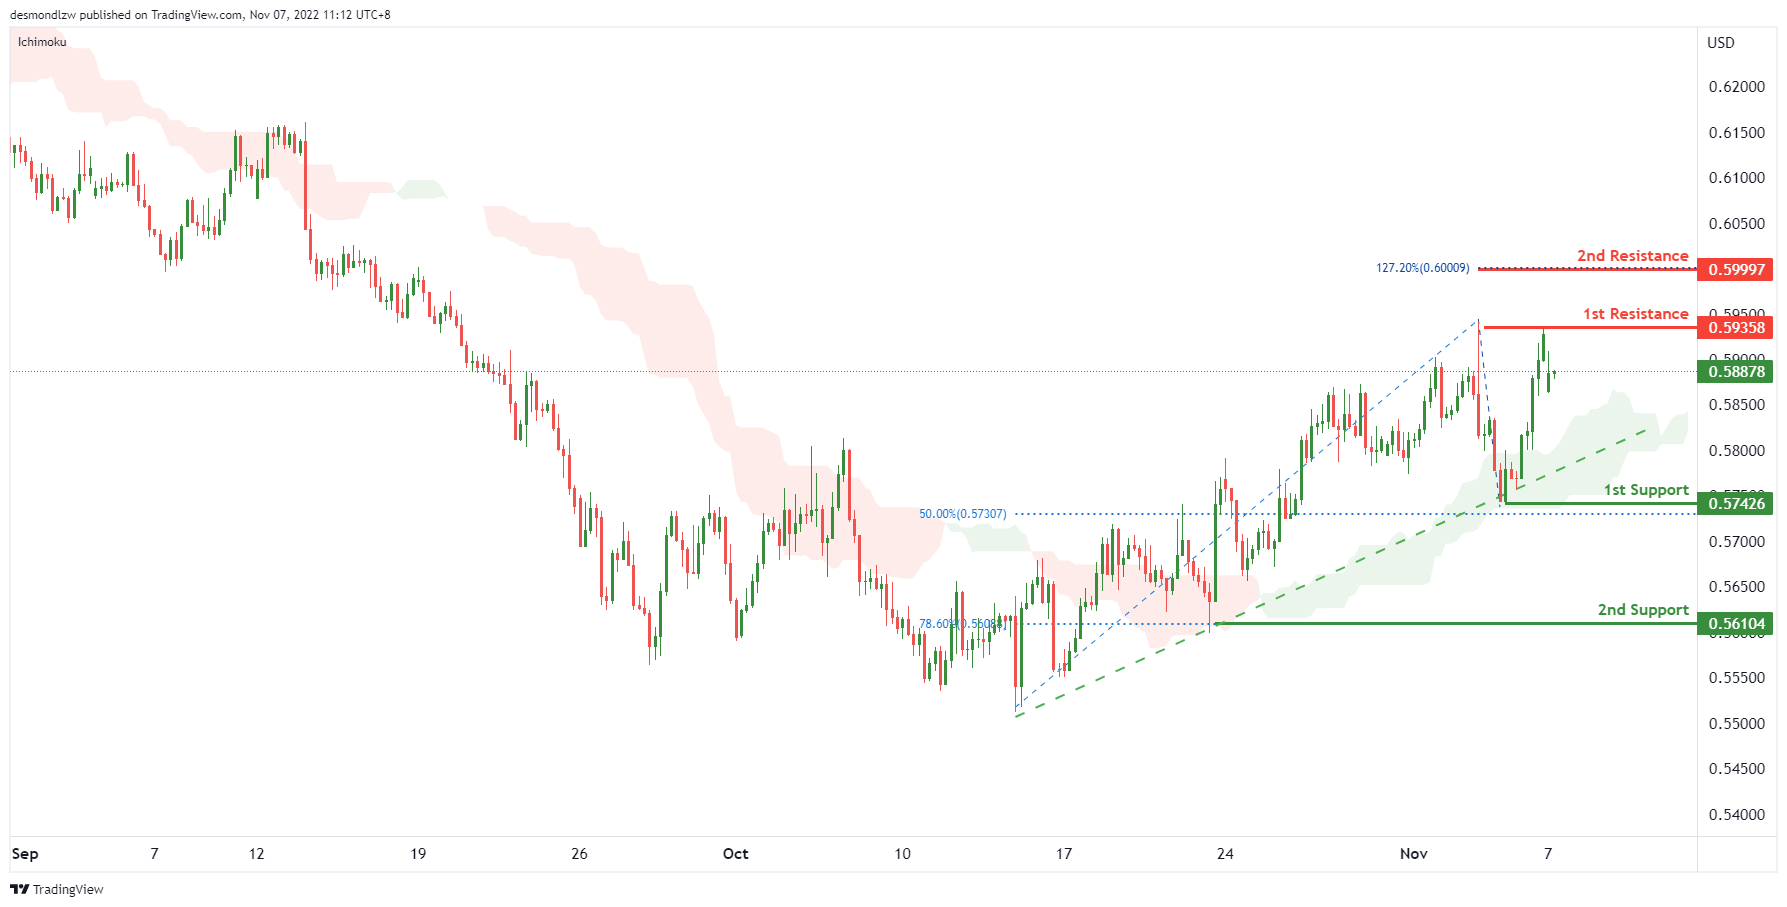
On the H4 chart, as the price is moving above ichimoku cloud and ascending trendline, the price may rise to the 1st resistance at 0.59358, which is in line with the swing highs. If the 1st resistance is broken, the 2nd resistance is at 0.59997, which is in line with the 127.2% fibonacci extension. Alternatively, the price may drop to the 1st support at 0.57426, which is in line with the swing low and 50% fibonacci retracement. If the 1st support is broken, the 2nd support is at 0.56014, which is in line with the 78.6% fibonacci retracement.
Areas of consideration:
- H4 time frame, 1st resistance at 0.59358
- H4 time frame, 2nd resistance at 0.59997
USD/CAD:
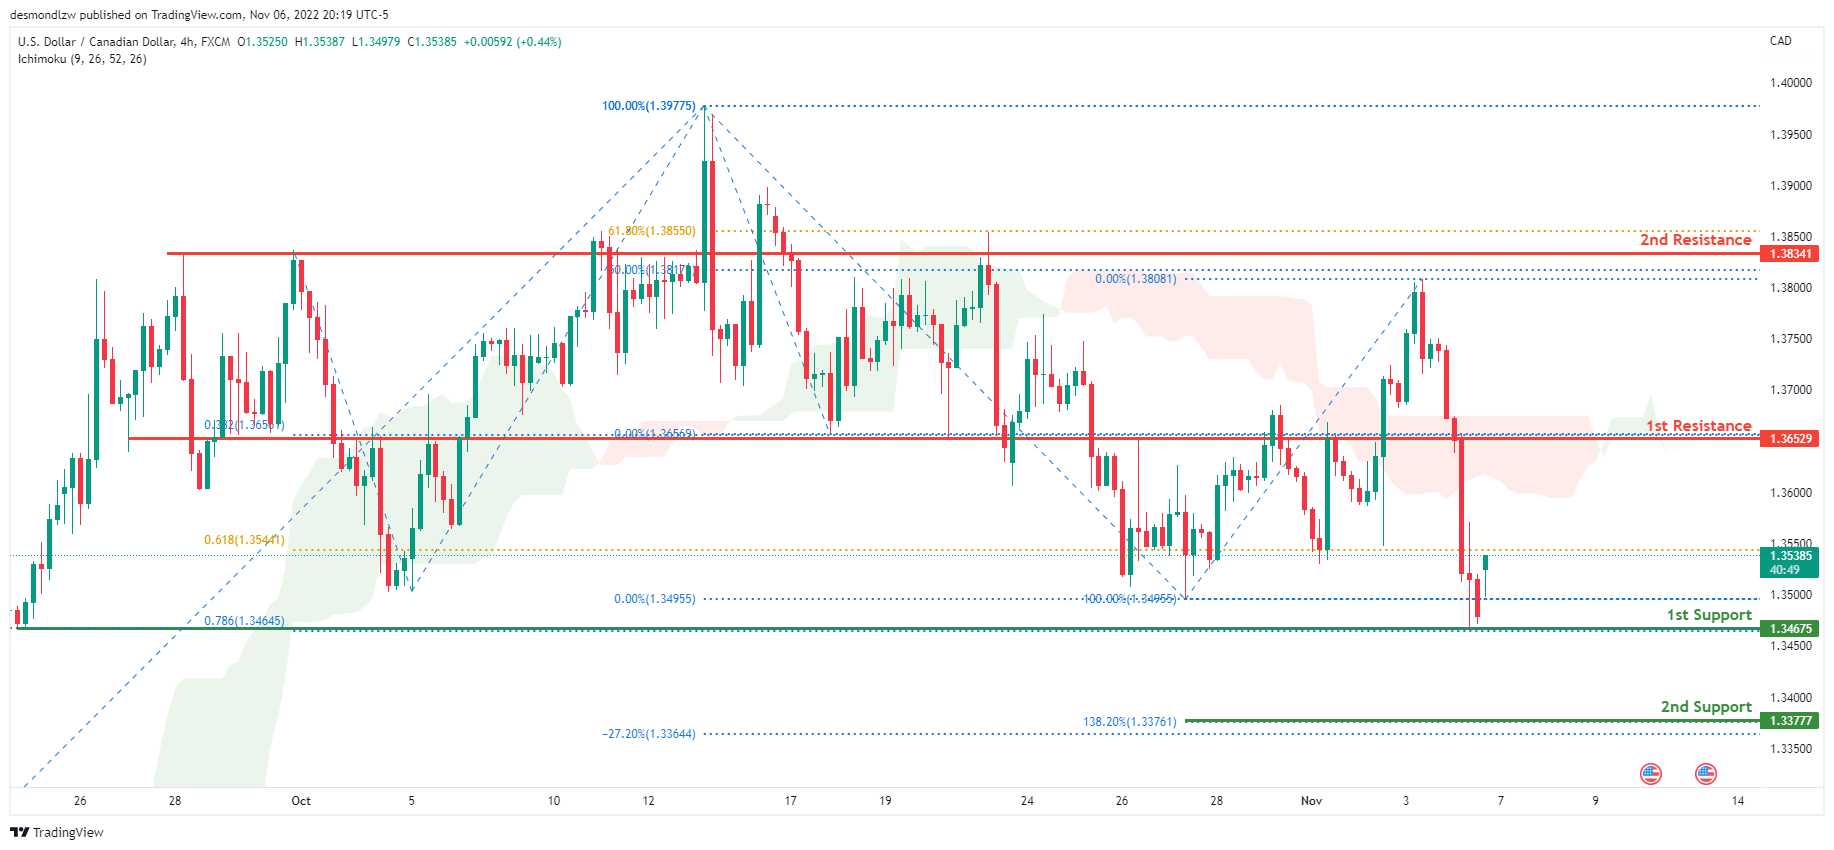
On the H4 chart, the overall bias for USDCAD is bearish. To add confluence to this, the price is below the Ichimoku cloud which indicates a bearish market. Towards the end of last week, the price had huge bearish momentum downwards due to the release of the NFP data. The price is currently trading at 1.35390 at the time of writing. If this bearish momentum continues, expect the price to head back down towards the 1st support line at 1.34675 where the 78.6% Fibonacci projection line and previous low is located. In an alternative scenario, price could head back up towards the 1st resistance line at 1.36529, where the 38.2% Fibonacci projection line is located.
Areas of consideration:
- H4 time frame, 1st resistance at 1.36529
- H4 time frame, 1st support at 1.34675
OIL:
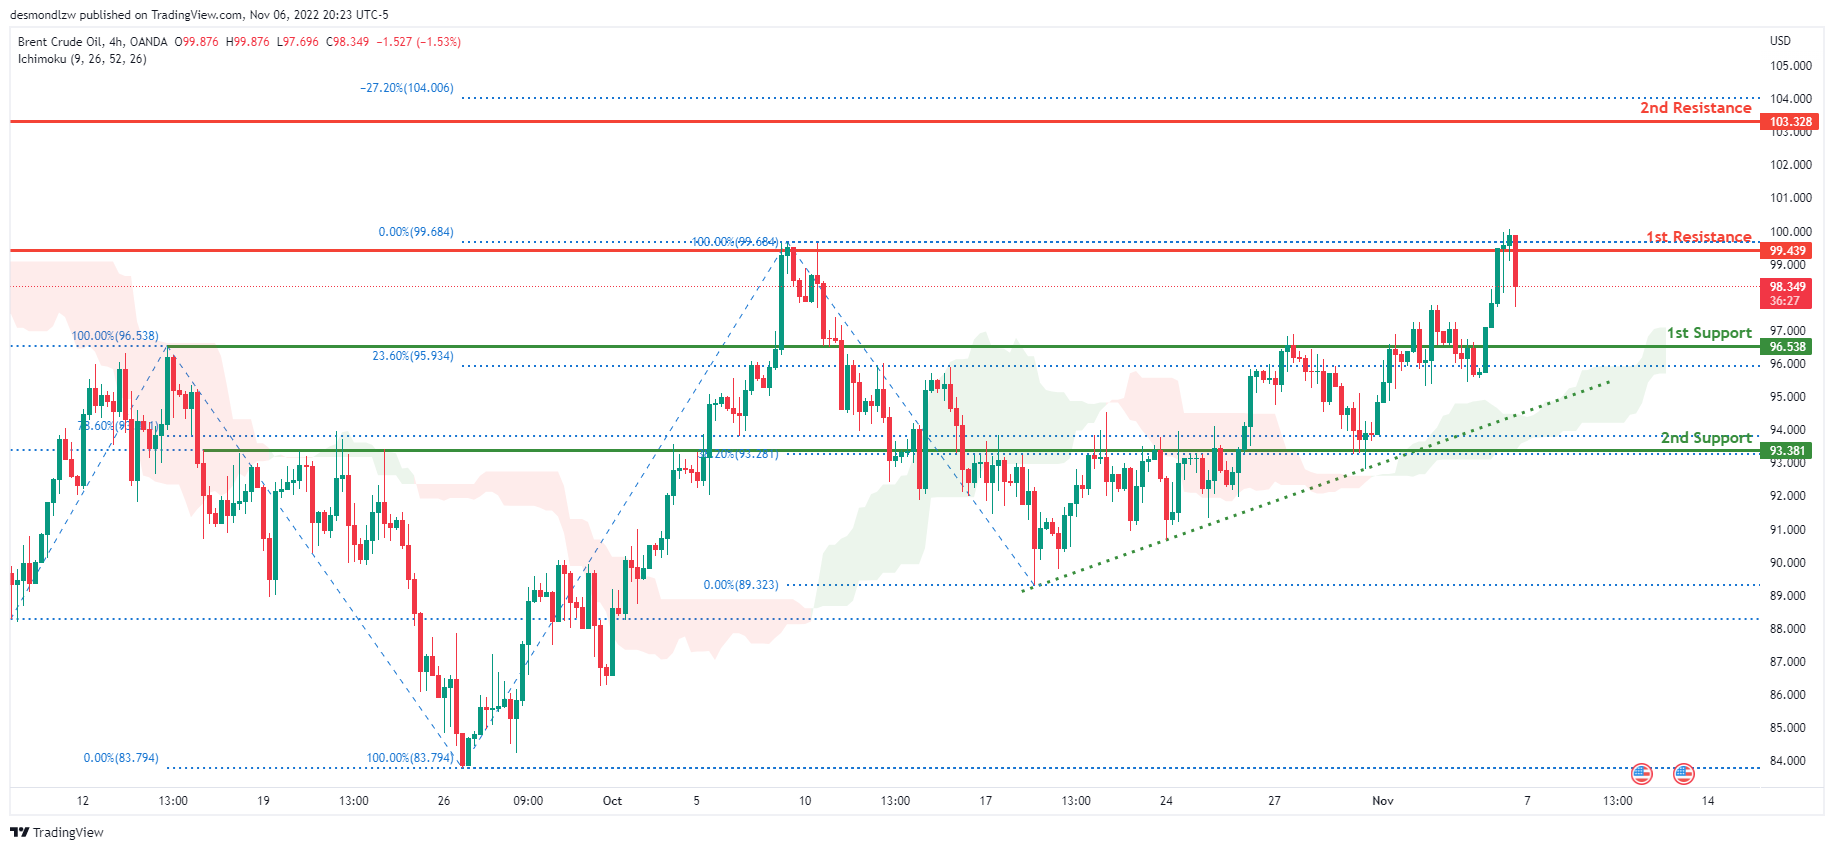
Looking at the H4 chart, the current overall bias for Oil is bullish. To add confluence to this, the price is above the Ichimoku cloud which indicates a bullish market. Towards the end of last week, price had bullish momentum due to the release of the NFP data. The price is currently trading at 98.455 at the time of writing. If this bullish momentum continues, expect price to possibly head back up towards the 1st resistance at 99.439 where previous swing high and 0% Fibonacci line is located. In an alternative scenario, price could head back down to the 1st support level at 96.538 where the 23.6% and 100% Fibonacci lines are located.
Areas of consideration:
- H4 time frame, 1st resistance at 99.439
- H4 time frame, 1st support at 96.538
Dow Jones Industrial Average:
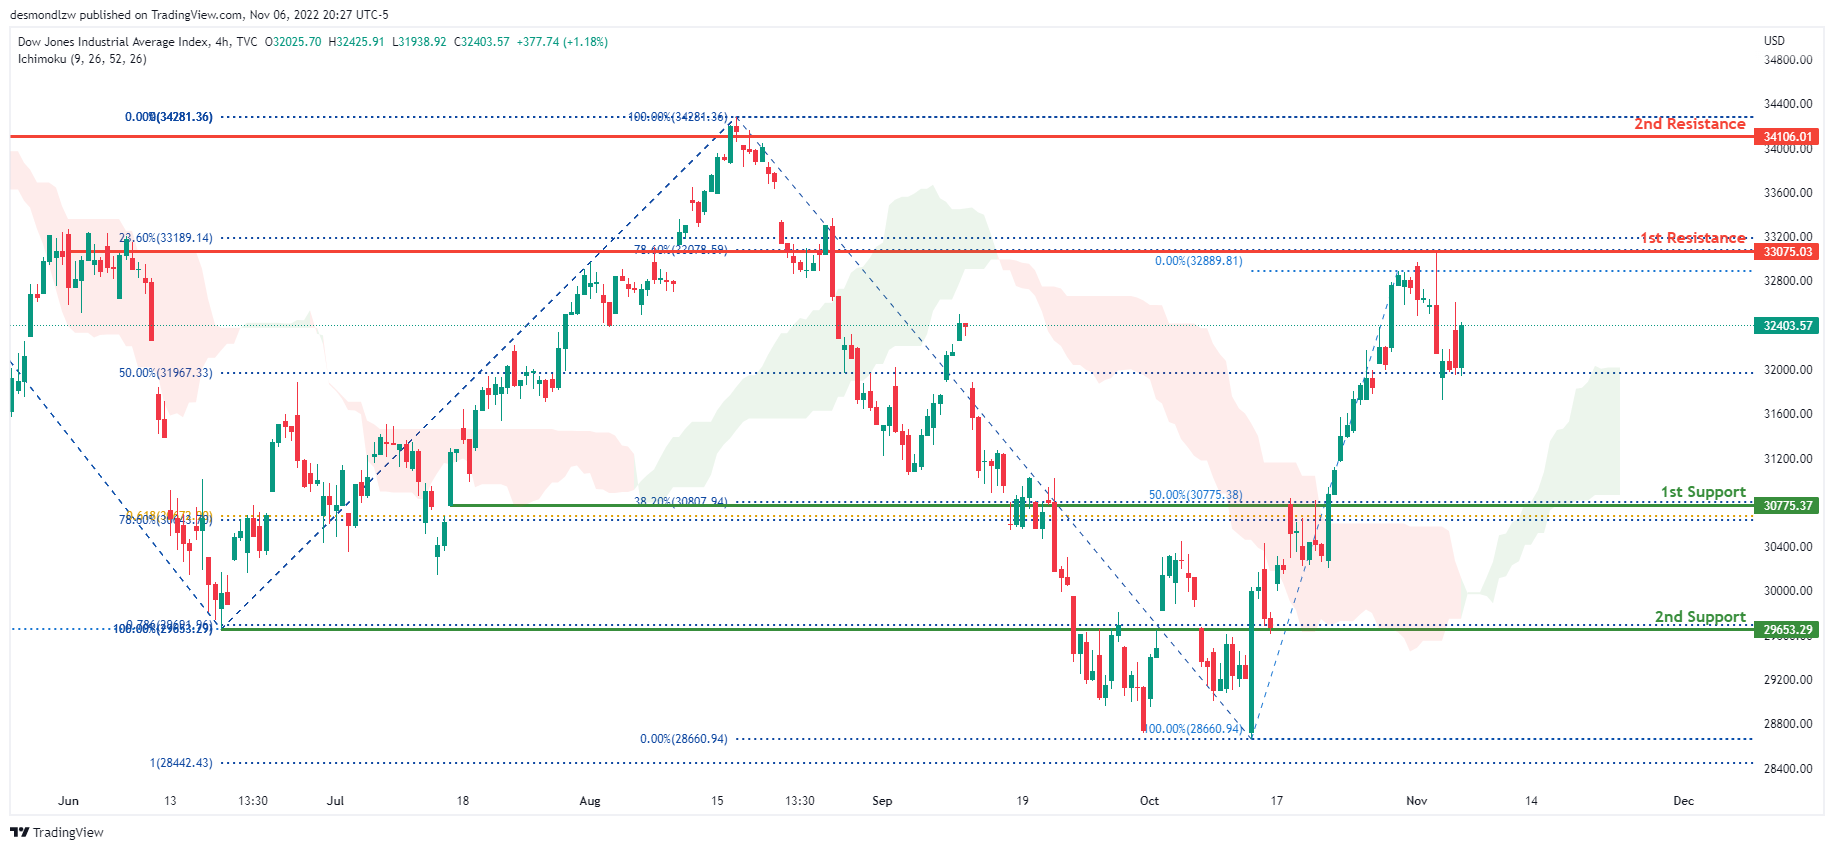
On the H4 chart, the overall bias for DJI is bullish. To add confluence to this, the price is above the Ichimoku cloud which indicates a bullish market. Towards the end of last week, it continued its bearish momentum downwards due to the release of the NFP data. The price is currently trading at 32403.57 at time of writing. If this bullish momentum continues, expect the price to possibly head towards the 1st resistance at 33272.34 where the 23.6% and 78.6% Fibonacci lines are located. In an alternative scenario, price could head towards the 1st support line at 30775.37, where the 38.2% and 50% Fibonacci lines are located.
Areas of consideration:
- H4 time frame, 1st support at 30775.37
- H4 time frame, 1st Resistance at 33272.34
DAX:
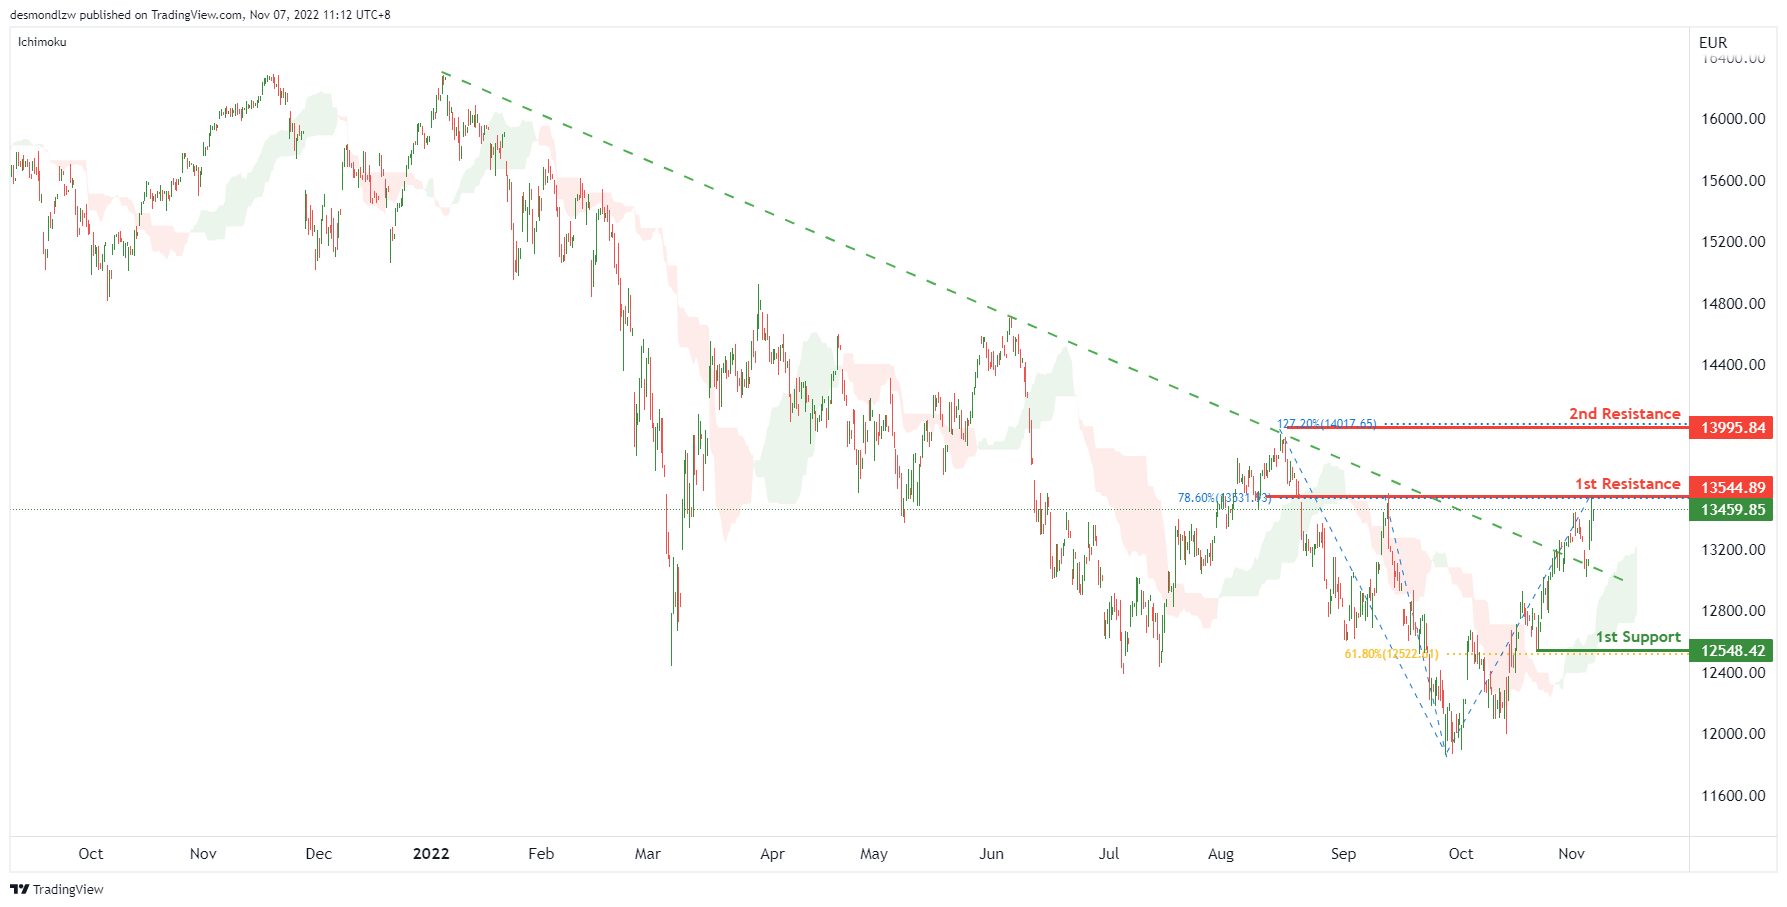
On the H4 chart, the price breaking descending trendline. Expecting price to possibly continue this bullish momentum and break the 1st resistance at 13544.89, which is in line with the previous swing high and 78.6% fibonacci retracement. If the 1st resistance is broken, the 2nd resistance is at 13995.84, where 127.2% fibonacci extension sits. Alternatively, the price may drop to the 1st support at 12548.42, which is in line with the 61.8% fibonacci retracement.
Areas of consideration:
- H4 time frame, 1st resistance at 13544.89
- H4 time frame, 2nd resistance is at 13995.84
ETHUSD:
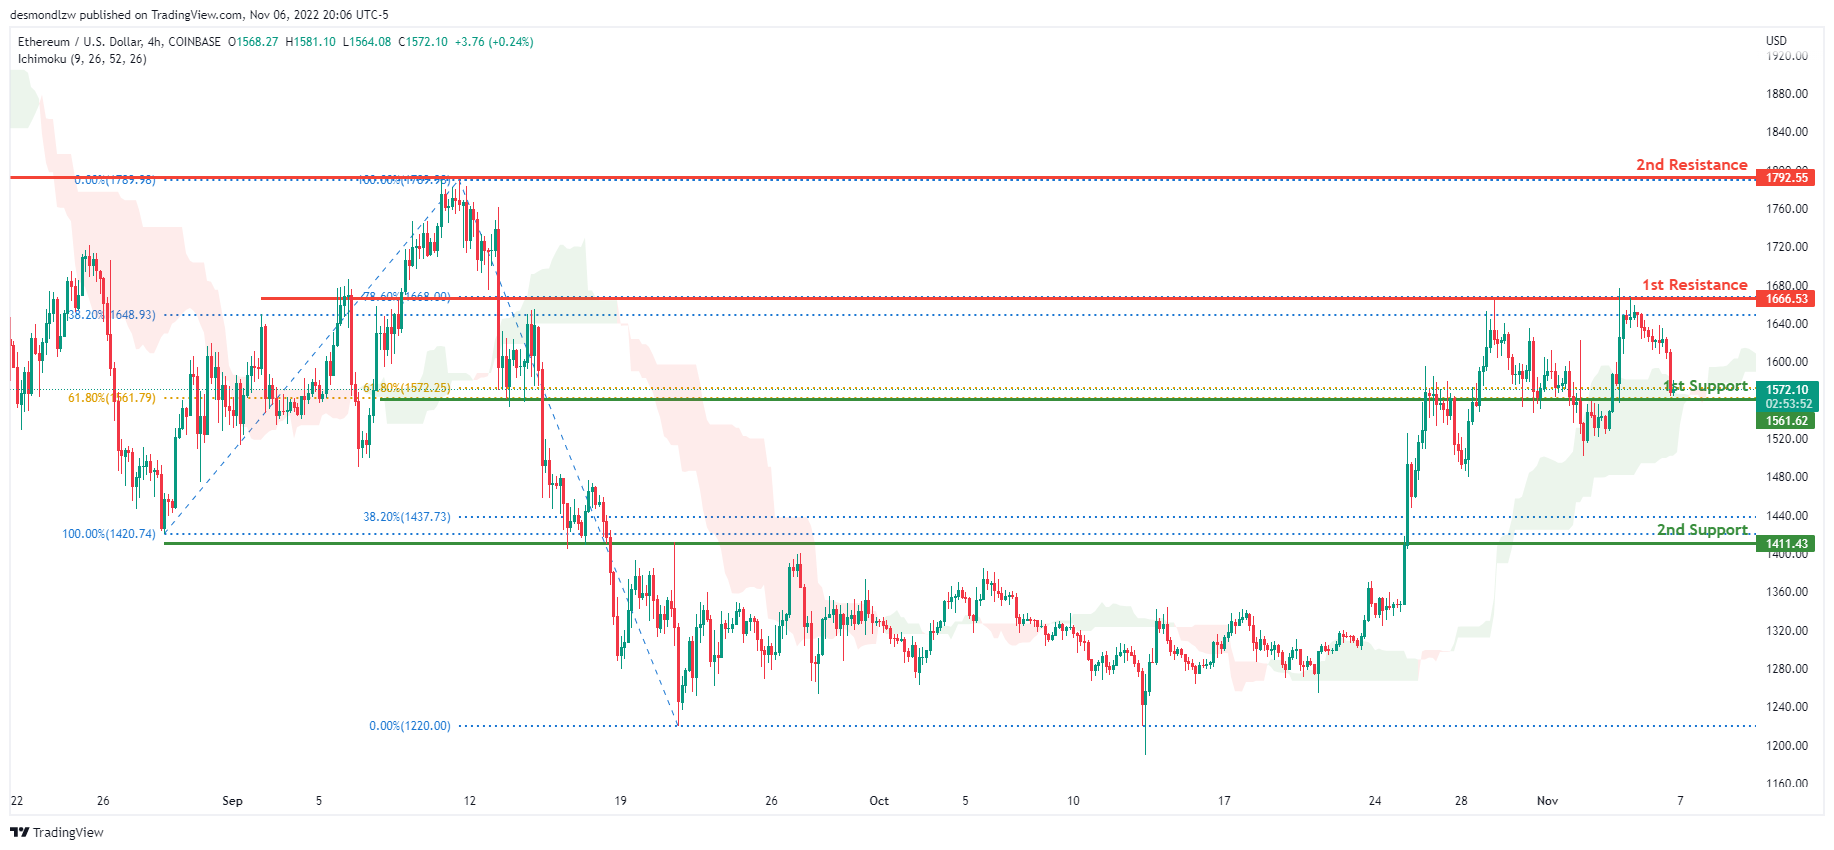
Looking at the H4 chart, the current overall bias for ETHUSD is bullish, with price currently within the green Ichimoku cloud. Towards the end of last week, price had a bearish retracement downwards with price currently resting on the 1st support line at 1561.62, where 2 of the 61.8% Fibonacci lines are located. The price is currently trading at 1561.62 at the time of writing. If this bullish momentum continues, expect the price to head towards the 1st resistance line at 1666.53, where the 78.6% and 38.2% Fibonacci lines are located. In an alternative scenario, price could break the 1st support line and head towards the 2nd support line at 1411.43, where the 38.2% and 100% Fibonacci lines are located.
Areas of consideration:
- H4 time frame, 1st resistance of 1666.53
- H4 time frame, 1st support at 1561.62
- H4 time frame, 2nd support at 1411.43
BTCUSD:
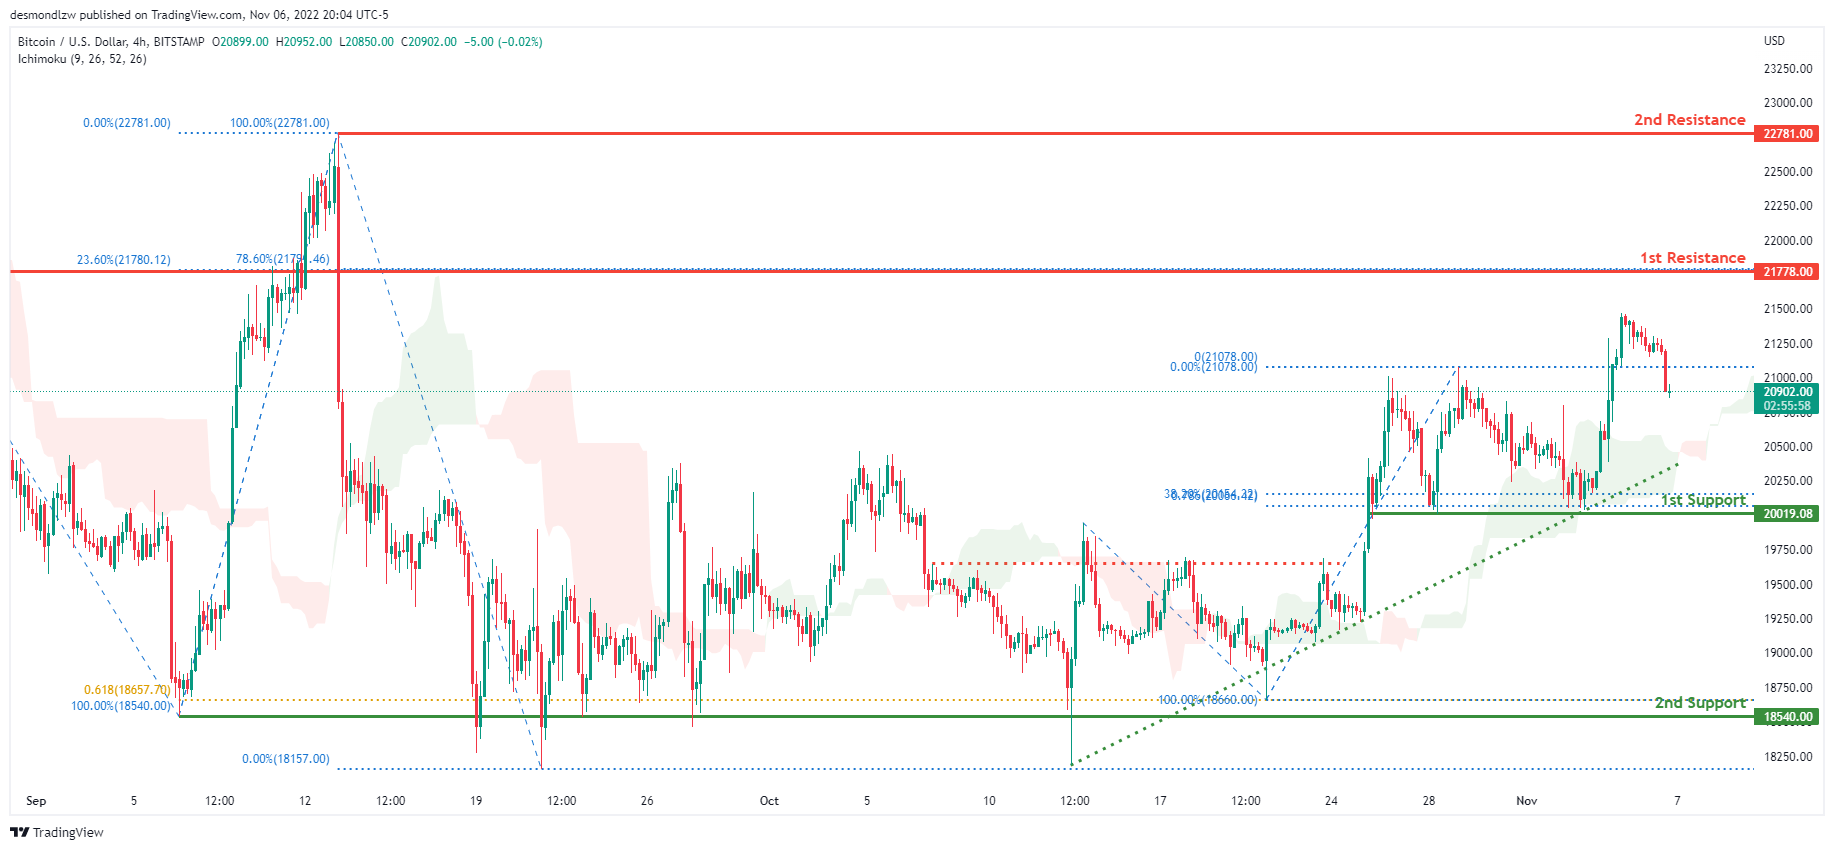
On the H4 chart, the overall bias for BTCUSD is bullish. To add confluence to this, the price is above the Ichimoku cloud which indicates a bullish market. Towards the end of last week, price had bullish momentum before having a downwards bearish retracement. Price is currently trading at 20897.00 at time of writing. If this bullish momentum continues, expect the price to head towards the 1st resistance line at 21788.00 where the 78.6% and 23.6% Fibonacci lines are located. In an alternative scenario, price could continue its bearish retracement and head towards the 1st support line at 20019.08, where the 38.2% Fibonacci line and 78.6% Fibonacci projection line is located.
Areas of consideration:
- H4 time frame, 1st resistance 21778.00
- H4 time frame, 1st support at 20019.08
S&P 500:
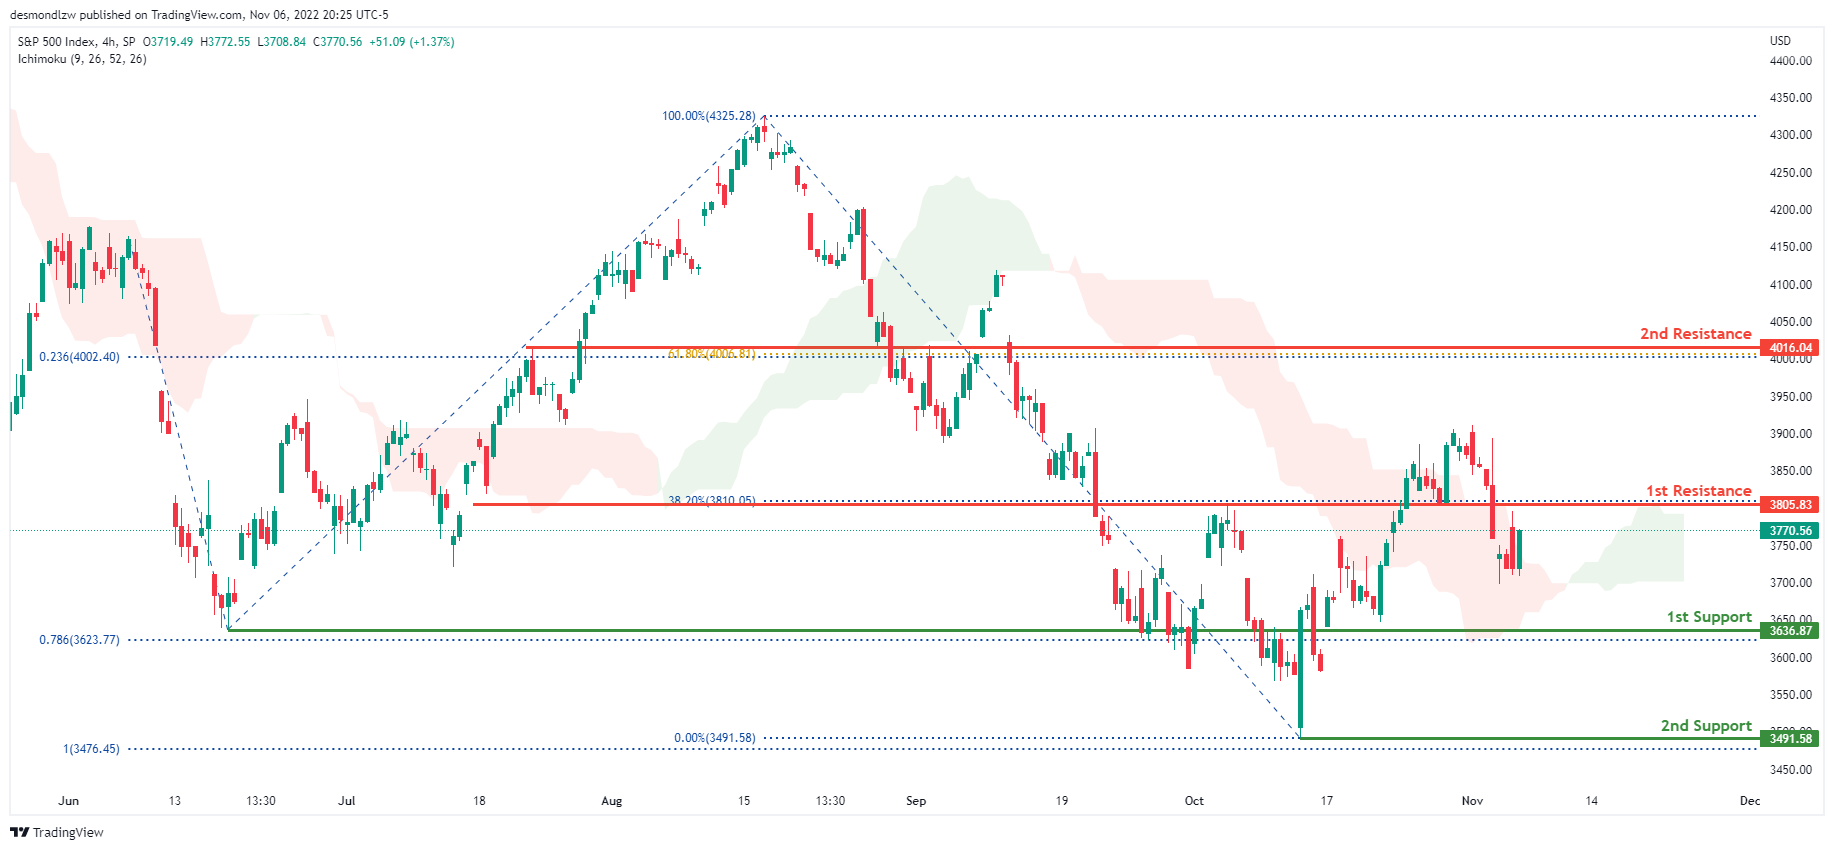
On the H4 chart, the overall bias for S&P500 is bearish with price currently crossing under the Ichimoku cloud. Towards the end of last week, price continued its bearish momentum with price closing under the 1st resistance at 3805.83 where the 38.2% Fibonacci line is located. The price is currently trading at 3770.56 at time of writing. If this bearish momentum continues, expect price to possibly head towards the 1st support at 3636.87 where the previous swing low and 78.6% Fibonacci projection line is located. In an alternative scenario, price could break back up to test the 1st resistance line.
Areas of consideration:
- H4 time frame, 1st support at 3636.87
- H4 time frame, 1st resistance at 3805.83
USD/CAD Daily Outlook
Daily Pivots: (S1) 1.3383; (P) 1.3567; (R1) 1.3808; More....
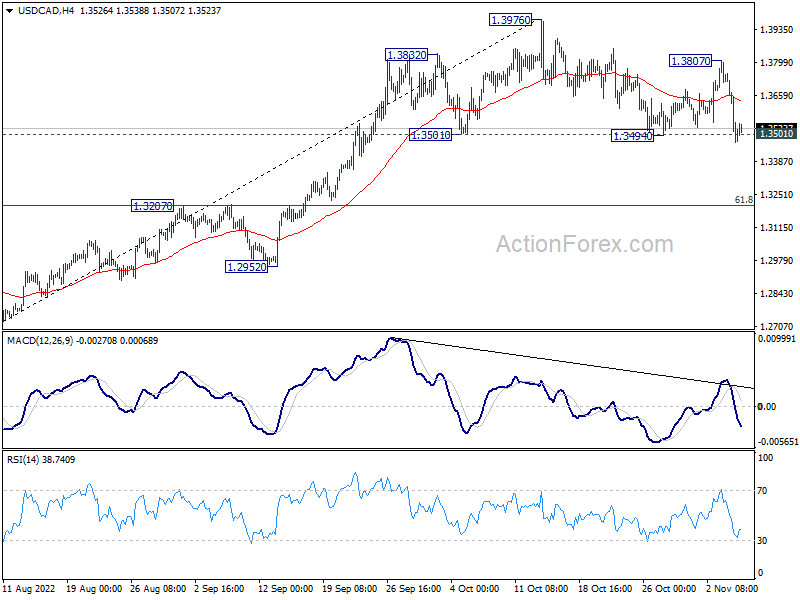
Intraday bias in USD/CAD stays on the downside at this point. A head and should top pattern (1.3832; h: 1.3976; rs: 1.3807) should be formed already. Sustained trading below 1.3494 will confirm, and bring deeper fall to .3207 cluster support (61.8% retracement of 1.2726 to 1.3976 at 1.3204. Strong support should be seen there to bring rebound. But for now, risk will stay on the downside as long as 1.3807 resistance holds, in case of recovery.
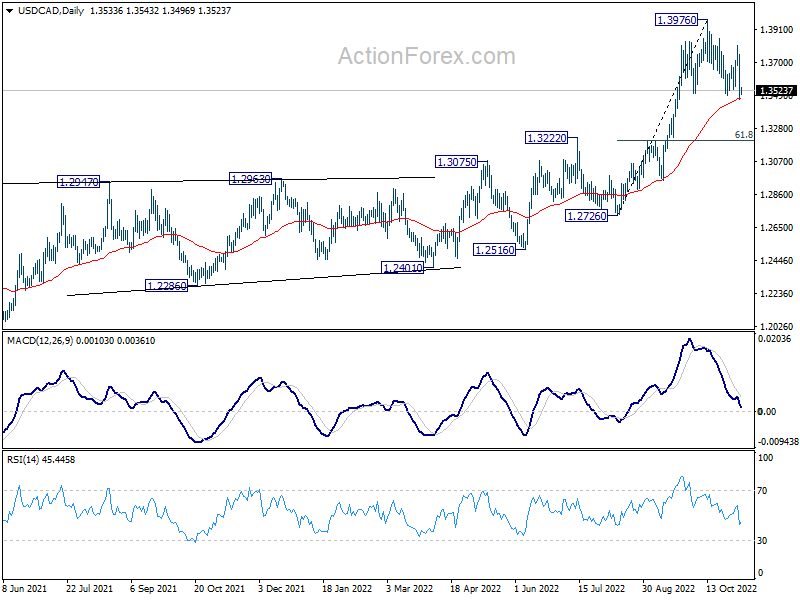
In the bigger picture, up trend from 1.2005 (2021 low) is still in progress. Based on current impulsive momentum, it could be resuming long term up trend from 0.9056 (2007 low). Whether it is or it isn't, retest of 1.4689 (2016 high) should be seen next. This will now remain the favored case as long as 1.3222 resistance turned support holds.
Asia Extends Rebound, But Aussie Not Following… Yet
The forex markets are rather steady in Asia today. While stocks in China and Hong Kong extending last week's strong rebound, Aussie and Kiwi are not following for now. Some traders are on guard to rumors of reopening in China, in particular with a district in Guangzhou still extending tough lockdown. The economic calendar is relative light this week. Main focus will be on consumer inflation data in the US.\
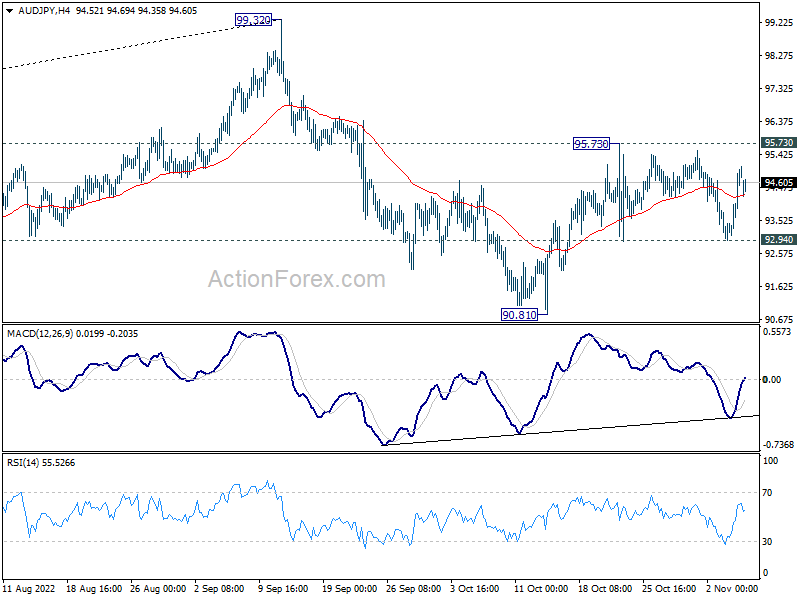
Technically, it's possible that AUD/JPY's consolidation from 95.73 has completed with three waves to 92.94. That is, rebound from 90.81 might be ready to resume. Break of 95.73 resistance will confirm this case and target 99.32 high. For now, a break of 99.32 is not envisaged given the threat of intervention in USD/JPY. But that could depend on the momentum in AUD/USD upon breaking through 0.6521 resistance to complete a head and should bottom pattern.
In Asia, at the time of writing, Nikkei is up 1.30%. Hong Kong HSI is up 3.42%. China Shanghai SSE is up 0.46%. Singapore Strait Times is up 0.21%. Japan 10-year JGB yield is down -0.0074 at 0.250.
China exports dropped -0.3% yoy in Oct, imports down -0.7% yoy
In USD term, China's exports dropped -0.3% yoy to USD 298.37B in October, well below expectation of 4.3% yoy. That's the worst performance since May 2020.
Imports dropped -0.7% yoy to USD 213.22B, below expectation of 0.1% yoy. That's the the worst since August 2020.
The simultaneous contraction in both exports and imports was the first since May 2020.
Trade surplus widened slightly from USD 84.74B to USD 85.15B, short of expectation of USD 95.95.
US CPI to highlight a "relatively" light week
US CPI highlights a "relatively" light week. Fed Chair Jerome Powell indicated clearly that tightening pace could slow as soon as in December, but the terminal rate could be higher than earlier expected. Chicago Fed President Charles Evans later said the projection of peak rate might be revised "slightly higher" in the upcoming forecasts. But after all, the path will remain heavily data dependent, especially on whether inflation shows more signs of cooling.
Other data to be watched closely include US U of Michigan consumer sentiment; Eurozone Sentix investor confidence, UK GDP. In term of central bank activities, BoJ will publish summary of opinions. ECB will publish monthly bulletin.
Here are some highlights for the week:
- Monday: China trade balance; Swiss unemployment rate, foreign currency reserves; Germany industrial production; Eurozone Sentix investor confidence.
- Tuesday: Australia AiG services, Westpac consumer sentiment, NAB business confidence; New Zealand inflation expectations; Japan average cash earnings, household spending, leading indicators, BoJ summary of opinions; France trade balance; Eurozone retail sales.
- Wednesday: Japan current account, bank lending; China CPI, PPI; US wholesale inventories.
- Thursday: Australia MI inflation expectations, UK RICS house price balance; ECB economic bulletin; US CPI, jobless claims.
- Friday: New Zealand BusinessNZ manufacturing index; Japan PPI; Germany CPI final; UK GDP, production, trade balance, NIESR GDP estimate; US U of Michigan consumer sentiment.
USD/CAD Daily Outlook
Daily Pivots: (S1) 1.3383; (P) 1.3567; (R1) 1.3808; More....
Intraday bias in USD/CAD stays on the downside at this point. A head and should top pattern (1.3832; h: 1.3976; rs: 1.3807) should be formed already. Sustained trading below 1.3494 will confirm, and bring deeper fall to .3207 cluster support (61.8% retracement of 1.2726 to 1.3976 at 1.3204. Strong support should be seen there to bring rebound. But for now, risk will stay on the downside as long as 1.3807 resistance holds, in case of recovery.
In the bigger picture, up trend from 1.2005 (2021 low) is still in progress. Based on current impulsive momentum, it could be resuming long term up trend from 0.9056 (2007 low). Whether it is or it isn't, retest of 1.4689 (2016 high) should be seen next. This will now remain the favored case as long as 1.3222 resistance turned support holds.
Economic Indicators Update
| GMT | Ccy | Events | Actual | Forecast | Previous | Revised |
|---|---|---|---|---|---|---|
| 02:00 | CNY | Trade Balance (USD) Oct | 85.2B | 96.0B | 84.7B | |
| 02:00 | CNY | Trade Balance (CNY) Oct | 85.2B | 702B | 574B | |
| 06:00 | JPY | Machine Tool Orders Y/Y Oct | 4.30% | |||
| 07:00 | EUR | Germany Industrial Production M/M Sep | -0.20% | -0.80% | ||
| 08:00 | CHF | Foreign Currency Reserves (CHF) Oct | 807B | |||
| 09:30 | EUR | Eurozone Sentix Investor Confidence Nov | -35 | -38.3 |
China exports dropped -0.3% yoy in Oct, imports down -0.7% yoy
In USD term, China's exports dropped -0.3% yoy to USD 298.37B in October, well below expectation of 4.3% yoy. That's the worst performance since May 2020.
Imports dropped -0.7% yoy to USD 213.22B, below expectation of 0.1% yoy. That's the the worst since August 2020.
The simultaneous contraction in both exports and imports was the first since May 2020.
Trade surplus widened slightly from USD 84.74B to USD 85.15B, short of expectation of USD 95.95.
EUR/USD Recovers As Dollar Starts Downside Correction
Key Highlights
- EUR/USD started a recovery wave above the 0.9900 resistance zone.
- It broke a major bearish trend line with resistance near 0.9855 on the 4-hours chart.
- Gold and oil price started a fresh increase above $1,650 and $90 respectively.
- GBP/USD eyes a fresh increase above the 1.1400 resistance zone.
EUR/USD Technical Analysis
The Euro declined heavily below the 0.9950 level against the US Dollar. EUR/USD even declined below 0.9850 before the bulls appeared near 0.9730.
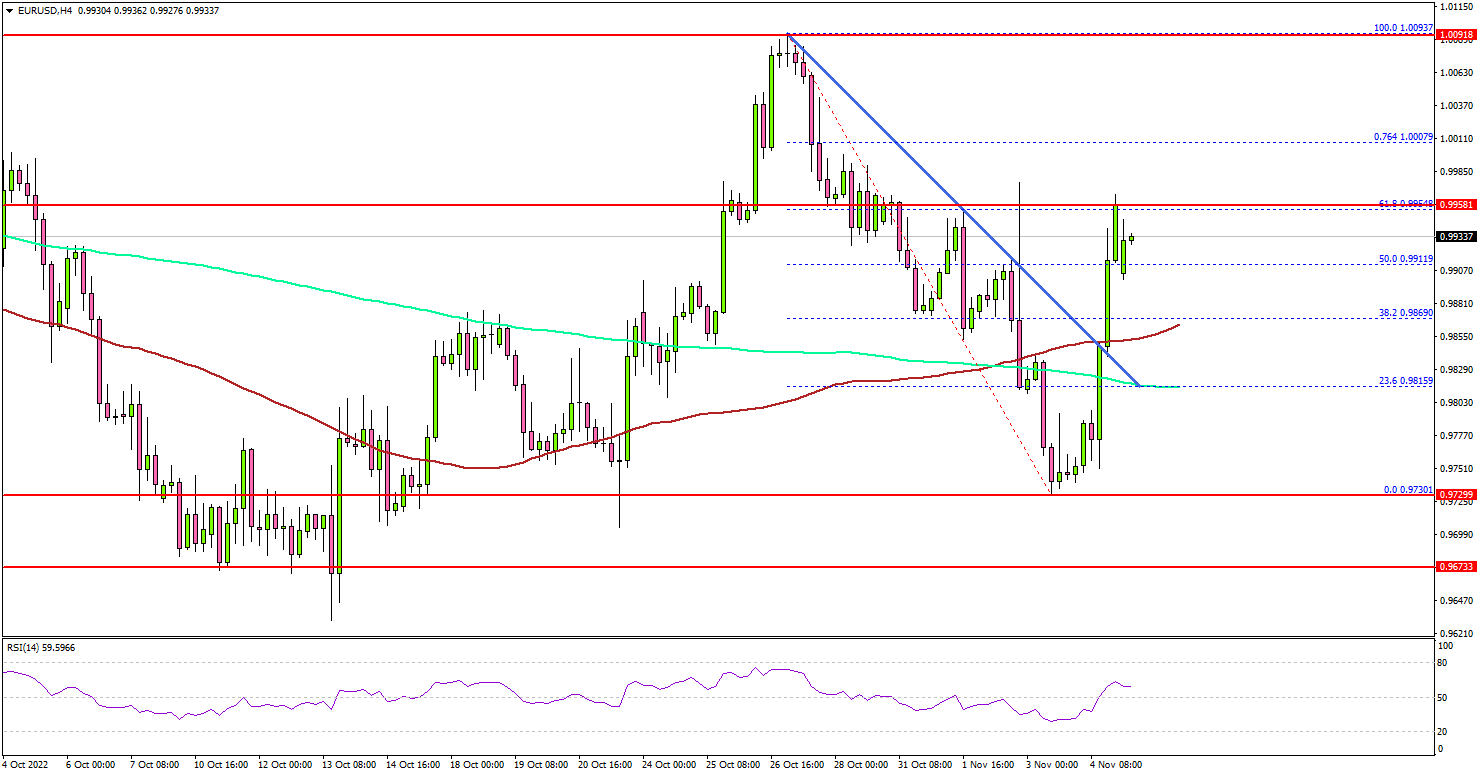
Looking at the 4-hours chart, the pair traded as low as 0.9730 before it started an upside correction. There was a steady upward move above the 0.9820 resistance zone, the 100 simple moving average (red, 4-hours) plus the 200 simple moving average (green, 4-hours).
There was a break above a major bearish trend line with resistance near 0.9855 on the same chart. The pair is now trading above the 50% Fib retracement level of the downward move from the 1.0093 swing high to 0.9730 low.
It is now facing resistance near the 0.9960 level. It is near the 61.8% Fib retracement level of the downward move from the 1.0093 swing high to 0.9730 low.
The next major resistance may perhaps be near 1.0000. Any more gains could set the pace for a move towards the 1.0080 level, above which it could even test 1.0120.
An initial support is near the 0.9900 level. The next major support is near the 0.9850 zone. The main support sits at 0.9820 zone or the 200 simple moving average (green, 4-hours).
A close below the 0.9820 level and the 200 simple moving average (green, 4-hours) could increase selling pressure. In the stated case, it could decline towards the 0.9720 support.
Looking at GBP/USD, the pair tested the 1.1150 support zone and is currently attempting a fresh increase above the 1.1400 zone.
Economic Releases
- Germany’s Industrial Production for Sep 2022 (MoM) - Forecast -0.8%, versus -0.8% previous.
Platinum (PL) Searching for Bottom
Platinum (PL) continues to trade sideways and the metal is in the process of forming an important low before the next major bullish cycle starts. The Federal Reserve has aggressively hiked rates multiple times, creating a sideways to lower movement in the commodity sectors. There’s however no doubt that the longer term outlook of commodities is bullish. At this stage, there’s enough number of swing to call the daily and monthly correction completed. However, we still need more data and evidence to call the correction completed. In the meantime, we still give a possibility for the metal to extend lower until the market says otherwise. Below is the update of the Elliott Wave chart in Platinum.
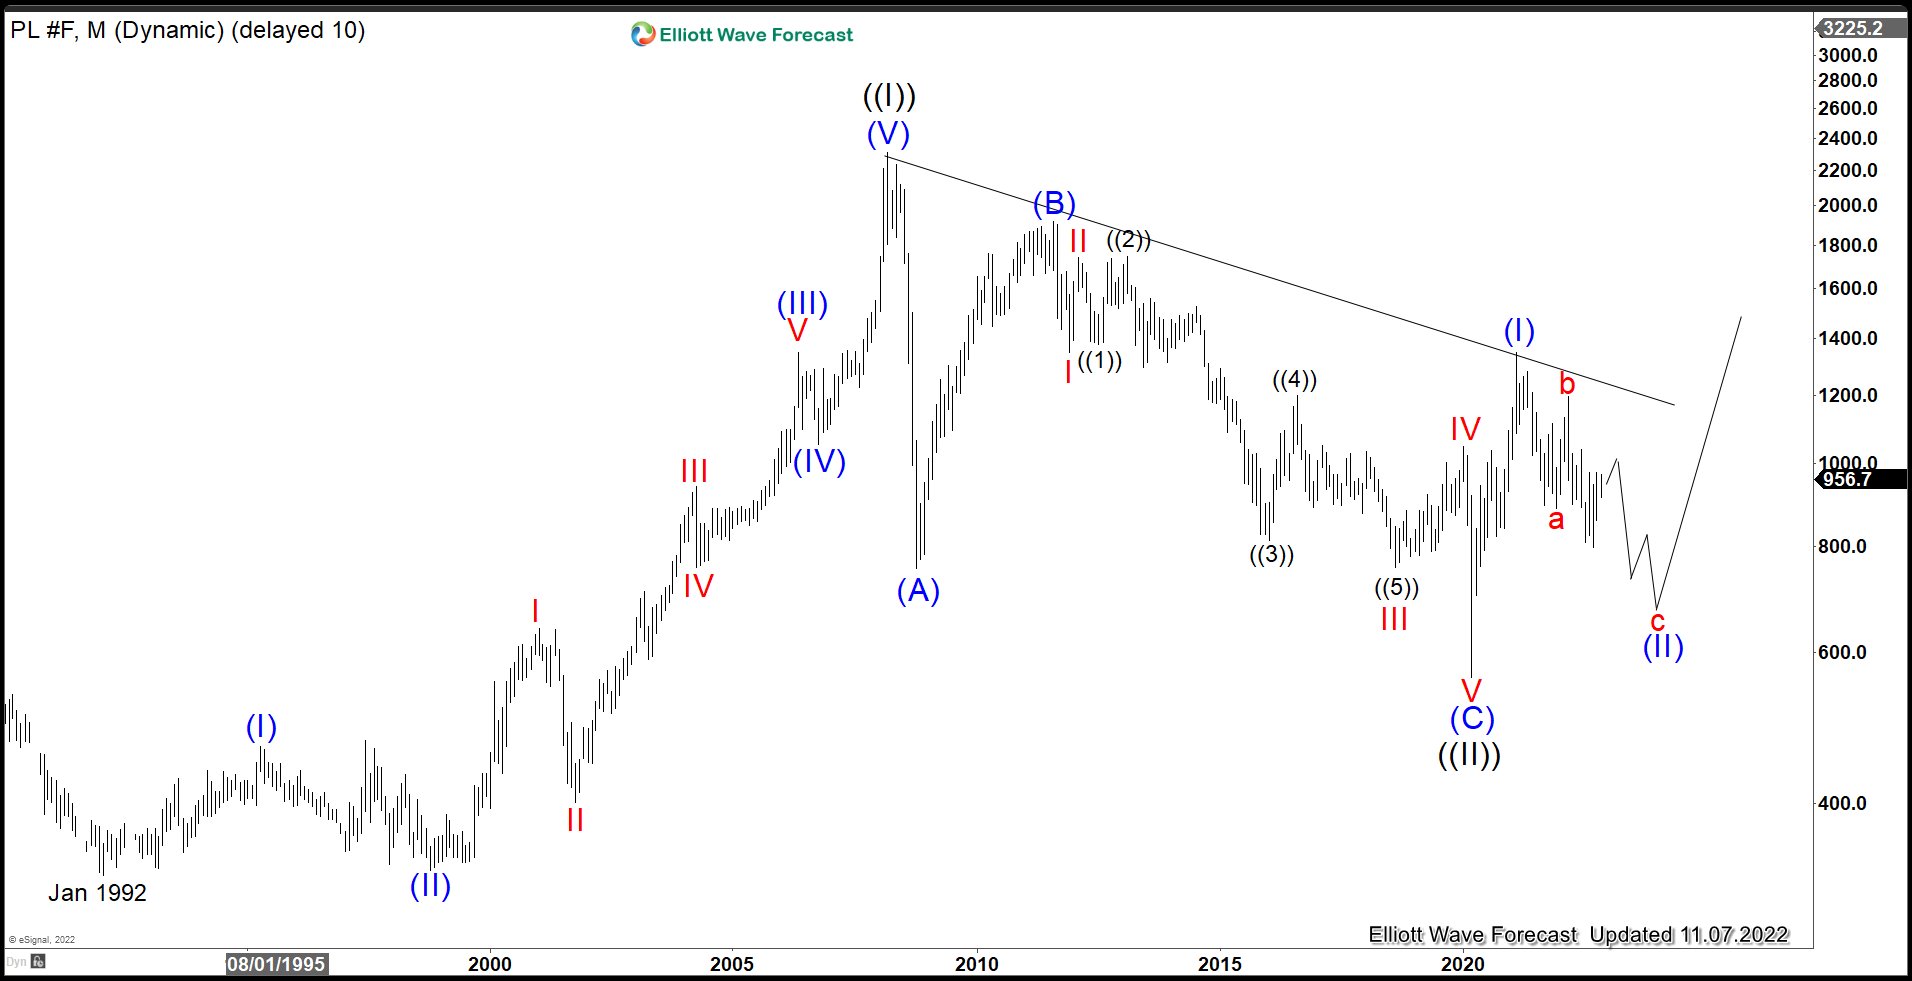
Platinum Monthly Elliott Wave Chart
Monthly Elliott Wave Chart of Platinum (PL) above shows that the rally from January 1992 low ended with wave ((I)) at 2308.8 as an impulse Elliott Wave structure. Pullback in wave ((II)) ended at 562 as a zigzag structure. The metal has resumed higher in wave ((III)). Up from wave ((II)), wave (I) ended at 1348.2, and wave (II) pullback is in progress to correct the rally from wave ((II)) before the metal resumes higher again. It has enough number of swing to end wave (II), but we need more data and confirmation to call the correction completed. A close above the descending trend line from wave ((I)) should the first sign that wave (II) has ended and the metal ready to extend higher. From the structure, it looks like 2023 would be a bullish market for the metal.
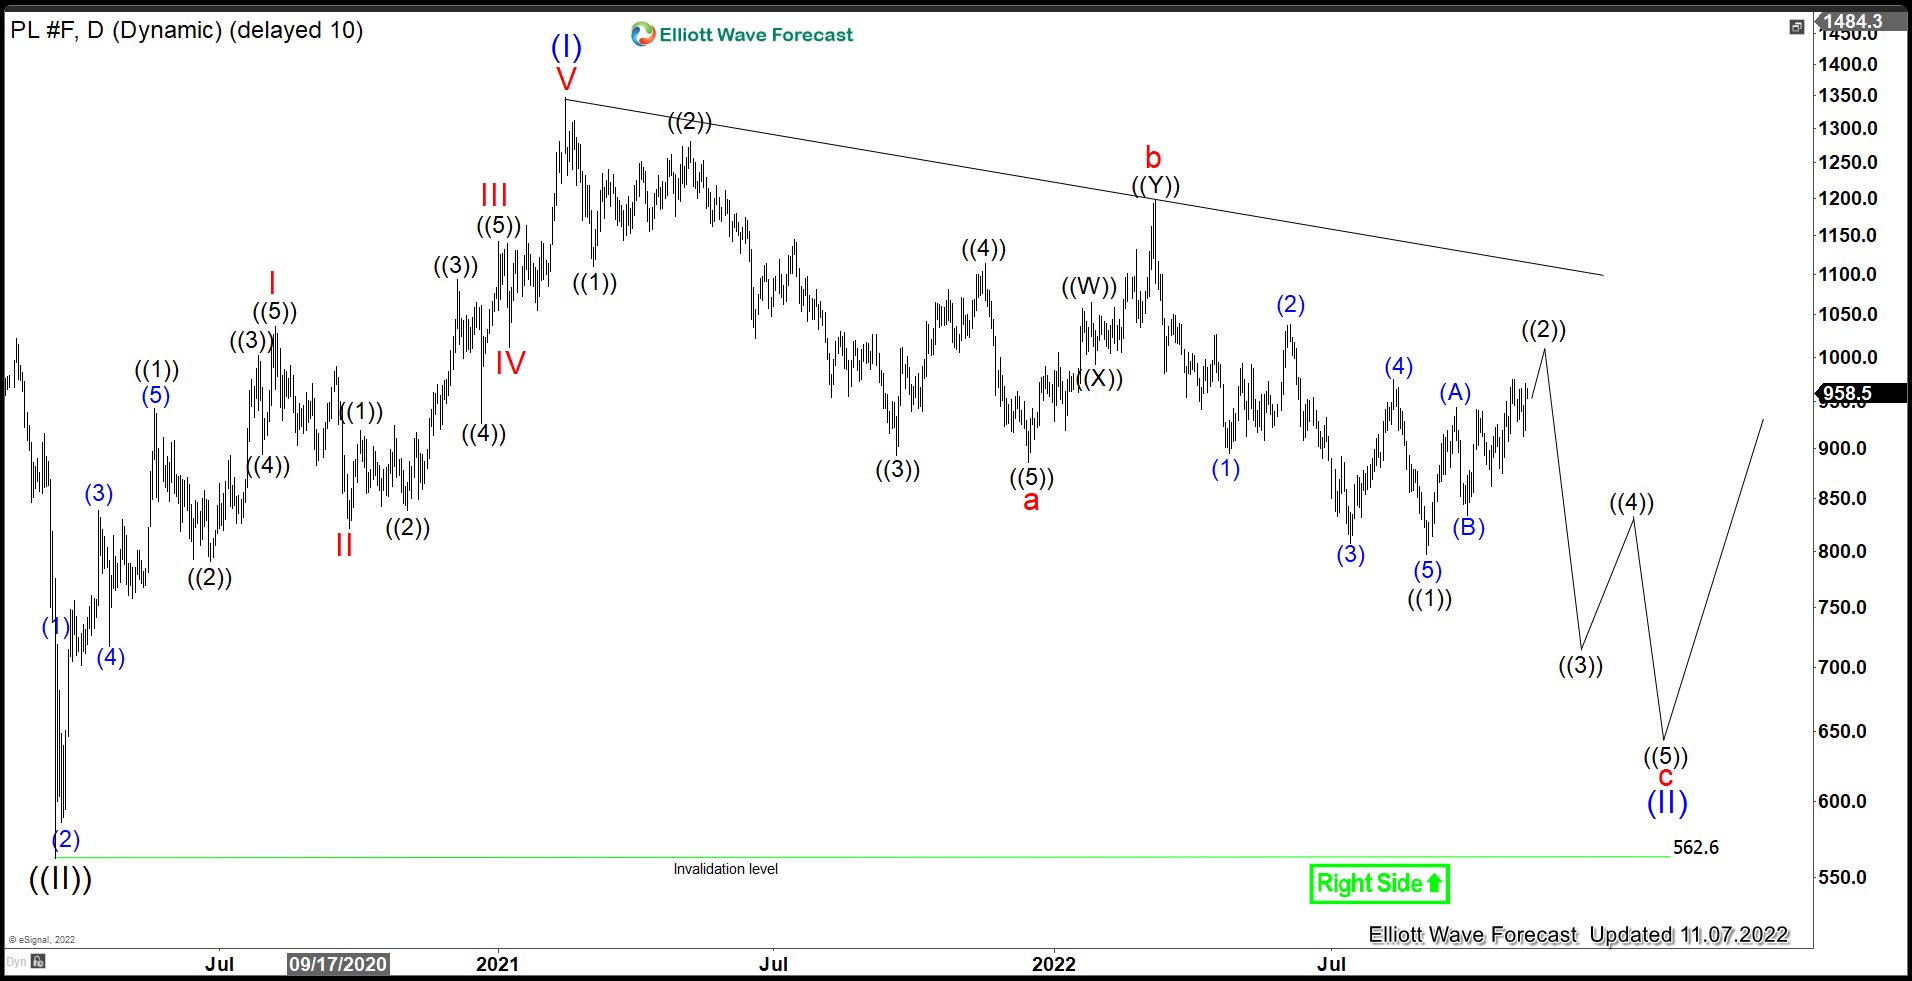
Platinum Daily Elliott Wave Chart
Daily Elliott Wave Chart for Platinum above shows that the metal is correcting cycle from 3.17.2020 low in wave (II). Internal subdivision of wave (II) is unfolding as a zigzag Elliott wave structure. Down from wave (I), wave a ended at 886, and rally in wave b ended at 1197. Wave c is in progress as 5 waves impulse structure. Down from wave b, wave ((1)) ended at 796.8. Wave ((2)) is in progress to correct cycle from 3.9.2022 high before the metal turns lower again in wave ((3)) of c. If the metal manages to close above the descending trend line from wave (I), we can consider wave (II) completed at 796.8.
Forex and Cryptocurrency Forecast
EUR/USD: Slower, Longer, Higher
Overall, last week passed, as predicted, without any majorsurprises. The main event was the FOMC (Federal Open Market Committee) meeting of the US Federal Reserve on Wednesday, November 2, at which it was unanimously decided to raise the key rate by 75 basis points (bp) to 4.00%. This is the highest level since 2008. Such a move was quite expected. Therefore, the subsequent press conference of the regulator's management was of greater interest to market participants. Fed Chairman Jerome Powell said at the meeting that although inflation must be reduced "drastically", monetary policy parameters can be changed as needed. The hint was that the pace of rate hikes could slow down from December, but the final rate level would likely be higher than previously thought.
The market received this message from the head of the Federal Reserve in different ways. Some decided that the US Central Bank kept the opportunity for further tightening of its monetary policy. Some believed that we in for the next, fifth in a row, rate hike by 75 bp in December. And some, on the contrary, took Powell's words as a signal that the basic step will no longer be 75, but 50 bp. That is, the vector of fighting inflation will change direction from "raising rates faster" to "raising rates more slowly, but longer." Although, in this case, this is just a change of route, and the ultimate goal in both cases is the same.
Moreover, the market decided that the keywords here are not only "slower" and "longer", but "higher" as well. Back in late October, the futures market predicted that the highest rate would reach 4.85% in March 2023. Now the peak of expectations has shifted to June, having risen to 5.1%. And the median rate forecast for the end of next year rose from 4.46% to 4.8%.
Many analysts believe that a slowdown in the Fed's monetary tightening (QT) will allow rival currencies to counter the oncoming dollar more effectively. Now the central banks of other countries are catching up, not having time to raise their rates at the same pace as in the US. If the Fed moves more slowly, they will be able, if not to overtake their American counterpart, at least to close the gap or catch up with it.
Following the FOMC meeting, the DXY Dollar Index moved up, hitting 113.00. The US currency strengthened against all G10 currencies, except for the Japanese yen. Then a reversal followed, and before the release of the data on unemployment in the US on Friday, November 04, it fell to 112.35, and EUR/USD consolidated around 0.9800.
Labor market data showed that non-farm payrolls in the US (NFP) stood at 261K in October, up from the 200K forecast but below September's 361K. The unemployment rate in the country rose from 3.5% to 3.7% over the month, while the forecast was 3.6%. The market took this as a negative signal for the dollar, DXY fell to 110.80, and EUR/USD went up and ended the week at 0.9958.
Overwhelming majority of analysts, 90%, support the fact that it will continue to move south in the near future, and only 10% expect a correction to the north. Among the oscillators on D1, 40% are green, the same number are red, and 20% are neutral. Among the trend indicators, the advantage is on the side of the green ones. 65% advise buying the pair and 35% selling.
The immediate support for EUR/USD is at 0.9865-0.9885, followed by 0.9825, 0.9765, 0.9700, 0.9645, 0.9580 and finally the Sep 28 low at 0.9535. The next target of the bears is 0.9500. For the bulls, the first priority will be to break the 1.0000 barrier. Then they will meet resistance at the levels of 1.0100, 1.0250, 1.030 and 1.0370.
Of the notable events of the upcoming week, first of all, we should note the data on retail sales in the Eurozone, which will be published on Tuesday November 08. There will be data on the consumer market (CPI) and the US labor market on Thursday, November 10. And on Friday, November 11, we will find out the value of the German CPI and the US University of Michigan Consumer Confidence Index.
GBP/USD: BoE Failed to Help the Pound
If a slowdown in US QT is going to help certain currencies, the pound doesn't seem to be one of them. The Bank of England (BoE), as well as the Fed, raised the key rate by 0.75% at its meeting on Thursday, November 03, from 2.25% to 3.00%. This move was the strongest one-time rate hike since the late 1980s. However, this did not help the British currency, and it continued to fall, fixing the weekly low at around 1.1144.
It would seem that the new Prime Minister has been elected, tax cuts have been abandoned, and the rate has been raised. What else do investors need? First of all, they need confidence that the rate will continue to grow at the same pace. But there is no such certainty.
Following Jerome Powell, BoE chief Andrew Bailey hinted that the pace of rate hikes could be slowed down in the future. That is, the dollar will remain in the lead in this parameter. Although, according to Mr. Bailey, a repeat of the 1970s crisis is unlikely, the threat of a prolonged recession forces the regulator to act very carefully. It is important not to strangle the economy in the rush to defeat inflation and not to bring down the labor market. According to the forecasts of the Bank's economists, the country's GDP will decrease by about 0.75% in the second half of this year. At the same time, the decline will last until mid-2024.
Investors were also disappointed by the Retail Price Index published last week by the British Retail Consortium (BRC). Thus, the average prices in stores in October, with a forecast of 5.5%, in reality grew by 6.6%. Most of all, prices for food products rose, by 11.6%, and the "food basket" rose by 9.4%. According to the BRC, the reasons for the next jump in inflation are still the same as before: the energy supply crisis caused by anti-Russian sanctions and the lack of skilled labor, in the struggle for which employers are forced to constantly raise wages.
In such a difficult environment, the Bank of England will most likely not be able to stick to a certain line and will toss between tightening (QT) and easing (QE) its monetary policy, trying to find a balance. However, there is no guarantee that it will be able to do this, and such throws will cause increased volatility in the British currency quotes.
Against the backdrop of weak data from the US labor market, GBP/USD corrected to the north at the very end of last week and set the last chord at 1.1373. However, strategists at ING, the largest banking group in the Netherlands, believe that it may soon retest the 1.1000 level. At the same time, when moving to a long-term forecast, one can hope for some positive things. For example, economists at the Australian bank Westpac predict that the pound will trade at 1.2000 by the end of 2023, and it will reach 1.2700 by the end of 2024.
As for the median forecast of analysts for the near future, the advantage of bears over bulls is insignificant here: 55% to 45%. Among the D1 oscillators, 25% are on the green side, 40% are on the red side, and 35% are comfortably settled in the neutral gray zone. Among trend indicators, 65% are red, 35% are green. The levels and zones of support for the British currency are 1.1350, 1.1230, 1.1150, 1.1100, 1.1060, 1.0985-1.1000, 1.0750, 1.0500 and the September 26 low at 1.0350. When the pair moves north, the bulls will meet resistance at the levels of 1.1435, 1.1475-1.1500, 1.1560, 1.1600-1.1625 1.1645, 1.1720, 1.1830, 1.1900, 1.1960, 1.2135 and 1.2200.
Of the events of the upcoming week, attention is drawn to the data on the GDP of the United Kingdom, which will be published on Friday November 11. The forecast looks disappointing and foreshadows a fall in Q3 2022. by -0.1% (+0.2% in Q2).
USD/JPY: Intervention from BoJ: Yes or No
FX interventions by the Bank of Japan (BoJ) at the end of October helped stabilize the yen, and USD/JPY ended the five-day period at 146.64, in the middle of the 145.30-148.85 channel. At the same time, the country's finance minister, Shunichi Suzuki, said on Friday, November 04 that the government has no intention of directing the currency to certain levels through interventions. And that the exchange rate should move steadily, reflecting fundamental indicators, and monetary policy is up to BoJ.
Such a statement may put downward pressure on the Japanese currency, as there may not be new interventions, and the Bank of Japan is not going to leave the ultra-dove rate and will keep the rate at the negative level of -0.1%.
Recall that USD/JPY reached the height of 151.94 on October 21, having renewed its 32-year high. But then, within just a few minutes, it collapsed by more than 500 points, from 151.63 to 146.24. According to the Financial Times, at that moment, the Bank of Japan sold at least $30 billion in an attempt to support the yen. After this intervention, the pair turned around and soared again: apparently, $30 billion was not enough. And another intervention followed on Monday, October 24, causing the pair to fall to 145.48. The last chord sounded at 147.40 on October 28. A week later, on November 4, the pair finished less than 100 points from this zone, at 146.64.
65% of analysts do not exclude that USD/JPY will try to test the 150.00 level again, and if successful, to rise above 152.00. 25% believe that the Japanese Central Bank will decide on one or more interventions, and therefore vote for the pair's downtrend. 10% expect further movement in the side channel. The oscillators on D1 have a mixed picture: 20% are looking north, 40% are looking south, and 40% are gray neutral. Among trend indicators, the ratio of green and red is 50% to 50%.
The nearest support level is 146.40, then 145.30, 143.75, 140.60, 140.00, 138.35-139.05 and 137.40. Resistance levels are 146.85, 147.50, 147.90-148.00, 148.45-148.85, 149.45, 150.00, 151.55. The purpose of the bulls is to rise and gain a foothold above the height of 152.00. Then there are the 1990 highs around 158.00.
No important statistics on the state of the Japanese economy are expected to be released this week.
CRYPTOCURRENCIES: BTC/ETH – Who Wins?
Let's start with the birthday. Monday, October 31, 2022 marks the 14th anniversary of the birth of the flagship cryptocurrency. Satoshi Nakamoto published the bitcoin white paper on this day in 2008. The white paper described how the peer-to-peer payment system worked that would revolutionize the financial technology world. The bitcoin network was launched in January 2009. Satoshi Nakamoto disappeared two years later, and the public has never been able to find out who wrote the document that underpins the huge industry. It is unknown as well whether it was one person or a group of people.
Bitcoin has lived a very turbulent life during these 14 years. It rose and fell, then got back on its feet and fell again. It climbed onto the crest of the wave and fell into the abyss. Starting from scratch, it came close to $70,000 on November 07, 2021. And now it is trading in the $20,000 zone, having fallen in price by 70% in a year.
Of course, it is important to know what happened before. But we are much more concerned about what the future holds for us. And here the forecasts of experts are volatile as well as the quotes of bitcoin itself are volatile. Some predict the inevitable death of the crypto market for the umpteenth time, while others expect a take off to unprecedented heights. For example, ARK Invest fund manager Cathie Wood believes that the capitalization of bitcoin will grow to $4.5 trillion (currently about $0.39 billion), and it will be able to become more valuable than most fiat currencies, including the US dollar.
Coinbase CEO Brian Armstrong shares this opinion, predicting that bitcoin will become a reliable asset over the next 5-10 years that can provide investors with security in difficult times. The billionaire believes that the market capitalization of BTC is not yet large enough for the first cryptocurrency to act as a serious hedge asset. However, according to the businessman, everything can change around 2030, when the crypto market will grow and "take a large share of the global economy." Bitcoin can be then treated as digital gold, investments in which can protect during a crisis.
Former Goldman Sachs executive and macro investor Raoul Pal is also looking ahead, allowing the digital asset market capitalization to rise to $300 trillion in the next 10-15 years. According to him, the capitalization of almost all financial markets ranges from $200 trillion to $300 trillion. Pal believes that cryptocurrencies will also reach this level in the future as part of the "fastest and most massive growth" in history. He is confident that the market capitalization of cryptocurrencies will soar immediately after the end of the macroeconomic turmoil.
After the Fed's decision to raise interest rates again, risky assets sank down. However, poor data from the US labor market came to their aid. As a result, at the time of writing the forecast, on the evening of Friday, November 04, BTC/USD, together with the S&P500, Dow Jones and Nasdaq stock indices, turned north and is trading at $21,180, trying to gain a foothold above $21,000. However, it is not at all certain that it will succeed. And if the main risky assets start to fall again, the main cryptocurrencies may follow them.
Kitco News analyst Jim Wyckoff believes that the crypto market's flagship will succeed. In his opinion, in technical terms, the bulls now dominate the bears. The specialist does not rule out that consolidation may form on the market in the near future before the quotes move into a phase of stable growth. Wyckoff has not ruled out either that bitcoin could experience increased volatility in the coming weeks.
A well-known analyst aka Plan B also believes that bitcoin is on the verge of a new upward cycle. The expert predicts the growth of the coin for two reasons. First, thanks to the recent rise in the value of bitcoin, investors who collectively own more than 60% of the available coins have made profits. According to Plan B, this factor indicates the upcoming BTC price pump. Secondly, the RSI index speaks in favor of the increase in the value of bitcoin. The value of this technical indicator has recently dropped to its all-time low, that is, the market has fallen into an extreme oversold zone, so a reversal is inevitable.
Researchers at Glassnode agree with Plan B. Their latest report says that the bitcoin market is currently in an accumulation phase, leading up to a massive bull run. There is a trend At the moment, similar to what happened at the beginning of 2019 before the rapid increase in bitcoin's value more than threefold.
However, for the crypto market to go up, institutional investors must move from sell-off or hibernation to accumulation. The mood of the general public (the so-called shrimps) is of course important, but the mood of the whales is much more important.
BNY Mellon, America's oldest bank, said that 70% of institutional investors would increase investment in crypto, albeit under certain conditions, such as "custody and execution that would be available in recognized, reliable institutions." The BNY Mellon report notes that "nearly all institutional investors (91%) are interested in investing in tokenized products." But at the same time, they are looking for ways to enter the cryptocurrency market safely, and not invest recklessly in the hope of high profits.
As for ordinary people, we can cite the results of another survey conducted by Grayscale Investment. Only 52% of ordinary Americans surveyed agreed that cryptocurrencies are the financial future. And only 44% of respondents said they were considering investing in digital assets. At the same time, the majority of respondents (81%) agreed that cryptocurrencies need clear regulation rules.
The question of whether the regulation of the crypto market is good or bad is still open. For example, many experts consider the threat of increased attention to Ethereum from the SEC (U.S. Securities and Exchange Commission) as negative factors.
It has been a month and a half since the leading altcoin moved from the PoW algorithm to PoS, after which the responsibility for building blocks has passed from miners to validators. The developers consider the main advantage of this change in the algorithm to be the reduction in network energy consumption from peak 112 TWh/year to 0.01 TWh/year. With regard to ETH, this practically nullified all the claims of environmentalists related to environmental pollution by miners. However, as a result of this step, the coin is increasingly moving away from what Satoshi Nakamoto introduced to the concept of cryptocurrency: the network has become more centralized and the SEC's desire to deprive ethereum of its cryptocurrency status has increased, replacing it with the status of a security and subjecting it to stricter regulation. SEC Chairman Gary Gensler hinted at this on the day of the transition to PoS.
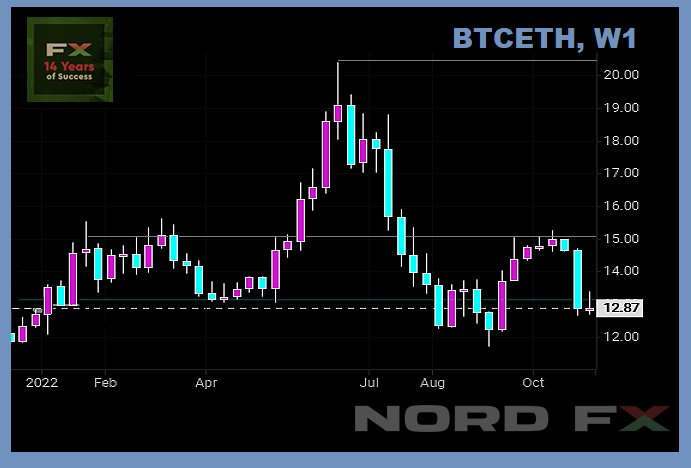
At the same time, it would be naive to think that only ethereum will be in the clutches of financial regulators. Certainly, bitcoin will also be subject to sanctions. So both cryptocurrencies are on an equal footing in this regard. But in terms of network development and its prospects, ethereum has clearly overtaken its older colleague in the past few months. This is clearly seen on the chart of BTC/ETH. Since mid-June, it fell from a high of 20.3 to 13.0 and returned to the values of the beginning of the year.
At the time of writing this review, on the evening of Friday November 04, BTC/USD is trading in the $21,180 area, ETH/USD - $1,650. The total capitalization of the crypto market is $1.055 trillion ($1.005 trillion a week ago). The Crypto Fear & Greed Index has not changed in seven days and is in the Fear zone, at the level of 30 points. According to the index developers, one can think about opening long positions at such a moment. Although, in our opinion, the situation is very shaky, and traders need to act as carefully and cautiously as possible.
EUR/USD Weekly Outlook
EUR/USD dropped notably to 0.9729 last week but then recovered. Initial bias stays neutral this week first. On the downside, break of 0.9729 will reaffirm the case the corrective rise from 0.9534 has completed at 1.0092. Deeper fall would then be seen to retest 0.9534 resistance next. However, break of 1.0092 will resume the rebound towards 1.0368 resistance instead.

In the bigger picture, medium term outlook stays bearish with trading inside the falling channel. That is larger down trend from 1.2348 (2021 high) is still in progress. Firm break of 0.9534 low will confirm this bearish case. However, break of 1.0092 will add to the case of medium term bottoming, on bullish convergence condition in daily MACD, and bring further rally towards 55 week EMA (now at 1.0583).

In the long term picture, long term down trend from 1.6039 (2008 high) is extending. Next target is 100% projection of 1.3993 to 1.0339 from 1.2348 at 0.8694. This will now remain the favored case as long as 1.0635 support turned resistance holds.


USD/JPY Weekly Outlook
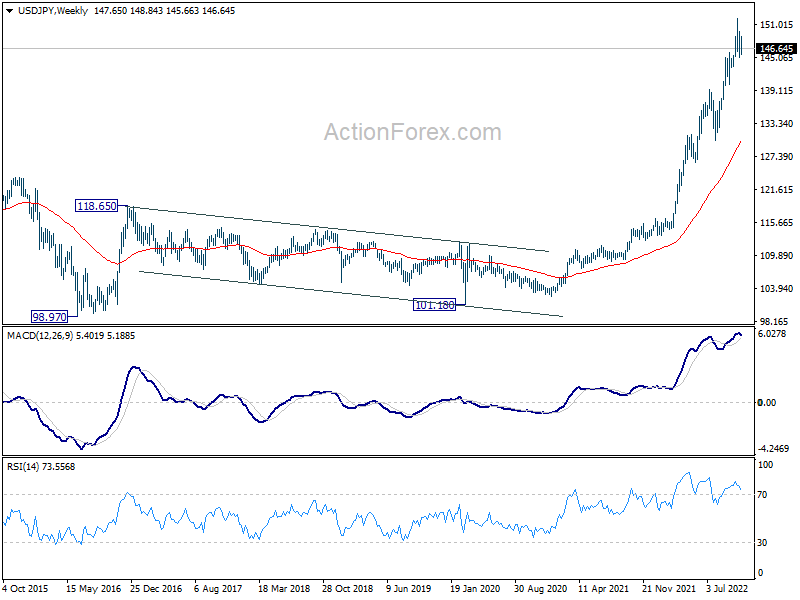
USD/JPY extended the consolidation pattern from 151.93 last week. Outlook is unchanged and initial bias stays neutral this week. Another fall could be seen, but downside should be contained by 38.2% retracement of 130.38 to 151.93 at 143.69 to bring rebound. On the upside, above 149.69 minor resistance will bring stronger rebound back towards 151.93 high. But upside should be limited there to continue the corrective pattern.
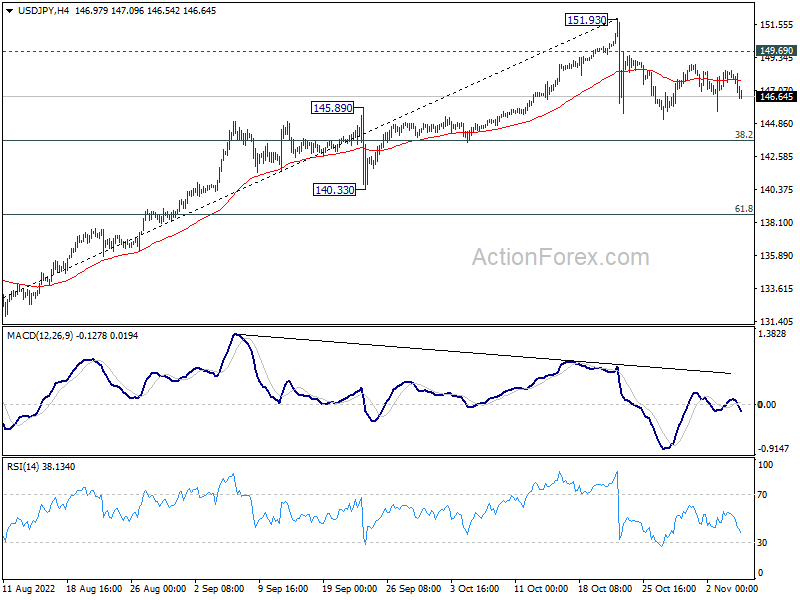
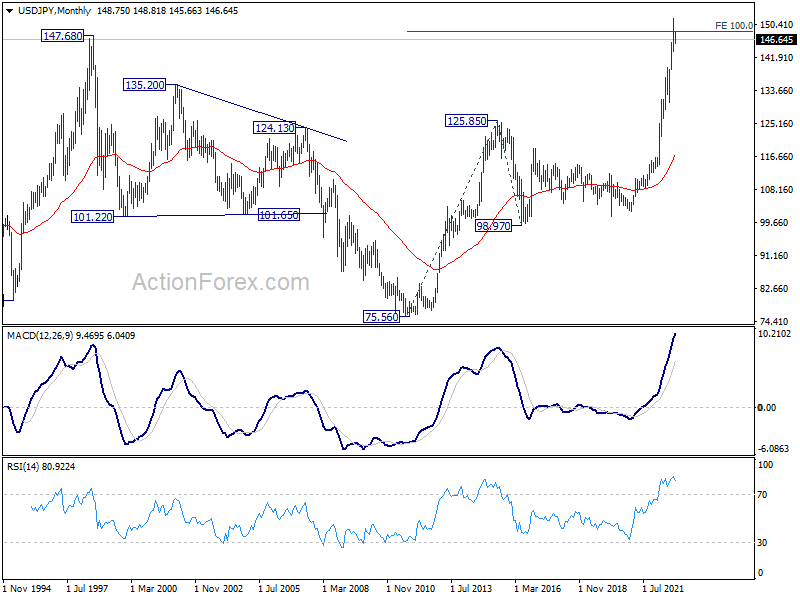
In the bigger picture, up trend from 101.18 is still in progress, as part of the whole up trend from 75.56 (2011 low). 147.68 (1998 high) was already met and there is no clearly sign of topping yet. In any case, break of 140.33 support is needed to be the first sign of medium term topping. Otherwise, further rise is in favor to next target at 160.16 (1990 high).
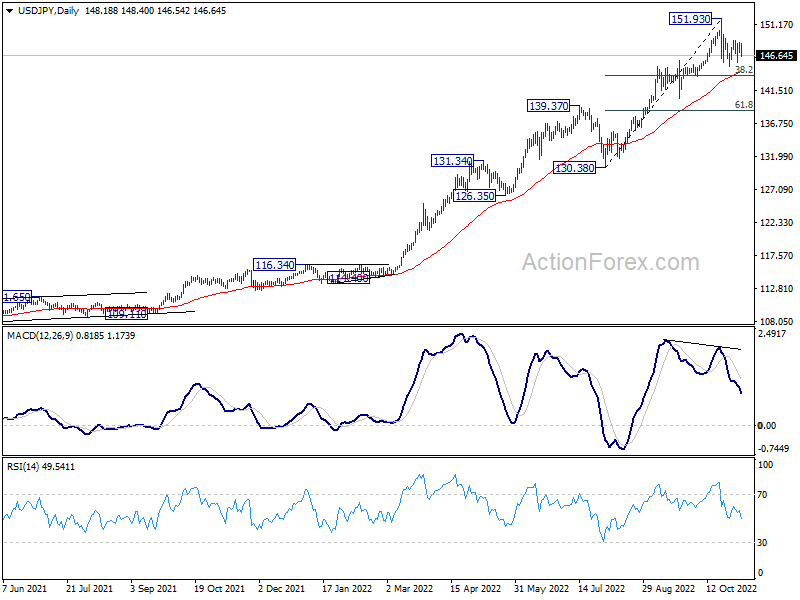
In the long term picture, rise from 101.18 is seen as part of the up trend from 75.56 (2011 low). Sustained break of 100% projection of 75.56 (2011 low) to 125.85 (2015 high) from 98.97 at 149.26, will pave the way to 138.2% projection at 168.47. This will remain the favored case as long as 139.37 resistance turned support holds.