Sample Category Title
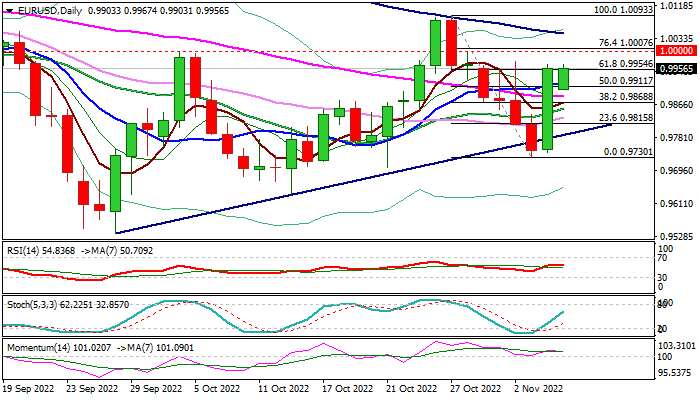
Nasdaq 100 Wave Analysis
- Nasdaq 100 reversed from pivotal support 10650.00
- Likely to rise to resistance level 11585.00
Nasdaq 100 index recently reversed up from the pivotal support 10650.00 (which stopped wave 5 in the middle of October) – standing near the lower daily Bollinger Band.
Upward reversal from the key support 10650.00 created the daily candlesticks reversal pattern Piercing Line, which stopped the earlier impulse waves 3 and (3).
Given the strength of the support 10650.00 ,Nasdaq 100 can be expected to rise further toward the next resistance level 11585.00.
EURCAD Wave Analysis
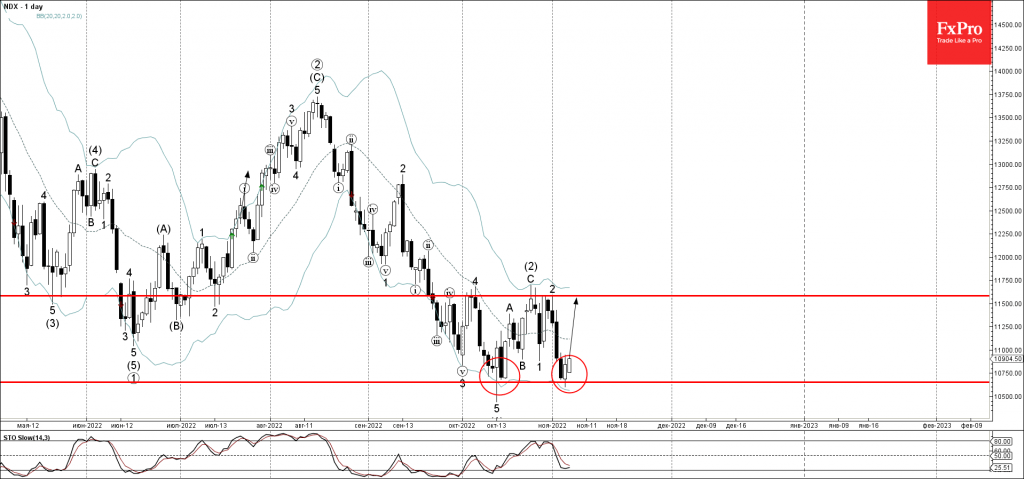
- EURCAD reversed from key support 1.3280
- Likely to rise to resistance level 1.3520
EURCAD under the bullish pressure after the earlier upward reversal from the key support 1.3280 (former strong resistance from July and August) – standing near the lower daily Bollinger Band.
Upward reversal from the key support 1.3280 created the daily Hammer, which started the active short-term impulse wave 3- which belongs to wave (C) from September.
Given the strong euro gains, EURCAD can be expected to rise further toward the next resistance level 1.3520.
China’s Weak Trade Surplus is No Cause for Disappointment
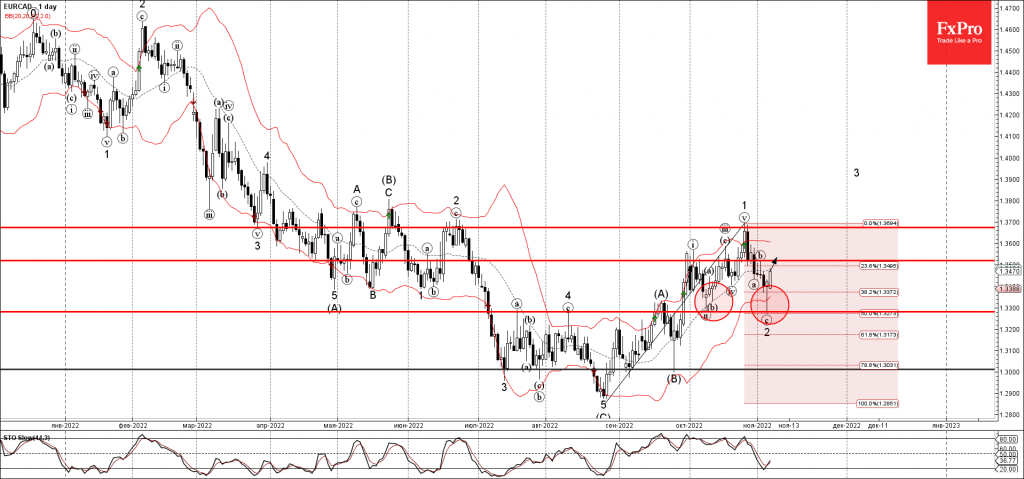
China’s exports contracted by 0.4% YoY in October, while imports lost 0.7% YoY in dollar terms. The foreign trade surplus rose to $85.7bn, lower than expected at $96bn.
Most observers saw these figures as a signal of a slowdown in the second-world economy. At the same time, it is worth bearing in mind that the dollar has appreciated by 18% against the DXY index (a basket of the six popular currencies) over the past year and by more than 12% against the CNY.
The renminbi has weakened in two waves this year: in April-May and from August until the end of October. In the first wave, we saw the USDCNY gain 5%; in the second wave, the renminbi weakened by around 7.5%. The second wave of weakening has a chance to reinvigorate foreign trade.
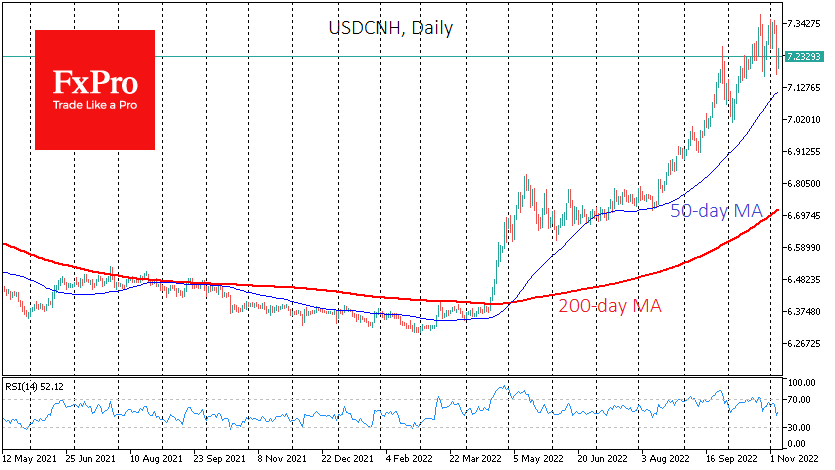
China is facing a relatively indirect impact from the energy crisis. It is more affected by the slump in the global economy than by the energy price hikes that Europe and Japan are facing. A relatively measured weakening of the national currency would probably work to maintain the competitiveness of Chinese goods on global markets.
If we are correct, the Chinese economy is now close to its lows for a coming couple of quarters, as production and consumer activity will pick up further. Added to this is the recovery in the Chinese markets, which has been evident since the start of the month. At current levels, global investors may be taking a closer look at Chinese assets, which would also help the renminbi in addition to the work that the PBC is doing to contain the weakening of its currency.
WTI: Oil Holds Bullish Tone after Friday’s 5.3% Rally
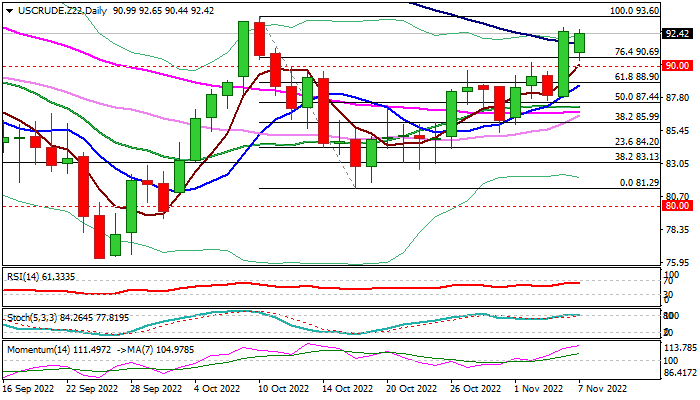
WTI oil price regained traction after a gap-lower opening and subsequent dip on Monday, pressuring last Friday’s three-week high, posted after Friday’s 5.3% rally.
Signals that the Fed may ease its firm hawkish stance in tightening monetary policy in coming meetings, deflated dollar and lifted oil prices, with news that China will stick to its zero-Covid policy (after Friday’s rumors of possible easing) had a limited and short-lived negative impact on oil prices.
Friday’s strong bullish acceleration generated strong bullish signal on close above pivots at $90.69 (Fibo 76.4%) and $91.62 (falling 100DMA).
Bulls eye key near-term barrier at $93.60 (Oct 10 top), break of which would add to reversal signal on completion of failure swing pattern on daily chart and expose next key resistance at $94.36 (Fibo 38.2% of $123.56/$76.25).
Bullish daily studies are supportive, but overbought conditions suggest a pause for consolidation, with dips to be ideally contained by broken $90 level, which guards pivotal support at $89.06 (daily cloud top).
Res: 92.82; 93.60; 94.36; 95.02.
Sup: 91.62; 90.69; 90.00; 89.06.
US 500 Index Flirts with 50-day SMA But Outlook Remains Negative
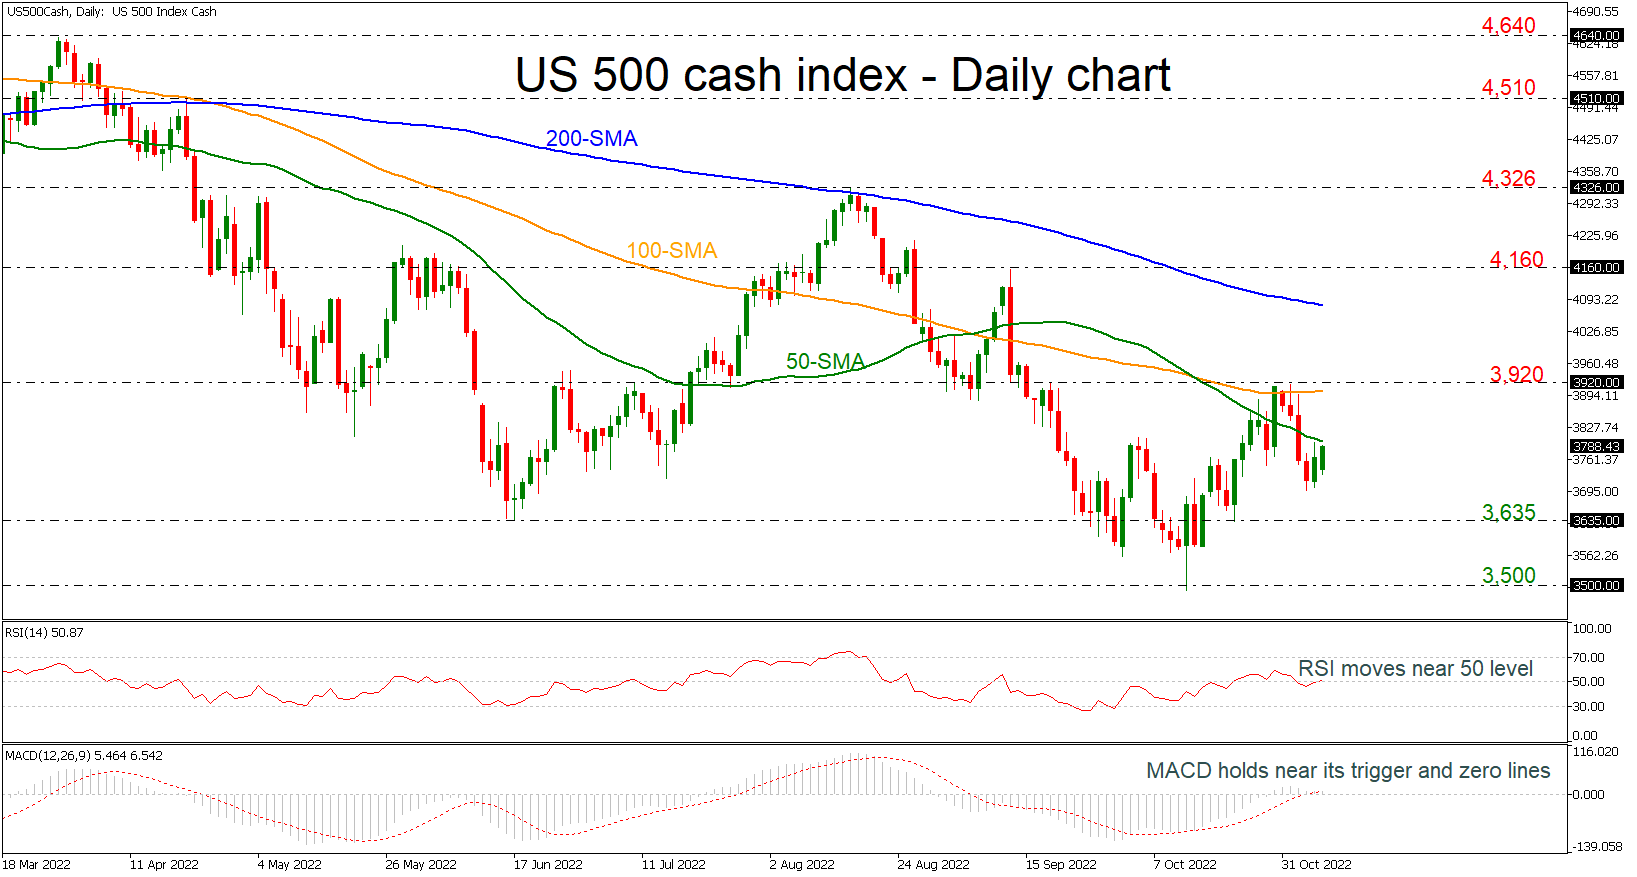
The US 500 stock index is moving slightly higher, approaching the 50-day simple moving average (SMA), holding well above the crucial 200-weekly SMA, which is acting as strong support level near 3,635. The RSI indicator is pointing slightly up near the neutral threshold of 50, while the MACD is moving sideways near its trigger and zero lines.
If price action jumps above the 50-day SMA (immediate resistance), there is scope to test the 100-day SMA around the 3,920 barrier. Clearing this key level would see additional gains towards the 200-day SMA at 4,080.
If the 3,635 support fails, then the focus would shift to the downside towards 3,500, which if breached would increase downside pressure and bring about a reversal of the trend. From here, the index would be on the path towards the 3,233 barrier, registered in October 2020.
Overall, the US 500 index has been negative in the long-term timeframe and only a climb above the 200-day SMA may change the outlook to bullish.
Canadian Dollar Soars after Employment Report
The Canadian dollar is almost unchanged today, trading at 1.3483.
Canadian dollar flies on job gains
It was a day to remember for the Canadian dollar, which rocketed almost 2% higher on Friday. The driver behind the spike was a massive gain in jobs at 108, 300 in October, up from 20,000 in September. The reading crushed the forecast of 10,000. Wage growth rose to 5.5%, up from 5.2%, while the unemployment rate was unchanged at 5.2%.
The employment gain was especially impressive as it was spread across the economy and was made up entirely of full-time jobs. The Bank of Canada, which hiked rates to 3.75% after a 50 basis point increase in late October is likely to respond with additional oversize hikes. The markets have priced in a 70% chance of a 50 basis point increase in December, and the terminal rate is projected at 4.5%. At the October meeting, BoC Governor Macklem said that the BoC was closer to ending the tightening cycle, while acknowledging that the BoC was far from achieving its goal of lowering inflation to its 2% target. Headline inflation has slowed to 6.9%, but core inflation has persisted.
In the US, the nonfarm payrolls sent mixed and somewhat confusing signals to the market. The October reading of 261,000 was stronger than the consensus of 200,000, but it marked the smallest gain since December 2020. The unemployment rate rose to 3.7%, up from 3.5%, while wage growth rose to 5.5% YoY, up from 5.2%. The latter release is likely to keep the Fed concerned about inflationary pressures.
Bottom line? The jobs report indicates that the labour market remains robust and although a 50-bp hike is likely, a 75-bp move remains a possibility. There is one more employment report and two more inflation releases ahead of the December 14th FOMC decision, each of which should be treated as a market-mover.
USD/CAD Technical
- USD/CAD faces resistance at 1.3420 and 1.3586
- There is support at 1.3364 and 1.3248
XAUUSD: Bulls Taking a Breather But Remain in Play on Hopes of Less Aggressive Fed
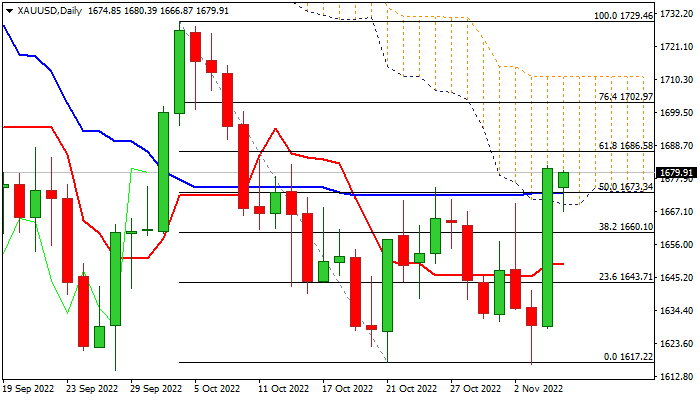
Spot gold holds firm bullish stance and consolidating under three-week high, posted after 3.2% rally on Friday (the biggest one-day rally since 24 June 2016), sparked by US labor data which raised hopes that the Fed may ease its aggressive stance in raising interest rates in the near future.
Fresh rally retraced over 50% of the $1729/$1617 bear-leg, leaving a double bottom ($1616/17), with penetration and close within thick daily cloud, adding to bullish signals.
Improved daily studies (strong bullish momentum / 10/20/30 DMA’s in positive setup) underpin recovery, which needs extension through $1680/$1686 pivots (55DMA / Fibo 61.8%) to confirm bullish stance and open way for attack at psychological $1700 barrier and daily cloud top ($1711).
Broken daily Kijun-sen / 50% retracement marks initial support at $1673, guarding more significant daily cloud base ($1669), loss of which would weaken near-term structure and risk deeper pullback.
Res: 1680; 1686; 1700; 1718.
Sup: 1673; 1669; 1660; 1649.
GBPUSD: Cable Extends Advance, Eyes 1.15 Garrier
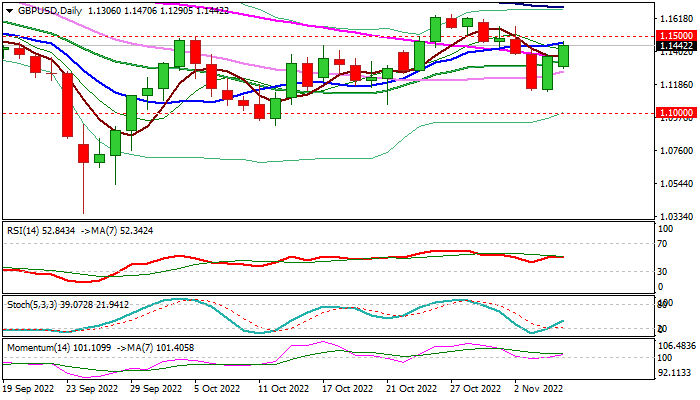
Cable surges above 1.14 handle in European trading on Monday, in extension of Friday’s bounce from strong support at 1.1150 (Fibo 38.2% of 1.0348/1.1645) where a double bottom was left.
Fresh advance was sparked by renewed risk mode and so far retraced slightly over 61.8% of 1.1645/1.1146 bear-leg, generating a reversal signal.
Daily studies are turning to bullish configuration as positive momentum is strengthening and RSI / Stochastic are heading north.
Close above daily Tenkan-sen (1.1395) is needed to keep bulls intact for push through pivots at 1.1500/1.1527 (psychological / Fibo 76.4%) that would confirm reversal and open way towards Oct monthly peak at 1.1645.
Broken top of thick daily cloud (1.1321) marks pivotal support, loss of which would weaken near-0term structure.
Res: 1.1470; 1.1500; 1.1527; 1.1566.
Sup: 1.1395; 1.1337; 1.1290; 1.1264.
USDJPY: Dollar Keeps Weak Tone, Boosting Fears of Reversal
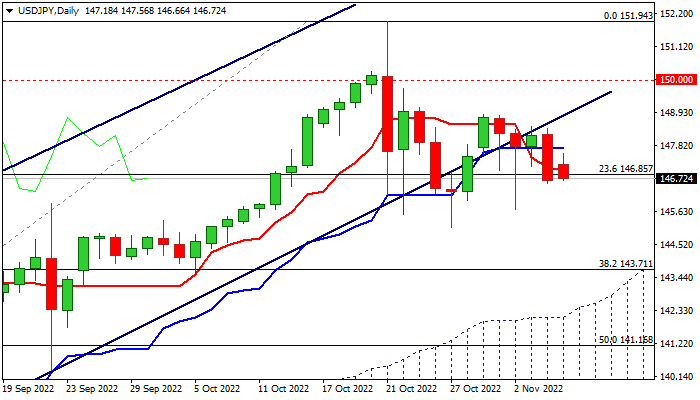
The dollar turns to red in early Europe after initial gains in Asia on Monday and probes again through cracked Fibo support at 146.85 (23.6% of 130.39/151.94 ascend).
Renewed risk sentiment keeps the dollar under pressure, as traders focus on the US mid-term elections and prepare for the likely scenario in which Republicans would take control of Congress and possibly the Senate that would result in a split government.
The risk appetite is likely to remain, according the scenario of potential political gridlock, as markets performed positively after the previous mid-term elections.
Fresh weakness broke again below the trendline support of a larger bull-channel that raises fears of reversal.
Repeated close below Fibo support at 146.85 to generate initial bullish signal, with extension and break below 145.10 pivot (Oct 27 trough) to boost negative signal on completion of failure swing pattern on daily chart. Daily Tenkan-sen and Kijun-sen turned to bearish setup and structure is weakening on rising negative momentum, adding to signals that near-term focus is shifting lower.
Repeated close below broken daily Kijun-sen (147.73) to keep bearish stance intact.
Res: 147.10; 147.73; 148.52; 148.84.
Sup: 146.55; 145.67; 145.10; 143.71.
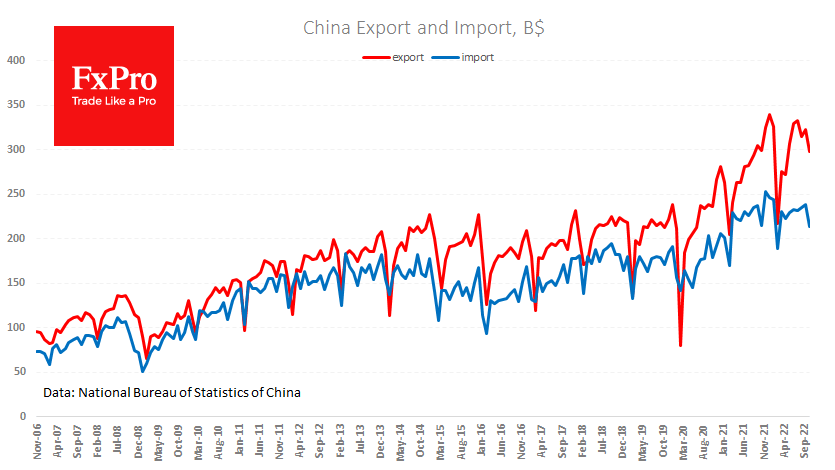
EURUSD: Euro Remains Firm after Friday’s 2.1% Advance on Renewed Risk Appetite
The Euro keeps firm tone at the beginning of the week and consolidating after 2.1% rally on Friday (the biggest daily advance in six years), sparked by renewed risk appetite on speculations that China could soon end its Covid restrictions, but the story was short-lived after China said on Monday that easing of zero-Covid policy is unlikely in the near future.
Friday’s strong rally generated bullish signal on marginal close above thick daily cloud (cloud top at 0.9954 is reinforced by Fibo 61.8% of 1.0093/0.9730 bear-leg) but the signal requires confirmation on sustained break above cloud top that would open way for test of parity level and falling 100DMA (1.0046) in extension.
Bullish configuration of daily studies supports the action, which needs to remain above broken 10DMA/50% retracement of 1.0093/0.9730, to keep bullish bias.
Res: 0.9976; 1.0000; 1.0046; 1.0093.
Sup: 0.9954; 0.9911; 0.9886; 0.9855.