Sample Category Title
SNB and BoE next, GBP/CHF accelerating down
SNB and BoE rate decisions are the remaining focuses of the day. SNB is widely expected to rise interest rate by 75bps to 0.50%, back in positive region. There are some speculations of a larger hike, but it's unlikely. The central would also repeat that appreciation of the Swiss Franc is welcome for now, as it helps curb imported inflation.
Meanwhile, BoE is expected to deliver another 50bps hike to 2.25%. The UK economy is stuck between a rock and a hard place. While inflation appeared to be slowing, "slightly", it remained close to multi-decade high. On the other hand, weakness has been seen in spending while the economy is already in recession. The voting of today's decision could contain some surprises.
Some previews on SNB and BoE:
- SNB Could Surprise (Again) with a Larger than Expected Hike
- Will the SNB Rock the Swissie with a Huge 100 bps Rate Hike?
- BoE Preview: Pressure Mounts for a Jumbo Hike
- BoE Decision a Close Call to Speed Up Rate Hikes as Worries Mount
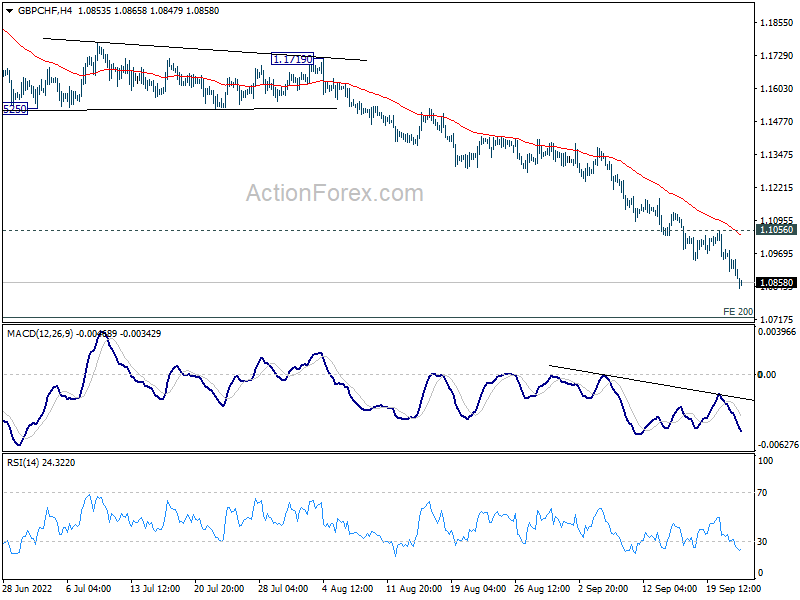
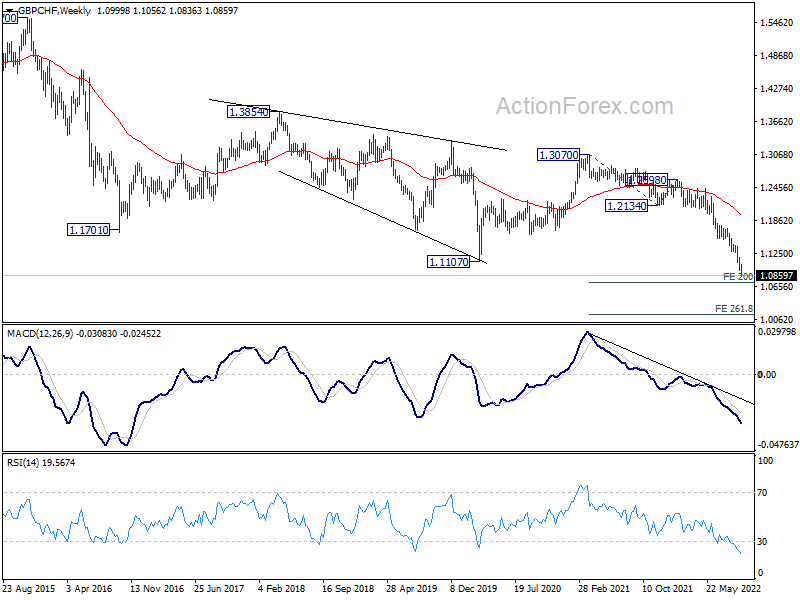
GBP/CHF broke through pandemic low at 1.1107 earlier this month, and the down trend is still in acceleration mode. Near term outlook will stay bearish as long as 1.1056 resistance holds. Next target is 200% projection of 1.3070 to 1.2134 from 1.2598 at 1.0726.
There is risk of further downside acceleration, either on dovish BoE or deterioration in geopolitical risks. In that case, break of 1.0726 could pave the way to 1.0148.
BoJ stands part, interest rate to remain at present or lower levels
BoJ kept monetary policy unchanged as widely expected. Under the yield curve control framework, short-term policy interest rate is held at -0.10%. BoJ will continue to purchase Japanese government bonds, without setting an upper limit, to keep 10-year JGB yield at around 0%. Also, BoJ will offer to purchase 10-year JGBs at 0.25% every business day through fixed -rate purchase operations, to cap the upside. These decisions were made by unanimous vote.
BoJ also pledge to continue with Quantitative and Qualitative Monetary Easing (QQE) with Yield Curve Control to achieve 2% price target, "as long as it is necessary for maintaining that target in a stable manner". The bank will not hesitate to take additional easing measures if necessary". It expects short- and long-term policy interest rates to "remain at their present or lower levels".
DOW to break 30k soon on hawkish Fed
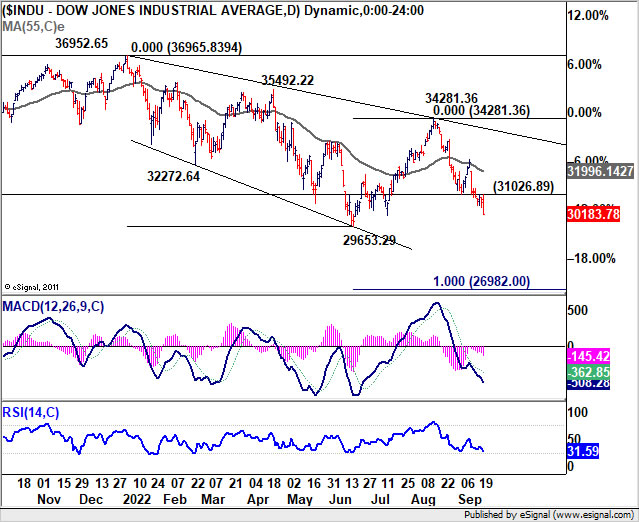
US stocks tumbled broadly after Fed raised interest rate by 75bps overnight, and indicated that rate could reach 4.4% by year end. Chair Jerome Powell reiterated that pledge that "the FOMC is strongly resolved to bring inflation down to 2%, and we will keep at it until the job is done." Meanwhile, against members' expectations, "we have seen some supply side healing but inflation has not really come down," he noted.
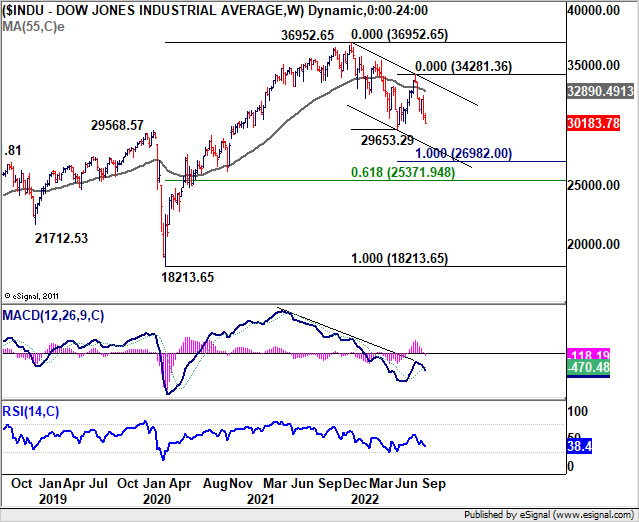
DOW's -1.70% decline indicates that fall from 34281.36 is extending and break of 30k handle would be seen soon. Such fall is seen as part of the whole medium term corrective pattern from 36952.65. Near term outlook will stay bearish as long as 31026.89 resistance holds. Next target is a retest of 29653.29 low. Firm break there will target 100% projection of 36952.65 to 29653.29 from 34281.36 at 26982.00. There's where the correction would probably end.
Technical Outlook and Review
USD/JPY:
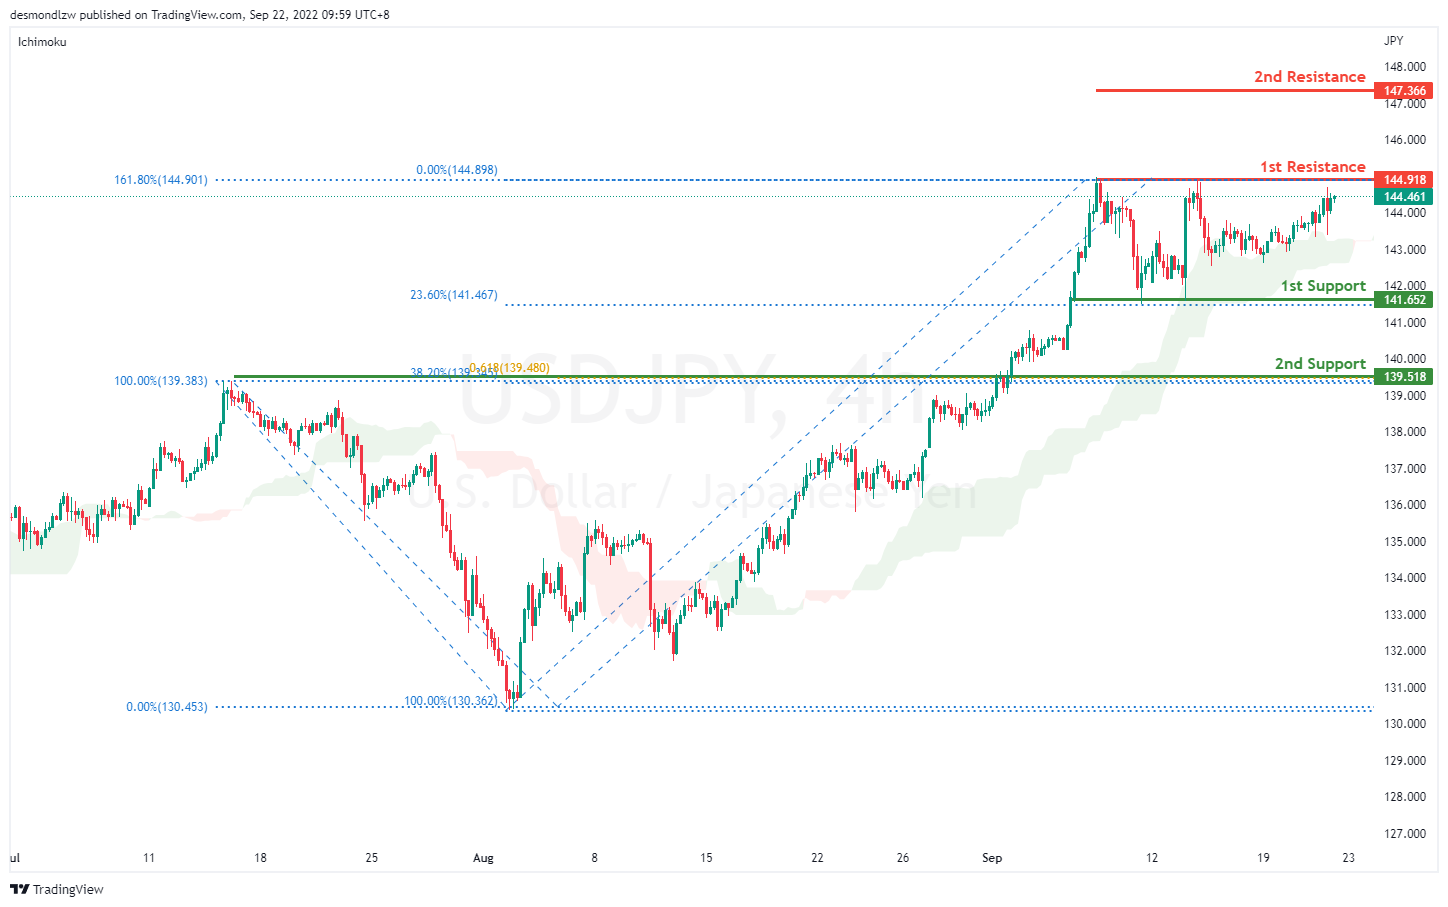
On the H4 chart, price is still respecting the ascending momentum. We are still bullish bias- Price is testing above the previous low and if bullish momentum continues, it should bring price to first resistance at 144.918 where the 161.8% extension sits. If it breaks this level, it should bring price to 147.366 where the previous swing high sits. Alternatively it could pull back to the first support at 141.652 where the 23.6% retracement and 100% projection sits then to the second support at 139.518 where the 38.2% retracement, 61.8% projection and overlapping support sits.
Areas of consideration:
- H4 time frame, 1st resistance at 144.918
- H4 time frame, 1st support at 141.652
DXY:
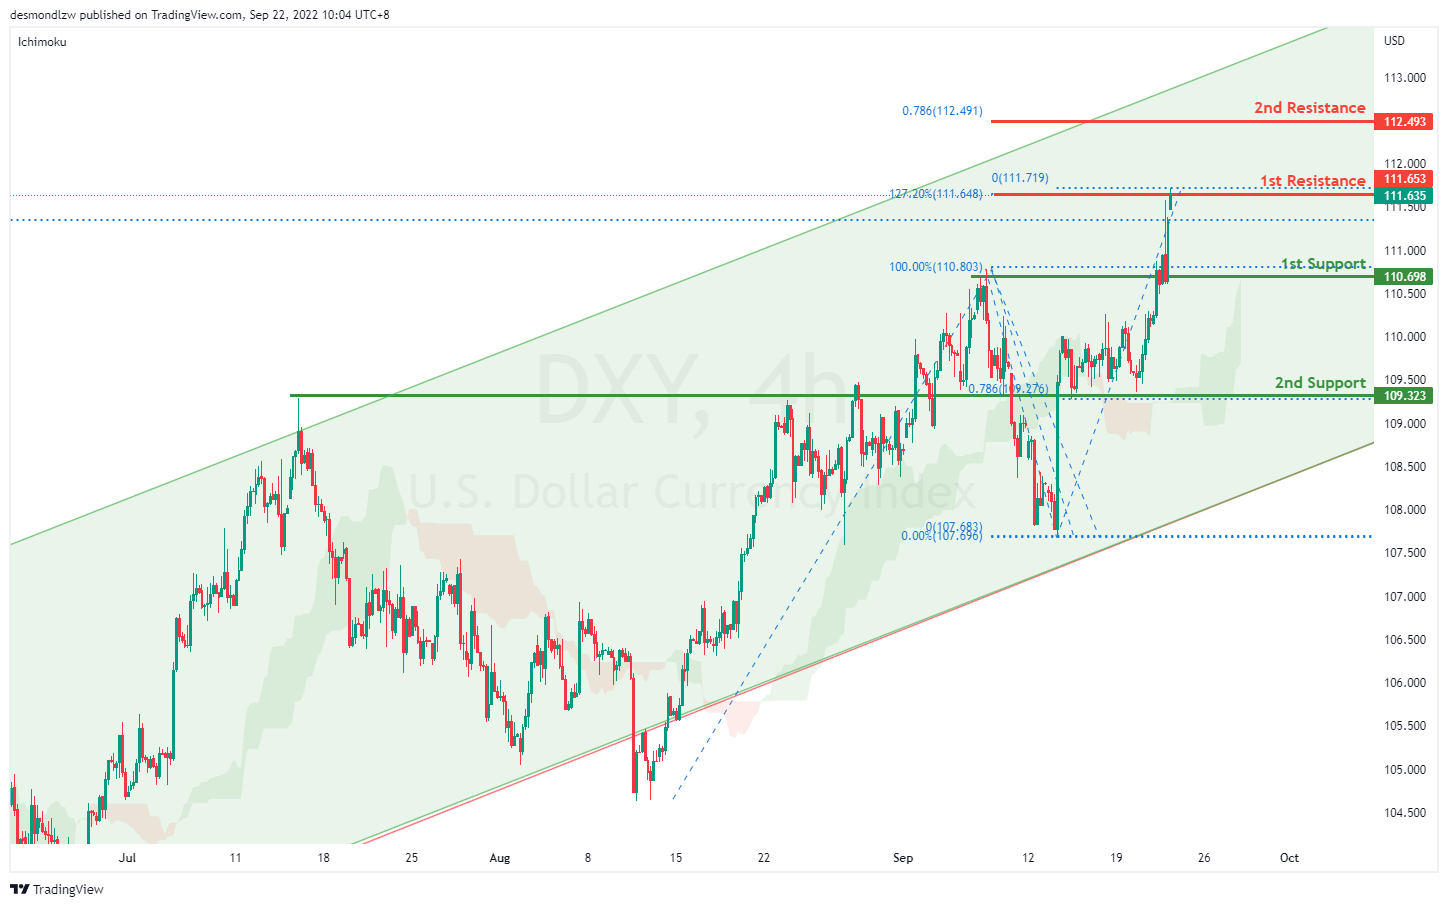
On the H4, price is still respecting the bullish channel and has failed to break the first support- we are bullish bias. Price has broken the previous high to test at the first resistance at 111.635 where the 127.2% extension sits. If bullish momentum continues, it should bring price toward the second resistance at 112.493 where the 78.6% projection sits. Alternatively, it could pull back to test the first support at 110.698 where the previous swing high sits then the second support at 109.323 where the 78.6% projection and previous swing high sits
Areas of consideration:
- H4 time frame, 1st resistance at 111.635
- H4 time frame, 1st support at 110.698
EUR/USD:
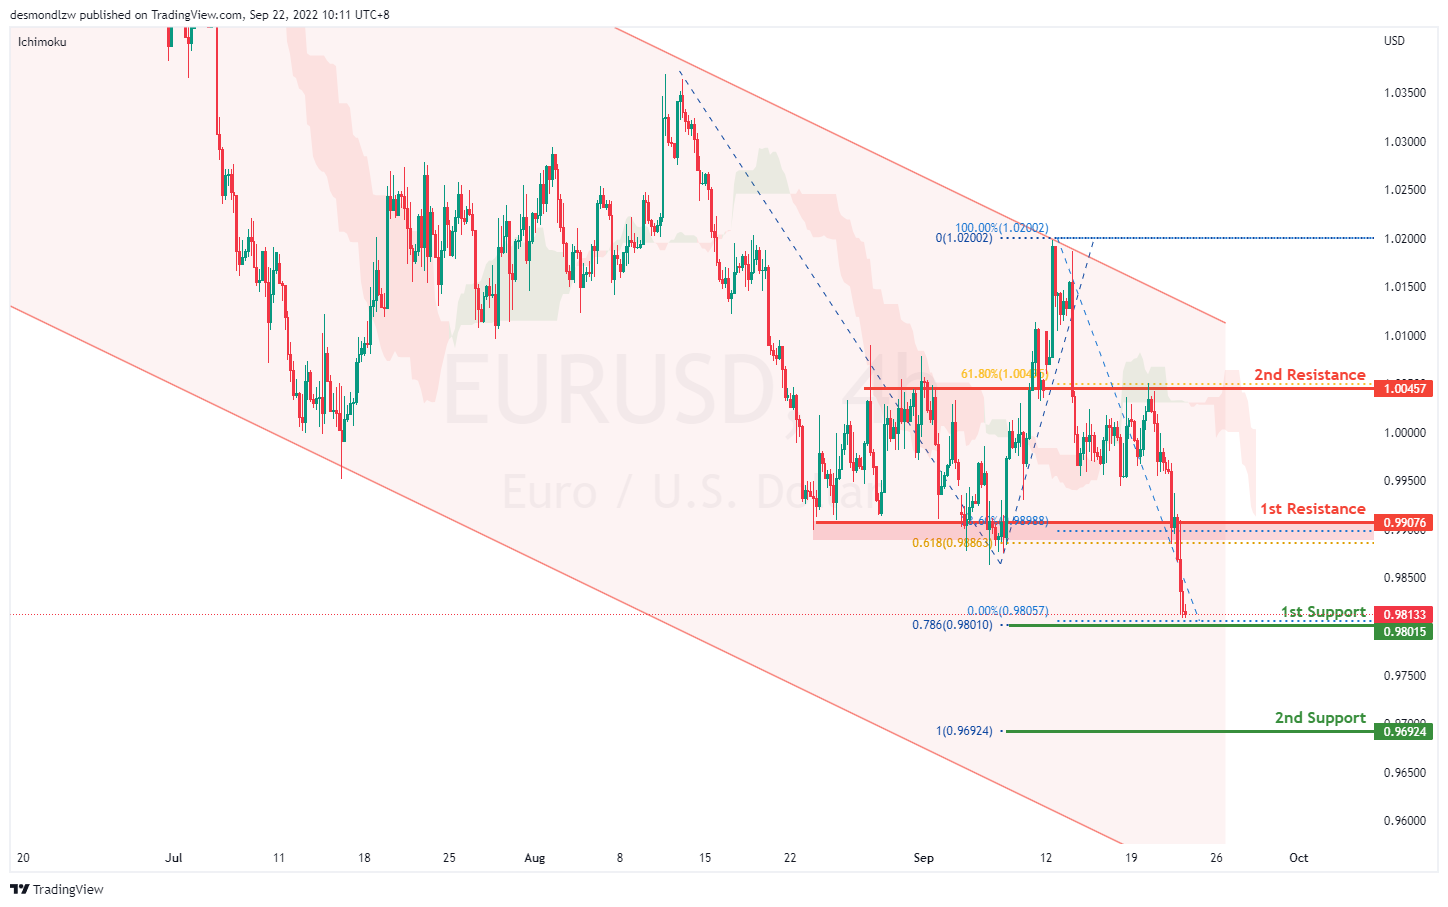
On the H4, price is moving within the channel in a descending manner- we are bearish biased. Price is currently testing the first support at 0.9801 where the 78.6% projection sits. If price breaks this level, it will bring prices to the second support at 0.9692 where the 100% projection sits. Alternatively it could pull back to test the first resistance at 0.9907 level where the 23.6% retracement, 61.8% projection and previous swing low sits then to the second resistance at 1.0045 where the 61.8% retracement and previous swing high sits.
Areas of consideration :
- H4 1st resistance at 0.9907
- H4 1st support at 0.9801
GBP/USD:
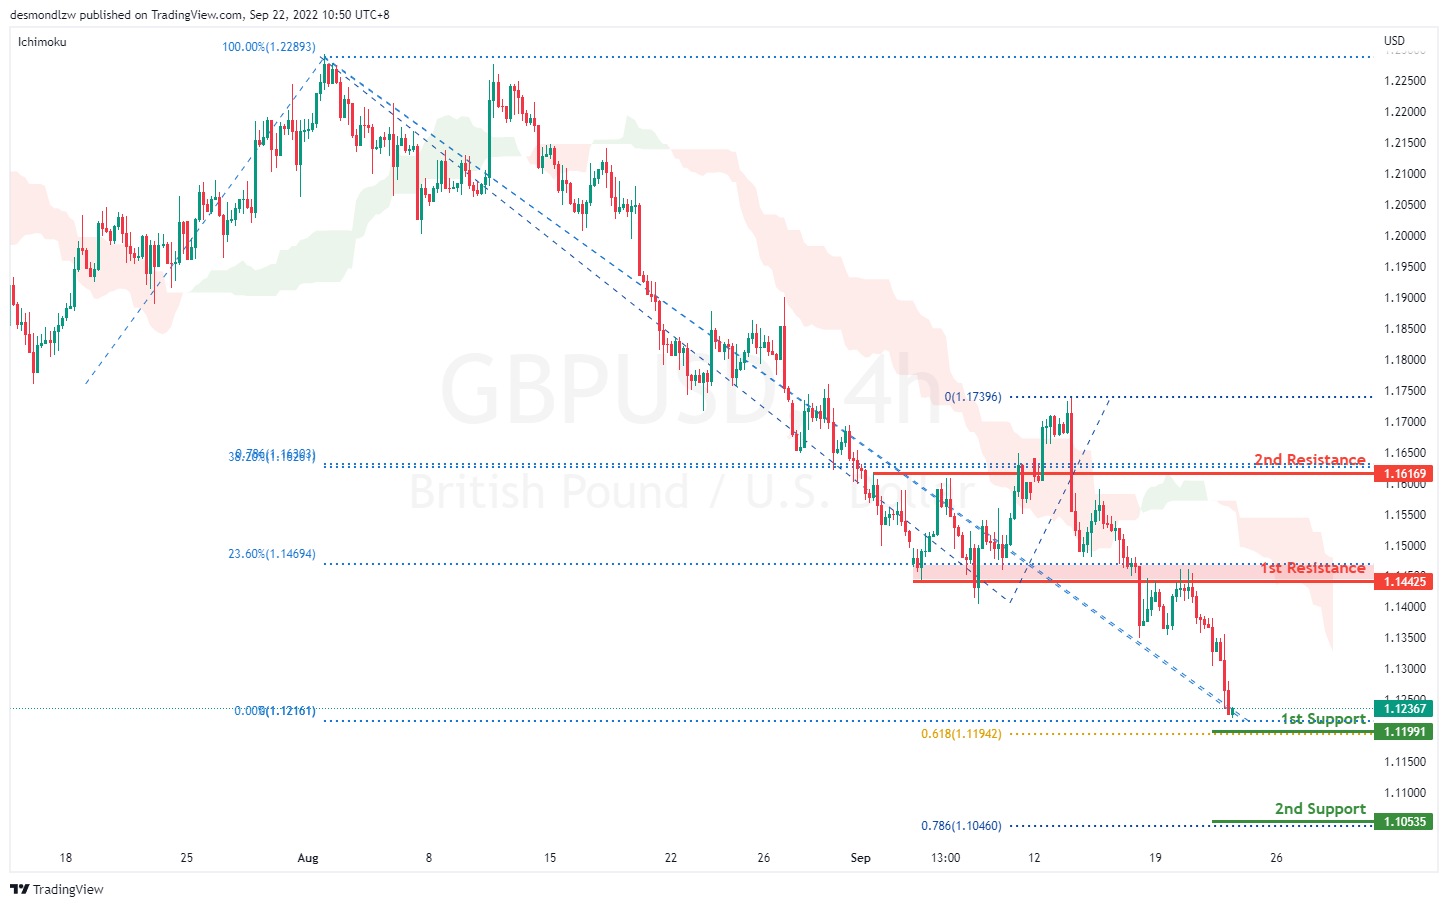
On the H4, prices are still moving in a bearish momentum hence we are bearish biassed. If bearish momentum continues, it should test the first support at 1.1199 levels where the 61.8% projection sits then the second support at 1.1053 where the 78.6% projection sits. Alternatively, price could pull back to test the first resistance at 1.1442 where the 23.6% retracement and overlapping resistance sits then the second resistance at 1.1616 where the 38.2% retracement, 78.6% projection and previous swing high sits
Areas of consideration:
- H4 1st resistance at 1.1442
- H4 1st support at 1.1199
USD/CHF:
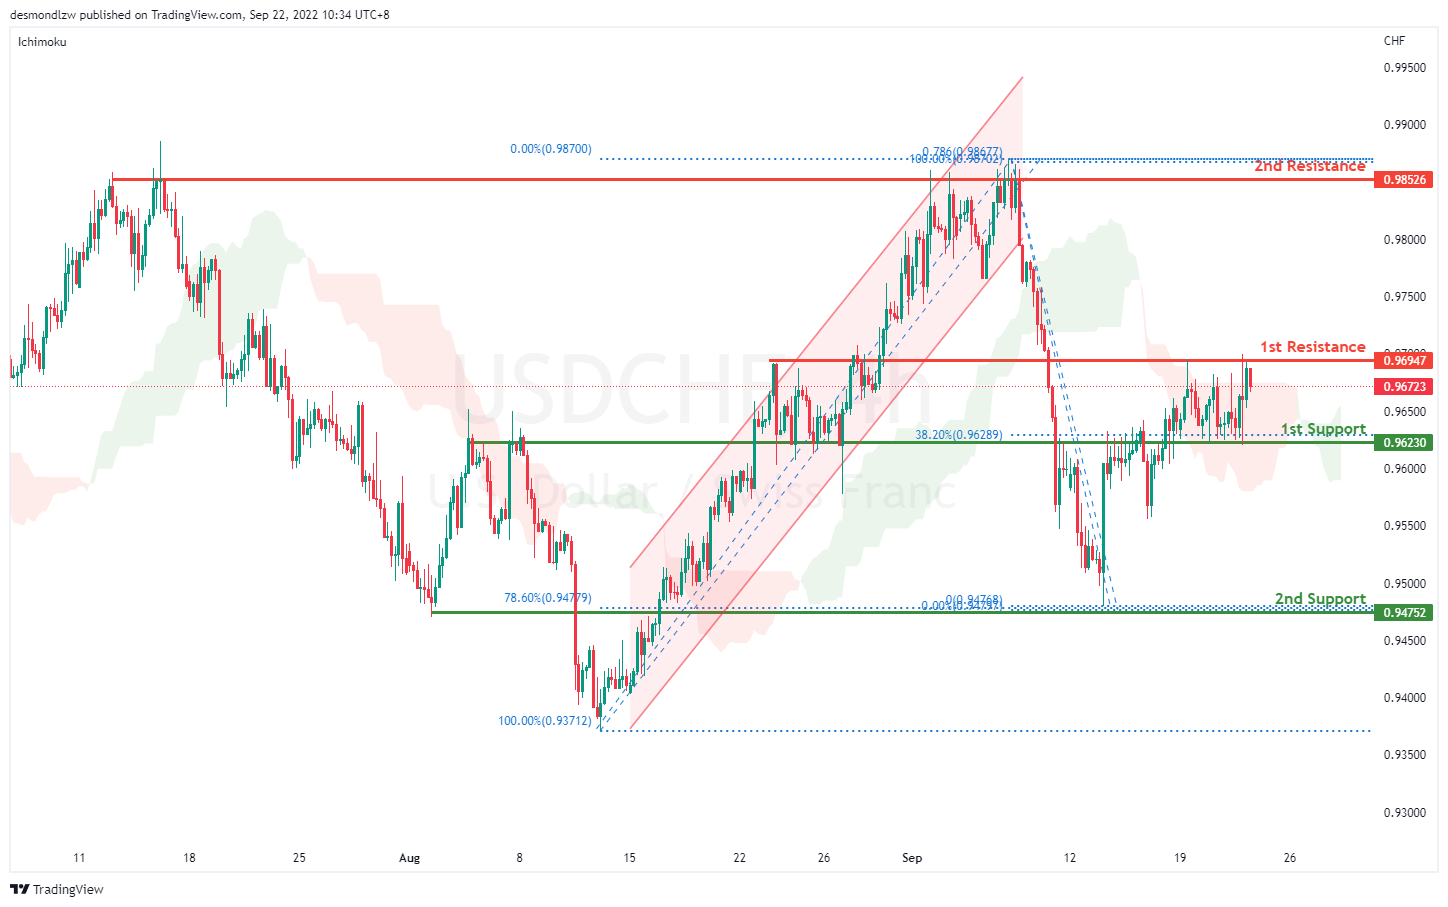
On the H4, prices have broken the descending channel and we are currently bullish biased. Price has broken the first support and is moving toward the the first resistance at 0.9688 where the 50% retracement sits. If bullish momentum continues, it should bring price to the second resistance at 0.9852 where the swing high and 78.6% projection sits. Alternatively, price could pull back to test the first support at 0.9623 where the overlapping resistance sits. If price continues with the bearish momentum, it should bring price to the second support at 0.9475 where the 78.6% projection and 78.6% retracement sits.
Areas of consideration
- H4 1st support at 0.9623
- H4 1st resistance at 0.9694
XAU/USD (GOLD):
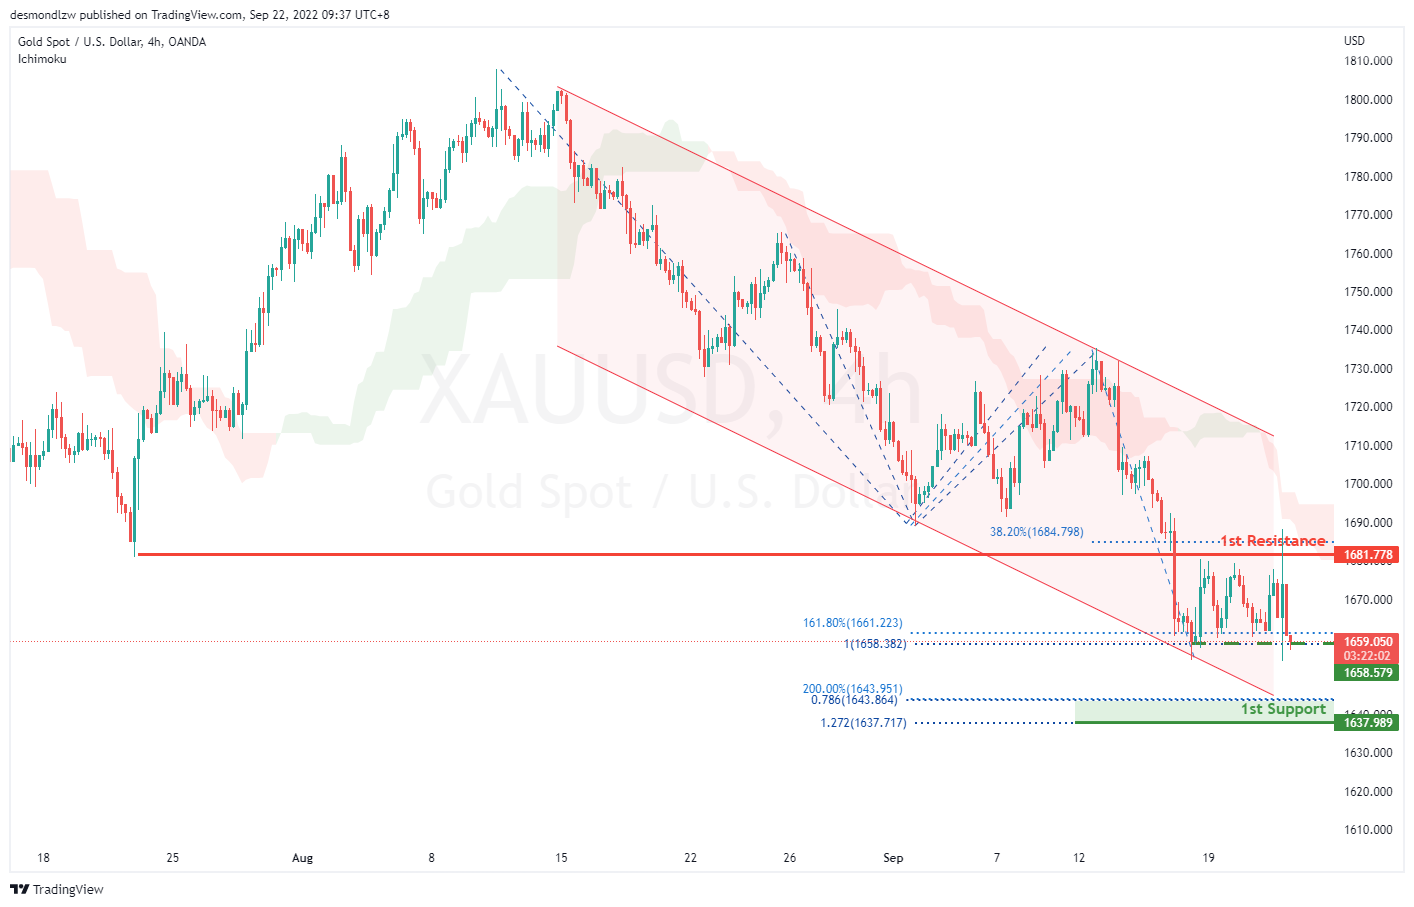
On the H4, with the price moving within the descending channel and below ichimoku cloud, if the price can break the previous support at 1658.579, which is in line with the 100% fibonacci projection and 161.8% fibonacci extension, we would have a bearish bias that the price may drop to the 1st support at 1637.989, which is in line with the 127.2% fibonacci extension, 200% fibonacci extension and 78.6% fibonacci projection. Alternatively, the price may test the 1st resistance at 1681.778, which is in line with the overlap resistance and 38.2% fibonacci retracement.
Areas of consideration:
- H4 time frame, curren price
- H4 time frame, 1st support at 1637.989
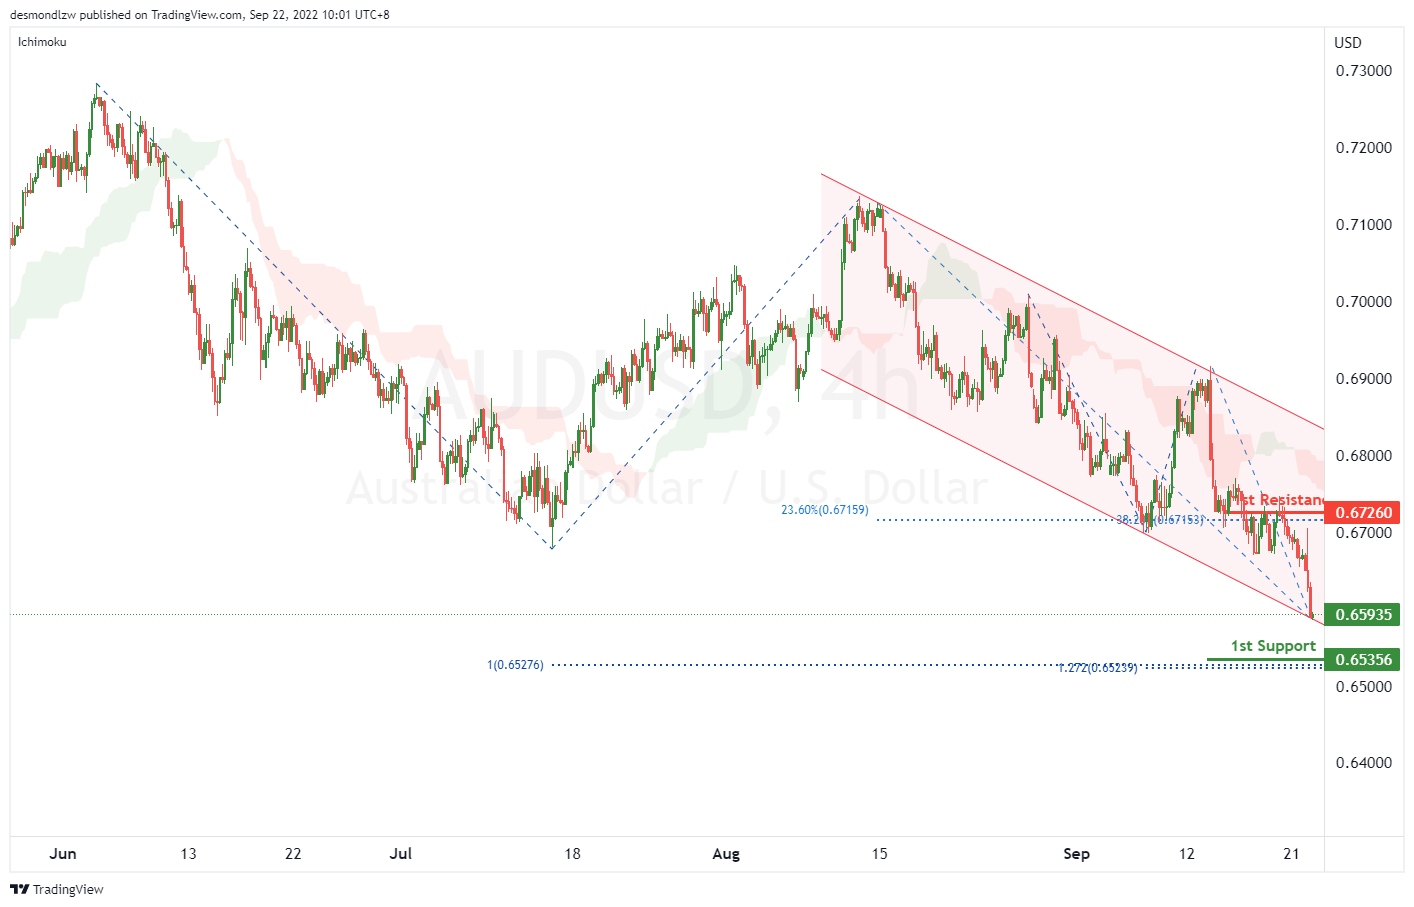
AUD/USD:
On the H4, with the price moving within the descending channel and below ichimoku cloud, if the price can break the descending channel successfully, we could have a bearish bias that the price may drop to the 1st support at 0.65356, which is in line with the 127.2% fibonacci extension and 100% fibonacci projections. Alternatively, the price may bounce off from the lower bond of the descending channel and rise to the 1st resistance at 0.67260, where the 23.6% fibonacci retracement and 38.2% fibonacci retracement are.
Areas of consideration
- H4, current price
- H4, 1st support at 0.65356
NZD/USD:
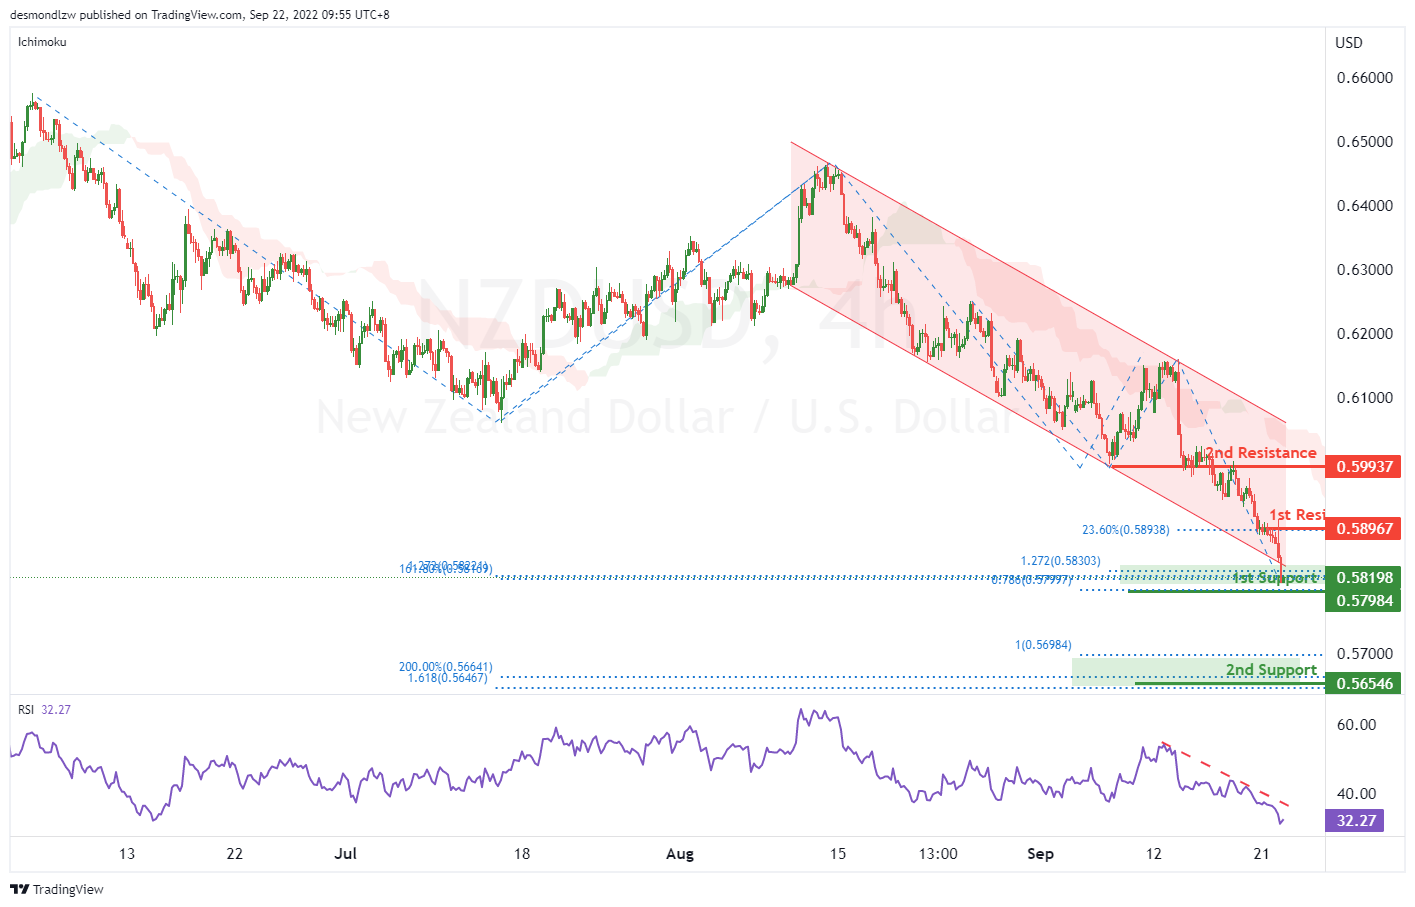
On the H4, with the price moving within the descending channel, below ichimoku cloud, RSI is showing a descending trendline. If the price can break the 1st support at 0.57984, which is in line with the 78.6% fibonacci projection, 161.8% fibonacci extension, 127.2% fibonacci extensions successfully, we can expect the price drop to the 2nd support at 0.56546, which is in line with the 200% fibonacci extension and 161.8% fibonacci extension. Alternatively, the price may pull back to the 1st resistance at 0.58967, where the 23.6% fibonacci retracement is, if the 1st resistance is broken, the 2nd resistance could be at 2nd resistance at 0.59937, which is in line with the overlap resistance.
Areas of consideration:
- H4 time frame, 1st support at 0.57984
- H4 time frame, 2nd support at 0.565646
USD/CAD:
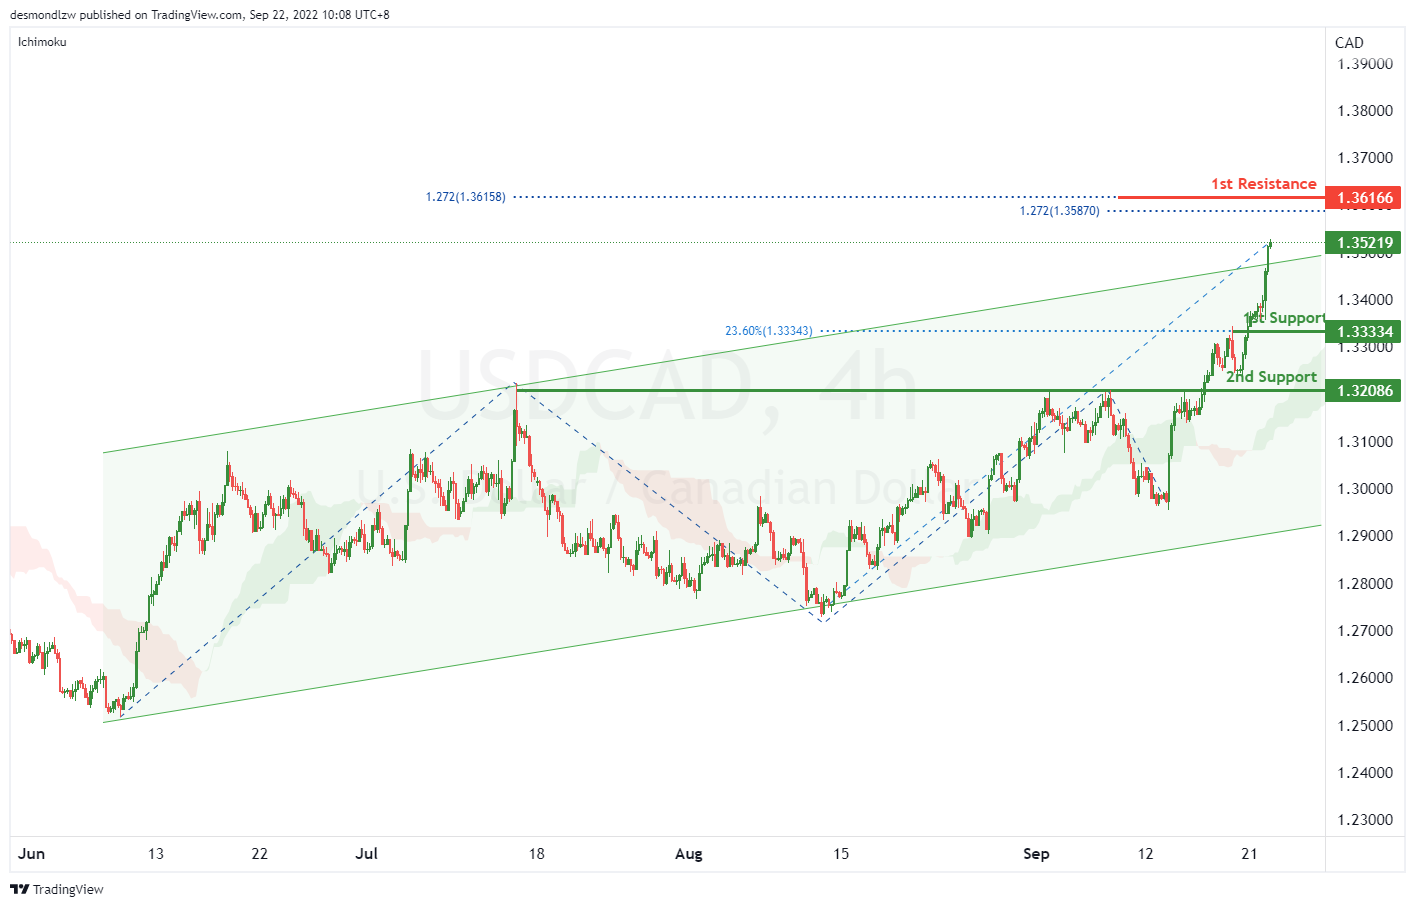
On the H4, with the price breaking the ascending channel and above ichimoku cloud, we have a bullish bias that the price may rise to the 1st resistance at 1.36166, where the 127.2% fibonacci extensions are. Alternatively, the price may pull back and drop to the 1st support at 1.33334, which is in line with the 23.6% fibonacci retracement. If the 1st support is broken, the 2nd support could be at 1.32086, which is in line with the overlap support.
Areas of consideration:
- H4 time frame, current price
- H4 time frame, 1st resistance at 1.36166
OIL:
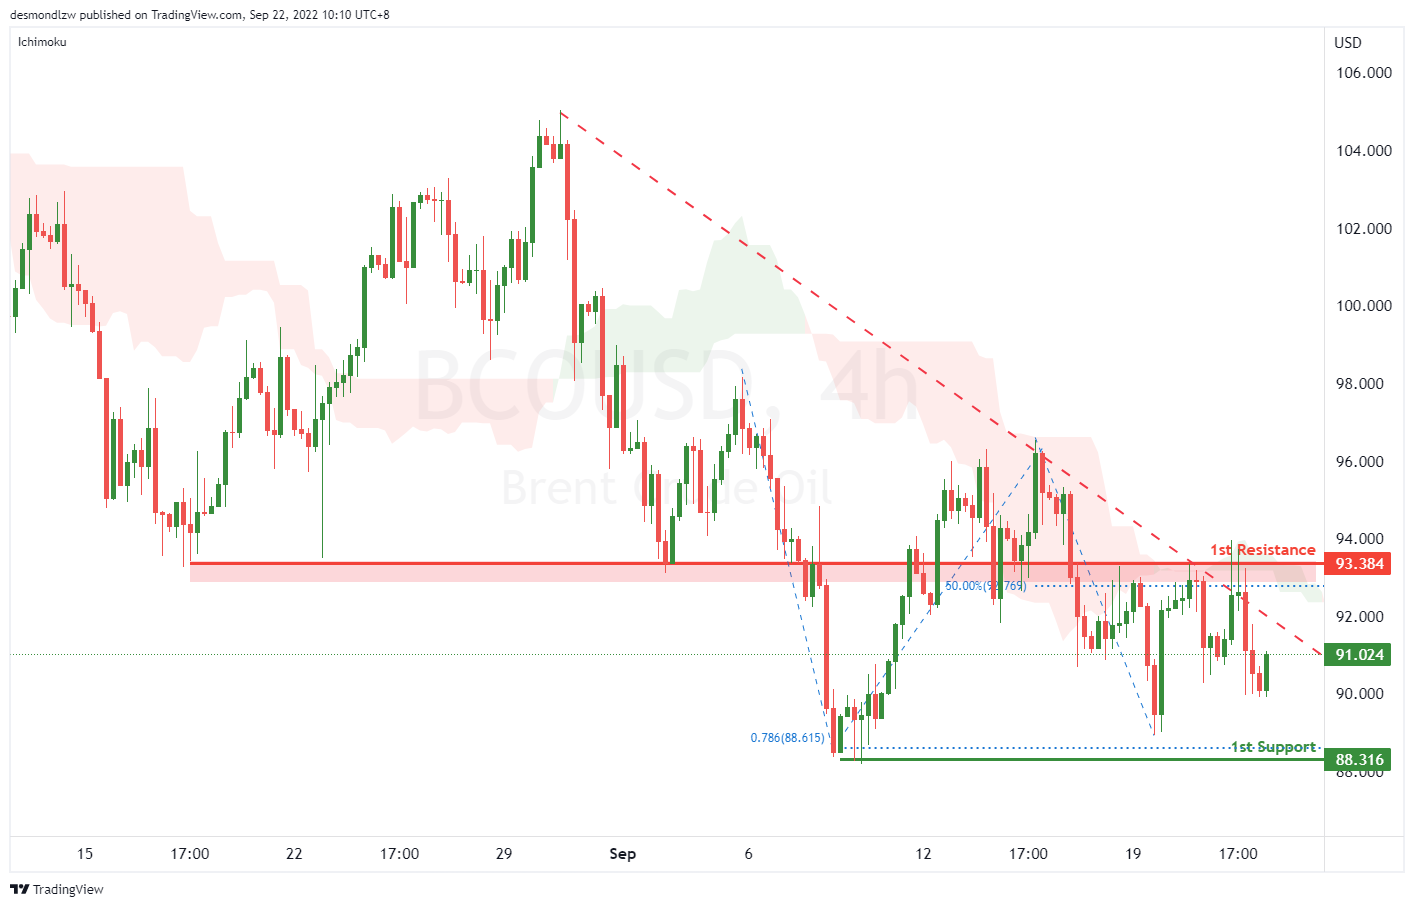
On the H4, with the price moving within the descending trendline and below ichimoku cloud, we have a bearish bias that the price may drop to the 1st support at 88.316, where the 78.6% fibonacci projection and swing low are. Alternatively, the price may pull back and rise to test the 1st resistance at 93.384, which is in line with the 50% fibonacci retracement and overlap resistance
Areas of consideration:
- H4 time frame, 1st resistance at 93.384
- H4 time frame, 1st support at 88.316
Dow Jones Industrial Average:
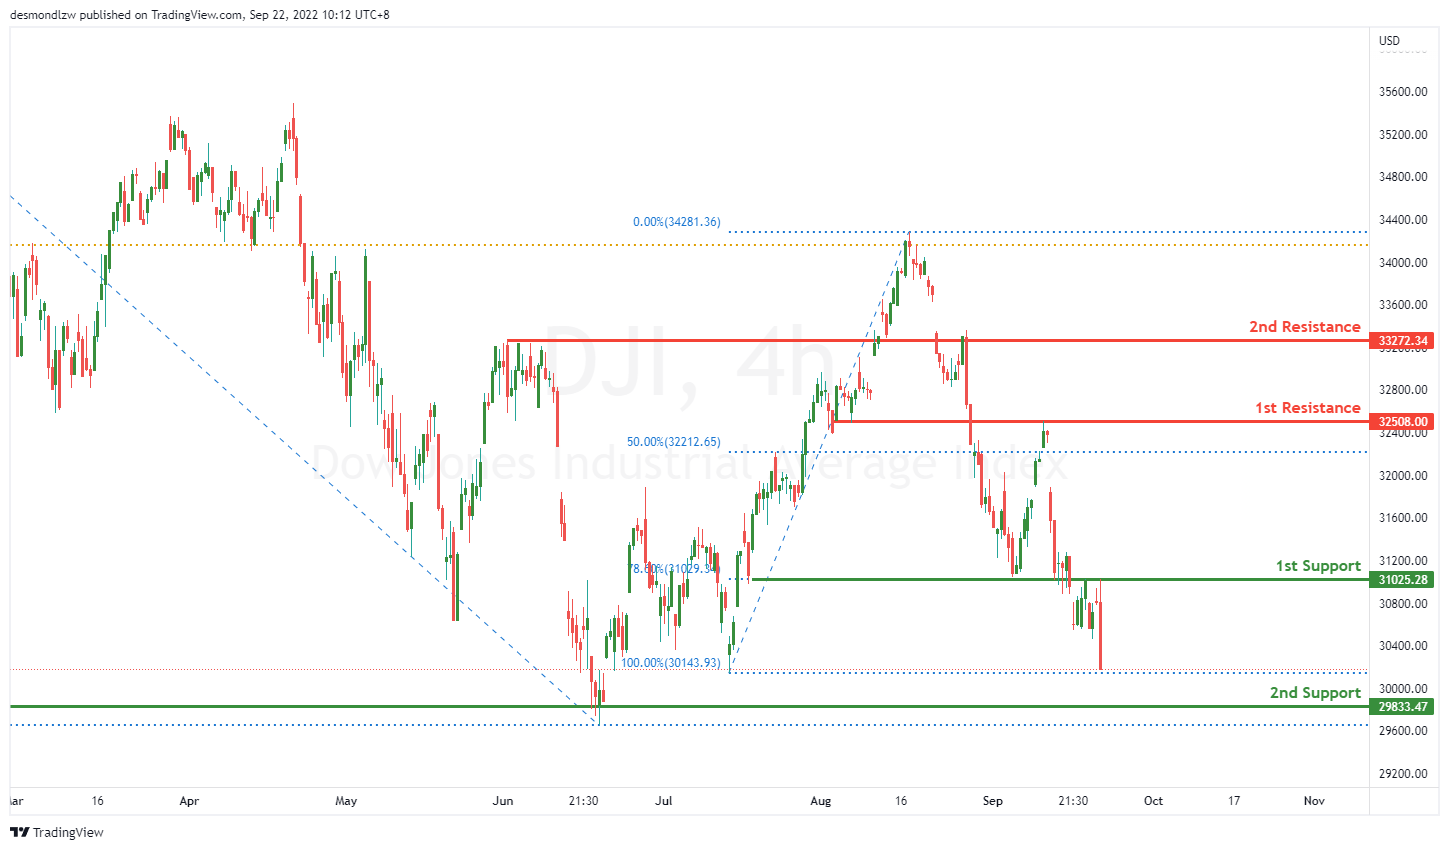
On the H4, price is reflected off nicely at the first resistance at 32500.85 where the 50% Fibonacci retracement is and broke right through the first support at 31029.34 where the 78.6% Fibonacci retracement is. Price might continue heading downwards towards the second support at 29833.47 where the previous swing low is.
Areas of consideration:
- H4 time frame, 1st support at 31029.34
- H4 time frame, 2nd support at 29833.47
DAX:
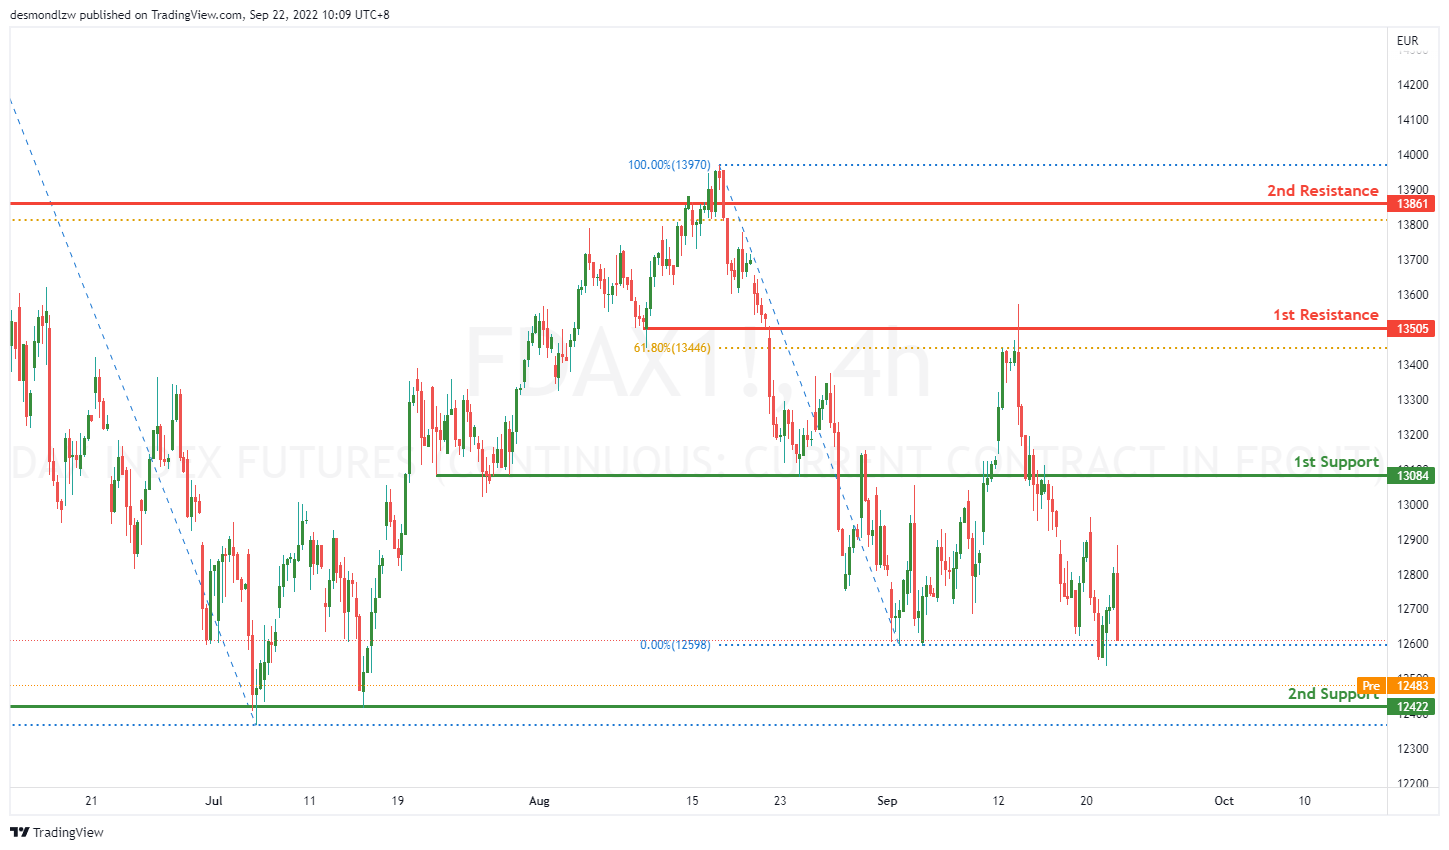
On the H4, price has reflected of the first resistance at 13505 where the 61.8% retracement is and got a big reaction breaking through the first support at 13084. Price might continue going down towards the second support at 12422 where the swing low is.
Areas of consideration:
- H4 time frame, 1st support at 13084
- H4 time frame, 2nd support at 12422
ETHUSD:
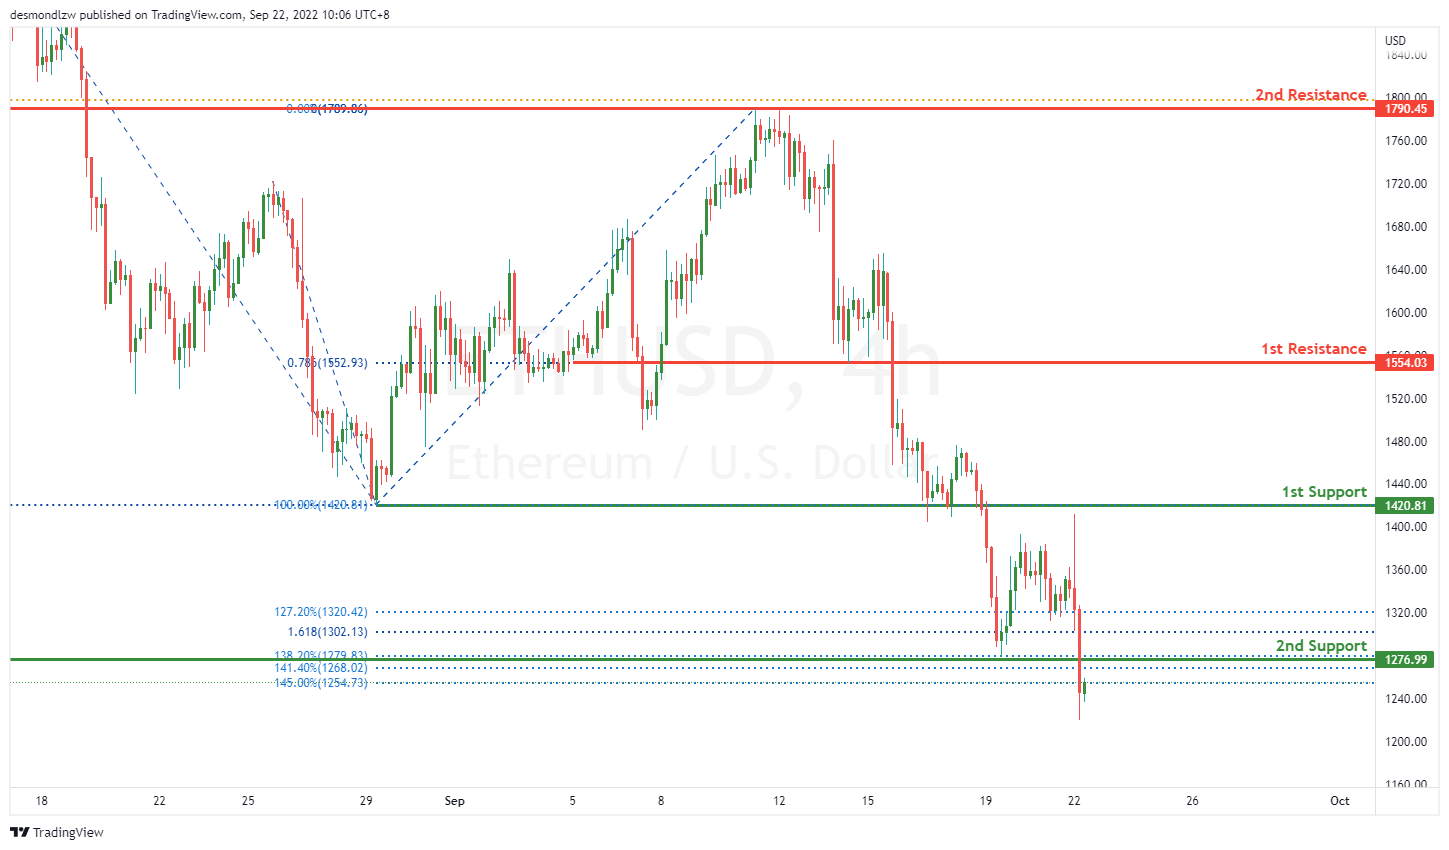
On the H4, price has pushed through the 1st Support at 1554.03 where the previous swing low sat. Price has also pushed through the second support at 1276.99 where the 138.2% Fibonacci extension lies. Price could possible head back up to the second support for retracement and then head lower.
Areas of consideration:
- H4 time frame, 1st resistance of 1554.03
- H4 time frame, 1st support at 1420.81
BTCUSD:
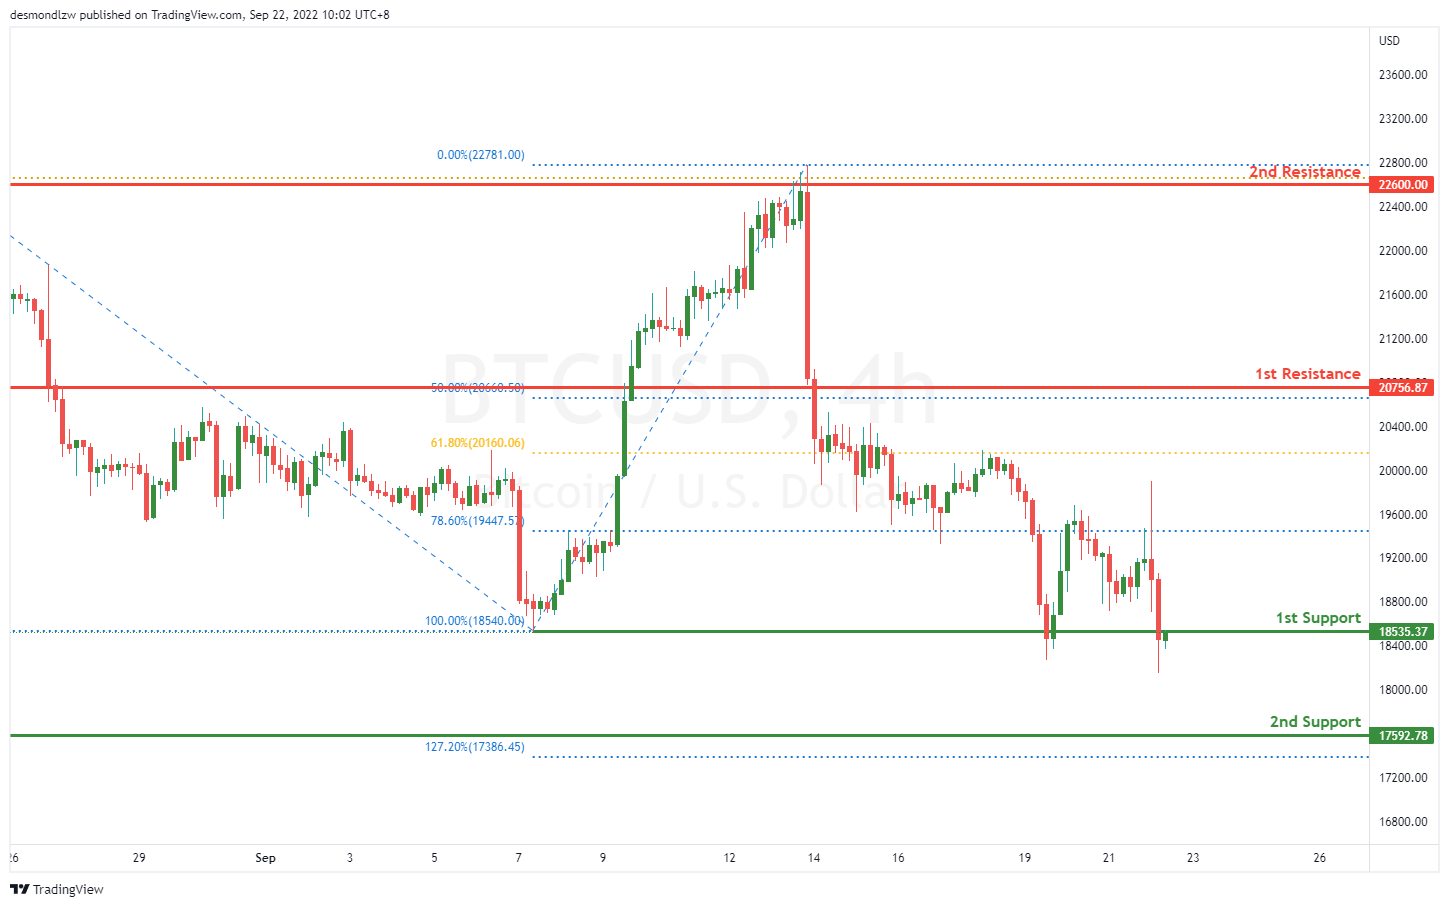
On the H4, price has broke through the first support 18535.37 where the previous swing low sits and reflected back up to 19557.00 where the 78.6% Fibonacci retracement sits. Price then broke back down the first support and closed nicely below it. Price could possibly head down to the second support area where the 127.2% Fibonacci extension is.
Areas of consideration:
- H4 time frame, 1st resistance of 22600.00
- H4 time frame, 1st support at 18535.37
S&P 500:
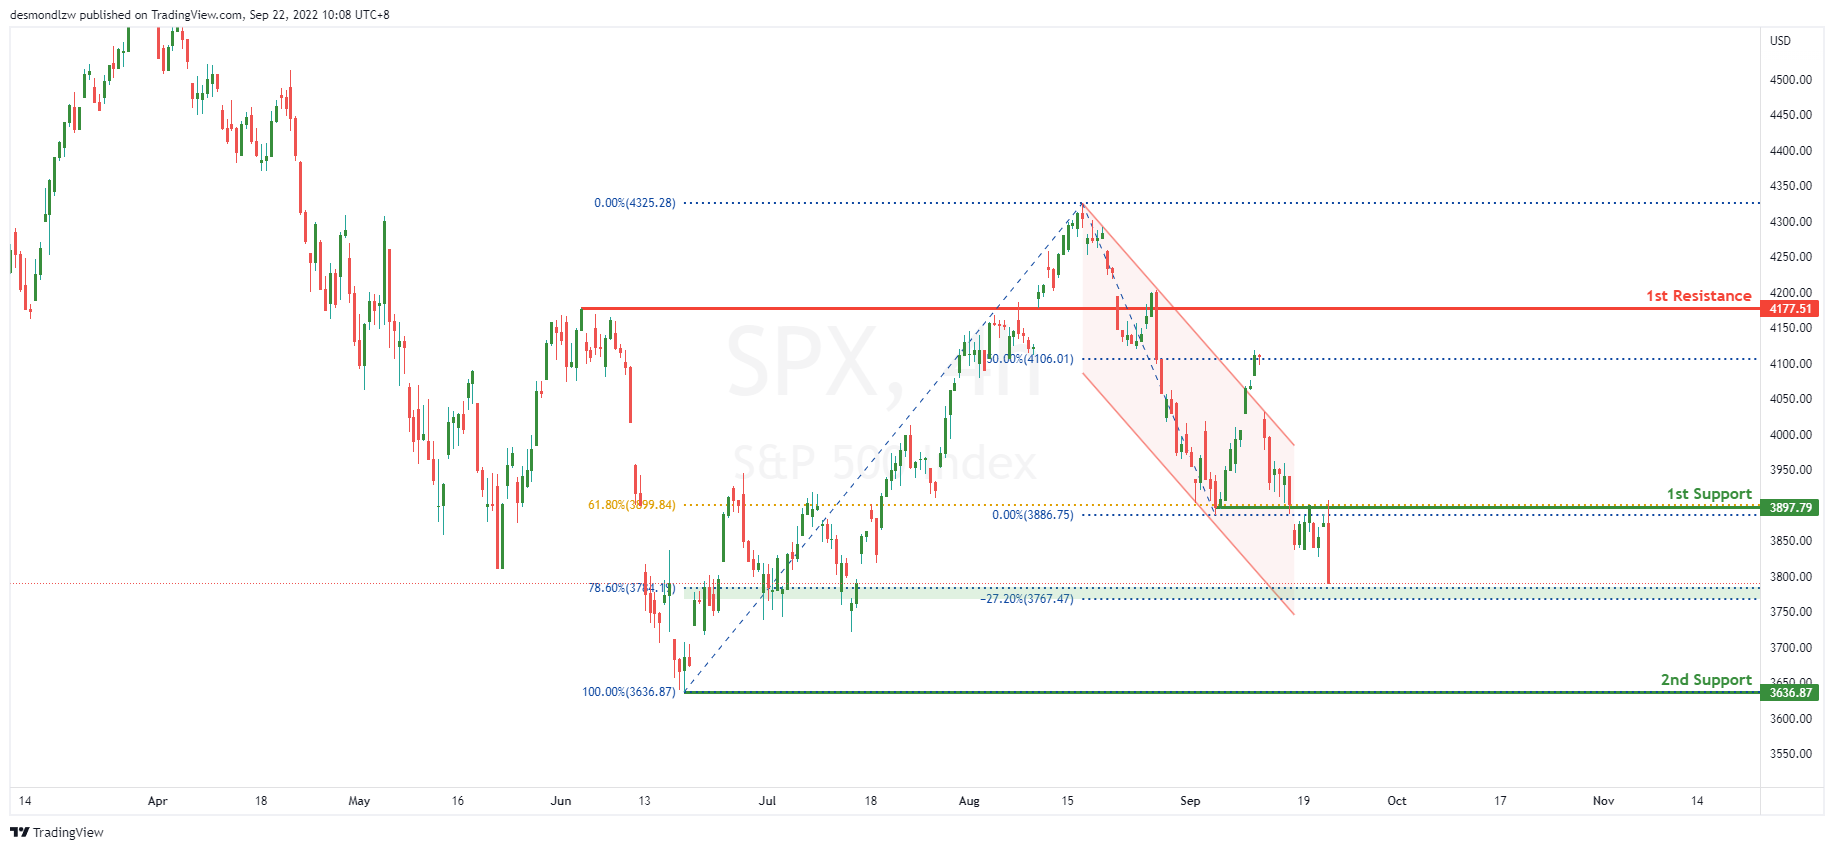
On the H4, the price reversed from the 4100 price area forming a bearish channel, with the price falling towards the 1st support are of 3900. With our bearish bias still valid, as price trades back towards the 61.8% Fibonacci retracement, look for price to test the 1st support area. Price has broken below the 1st support level, the price could fall towards the 78.6% Fibonacci retracement level of 3784.19. As the price falls towards the 2nd support, it could find some pullback towards the 78.6% Fibonacci retracement pullback support area.
Areas of consideration:
- H4 time frame, 1st support at 3900
- H4 time frame, 2nd support at 3636.87
USD/CAD Climbs Higher, Fed Hiked Rates To 3.25%
Key Highlights
- USD/CAD gained pace and traded above the 1.3450 resistance.
- A key bullish trend line is forming with support near 1.3340 on the 4-hours chart.
- EUR/USD and GBP/USD extended losses below key support zones.
- The Fed hiked interest rates from 2.5% to 3.25%.
USD/CAD Technical Analysis
The US Dollar started a major increase above the 1.3200 zone against the Canadian Dollar. USD/CAD broke the 1.3400 resistance to move further into a positive zone.
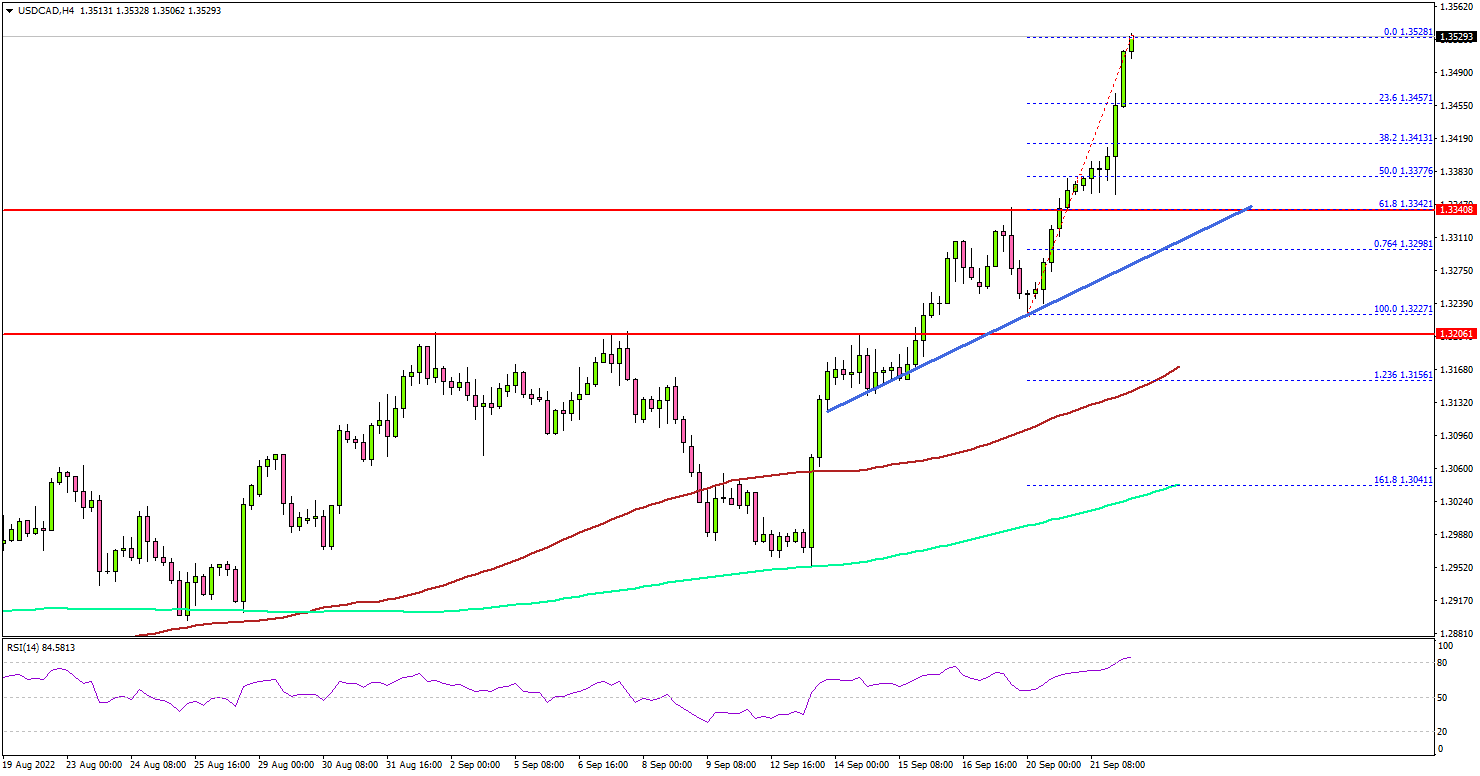
Looking at the 4-hours chart, the pair settled above the 1.3300 zone, the 100 simple moving average (red, 4-hours), and the 200 simple moving average (green, 4-hours). The upward move was such that the pair even cleared the 1.3450 resistance zone.
It tested the 1.3525 level and remains well supported for more gains. On the upside, an initial resistance sits near the 1.3550 zone.
The first major resistance is near the 1.3600. A clear move above the 1.3600 level could open the doors for a test of 1.3700. Any more gains might send the pair towards the 1.3880 level.
On the downside, an initial support is near the 1.3425 level. There is also a key bullish trend line forming with support near 1.3340 on the same chart.
A downside break below the trend line support might send the pair towards the 1.3315 level. The next major support is near the 1.3280 level, below which the pair could even test the 1.3220 level in the coming days.
Looking at EUR/USD, there was a fresh decline below the 0.9900 support zone. Besides, GBP/USD traded to a new multi-year low and broke the 1.1340 support.
Economic Releases
- BoE Interest Rate Decision - Forecast 2.25%, versus 1.75% previous.
- US Initial Jobless Claims - Forecast 210K, versus 213K previous.
Elliott Wave View: Nasdaq (NQ) Further Downside Expected
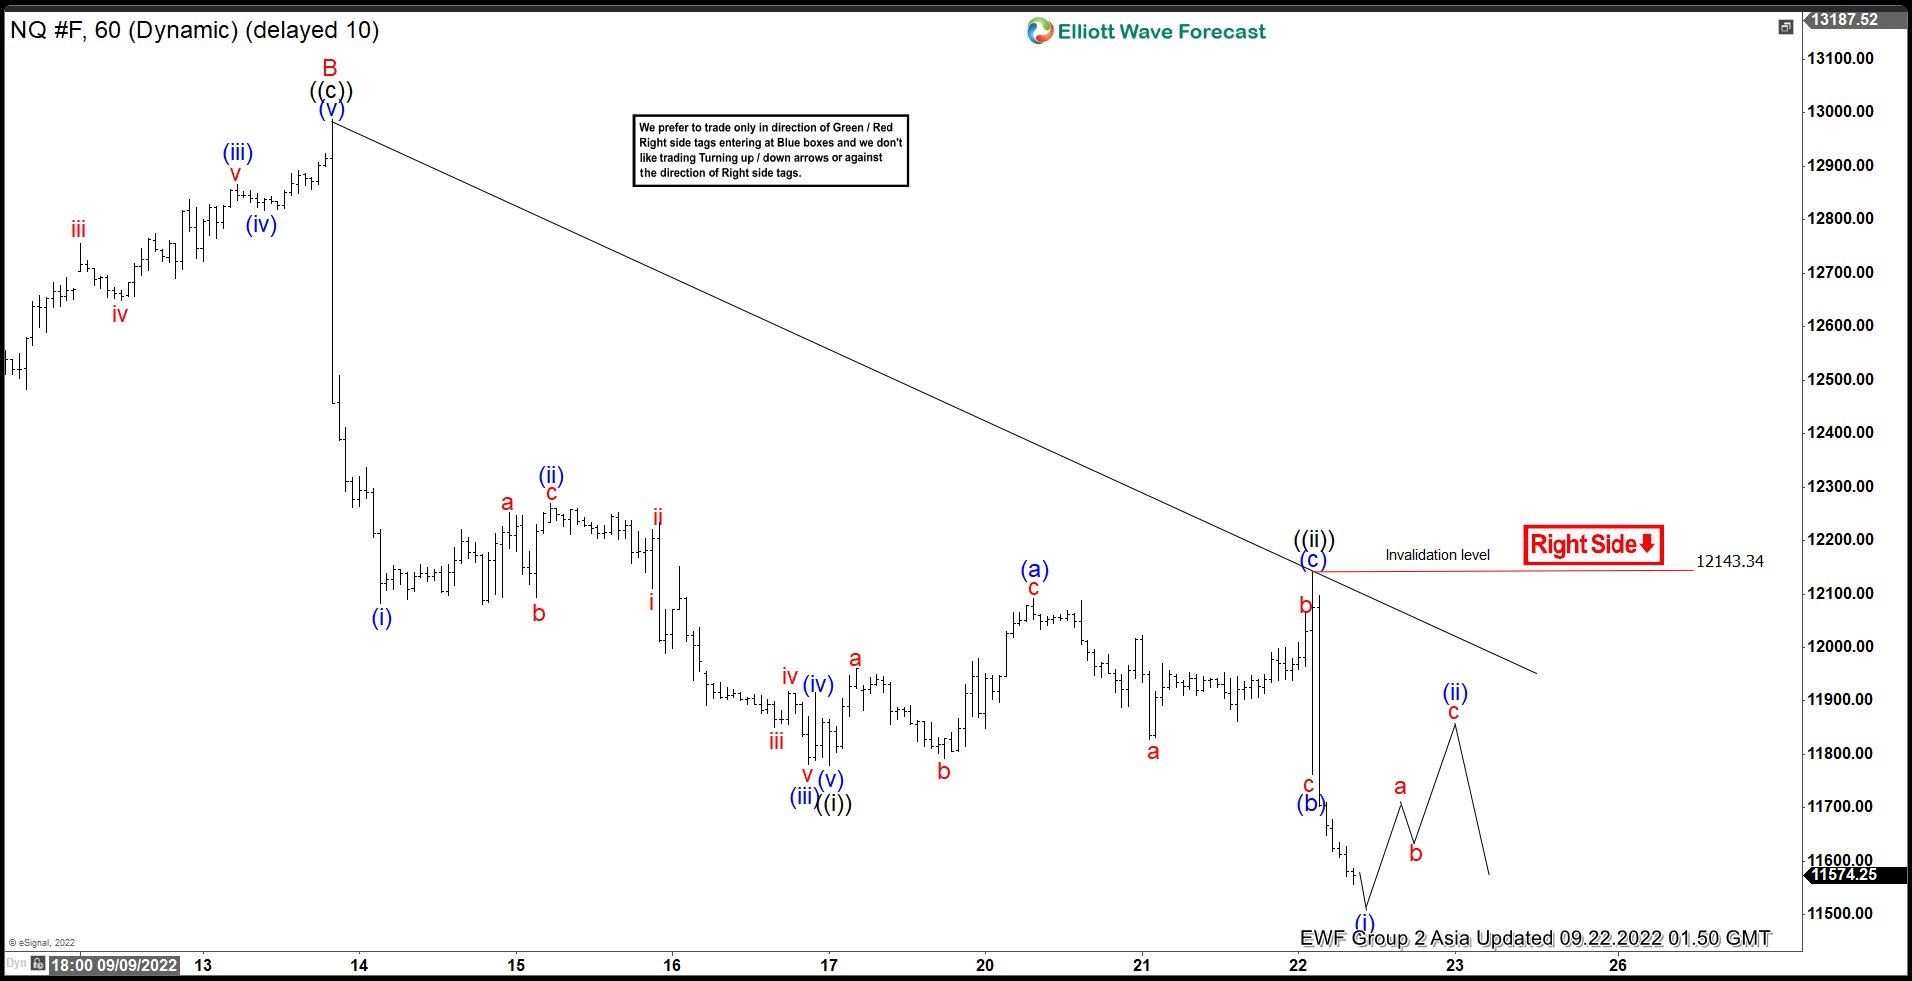
Short term Elliott Wave view on Nasdaq (NQ) suggests the decline from 8.17.2022 high is unfolding as a zigzag Elliott Wave structure. Down from 8.17 high, wave A ended at 12017.75. Wave B ended at 12986.74 with internal subdivision as an expanded flat. Up from wave A, wave ((a)) ended at 12461.50 and dips in wave ((b)) ended at 11921.50. Wave ((c)) higher ended at 12986.74 which also completed wave B.
Index has turned lower in wave C with internal subdivision as a 5 waves impulse. Down from wave B, wave ((i)) ended at 11778.50 and rally in wave ((ii)) ended at 12143.34. Internal subdivision of wave ((ii)) unfolded as an expanded flat. Up from wave ((i)), wave (a) ended at 12092.50, wave (b) ended at 11763.25, and wave (c) ended at 12143.34. This completed wave ((ii)) of C. Index has resumed lower in wave ((iii)). Near term, expect wave (i) of ((iii)) to end soon. Index should then rally in wave (ii) to correct cycle from 9.22.2022 high (12143.34) before it resumes lower. As far as pivot at 12143.34 stays intact, expect rally to fail in 3, 7, or 11 swing for further downside. Potential target lower is 100% – 161.8% Fibonacci extension of wave ((i)) which comes at 10195 – 10938.
Nasdaq 60 Minutes Elliott Wave Chart
The Fed Fights On
Summary
The FOMC further stepped up its inflation-fighting game in September. The Committee hiked the fed funds target range by 75 bps, as was widely expected, but delivered a more hawkish projected path for short-term rates through this year and next. The median FOMC participant now expects the fed funds rate to rise an additional 125 bps in the two remaining meetings of this year. The FOMC sees rates staying high through next year, with the median estimate for the fed funds rate ending 2023 at 4.6%.
The stricter policy stance expected by the FOMC comes as the Committee sees above target inflation as becoming increasingly entrenched. FOMC members now expect core PCE to remain above 3% through next year and above 2% all the way through 2025. The good news is that policymakers expect inflation to steadily slow over the next few years, but higher rates are also expected to inflict greater pain on the economy. Estimates for real GDP growth next year were revised lower and, with a median of 1.2%, are more clearly below the economy's potential growth rate. More telling, however, was the upward adjustment to unemployment rate projections in 2023. The median estimate among participants rose to 4.4%, which would be nearly a percentage point above the low of the current cycle. All told, the Committee appears to be inching toward our own view that it will take a mild recession to get inflation firmly back to the 2% target.
A Hawkish 75
In an effort to rein in decades-high inflation, the Federal Open Market Committee (FOMC) delivered another massive 75 bps increase in the federal funds rate at the conclusion of its September meeting today. The move brings the fed funds target range to 3.00-3.25%, the highest level in 15 years. In addition, the FOMC reaffirmed its plan to up the pace of balance sheet reduction this month. From September onward, the Fed will allow up to $60 billion of Treasury securities and $35 billion of mortgage-backed securities to roll off its balance sheet, which is double the June-August pace and significantly faster than the pace of quantitative tightening in 2017-2019.
The aggressive move to combat inflation was widely expected. Chair Powell delivered a clear and concise message that inflation is the FOMC's "overarching focus" right now and that the Committee will do what is necessary to restore price stability, a sentiment that has been echoed by one FOMC member after another. In today's statement the Committee reiterated that it is "strongly committed to returning inflation to its 2% objective" and "highly attentive to inflation risks".
How much more the FOMC believes it will need to tighten to achieve that objective became clearer with an update to the Summary of Economic Projections (SEP). The median participant's expectation of where the fed funds rate would end this year rose to 4.4%, implying about an additional 125 bps of tightening in the two remaining meetings of the year (Figure 1). Not only was that more hawkish than in June (when the median expectation for the fed funds rate for year-end registered 3.4%), but it was more aggressive than both pre-meeting market pricing as well as our own most recent forecast. In addition to a faster pace of tightening in the near term, most FOMC participants saw the federal funds rate staying high through 2023 and 2024. The median year-end estimates for the federal funds rate in 2023 and 2024 were 4.6% and 3.9%, respectively. Only in 2025 does the FOMC expect the fed funds rate to be back to a level that is more in line with its "longer-run" estimate of 2.5% for short-term interest rates.
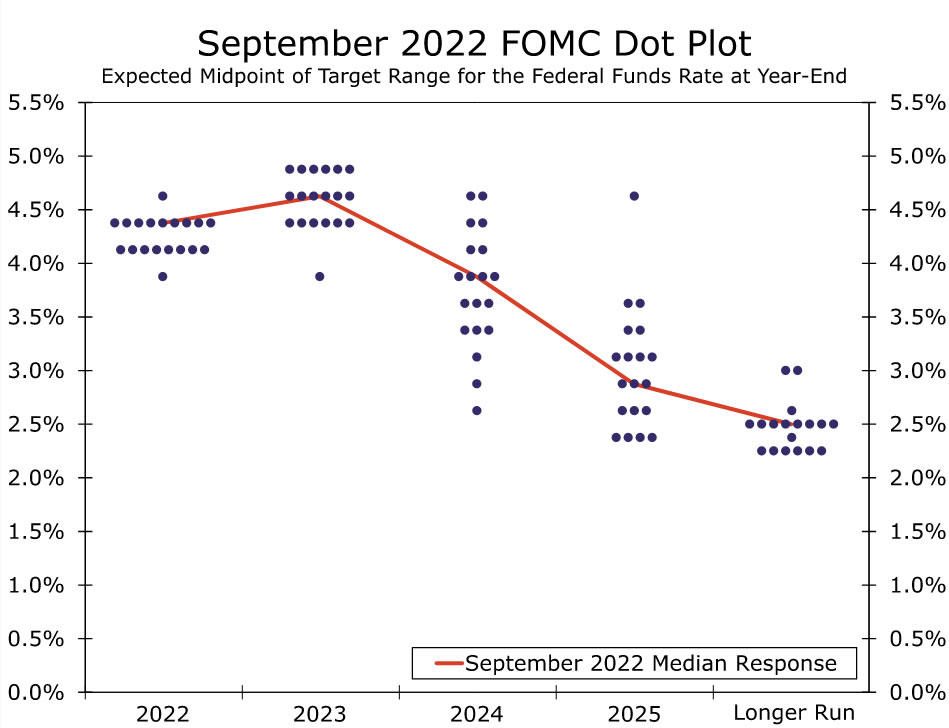
Interestingly, there appeared to be a significant amount of agreement among FOMC participants on how tight monetary policy will need to be in 2023. All but one participant saw the federal funds rate finishing 2023 between 4.4% and 4.9%. However, the 2024 dots exhibit a significantly wider range of outcomes, with the lowest projection for the fed funds rate (2.625%) 200 bps below the highest projection (4.625%).
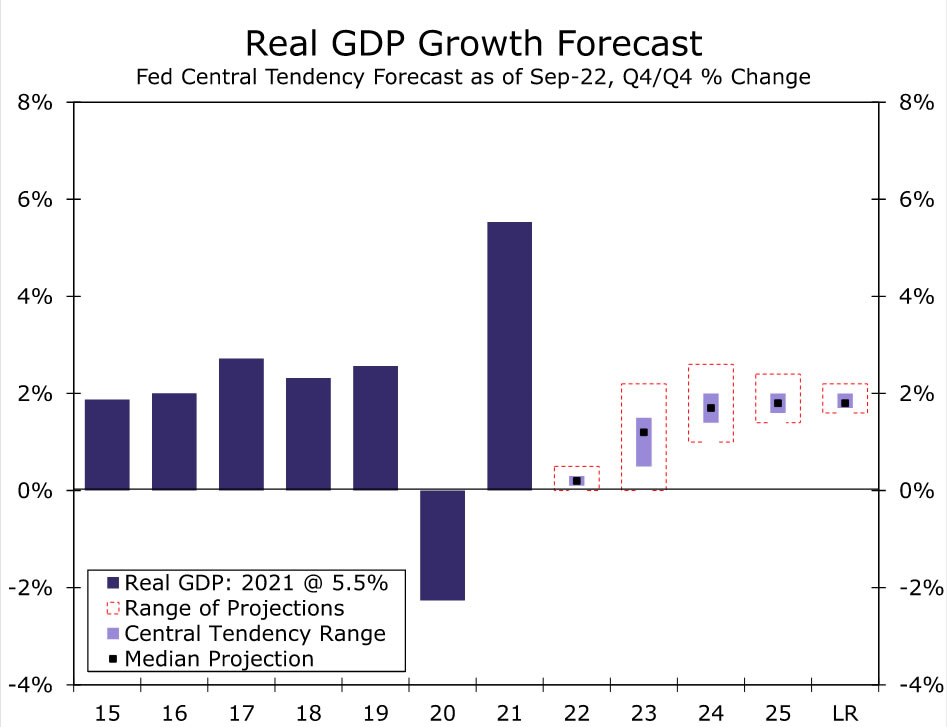
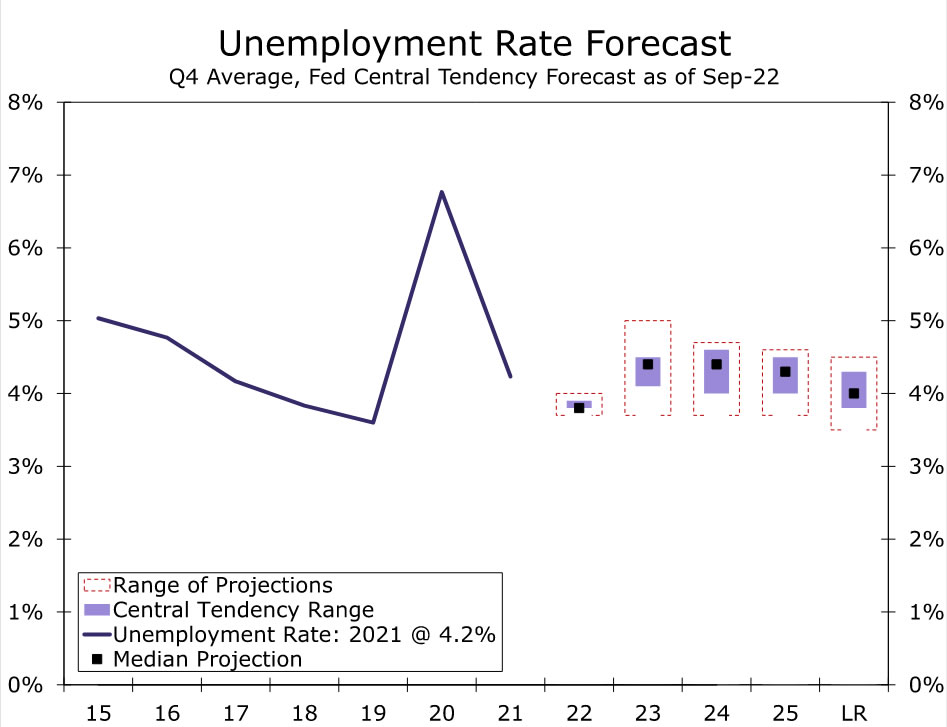
The FOMC's economic projections make clear that this restrictive stance of monetary policy will not be costless. The median participant looks for real GDP growth of just 0.2% this year and 1.2% next year (Figure 2). Unemployment is also anticipated to climb more significantly next year; the median unemployment rate estimate among participants rose to 4.4% from 3.9% in the June SEP (Figure 3). Such an outcome could still be construed as a "soft-ish" landing for the economy, but the Committee appears to be inching toward our own view that it will take a mild recession to get inflation firmly back to the 2% target.
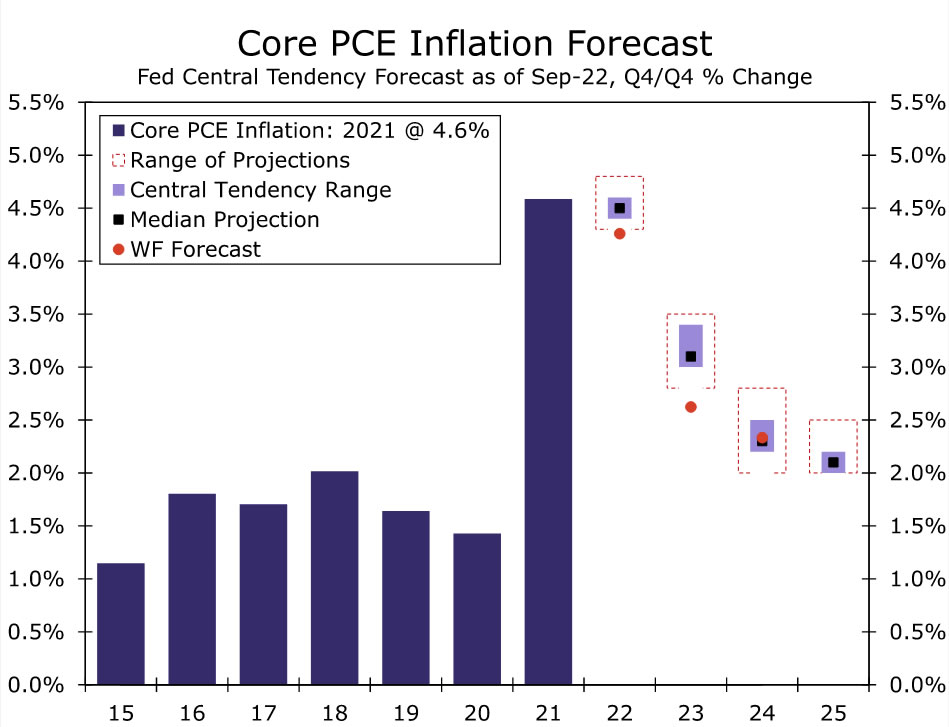
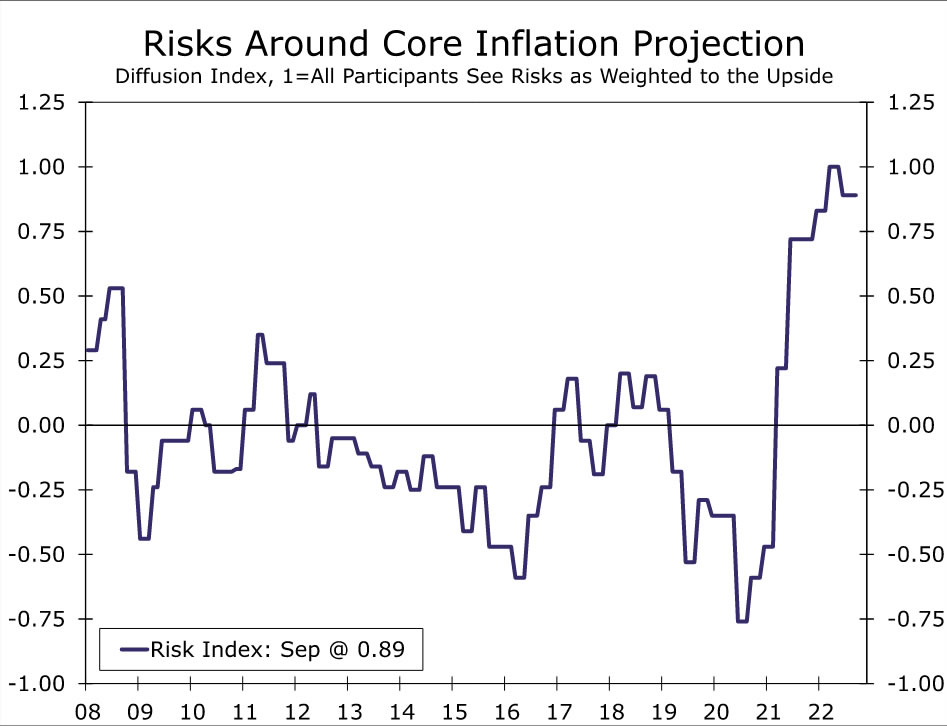
Clearly by the FOMC's reckoning, inflation is becoming more entrenched. Officials bumped up estimates for core PCE inflation in the fourth quarter of this year, with the median projection rising to 4.5% from 4.3% in June. And despite expectations for a materially higher fed funds rate and slower growth in the year ahead, the median estimate for core PCE at the end of 2023 was raised to 3.1% from 2.7% in the prior SEP. Even with the upward revisions to inflation estimates, all but two of the 19 officials are wary that risks to the inflation outlook remain tilted to the upside, suggesting the Fed is far from giving up its hawkish bent. Through 2025, the majority of FOMC participants do not see core PCE returning all the way back to 2.0%.
Another 75 bps Rate Hike on the Table in November
At the start of the year, the Federal Reserve was still easing monetary policy via purchases of Treasury securities and mortgage-backed securities. Just nine months later, the median FOMC participant expects the federal funds rate to finish the year 4.4%, a rate not seen since 2007. In his speech at Jackson Hole, Chair Powell made clear that the ongoing fight against inflation will not be won easily, and today's FOMC meeting reinforces that policymakers are prepared for restrictive policy well beyond 2022. At some point, the FOMC will feel comfortable enough to slow the pace of tightening from 75 bps per meeting to 50 bps or 25 bps. We expected a downshift to 50 bps at the November FOMC meeting, but with today's dot plot in hand and just one CPI report between now and the November meeting, another 75 bps rate hike is squarely on the table. The balance of risks are clearly tilted to the upside for our current forecast of a peak fed funds rate of 4.00%-4.25%.
FOMC Hikes Policy Rate by 75 Basis Points, Signals Many More to Come
The Federal Reserve Open Market Committee (FOMC) lifted the federal funds rate to the 3.0% to 3.25% range and reaffirmed a continuation of its balance sheet runoff.
The Fed updated its language stating that "recent indicators point to modest growth in spending and production. Job gains have been robust in recent months, and the unemployment rate has remained low. Inflation remains elevated, reflecting supply and demand imbalances related to the pandemic, higher food and energy prices, and broader price pressures."
The Fed's Summary of Economic Projections was updated from June:
- The median projection for real GDP growth was downgraded in 2022 (0.2% from 1.7%). The forecast for 2023, 2024, 2025 and the longer run came in at 1.2%, 1.7%, 1.8%, and 1.8, respectively.
- The median unemployment rate forecast was 3.8% (3.7%) for 2022, 4.4% (3.9%) for 2023, 4.4% (4.1%) in 2024, and 4.3% in 2025. The longer-run estimate of the unemployment rate stayed the same at 4.0%.
- On inflation, the median estimate for core PCE was assumed to be 4.5% in 2022, 3.1% in 2023, 2.3% in 2024, and 2.1% in 2025.
- The median projection for the fed funds rate was lifted to 4.4% in 2022, 4.6% in 2023, 3.9% in 2024, and 2.9% in 2025. The long-run neutral rate was assumed to be 2.5%.
All of the members of the FOMC voted in favor of the decision.
Key Implications
Another Fed meeting, another 75 basis point hike. Even though headline inflation has shown signs of peaking, underlying measures of core inflation have yet to turn decisively enough for the Fed to slow the pace of rate hikes. With Fed members now expecting that core inflation will remain above 3% through 2023, they have signaled even more hikes are on deck over the next few months and into 2023. This has Treasury yields rising, with the U.S. 2-year yield now having well eclipsed 4%.
Today's statement echoes the hawkishness from Chair Powell's Jackson Hole speech, where he highlighted that the Fed wasn't going to back down from the inflation fight "until the job is done." This implies a willingness to bring rates into restrictive territory in order to break the current inflation cycle even if it means making a considerable sacrifice to economic growth. It is for this reason that we have recently downgraded our forecast for U.S. GDP growth over the remainder of this year and next as the economy struggles to adjust to the weight of rising rates and stubbornly high inflation.
EUR/USD downside breakout after Fed rate hike
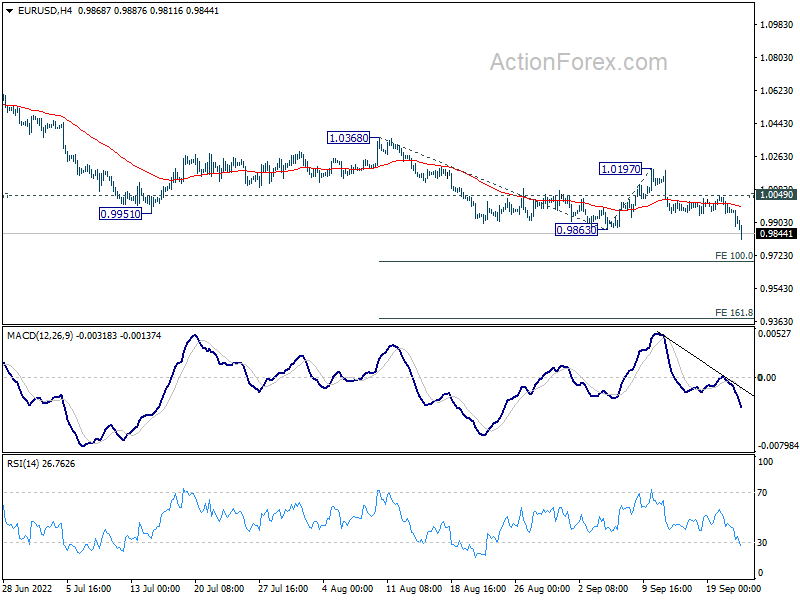
EUR/USD finally breaks out to the downside after Fed hikes 75bps and projects interest rate to hit 4.4% by year end. For the near term, EUR/USD's next target is 100% projection of 1.0368 to 0.9863 from 1.0197 at 0.9692, and then 161.8% projection at 0.9380.
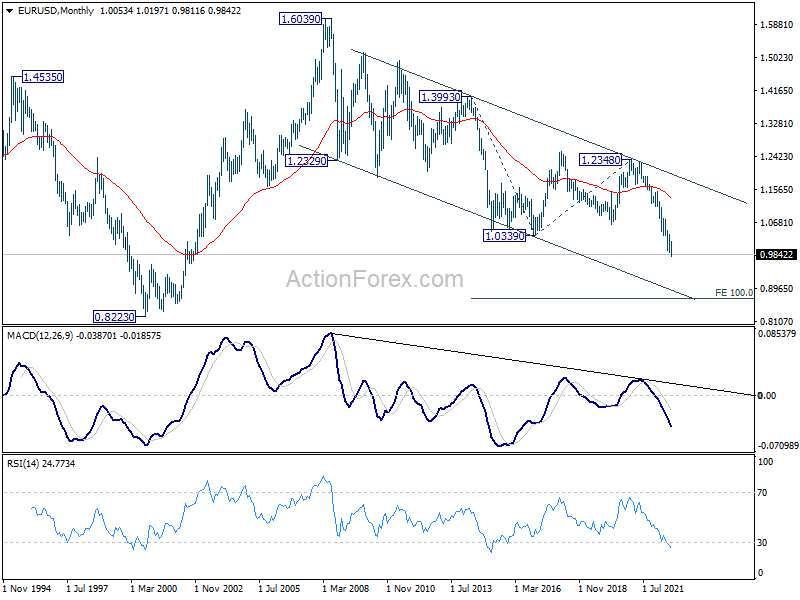
For the medium term, next target is 100% projection of 1.3993 to 1.0339 from 1.2348 at 0.8694.
In any case, break of 1.0049 minor resistance is needed to indicate short term bottoming. Or, outlook will stay bearish even in case of recovery.