Sample Category Title
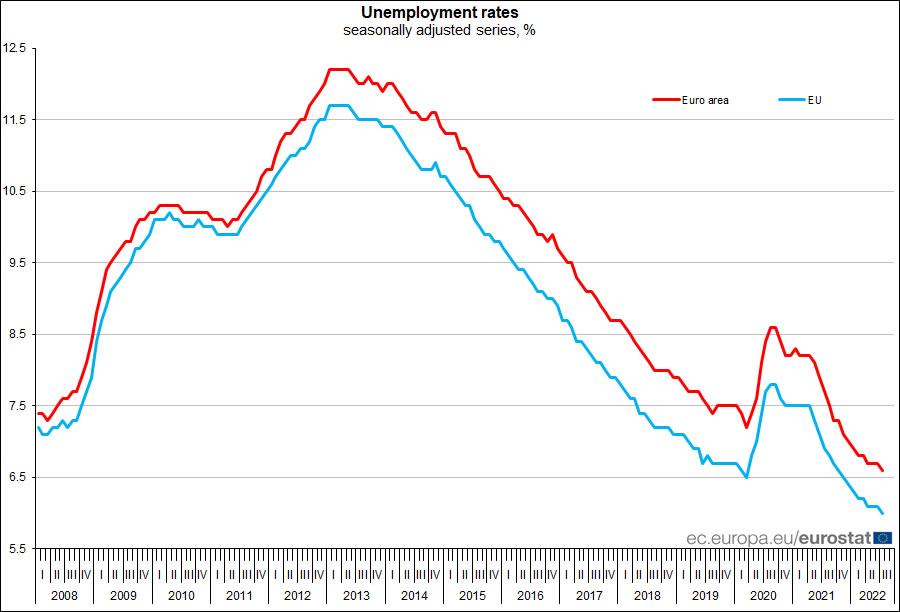
Eurozone unemployment rate dropped to 6.6% in Jul, EU down to 6.0%
Eurozone unemployment dropped from 6.7 to 6.6% in July, matched expectations. EU unemployment dropped from 6.1% to 6.0%.
Eurostat estimates that 12.959 million men and women in the EU, of whom 10.983 million in the euro area, were unemployed in July 2022. Compared with June 2022, the number of persons unemployed decreased by 113 000 in the EU and by 77 000 in the euro area. Compared with July 2021, unemployment decreased by 1.854 million in the EU and by 1.576 million in the euro area.
GBP/USD: Sterling May Retest 2020 Low after 4.5% Drop in August
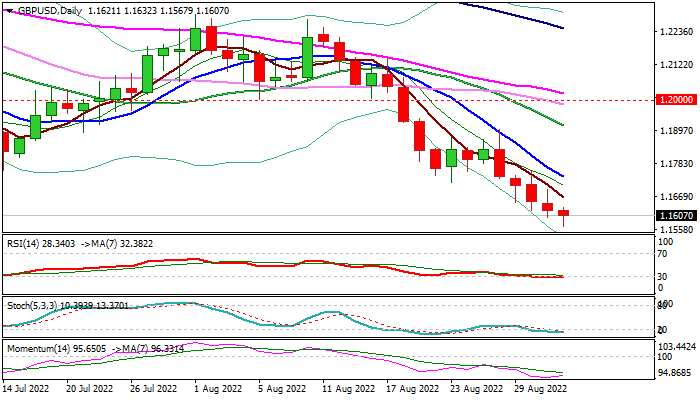
Cable dips below 1.16 handle in early Thursday, hitting the lowest levels in 29 months, pressured by fading risk appetite on darkening economic outlook and strong dollar, driven by expectations for further aggressive stance of the US Federal Reserve.
Near-term action showed a little reaction on slightly better than expected UK housing data and will look for today’s release of US manufacturing PMI data for further signals, while larger picture sees ECB, BOE and Fed policy meetings later this month as key events which could influence pound’s performance.
Sterling was down 4.5% in August, in the biggest monthly loss since June 2016 post-Brexit vote drop and is on track for the third consecutive weekly fall that adds to negative outlook, along with bearish technical studies on all larger timeframes.
Bears eye pandemic low at 1.1410 (Mar 2020), but may face significant headwinds on approach as studies are oversold on daily, weekly and monthly chart.
In current environment, a limited correction would be likely scenario, with upticks to provide better levels to re-join firmly bearish market.
Res: 1.1634; 1.1693; 1.1737; 1.1760.
Sup: 1.1556; 1.1493; 1.1430; 1.1410.
UK PMI manufacturing finalized at 47.3 in Aug, steepest downturn since first lockdown
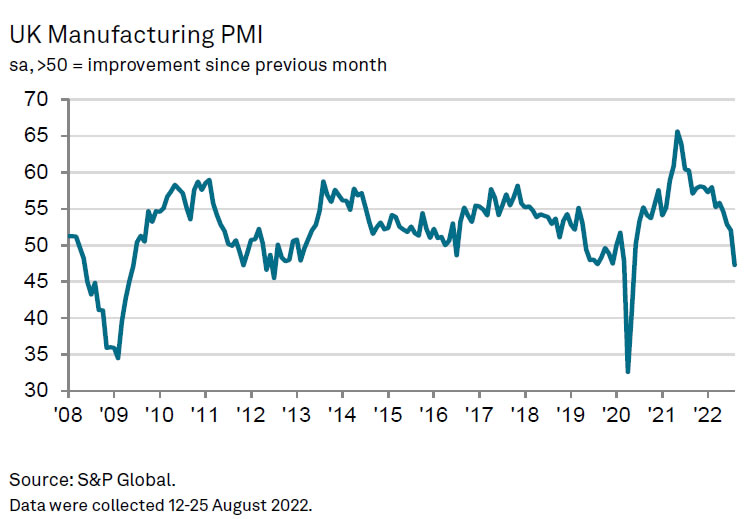
UK PMI Manufacturing was finalized at 47.3 in August, down sharply from July's 52.1. That's also the lowest level in 27 months. S&P Global added that output, new business and new export orders contracted sharply. Still elevated input cost and selling price inflation eased further.
Rob Dobson, Director at S&P Global Market Intelligence, said: "August saw the UK manufacturing sector suffer its steepest downturn since the first COVID-19 lockdown. Output and new orders contracted at the fastest rates since May 2020, as inflows of work from both domestic and export markets slumped sharply lower. There were reports of clients postponing, rescheduling or cancelling agreements due to increased economic uncertainties, recession warnings, rising prices and component shortages, while port congestion and Brexit complications constrained export opportunities."
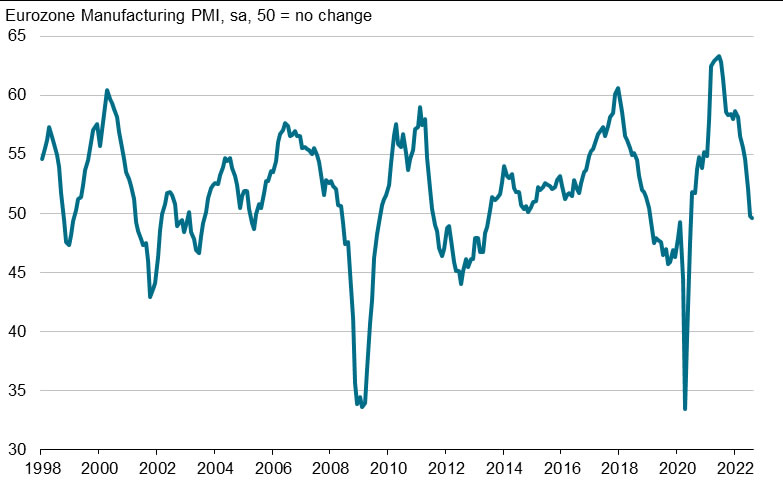
Eurozone PMI manufacturing finalized at 49.6 in Aug, downturn likely to intensify potentially markedly
Eurozone PMI Manufacturing was finalized at 49.6 in August, down slightly from July's 49.8. But that's still a 26-month low. Readings for the Netherlands at 52.6 (22-month low), Ireland at 51.1 (22-month low), France at 50.6 (2-month high) were in expansion. Readings for Spain at 49.9 (2-month high), Germany at 49.1 (26-month low), Austria at 48.8 (20-month low), Greece at 48.8 (20-month low), Italy at 48.0 (26-month low) were in contraction.
Chris Williamson, Chief Business Economist at S&P Global Market Intelligence said: "The euro area's beleaguered manufacturers reported a further steep drop in production in August, meaning output has now fallen for three successive months to add to the likelihood of GDP falling in the third quarter. Forward-looking indicators suggest that the downturn is likely to intensify – potentially markedly – in coming months, meaning recession risks have risen.
USDCHF Rally May Not Be Over Yet
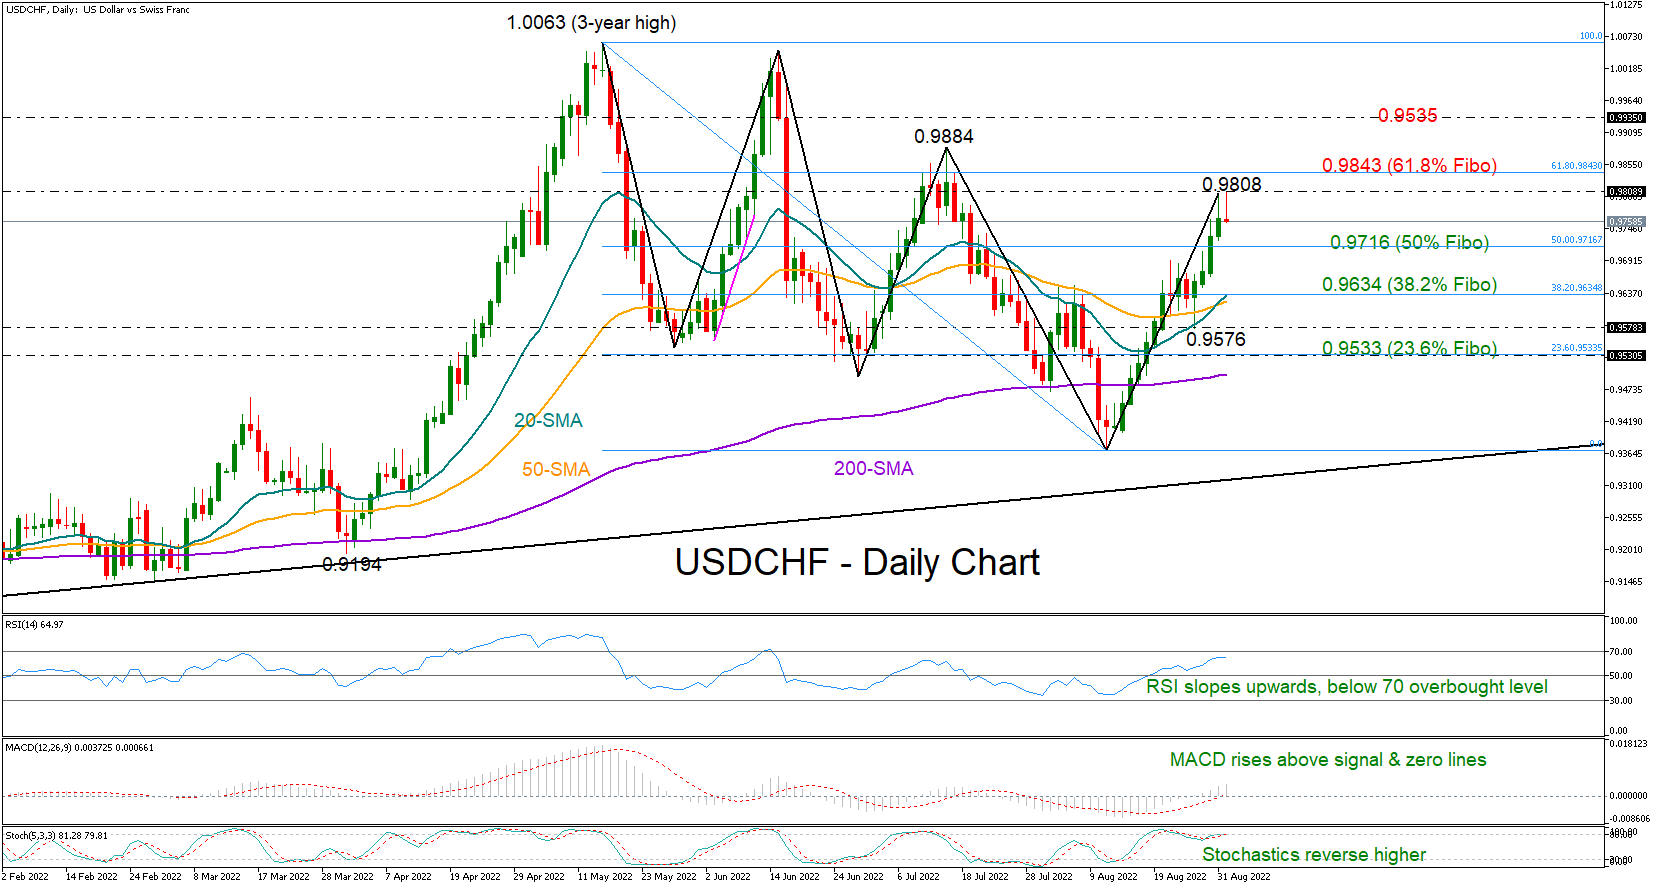
USDCHF was flirting with the 0.9800 level during the early European trading hours, the highest since mid-July as trading for September began ahead of Friday's US nonfarm payroll report.
The pair is set for its third consecutive week of gains, but the downtrend in the medium-term picture is still valid, defended by the clear series of lower highs and lower lows off the three-year high of 1.0063 registered in May. Despite that, the momentum indicators are optimistic that the bulls may still have some fuel in the tank. Specifically, the RSI has yet to touch its 70 overbought mark, while the stochastics look to re-enter the overbought area above 80. The strength in the MACD is backing this view as well.
On the upside, the 0.9800 – 0.9840 zone, which encapsulates the 61.8% Fibonacci of the latest downleg, could be the key for an acceleration towards the 0.9935 handle. Beyond that, buyers will aim for parity, bringing the top of 1.0063 back under scope.
In the bearish scenario, where the rally halts around 0.9800, the 50% Fibonacci of 0.9716 could buffer any selling pressures. If it fails to do so, the decline may stretch towards the 38.2% Fibonacci of 0.9634, while lower, some consolidation may emerge near the swing low of 0.9576 before the 23.6% Fibonacci of 0.9533 appears on the radar.
Summarizing, USDCHF seems to have some room for improvement in the short-term picture, though whether the pair will manage to reverse its medium-term downtrend above July’s peak of 0.9884 remains to be seen.
AUDUSD Dives Near Fresh 6-Week Low
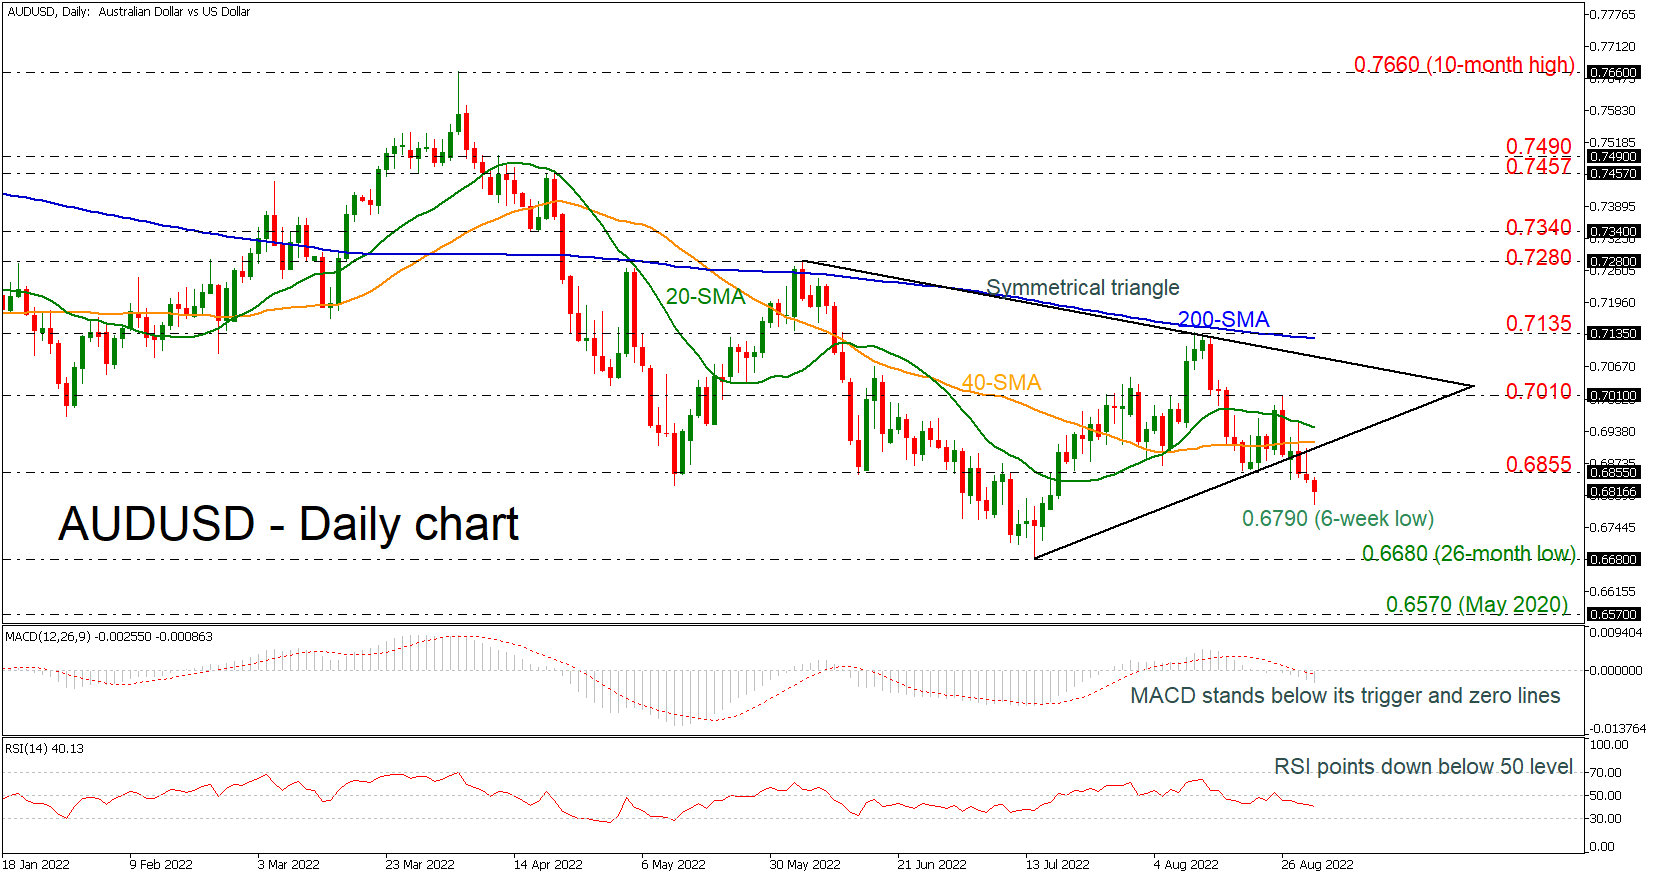
AUDUSD is plunging towards a new six-week low at 0.6790, penetrating the symmetrical triangle to the downside. This break is a sign of more losses in the market, confirmed by the technical indicators as well. The MACD is falling below its trigger and zero lines, while the RSI is sloping downwards in the negative region.
Should weakness extend below the intraday’s low, support to downside movement could initially be detected near the 26-month trough of 0.6680. Clearing that zone, the next stop could be around 0.6570, a tested level in May 2020.
Alternatively, the pair needs to overcome the 0.6855 line to meet a key barrier between the 40- and the 20-day simple moving averages (SMAs) at 0.6915-0.6945. The 0.7010 mark could act as resistance too before a more important battle starts near the 200-day SMA, which overlaps with the 0.7135 barrier.
In the medium-term picture, the sentiment is currently bearish after the price declined below the symmetrical triangle. Otherwise, a jump beyond the 200-day SMA may switch the outlook to positive.
Daily Technical Analysis
EUR/USD
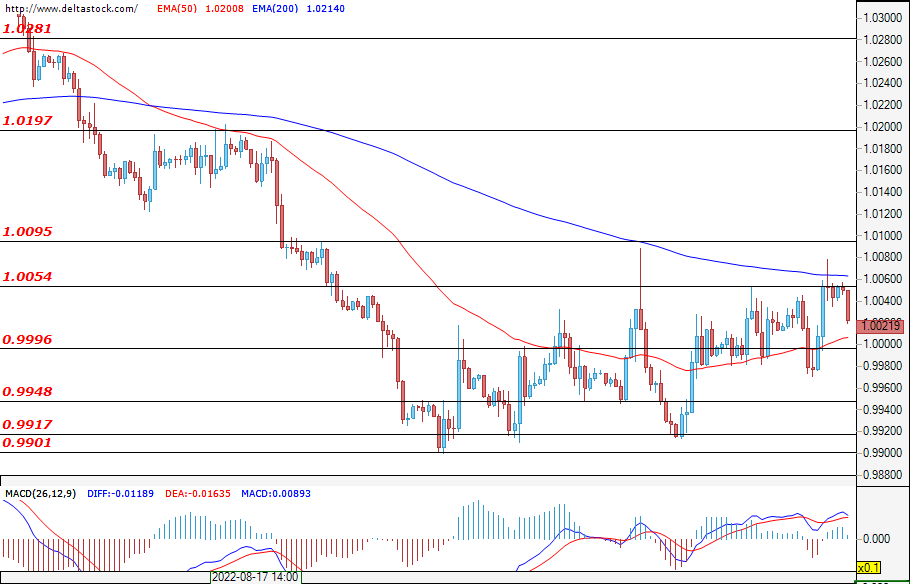
The bears ramped up the pressure with the start of the session of the single European currency.. The bulls failed to confirm their breacht of the resistance at 1.0054 and the bears took the upper hand, which resulted in the bearish investors managing to almost recoup yesterday's losses at the time of writing. The bears are targeting the psychological barrier at 1.0000 first. If the bulls manage to limit the sell-off, then we could see another attempt to breach the resistance at 1.0054. Macroeconomic news that could have a strong effect on the currency pair, is the U.S. jobless claims data at 12:30 GMT and the manufacturing business activity Index at 14:00 GMT.
USD/JPY
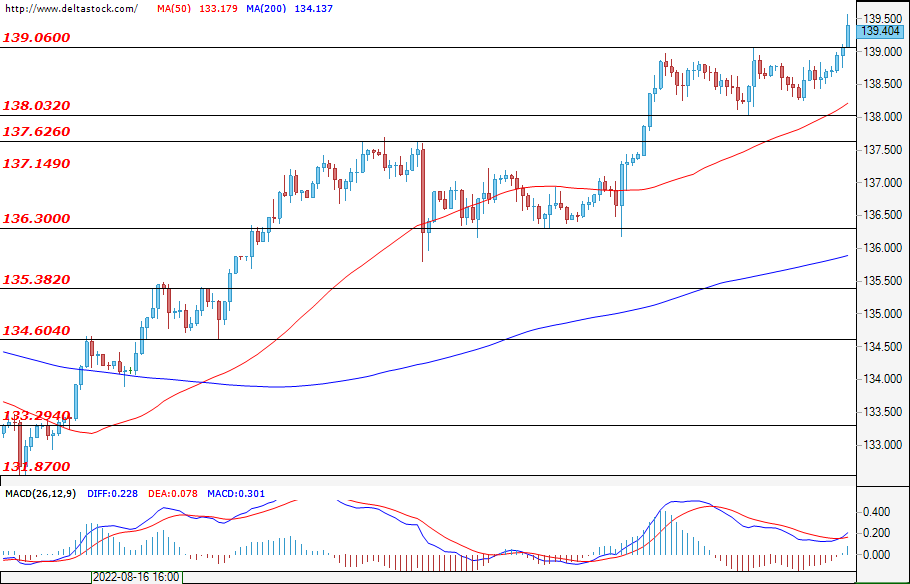
The first September session for the Ninja began with a bullish breach of the key resistance at 139.00. The next resistance before them would be found at the 140.00 level. If the bears manage to get the upper hand, then we could witness an attempted attack on the support at 138.03, followed by the next one at 137.62. Macroeconomic news from the country of the rising sun is not expected to have a strong effect on the market today.
GBP/USD
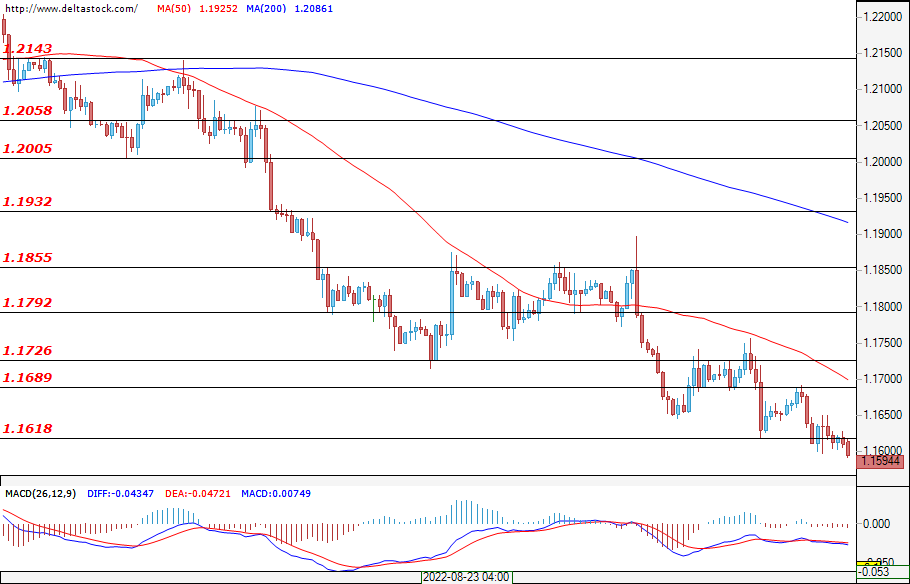
On the first day of September, the British pound continued to lose ground against the dollar and bearish sentiment seems to have taken a hold of the market. At the time of writing the analysis, the bears are trying to confirm their support breach at 1.1618. If the Sterling still manages to "recover", then we could witness an attempted attack on the nearest resistance at 1.1690, but given the current economic situation in the UK, the recovery will most likely be short-lived.
EUGERMANY40
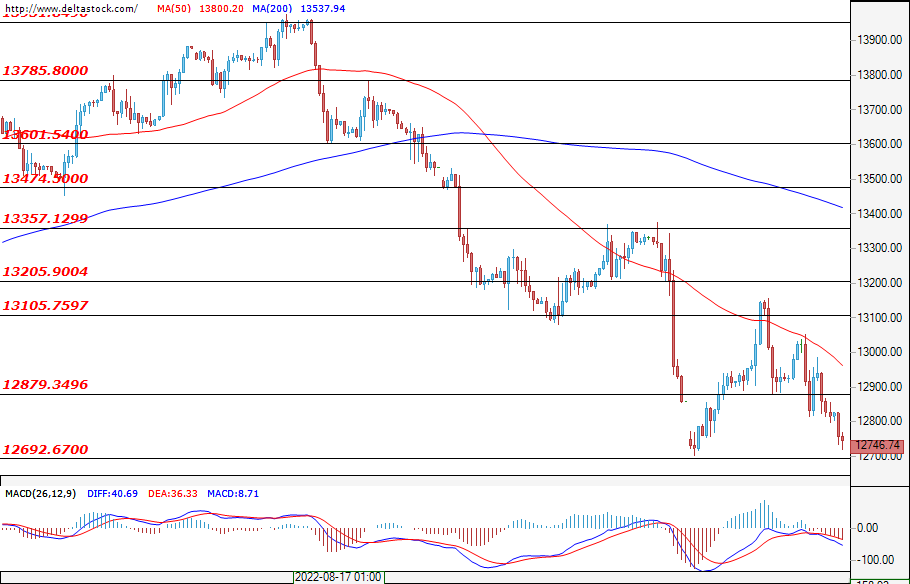
On the first day of September, the British pound continued to lose ground against the dollar and bearish sentiment seems to have taken a hold of the market. At the time of writing the analysis, the bears are trying to confirm their support breach at 1.1618. If the Sterling still manages to "recover", then we could witness an attempted attack on the nearest resistance at 1.1690, but given the current economic situation in the UK, the recovery will most likely be short-lived.
US30
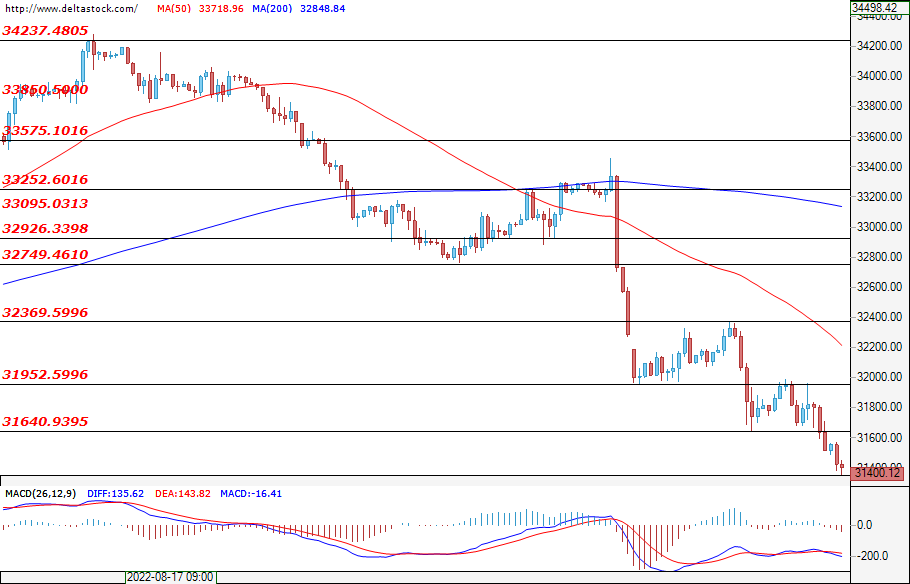
In the U.S. blue-chip index, we are also witnessing success for the bears as they were able to confirm their breach at 31640, with the next support to overcome located at 31100. If the bulls manage to limit the sell-off, then we could witness an attempt to reach and breach the resistance at 31950. Despite this, the sentiment remains negative, given the worsening global economic situation and the fact that the Fed has started to reduce its balance sheet with $95 billion on a monthly basis.
US OIL Hits Floor
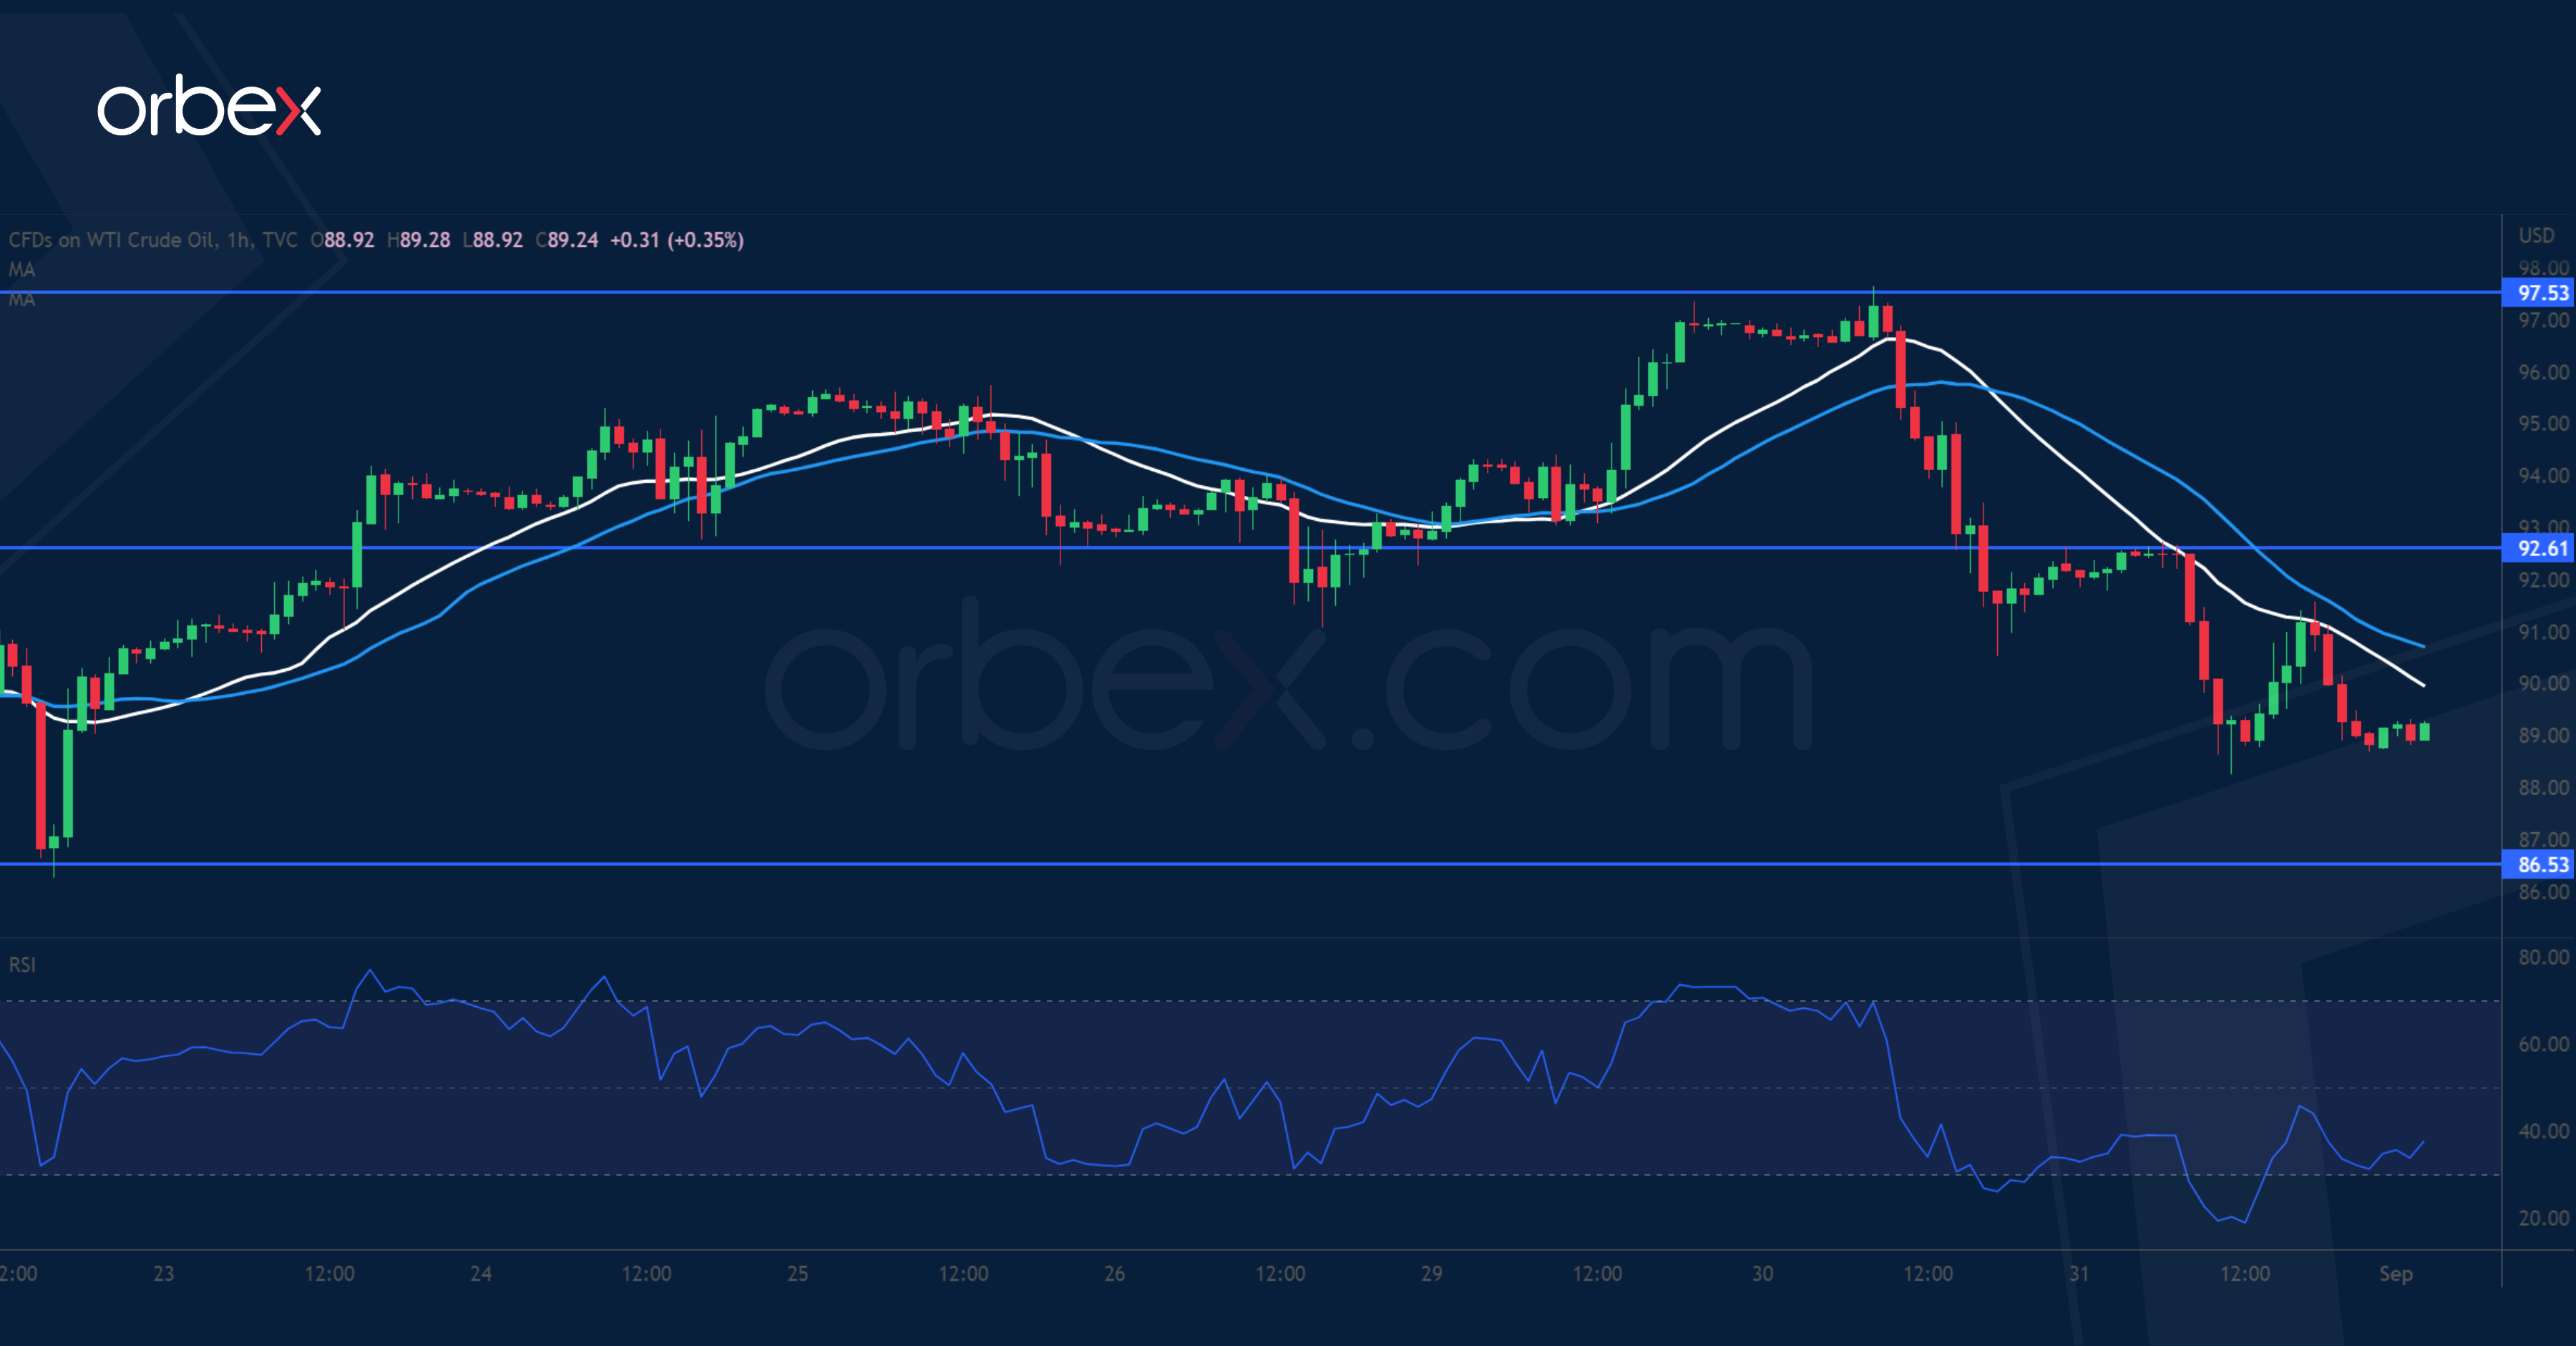
WTI crude found support from a larger-than-expected drop in US stockpile. The price met selling pressure in the supply zone around 97.50 and a fall below 93.50 forced short-term buyers to bail out, driving up volatility in the process. 86.50 is a critical floor and its breach would invalidate the recent rebound, leaving the commodity vulnerable to a new round of sell-off. An oversold RSI may lead to some profit-taking, but a rebound could be short-lived as the mood remains cautious. 92.60 is a fresh resistance should that happen.
EUR/GBP Breaks Higher
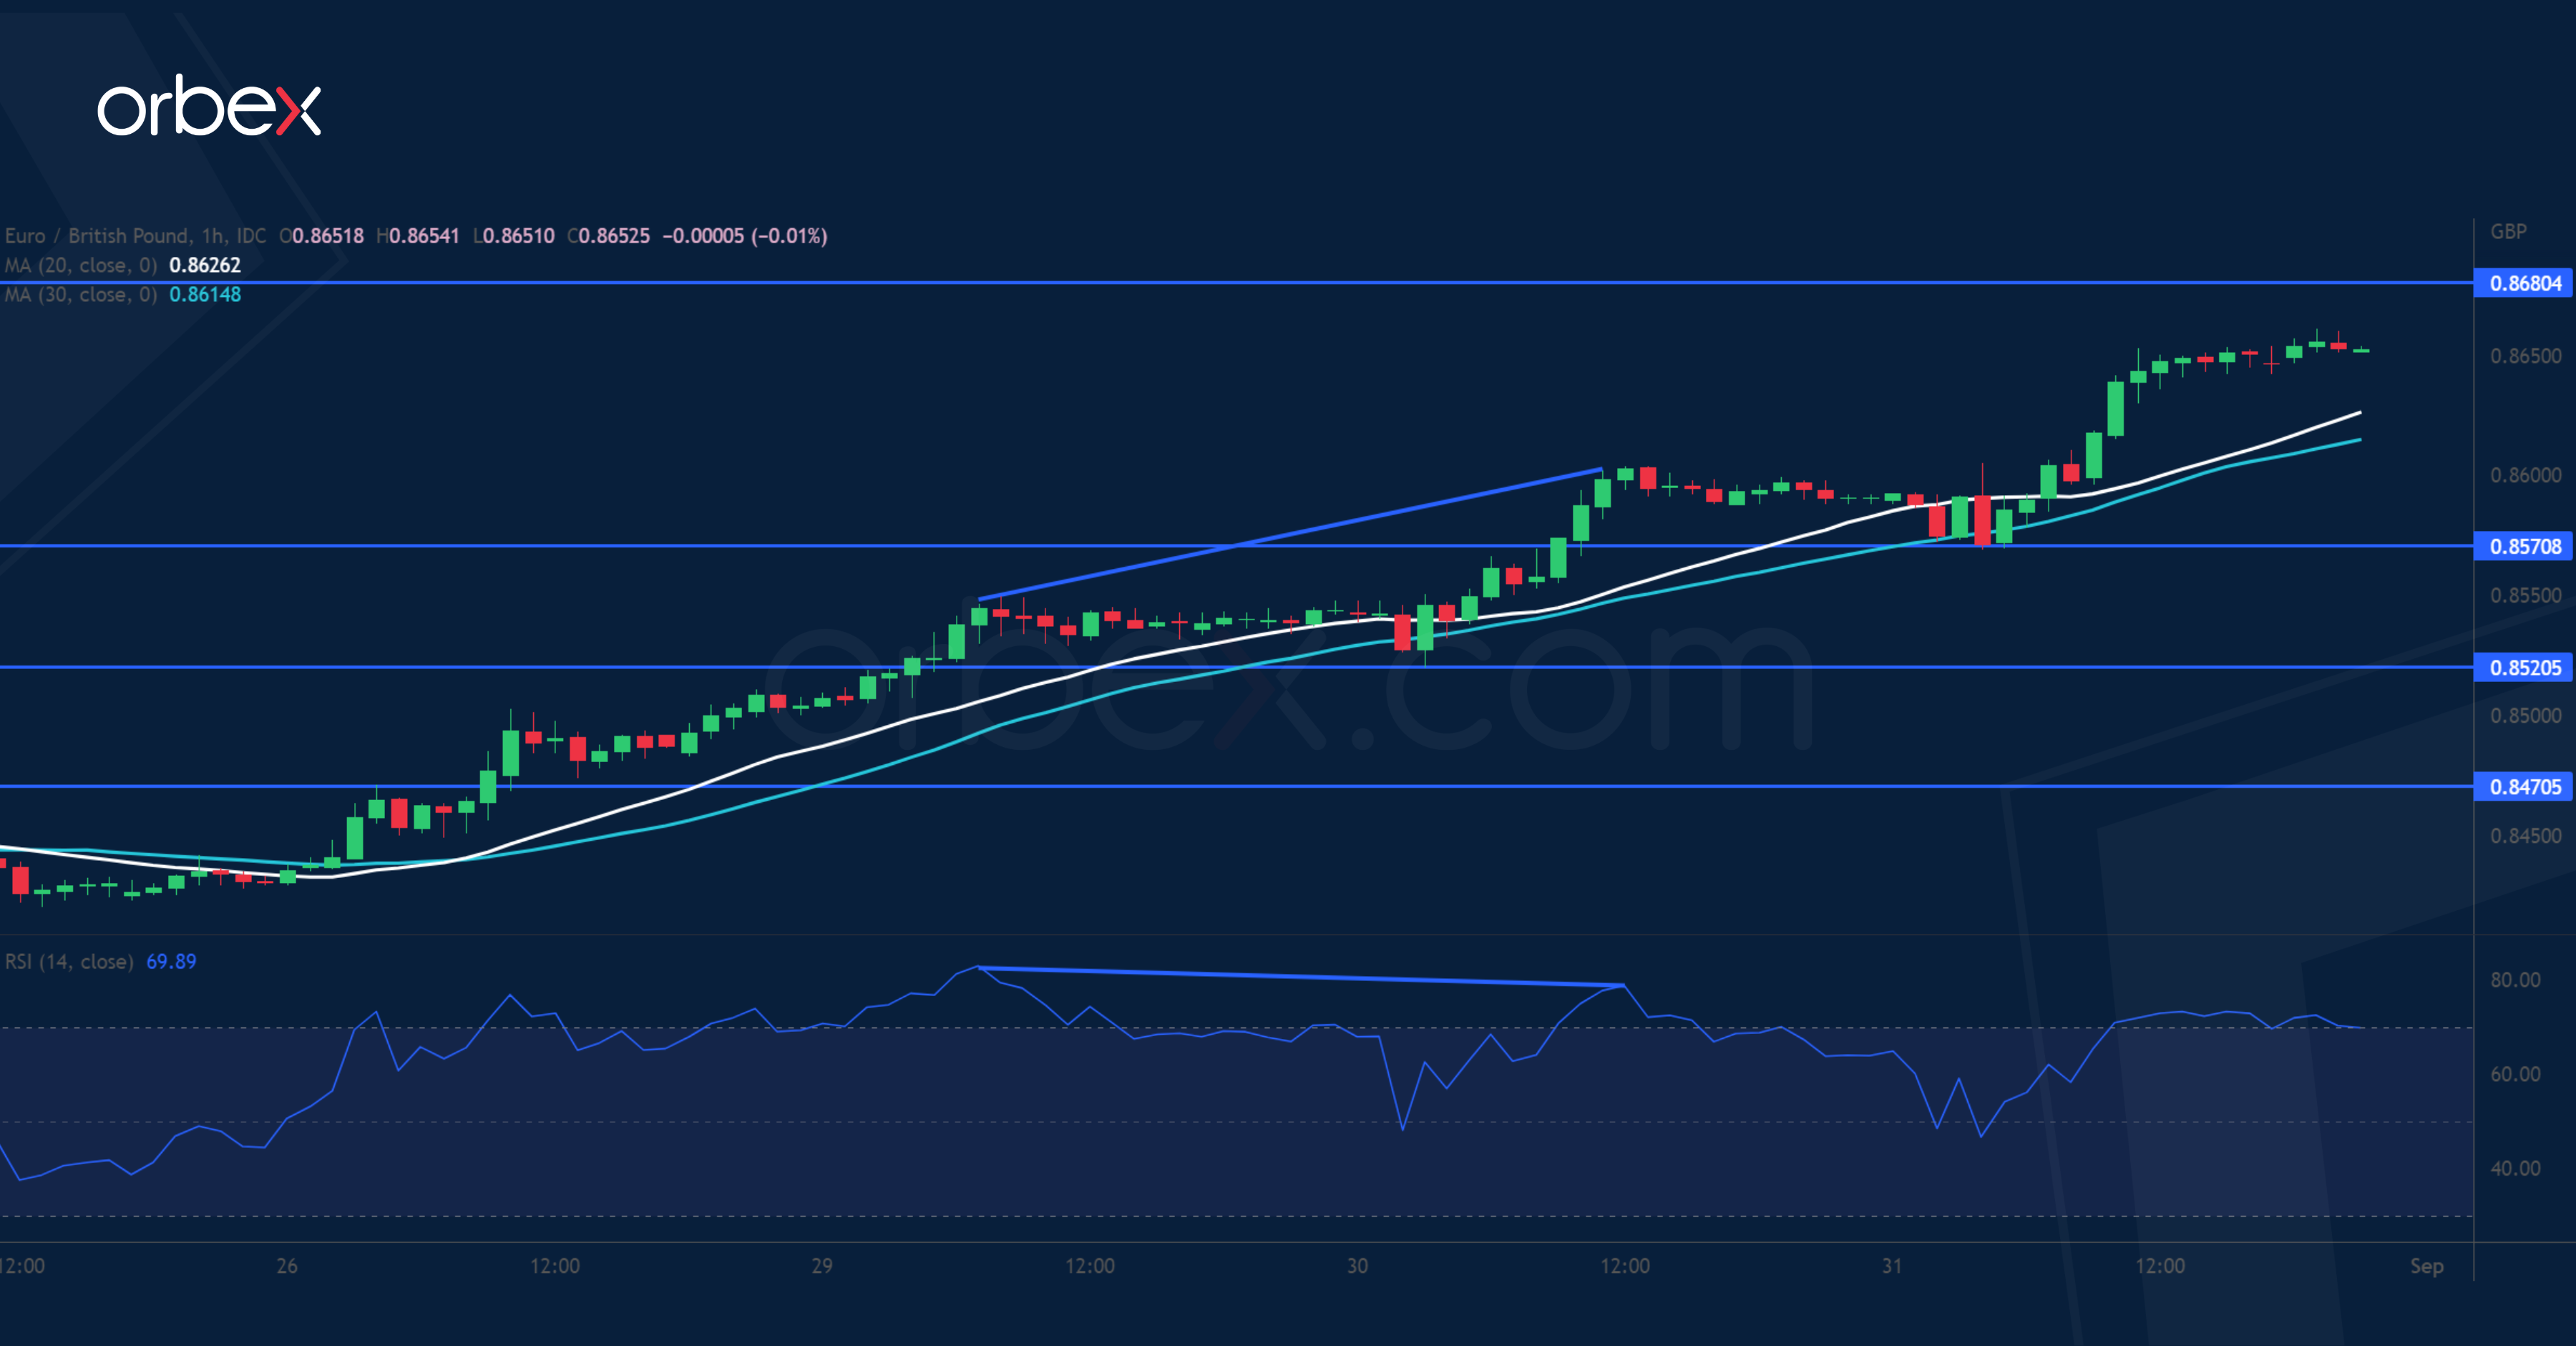
The euro rallies ahead of an aggressive hike by the ECB. A surge above the daily resistance at 0.8580 may have turned sentiment around after a two-month long correction. 0.8680 at the start of the July sell-off is a major supply area. A bullish breakout may lift offers to the daily resistance at 0.8720. As a bearish RSI divergence shows a loss of momentum in the rally, the pair could be subject to profit-taking and renewed selling pressures. 0.8570 at the base of the latest breakout is the first support in case of a pullback.
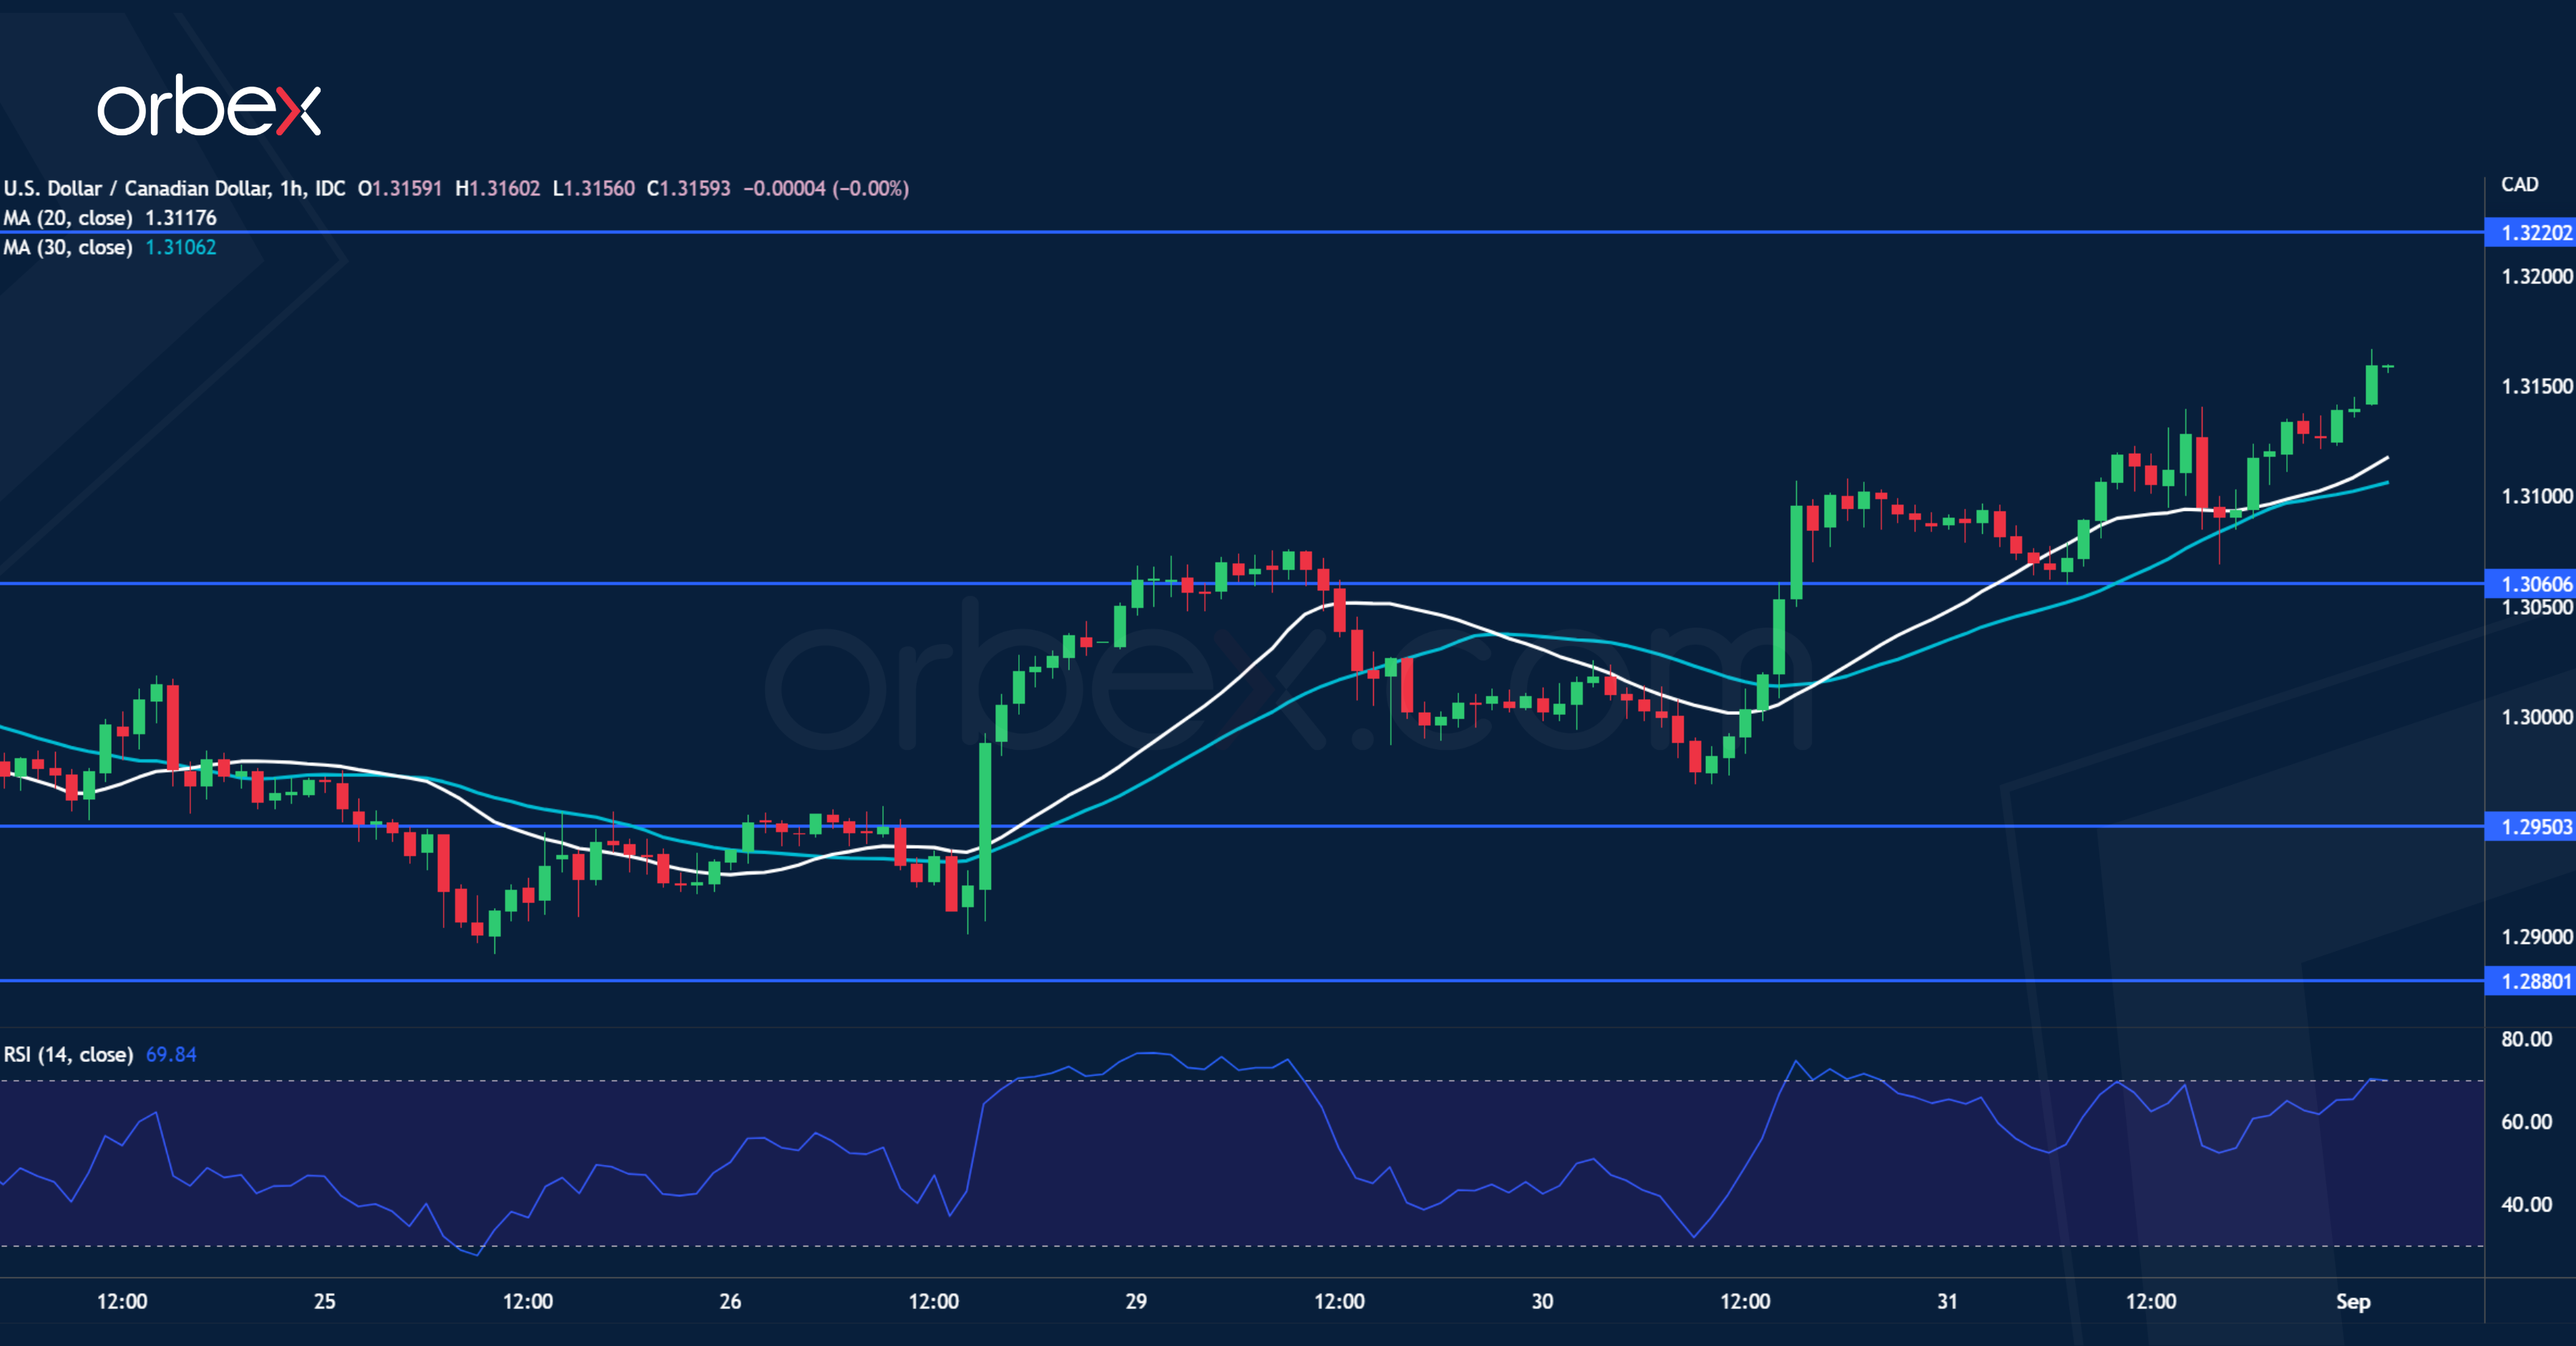
USD/CAD to Test Key Resistance
The Canadian dollar softens after the Q2 GDP fell short of expectations. A rally above 1.3060 prompted sellers to cover their bets, opening the path for an extended recovery. A series of higher lows indicates solid interest in pushing the greenback back to July’s peak at 1.3220, where a bullish breakout could resume the uptrend in the weeks to come. The RSI’s overbought condition may cap the range on the upside for the time being. The resistance-turned-support at 1.3060 is the first level to probe bids.