

Sample Category Title
The Chinese Central Bank Unexpectedly Eases Monetary Policy
Market movers today
- There are no significant market movers today.
- The Chinese central bank unexpectedly cut policy rates this morning.
- The key numbers and events are the German ZEW indicator tomorrow, UK inflation data and Fed minutes later this week.
The 60 second overview
The Chinese central bank unexpectedly cut rates this morning as it lowered its one-year policy loans by 10bp and the 7-day reverse repo rate to 2% from 2.1%. They were expected to keep rates unchanged. The rate cut comes on the back of a slowdown in the Chinese economy.
The focus on a recession in the euro-area continues and the risk of a recession is seen as 60% according to a recent poll conducted by Bloomberg. This is the highest since November 2020. It is driven by a string of factors but primarily by energy shortages that threaten to push inflation even higher, but also the drought and rising monetary policy rates. All this drives the cost-of-living higher and increases the risk of a recession.
The UK inflation numbers are one of the highlights of the week as inflation is expected to hit 9.8%. We also have Fed minutes from the latest FOMC meeting where we will look for comments on future path for monetary policy. A string of Fed officials have stated that we are still far from easing and declare victory over inflation. Tomorrow is the release of the German ZEW indicator. Here the number will most likely show a reflection of the increased risk of recession.
Equities: Global equities rallied Friday and thereby closing yet another strong week with gains around 2.5%. VIX drifted lower to sub 20 and most of the down-beaten stocks in first half of the year continue to regain some the loss to the winners of H1. As the rally on Friday was (again) driven by an inflation-related relief, this time coming from lower consumer based inflation expectations in the Michigan survey, it resulted in the bucket of cyclical growth and quality companies outperforming together with small caps. In US Dow +1.3%, S&P 500 +1.7%, Nasdaq +2.1% and Russell 2000 +2.1%. Asian markets are higher this morning with the Nikkei 225 getting back into green for the year. China is lagging the rally after a weak set of key figures and with retail sales coming in very weak. European futures are higher in a Friday catch-up while US futures a tad lower this morning.
FI: The flattening of the US yield curve continued on Friday after a very brief bearish steepening of the 2-10Y curve on Thursday last week. There has also been some relief in the Bund ASW-spread as it has declined from 95bp down towards 90bp. We still believe that the German government bond yield curve will continue to flatten as we have seen in the US yield curve. The ASW-spread can also continue to widen even at these elevated levels.
FX: EUR/SEK rebounded above 10.40 after the surprise drop in Swedish inflation on Friday. EUR/NOK stayed put around the 9.80 level. EUR/USD edged below 1.03 to finish the week.
Credit: Credit markets saw further tightening on Friday as iTraxx Main was tighter by 2bp and Crossover by 16bp, with the indices ending the week tighter by 10bp and 56bp, respectively (at 92bp and 463bp).
EUR/JPY Daily Outlook
Daily Pivots: (S1) 136.60; (P) 137.00; (R1) 137.70; More....
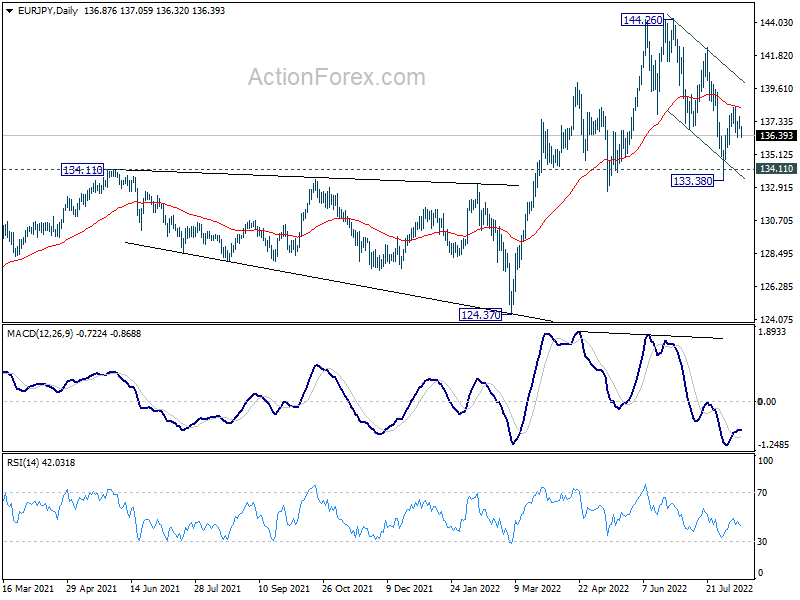
Intraday bias in EUR/JPY remains neutral for the moment. On the upside, break of 138.38, and sustained trading above 55 day EMA (now at 138.29) will suggest that whole correction from 144.26 has completed. Further rally would then be seen back to retest 144.26 high. However, break of 135.63 will turn bias back to the downside for 133.38 low instead.
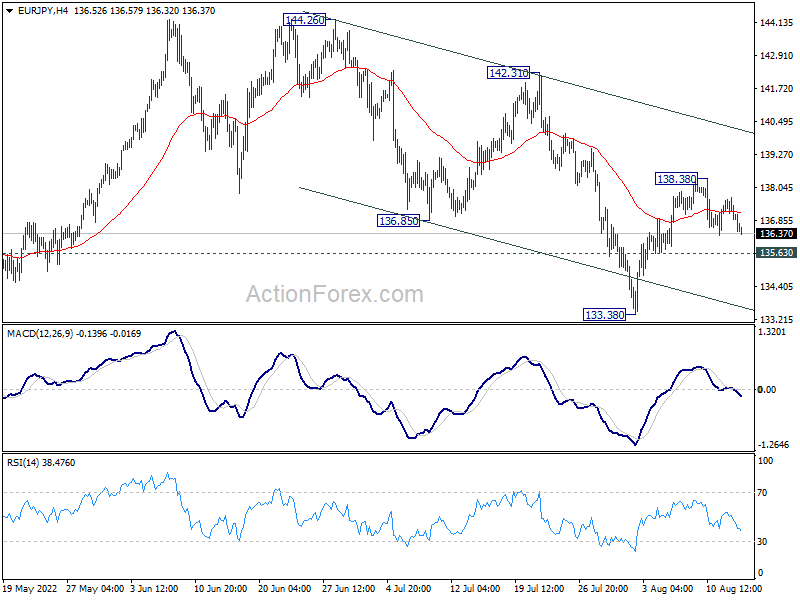
In the bigger picture, up trend from 114.42 (2020 low) is seen as the third leg of the pattern from 109.30 (2016 low). Further rally is in favor as long as 134.11 resistance turned support holds, even in case of deep pull back. Next target is 149.76 (2015 high). However, sustained break of 134.11 will be a sign of medium term bearish reversal and turn focus to 124.37 support for confirmation.
Yen Rises, Commodity Currencies Soften after China Data Miss
Commodity currencies soften mildly in Asian session today, following weaker than expected economic data from China. On the other hand, Yen is leading Dollar and Swiss Franc higher. Euro and Sterling are mixed for now. Overall sentiment is mixed, with notable gains in Nikkei but other Asian indexes are sluggish. Gold is still struggling to break away from 1800 handle. WTI crude oil is dipping below 92 handle.
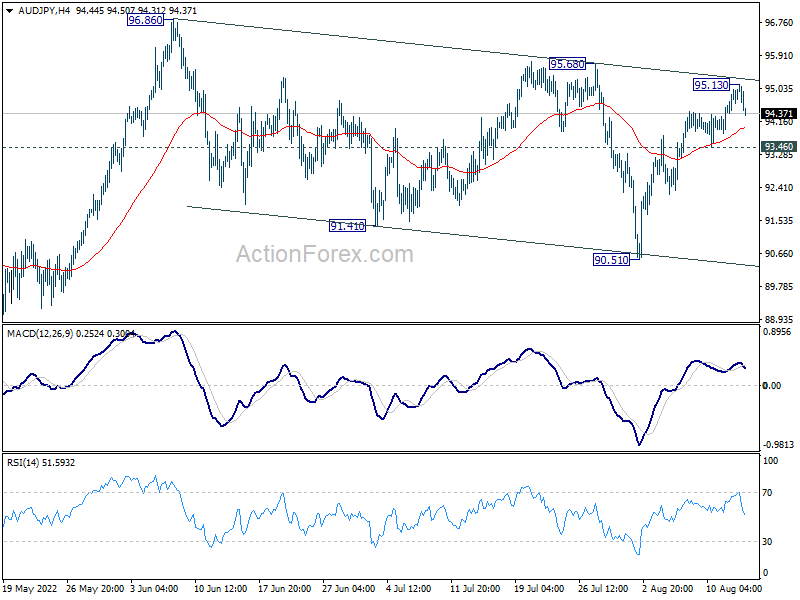
Technically, one focus today is one whether buying in Yen would pick up momentum again. One level to watch is AUD/JPY's reaction to 93.46 minor support in case of deeper retreat. More too look at include 135.63 minor support in EUR/JPY and 161.08 minor support in GBP/JPY. Break of these levels would argue that Yen bulls are back on board.
In Asia, at the time of writing, Nikkei is up 1.14%. Hong Kong HSI is down -0.08%. China Shanghai SSE is up 0.15%. Singapore Strait Times is down -0.22%. Japan 10-year JGB yield is down -0.0021 at 0.187.
Japan GDP grew 0.5% qoq in Q2, exceeding pre-pandemic level finally
Japan GDP grew 0.5% qoq in Q2, below expectation of 0.6% qoq. In annualized term, GDP grew 2.2%, below expectation of 2.5%. The size of the economy was lifted to JPY 542.1T, exceeding pre-pandemic level in Q4 2019.
Growth was driven by 1.1% gain in private consumption. Capital expenditure rose 1.4%. Public investment rose 0.9%. Exports and imports rose 0.9% and 0.7% respectively.
China data disappoints, PBoC cuts MLF rate
China industrial production rose 3.8% yoy in July, below expectation of 4.6% yoy, slowed from 3.9% yoy. Retail sales rose 2.7% yoy, below expectation of 5.0% yoy, slowed from 3.1% yoy. Fixed asset investment rose 5.7% ytd yoy, below expectation of 6.2%.
"The national economy maintained strong recovery momentum," the NBS said in a statement. But it warned of rising stagflation risks globally and said "the foundation for the recovery of the domestic economy has yet to be consolidated."
Separately, PBoC cut a key interest rate for the second time this year and withdrew some cash from the banking system on Monday The rate on one-year medium-term lending facility (MLF) loans is lowed by 10 bps to 2.75%. The PBOC attributed its move to "keep banking system liquidity reasonably ample".
NZ BusinessNZ services dropped to 51.2, back below average
New Zealand BusinessNZ Performance of Services Index dropped from 54.7 to 51.2 in July. Activity/Sales dropped from 55.8 to 54.4. Employment dropped from 52.7 to 49.2.New orders/business dropped from 60.5 to 52.5. Stocks/inventories dropped from 54.0 to 53.1. Supplier deliveries dropped from 48.4 to 47.3.
BNZ Senior Economist Doug Steel said that "it is difficult to be sure from one month's data, but July's outcome is the lowest since February, has retreated further from the recent 54.9 peak set in May, and is back below average."
RBNZ to hike 50bps, and lots of data featured
RBNZ is expected to raise the Official Cash Rate by another 50bps to 3.00% this week. Tightening bias should be maintained based on the May's projected path for interest rate. The question is whether RBNZ would signal that "front-loading" of rate hike is complete, giving that interest rate is in restrictive region. That is, the pace of tightening would be back on data-dependent mode. In terms of central bank activities, RBA and Fed will release minutes.
Economic calendar is very busy this week, with particular focus on US retail sales. Eurozone ZEW economic sentiment is another focus. Also, UK will publish employment, CPI and retail sales. Moreover, Canada CPI, Australia employment and a batch of China data could also be market moving.
Here are some highlights for the week:
- Monday: Japan GDP; China retail sales, industrial production, fixed asset investment; Swiss PPI; Canada manufacturing sales, wholesale sales; US Empire State manufacturing, NAHB housing index.
- Tuesday: RBA minutes; Japan tertiary industry index; UK employment; Eurozone trade balance; German ZEW; Canada CPI, housing starts; US housing starts and building permits, industrial production.
- Wednesday: RBNZ rate decision; Australia wage price index; Japan trade balance, machine orders; UK CPI, PPI; Eurozone employment, GDP; US retail sales, business inventories, FOMC minutes.
- Thursday: Australia employment; Swiss Trade balance; Eurozone CPI final; Canada IPPI and RMPI; US Philly Fed survey, jobless claims, existing home sales.
- Friday: New Zealand trade balance; Japan CPI; Germany PPI; UK Gfk consumer confidence, retail sales; Eurozone current account; Canada retail sales.
EUR/JPY Daily Outlook
Daily Pivots: (S1) 136.60; (P) 137.00; (R1) 137.70; More....
Intraday bias in EUR/JPY remains neutral for the moment. On the upside, break of 138.38, and sustained trading above 55 day EMA (now at 138.29) will suggest that whole correction from 144.26 has completed. Further rally would then be seen back to retest 144.26 high. However, break of 135.63 will turn bias back to the downside for 133.38 low instead.
In the bigger picture, up trend from 114.42 (2020 low) is seen as the third leg of the pattern from 109.30 (2016 low). Further rally is in favor as long as 134.11 resistance turned support holds, even in case of deep pull back. Next target is 149.76 (2015 high). However, sustained break of 134.11 will be a sign of medium term bearish reversal and turn focus to 124.37 support for confirmation.
Economic Indicators Update
| GMT | Ccy | Events | Actual | Forecast | Previous | Revised |
|---|---|---|---|---|---|---|
| 23:01 | GBP | Rightmove House Price Index M/M Aug | -1.30% | 0.40% | ||
| 23:50 | JPY | GDP Q/Q Q2 P | 0.50% | 0.60% | -0.10% | |
| 23:50 | JPY | GDP Deflator Y/Y Q2 P | -0.40% | -0.80% | -0.50% | |
| 02:00 | CNY | Retail Sales Y/Y Jul | 2.70% | 5.00% | 3.10% | |
| 02:00 | CNY | Fixed Asset Investment YTD Y/Y Jul | 5.70% | 6.20% | 6.10% | |
| 02:00 | CNY | Industrial Production Y/Y Jul | 3.80% | 4.60% | 3.90% | |
| 04:30 | JPY | Industrial Production M/M Jun F | 9.20% | -7.50% | -7.50% | |
| 06:30 | CHF | Producer and Import Prices M/M Jul | 0.40% | 0.30% | ||
| 06:30 | CHF | Producer and Import Prices Y/Y Jul | 6.70% | 6.90% | ||
| 12:30 | CAD | Manufacturing Sales M/M Jun | -2.00% | |||
| 12:30 | CAD | Wholesale Sales M/M Jun | 1.60% | |||
| 12:30 | USD | Empire State Manufacturing Index Aug | 5.1 | 11.1 | ||
| 14:00 | USD | NAHB Housing Market Index Aug | 55 | 55 |
China data disappoints, PBoC cuts MLF rate
China industrial production rose 3.8% yoy in July, below expectation of 4.6% yoy, slowed from 3.9% yoy. Retail sales rose 2.7% yoy, below expectation of 5.0% yoy, slowed from 3.1% yoy. Fixed asset investment rose 5.7% ytd yoy, below expectation of 6.2%.
"The national economy maintained strong recovery momentum," the NBS said in a statement. But it warned of rising stagflation risks globally and said "the foundation for the recovery of the domestic economy has yet to be consolidated."
Separately, PBoC cut a key interest rate for the second time this year and withdrew some cash from the banking system on Monday The rate on one-year medium-term lending facility (MLF) loans is lowed by 10 bps to 2.75%. The PBOC attributed its move to "keep banking system liquidity reasonably ample".
Japan GDP grew 0.5% qoq in Q2, exceeding pre-pandemic level finally
Japan GDP grew 0.5% qoq in Q2, below expectation of 0.6% qoq. In annualized term, GDP grew 2.2%, below expectation of 2.5%. The size of the economy was lifted to JPY 542.1T, finally exceeding pre-pandemic level in Q4 2019.
Growth was driven by 1.1% gain in private consumption. Capital expenditure rose 1.4%. Public investment rose 0.9%. Exports and imports rose 0.9% and 0.7% respectively.
NZ BusinessNZ services dropped to 51.2, back below average
New Zealand BusinessNZ Performance of Services Index dropped from 54.7 to 51.2 in July. Activity/Sales dropped from 55.8 to 54.4. Employment dropped from 52.7 to 49.2.New orders/business dropped from 60.5 to 52.5. Stocks/inventories dropped from 54.0 to 53.1. Supplier deliveries dropped from 48.4 to 47.3.
BNZ Senior Economist Doug Steel said that "it is difficult to be sure from one month's data, but July's outcome is the lowest since February, has retreated further from the recent 54.9 peak set in May, and is back below average."

Is China Headed for a Lehman-Style Crisis?
The Chinese economic miracle seems to have turned into a nightmare lately. With a property sector in collapse and an overleveraged banking system as global interest rates move higher at the speed of light, there is a clear risk that China might suffer a 2008 moment that infects the entire global financial system. How high is that risk and which markets would be impacted the most?
Property boom
A seismic shift is underway in China. The past couple of decades were characterized by meteoric economic growth, which was enabled by businesses and households being encouraged to take on tons of debt. It wasn’t so much an economic miracle, but rather a mirage.
Faced with high demand and ever-rising prices because Chinese citizens saw their houses as an investment, property developers tried to build as much as possible and banks were incentivized to lend out money to everyone.
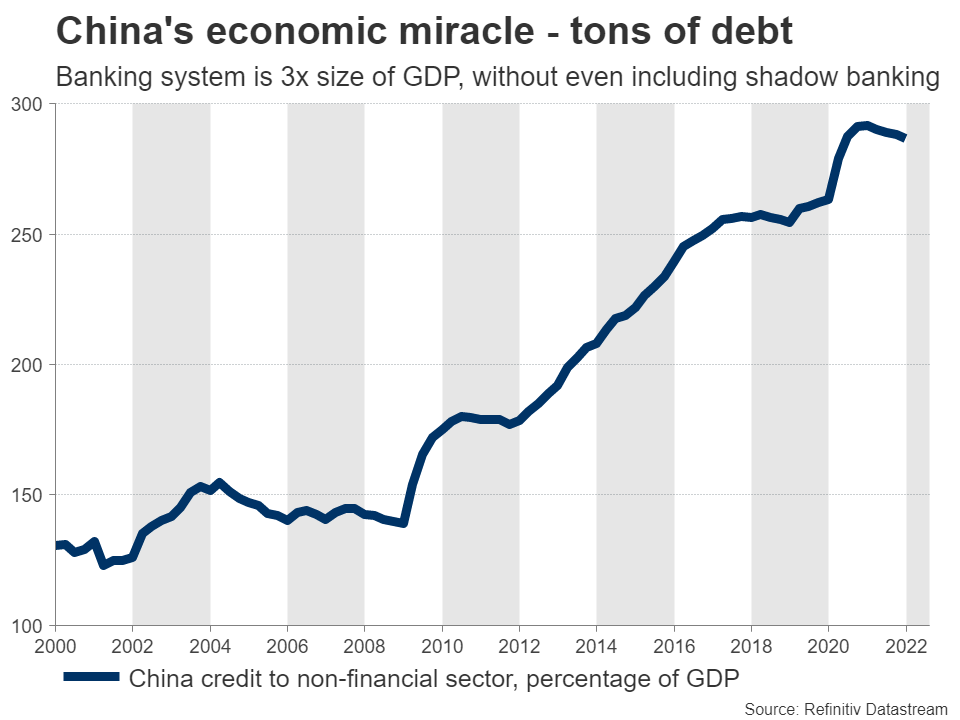
Over time, this process saw the real estate sector expand to account for around one third of national output, while the banking system issued out loans amounting to almost three times the size of the economy. And that’s before considering shadow banking, which is essentially off-the-books financing - something quite popular in China.
Mortgage revolt
Worried about an asset bubble, Chinese policymakers stepped on the brakes. They issued some rules back in 2020 that forced developers to deleverage, limiting the amount of debt they can take on. A wave of defaults ensued, shattering the long-held belief that Beijing would bail out any distressed companies to prevent contagion.
That is when the crisis entered a new phase. Around 90% of houses in China are pre-sold. Buyers are required to pay everything upfront before construction is complete - sometimes before it even starts. Worried that their developer might default and never hand over the key to their property, many people stopped paying their mortgages. It has been dubbed a ‘mortgage revolt’ and it has been spreading like wildfire.
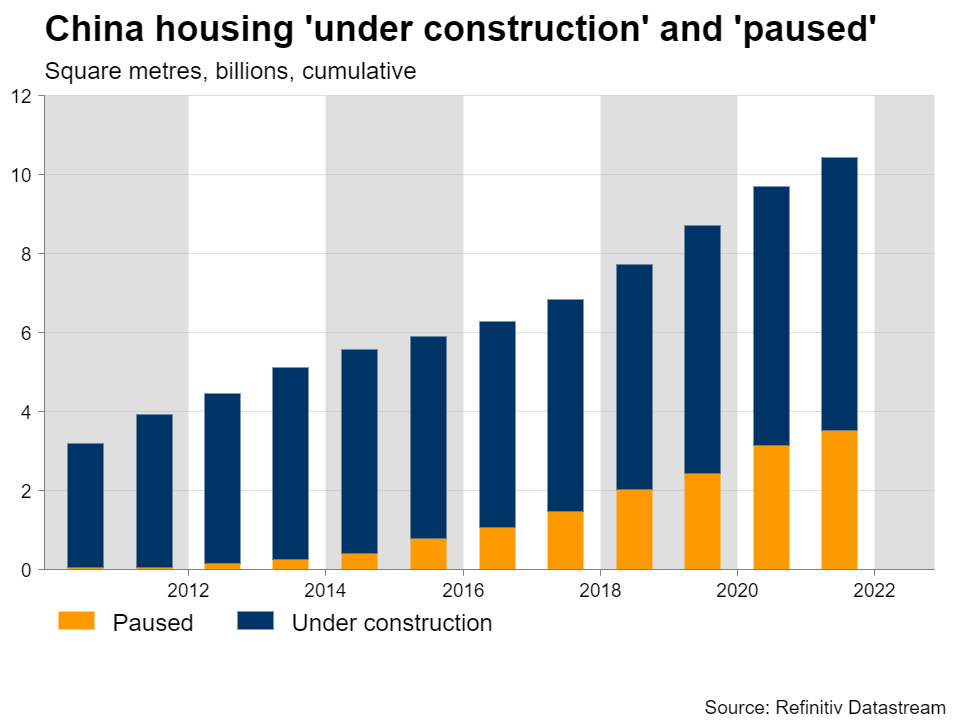
This is a dangerous game. When loans are not being repaid and banks have a footprint that exceeds the size of the economy many times over, it usually ends in disaster. Add in the fact that interest rates are being raised at the speed of light in other countries, making foreign investors more hesitant to seek riskier investments in China, and it looks like a ticking time bomb.
This risk has been reflected in the nation’s junk bonds, which are trading near record lows. Investors see a lot of default risk in those bonds and want to be compensated for holding them.
Hammer and dance
A spiraling property crisis is not the only risk facing China. Local authorities are still pursuing a ‘hammer and dance’ strategy with covid lockdowns, enacting strict restrictions whenever outbreaks are detected in some area. The economic fallout was evident during the second quarter, when the economy contracted.
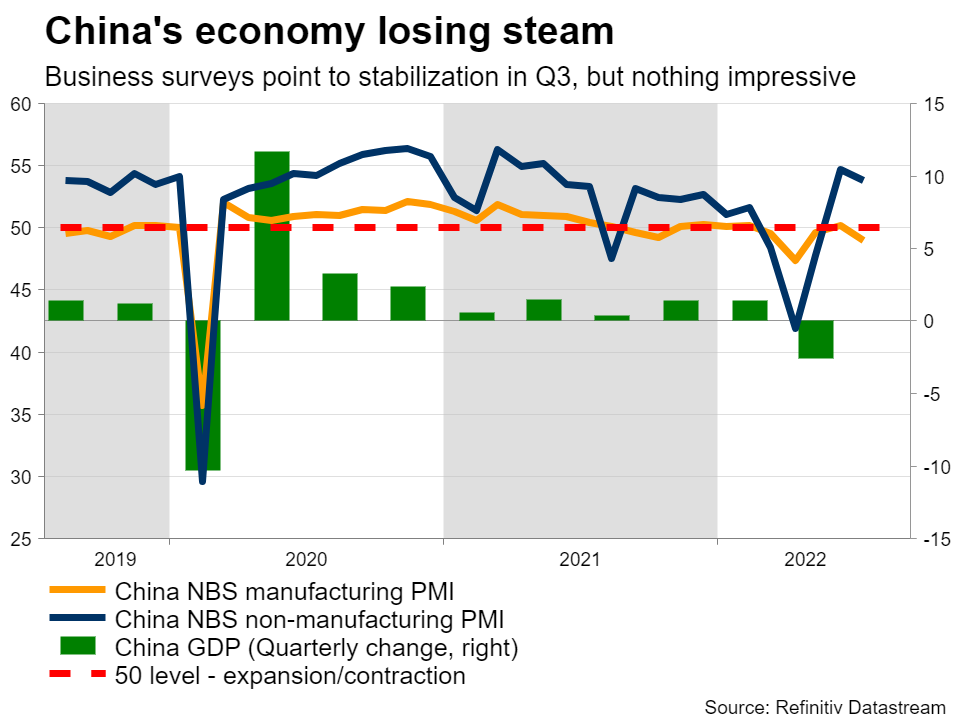
Although the latest business surveys paint a more positive picture for this quarter, they are still consistent with an economy that is stalling and employment indicators suggest that companies are cutting workforce numbers to cope. Consumer confidence is already running at record lows.
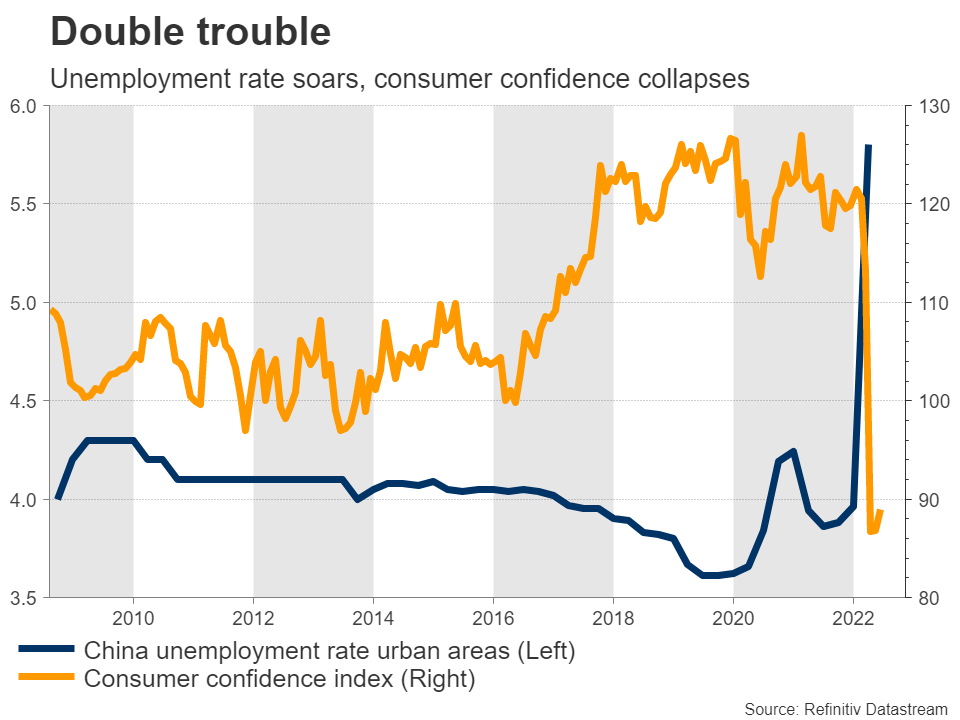
And the situation abroad isn’t great either. Europe has been crippled by the energy crisis and while the US economy is holding up better, it is also losing steam. That’s a threat for Chinese factory demand, which the latest data suggest is already rolling over.
Market implications
China is the world’s second-largest economy, with deep trade ties in every country. Even though it still has soft capital controls in place, it is almost certain that any crisis would not stay contained within its borders for long. Even the Federal Reserve warned about a domino effect that could infect America in its latest Financial Stability Report.
If the situation truly escalates, that would send shockwaves across every asset class. Stock markets could get hit hard, especially those in Asia as traders slash their risk exposure to the region. Currencies like the Australian and New Zealand dollars would likely crumble as well, since the entire business model of their economies relies on exporting commodities to China.
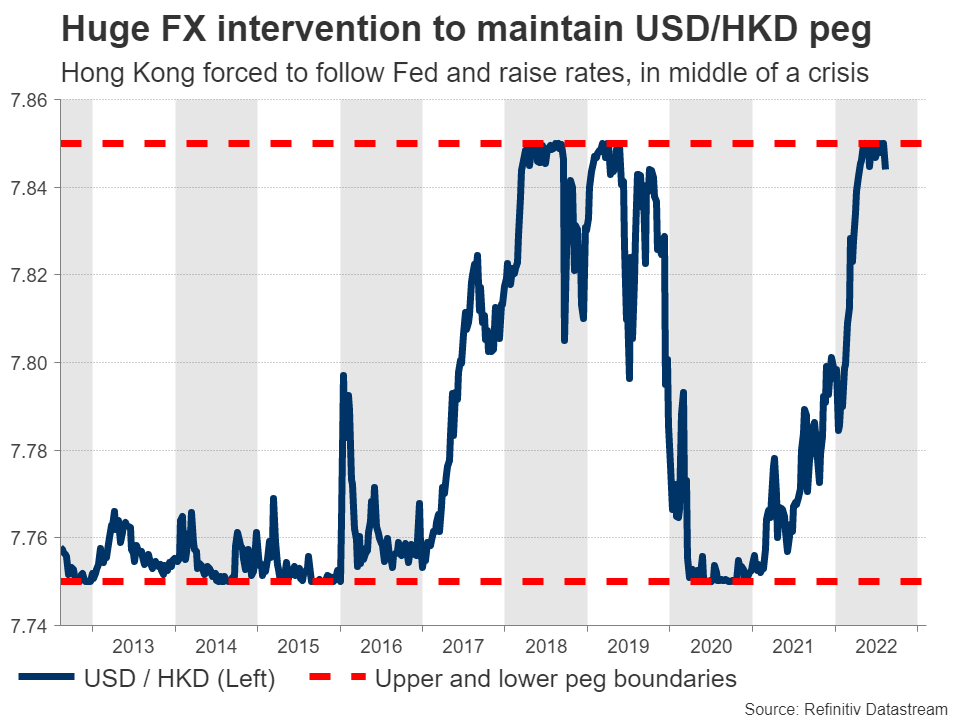
The Hong Kong dollar could get ravaged too. It is already testing the weaker end of its peg with the US dollar and the local authority is burning through its FX reserves to maintain this fix. If the selling pressure becomes even greater, they might decide it is not worth defending and simply abandon it, or at least allow the currency to depreciate.
Across the risk spectrum, the Japanese yen would likely benefit from such a scenario as traders take shelter in defensive assets and global bond yields retreat. For similar reasons, gold could come back into fashion. On the contrary, other commodities like industrial metals would probably suffer.
Mind the bailouts
All told, this is just a toxic cocktail, with local banks being incredibly exposed to a property market that is going downhill, mortgages that aren’t being repaid, and global interest rates moving higher to amplify all the stress while the Chinese economy stalls.
If there is a silver lining, it is that the Chinese government holds a lot of cards. It might be able to stop the contagion, at least initially, if it decides to bail out the most distressed entities before the domino effect truly begins. The People’s Bank of China is also likely to reduce interest rates further in an attempt to counter the increase in global rates.
Only time will tell whether the policy response will be enough. For now, this seems like the most underappreciated risk surrounding the global economy - the real ‘grey swan’.
Technical Outlook and Review
USD/JPY:
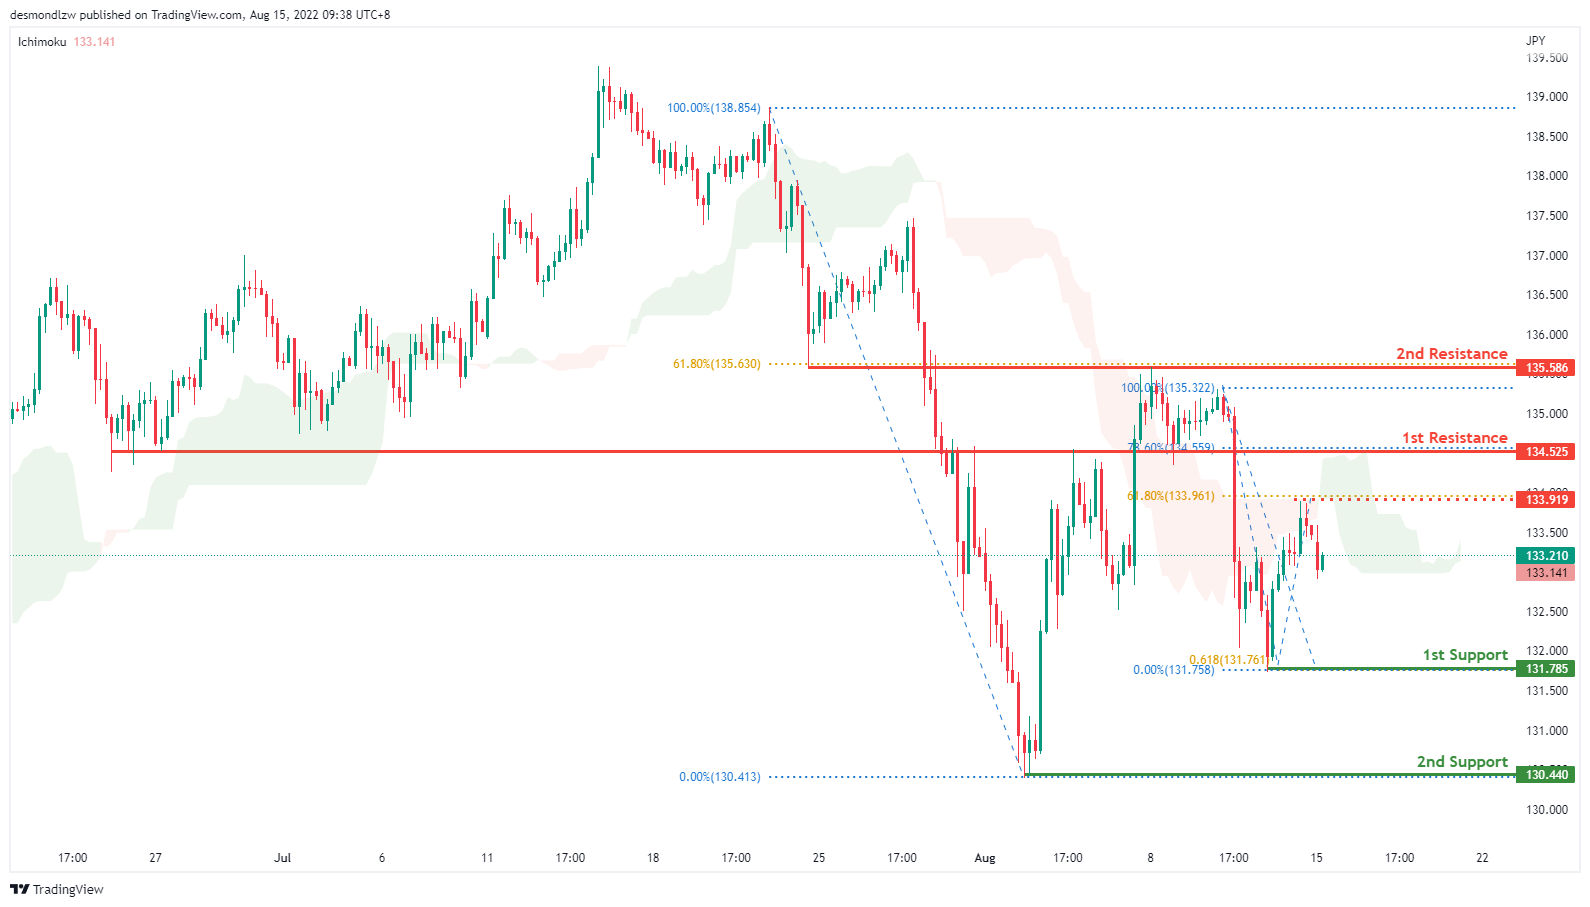
On the H4, prices are still respecting the descending trend and are testing the 61.8% fibonacci retracement. If prices continue with the bearish momentum, we are looking at price pulling back to test at the first support 131.785 where the fibonacci projection as well as the previous swing low sits, subsequently testing the second support at 130.440. Alternatively if prices fail to continue with the bearish trend, we are expecting prices to test at the intermediate resistance 133.919. If it breaks that resistance and confirms bullish momentum, prices will test at first resistance 134.525 where the 78.6% fibonacci retracement sits.
Areas of consideration:
- H4 time frame, 1st resistance at 134.525
- H4 time frame, 1st support at 131.785
DXY:
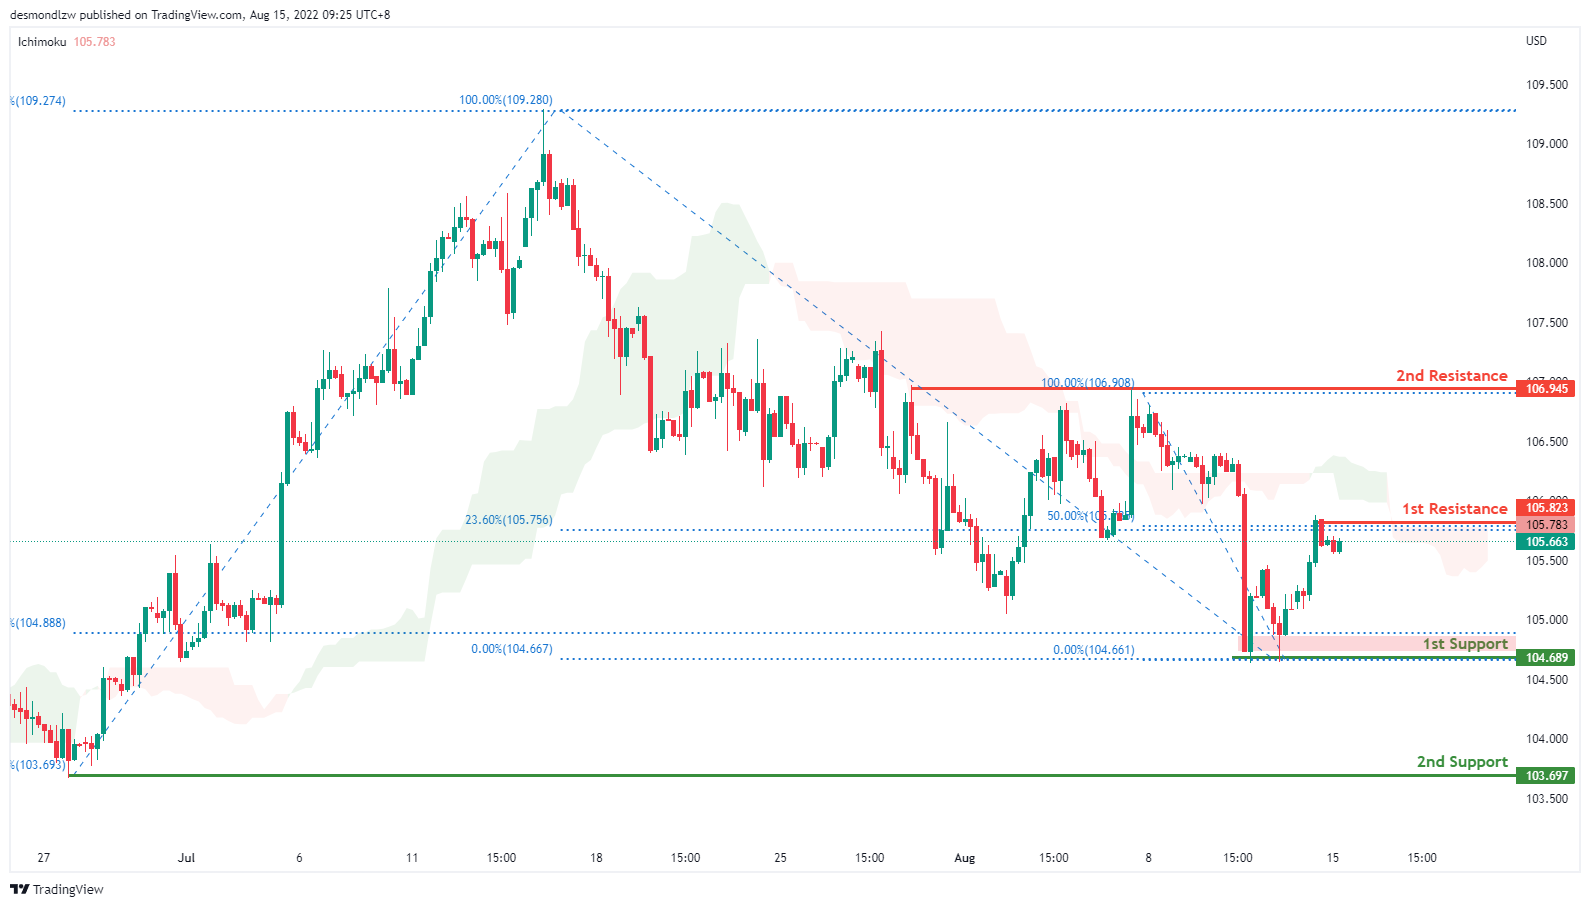
On the H4, price is moving in a descending trend and has confirmed a bearish momentum. It is now testing around the 105.823 level where the 50% fibonacci retracement sits. If price continues the bearish momentum, it will bring price down to 104.689 where the first support and 78.6% fibonacci sits. Alternatively, prices might pull back to test the first resistance at 106.945
Areas of consideration:
- H4 time frame, 1st resistance at 106.945
- H4 time frame, 1st support at 104.689
EUR/USD :
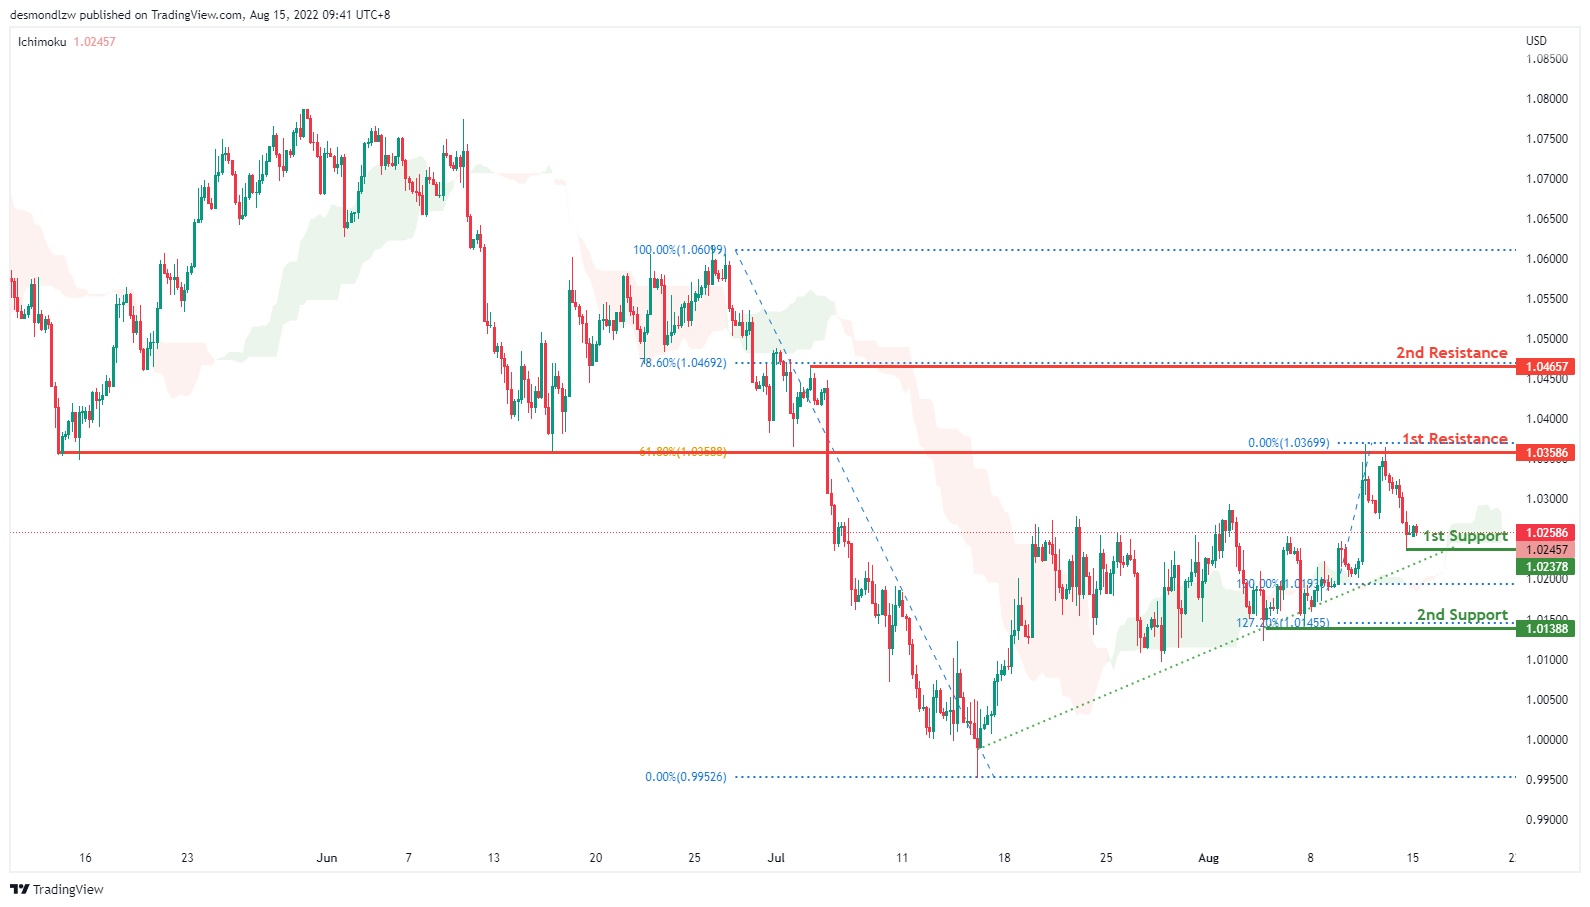
On the H4, with prices moving along the ascending trend and above the ichimoku indicator, we are bullish bias. Prices have tested the first resistance at 1.03583 where the 61.8% fibonacci retracement sits and is pulling back slightly. If prices fails to break the first resistance, it will pull back further to test at the first support 1.020 where the previous swing low sits and subsequently the second support at 1.012 level
Areas of consideration :
- H4 1st resistance at 1.035
- H4 1st support at 1.020
GBP/USD:
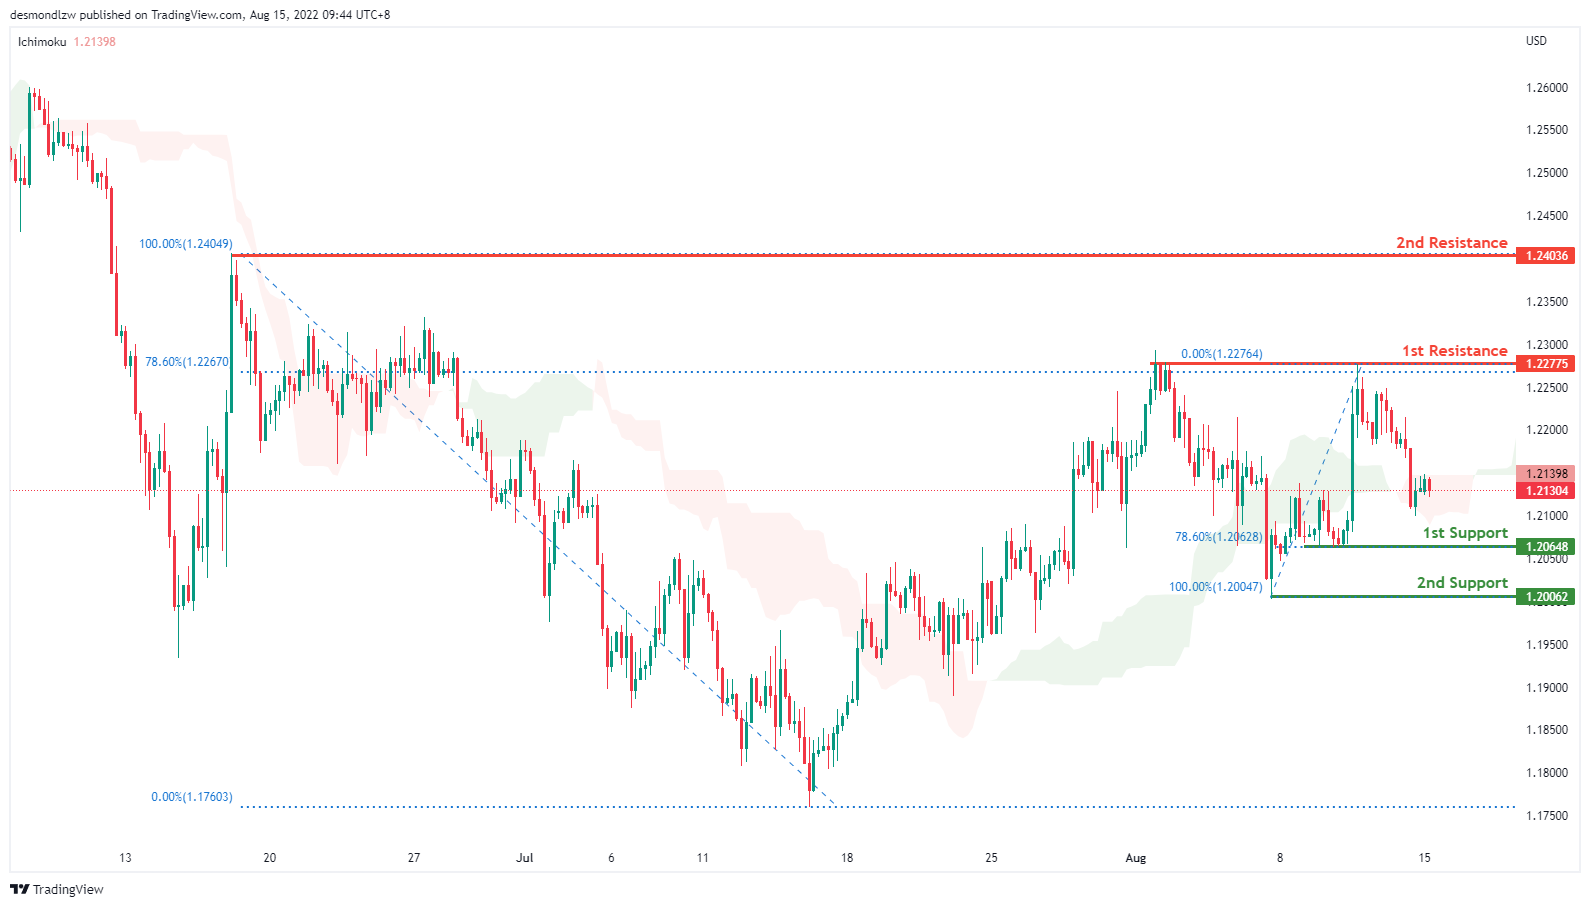
On the H4, with price moving within an ascending trend and above the ichimoku indicator, we have a bullish bias that price will rise to test the first resistance at 1.227 where the 78.6% fibonacci retracement sits and subsequently the second resistance at 1.240. If prices fail to break the first resistance, we can confirm a bearish momentum where prices will pull back and test the first support at 1.206 where the 78.6% fibonacci retracement sits
Areas of consideration:
- H4 1st resistance at 1.227
- H4 1st support at 1.206
USD/CHF:
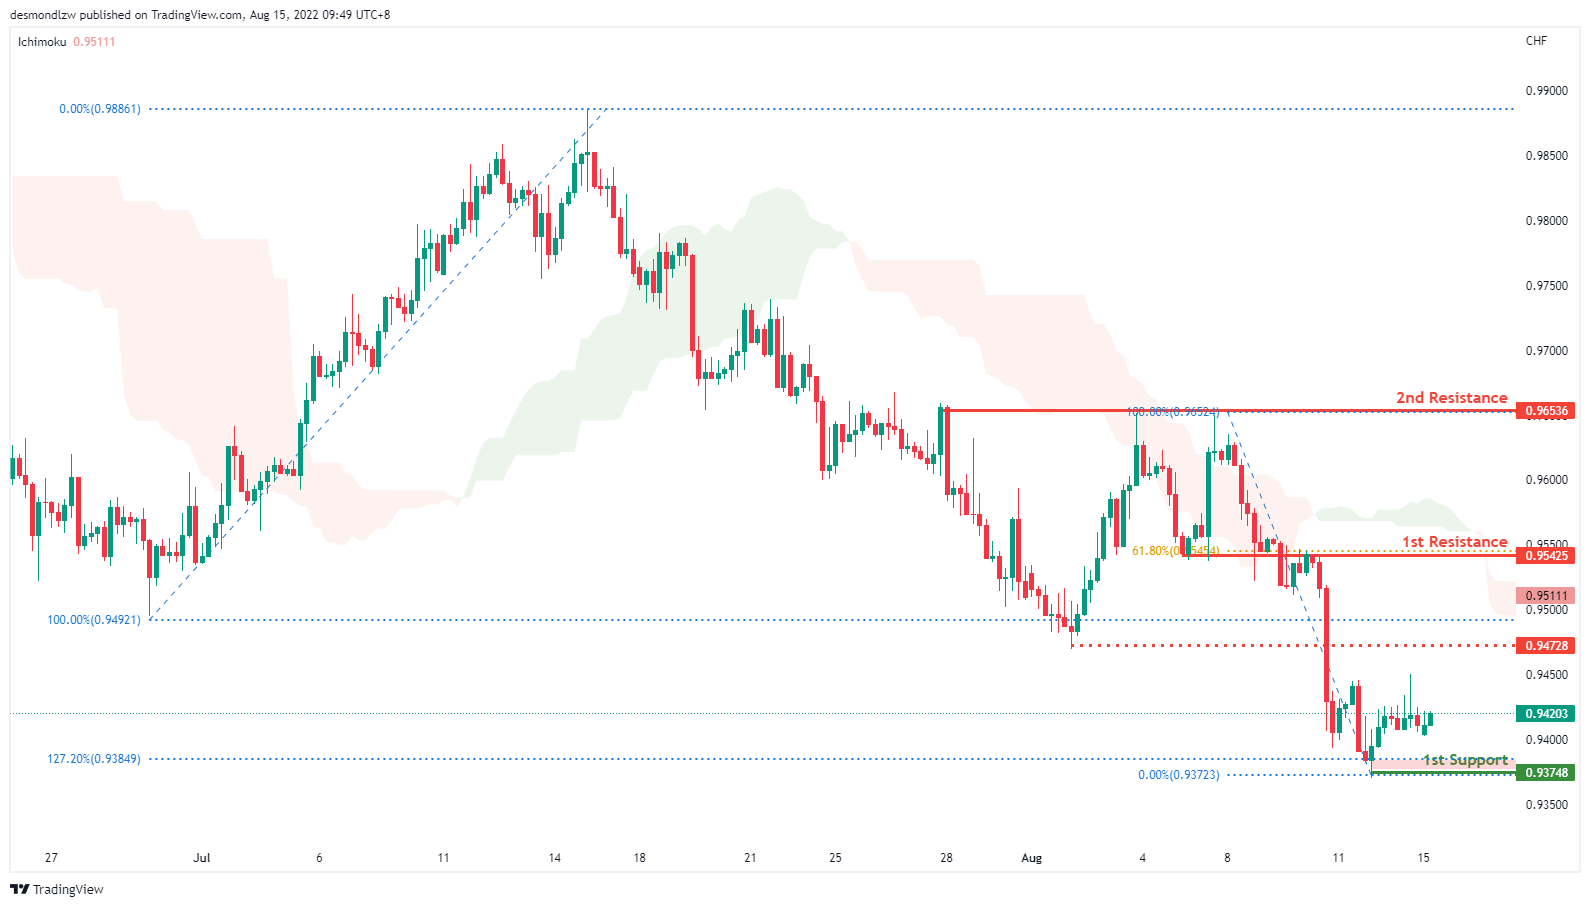
On the H4, with prices moving below the ichimoku cloud and the MACD indicators are below zero, we have a bearish bias that the price will continue with the bearish momentum and pull back to test at the first support 0.937. If prices fail to break first support, it may pull back to test the first resistance at 0.954 where the 61.8% fibonacci retracement and previous swing low sits. If prices continues with bullish momentum, it will then pull back further to test at the second resistance 0.965
Areas of consideration
- H4 1st support at 0.937
- H4 1st resistance at 0.954
XAU/USD (GOLD):
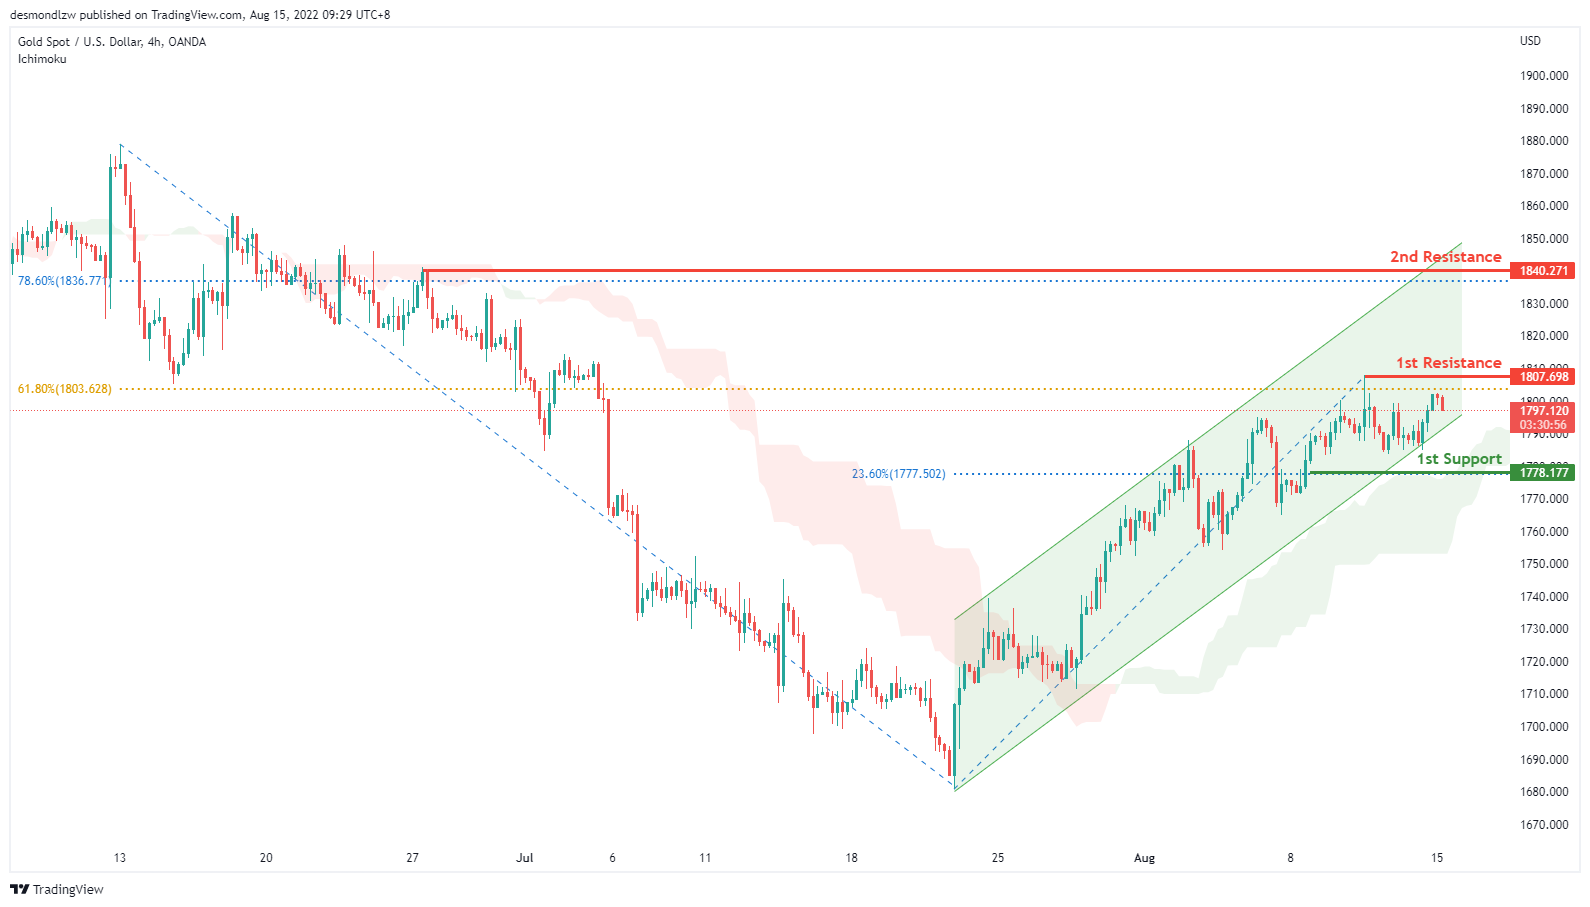
On the H4, with prices going along the ascending channel and moving above the ichimoku cloud, we have a bullish bias that the price may rise from the 1st resistance at 1807.698, which is in line with the swing high and 61.8% fibonacci retracement to the 2nd resistance at 1840.271, which is in line with the 78.6% fibonacci retracement. Alternatively, the price may drop to the 1st support at 1778.177, which is in line with the 23.6% fibonacci retracement.
Areas of consideration:
- H4 time frame, 1st resistance at 1807.698
- H4 time frame, 2nd resistance at 1840.271
AUD/USD:
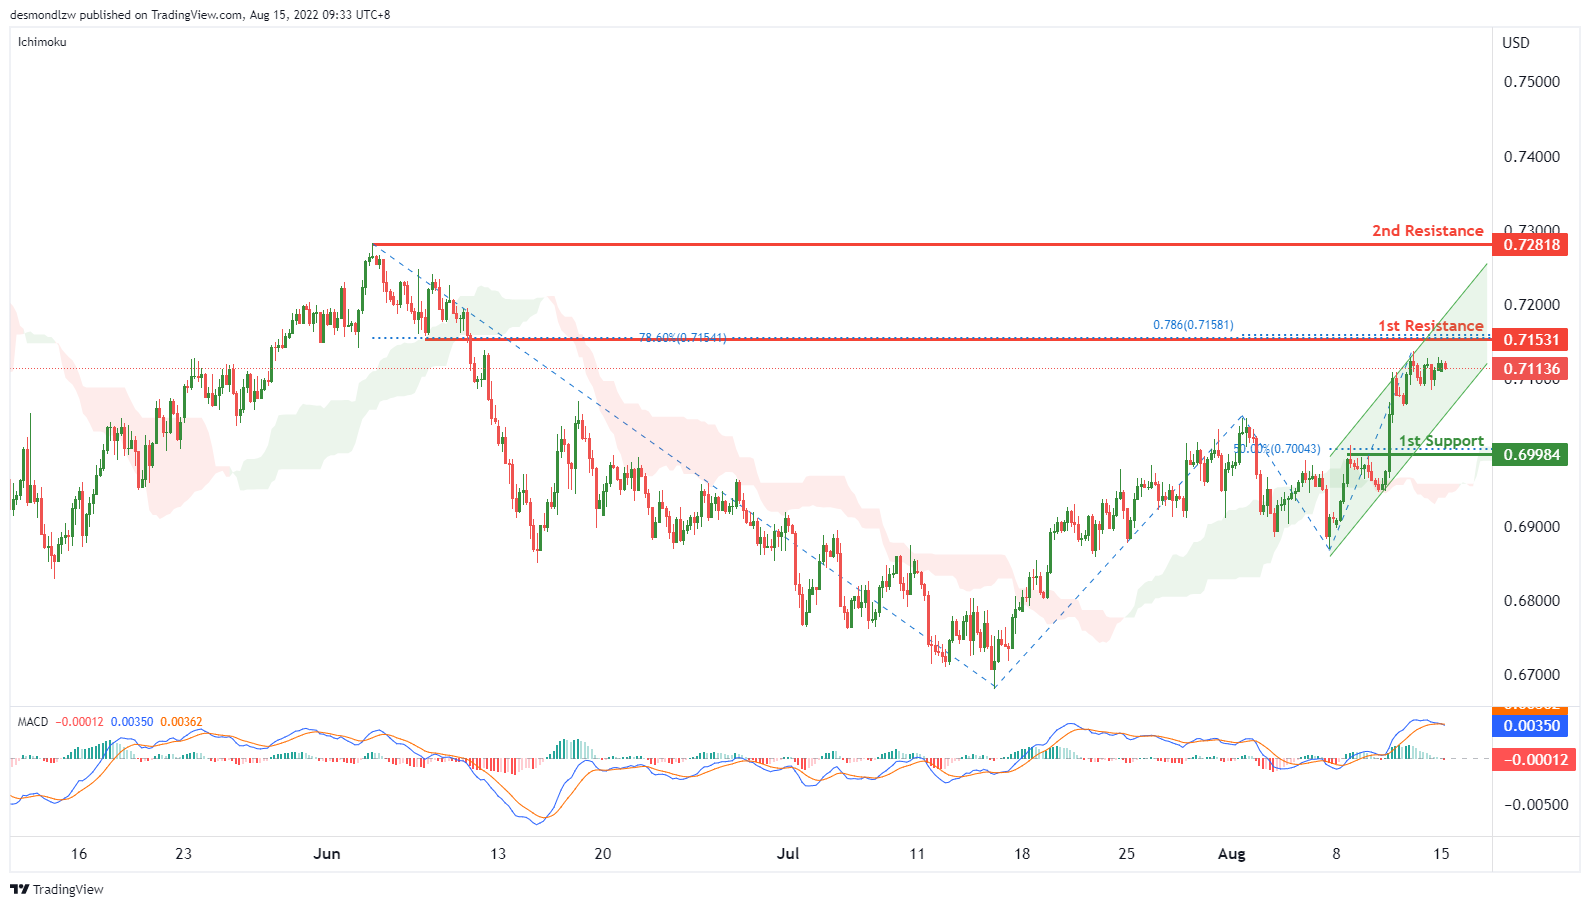
On the H4, with the price is moving within the ascending channel and over ichimoku cloud, we have a bullish bias that price may rise from the 1st resistance at 0.71531, where the 78.6% fibonacci projection, 78.6% fibonacci retracement and swing low are pullback support and 23.6% fibonacci retracement are to the 2nd resistance at 0.72818, which is in line with the swing high. Alternatively,as the MACD histograms are under zero, and DIF is almost crossing the signal line, price may drop to the 1st support at 0.69984 which is in line with 50% fibonacci retracement and pullback support.
Areas of consideration
- H4 1st resistance at 0.71531
- H4 2nd resistance at 0.72818
NZD/USD:
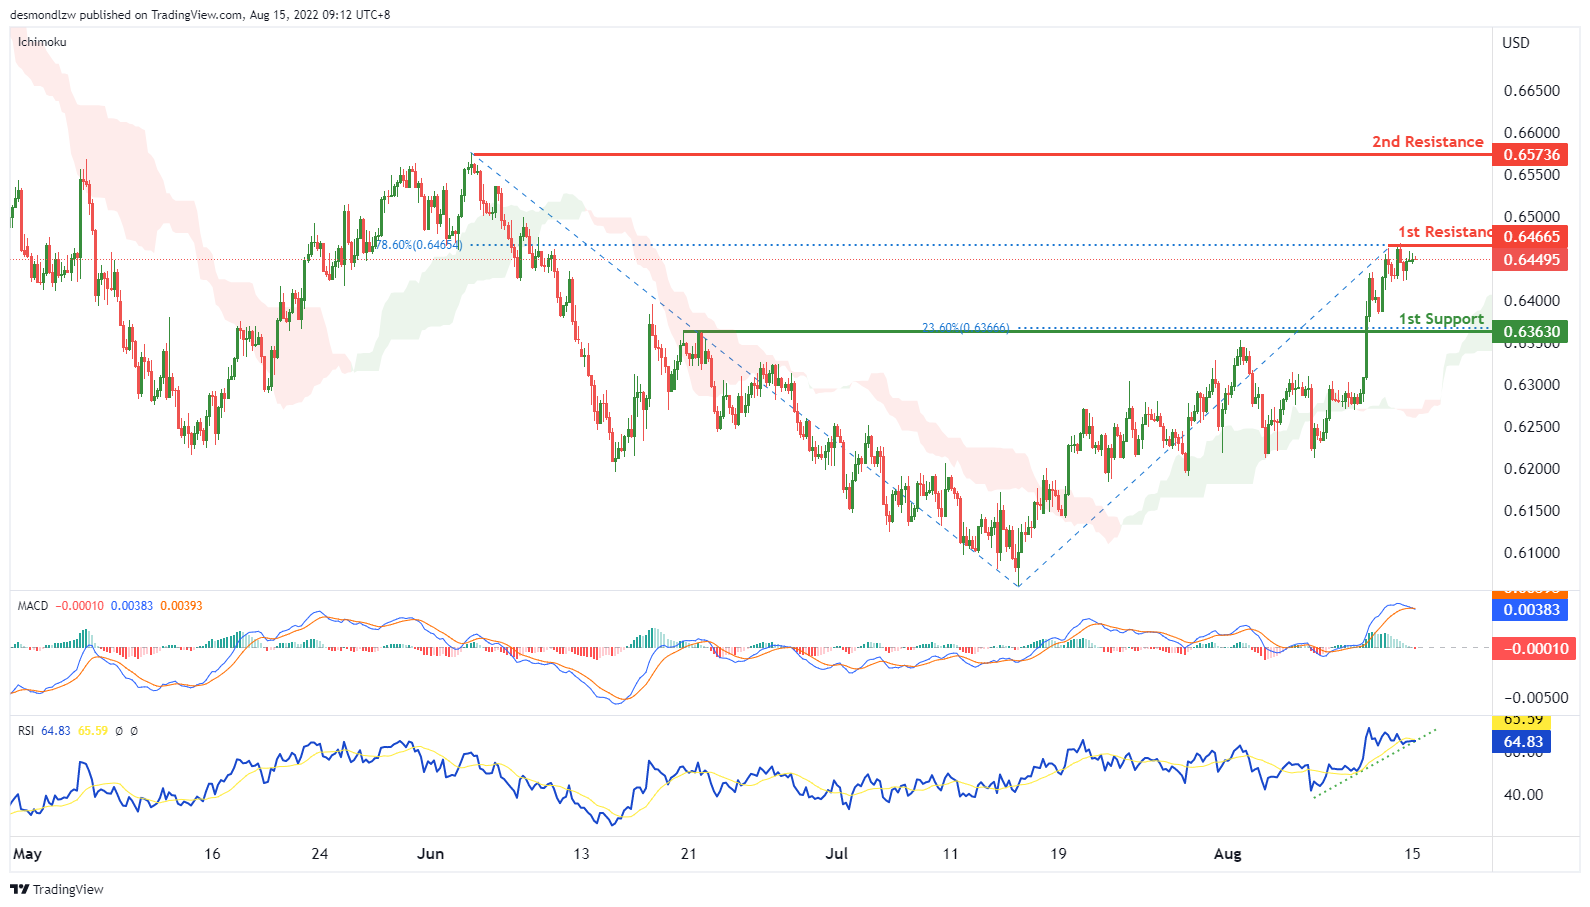
On the H4, with the price is over ichimoku cloud and RSI is moving along the ascending trendline, we have a bullish bias that price may rise from the 1st resistance at 0.64665, where the swing high and 78.6% fibonacci retracement are to the 2nd resistance at 0.65736 where the swing high is. Alternatively, as the MACD histograms are under zero, and DIF is almost crossing the signal line, the price may drop to the 1st support at 0.63630 which is in line with 23.6% fibonacci retracement and overlap support.
Areas of consideration:
- H4 time frame, 1st resistance at 0.64665
- H4 time frame, 2nd resistance at 0.65736
USD/CAD:
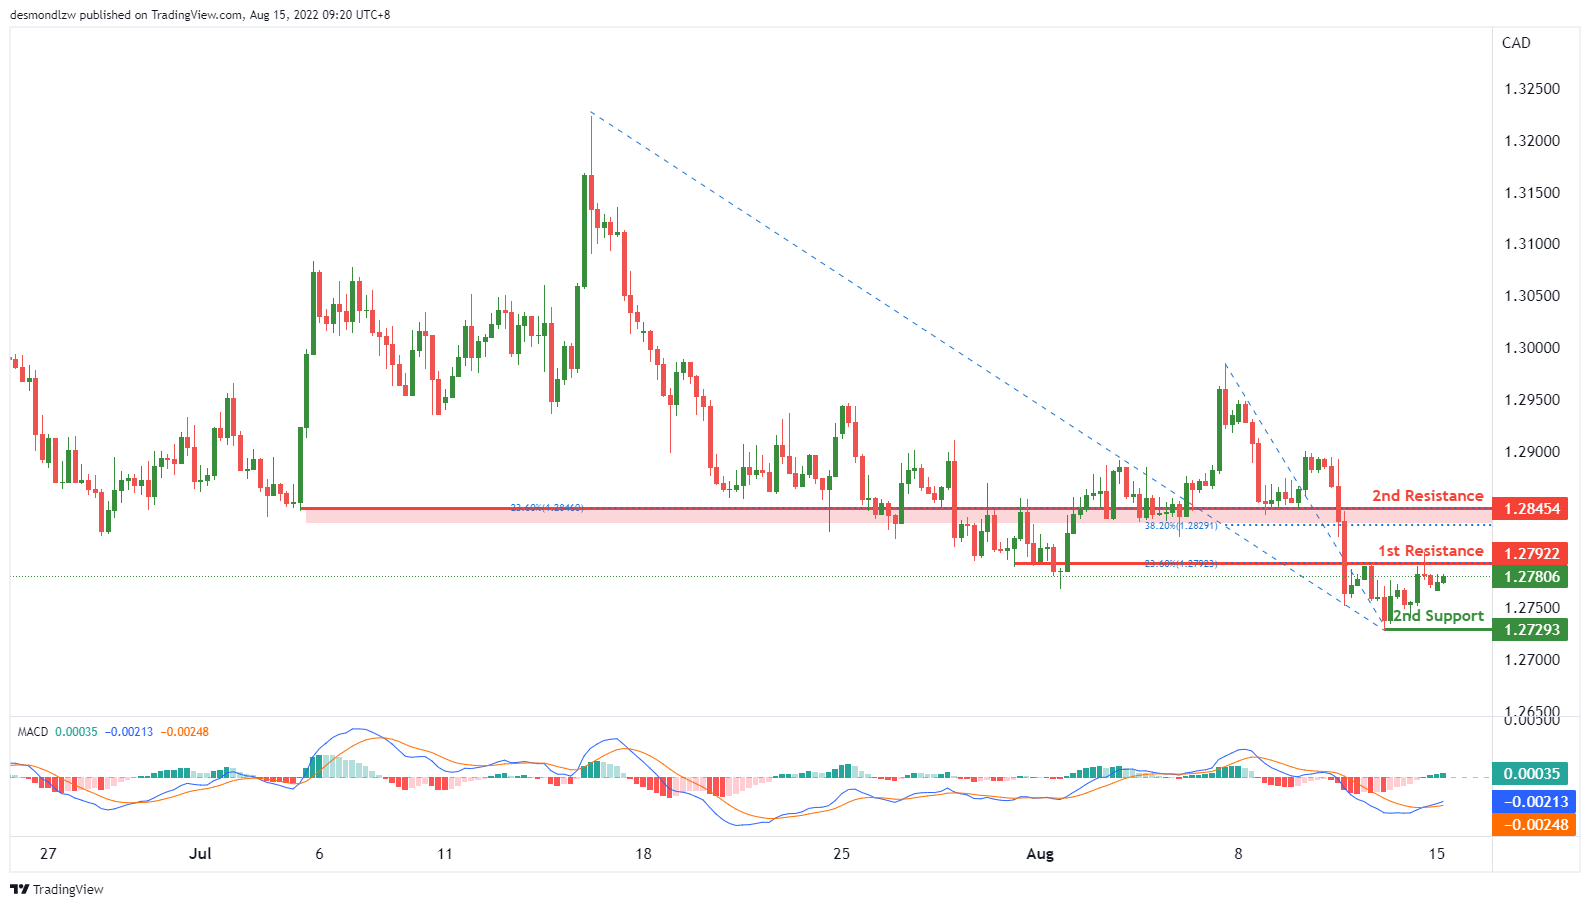
On the H4, in MACD, the DIF is crossing above the signal line, and histograms are above the zero, we have a bullish bias that the price may rise from the 1st resistance at 1.27922, which is in line with the 23.6% fibonacci retracement and overlap resistance to the 2nd resistance at 1.28454, which is in line with the 23.6% fibonacci retracement, 38.2% fibonacci retracement and overlap support. Alternatively, the price may drop to the 1st support at 1.27293, which is in line with the swing low.
Areas of consideration:
- H4 time frame, 1st resistance at 1.27922
- H4 time frame, 2nd resistance at 1.28454
OIL:
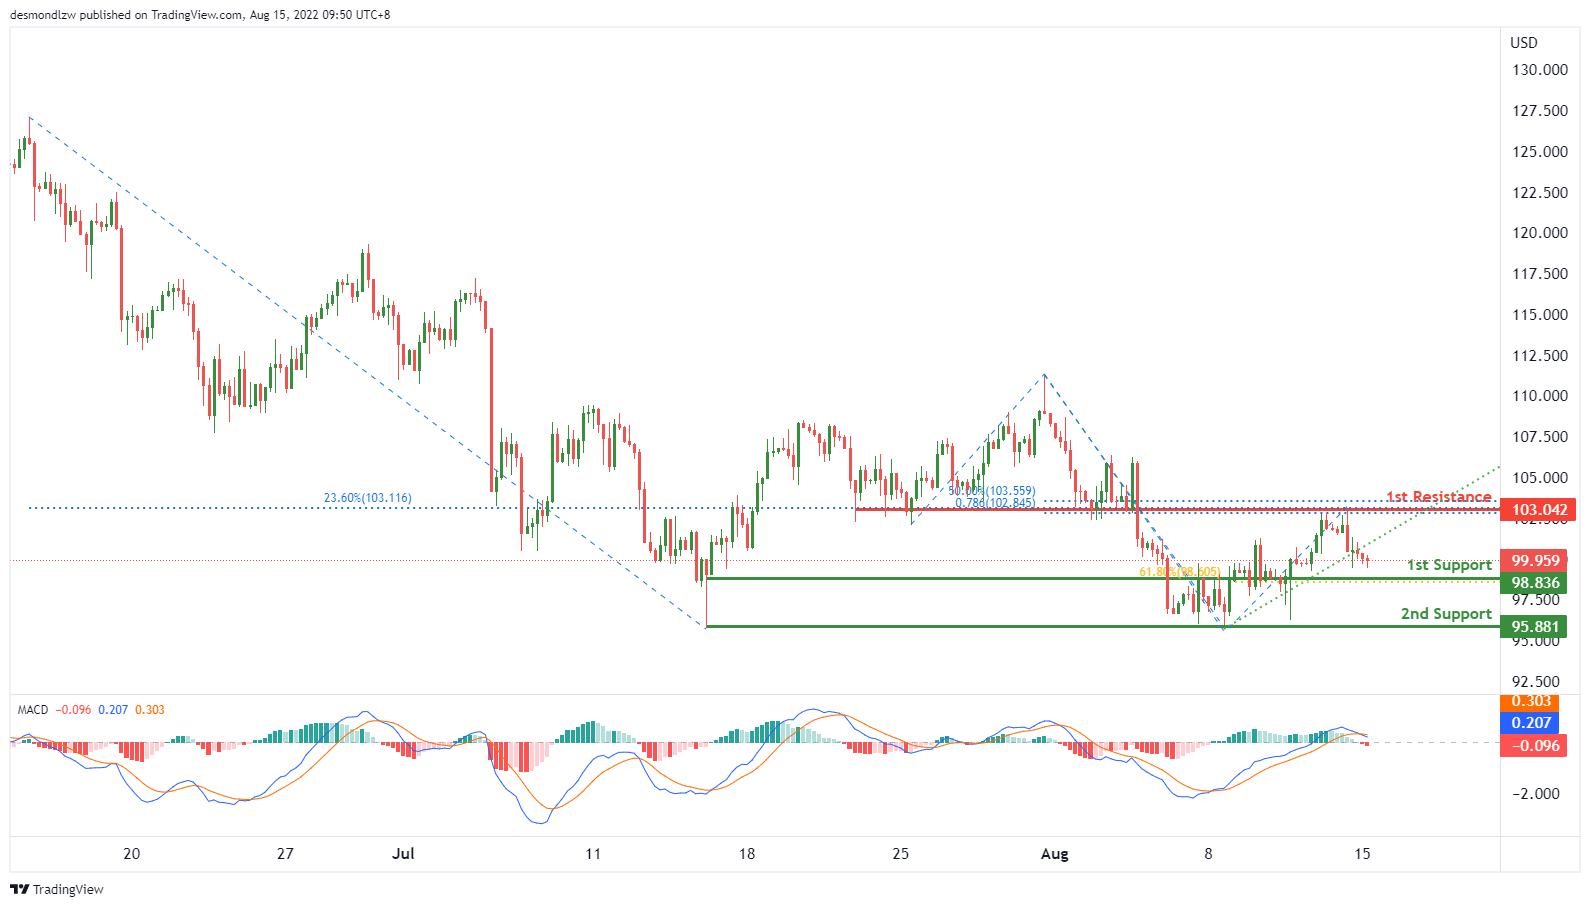
On the H4, with price breaking the ascending trendline and the DIF is crossing below signal line, we have a bearish bias that the price may drop from our 1st support at 98.836, which is in line with the 61.8% fibonacci retracement to the 2nd support at 95.881, which is in line with the swing low support. Otherwise, the price may rise to our 1st resistance at 103.042, which is in line with the overlap support, 50% fibonacci retracement, 23.6% fibonacci retracement and 78.6% fibonacci projection.
Areas of consideration:
- H4 time frame, 1st resistance at 103.213
- H4 time frame, 2nd resistance at 111.768
Dow Jones Industrial Average:
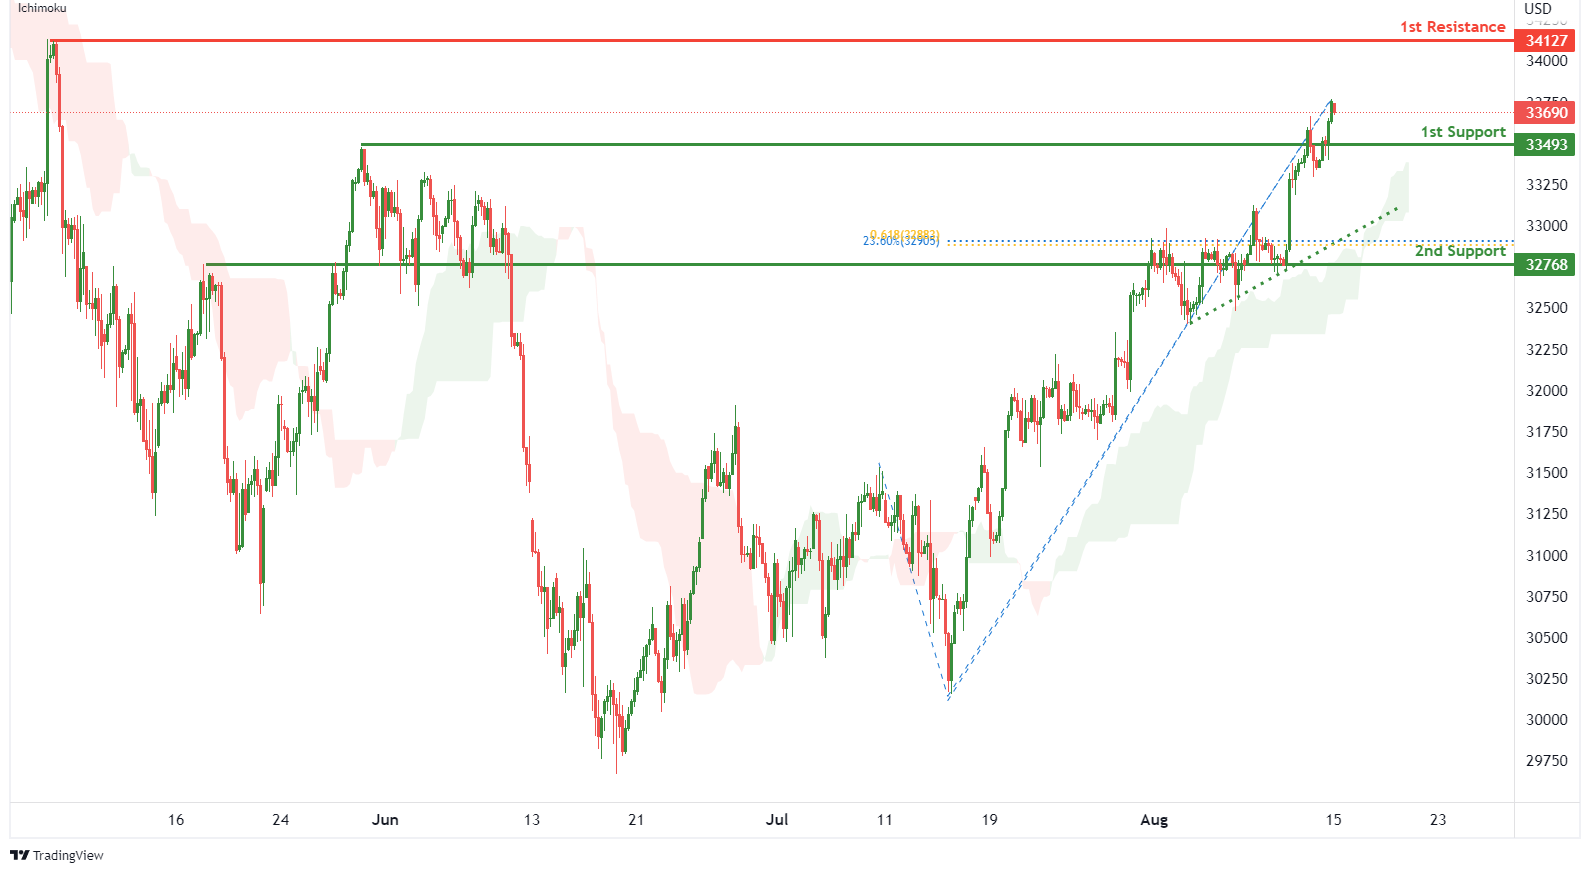
On the H4, with price moving above the ichimoku indicator and along an ascending trendline, we have a bullish bias that price will rise from our 1st support at 33493 where the pullback support is to the 1st resistance at 34127 where the swing high resistance is. Alternatively, price could break 1st support structure and drop to 2nd support at 32768 where the pullback support, 23.6% fibonacci retracement and 61.8% fibonacci projection are.
Areas of consideration:
- H4 time frame, 1st resistance of 34127
- H4 time frame, 1st support at 33493
DAX:
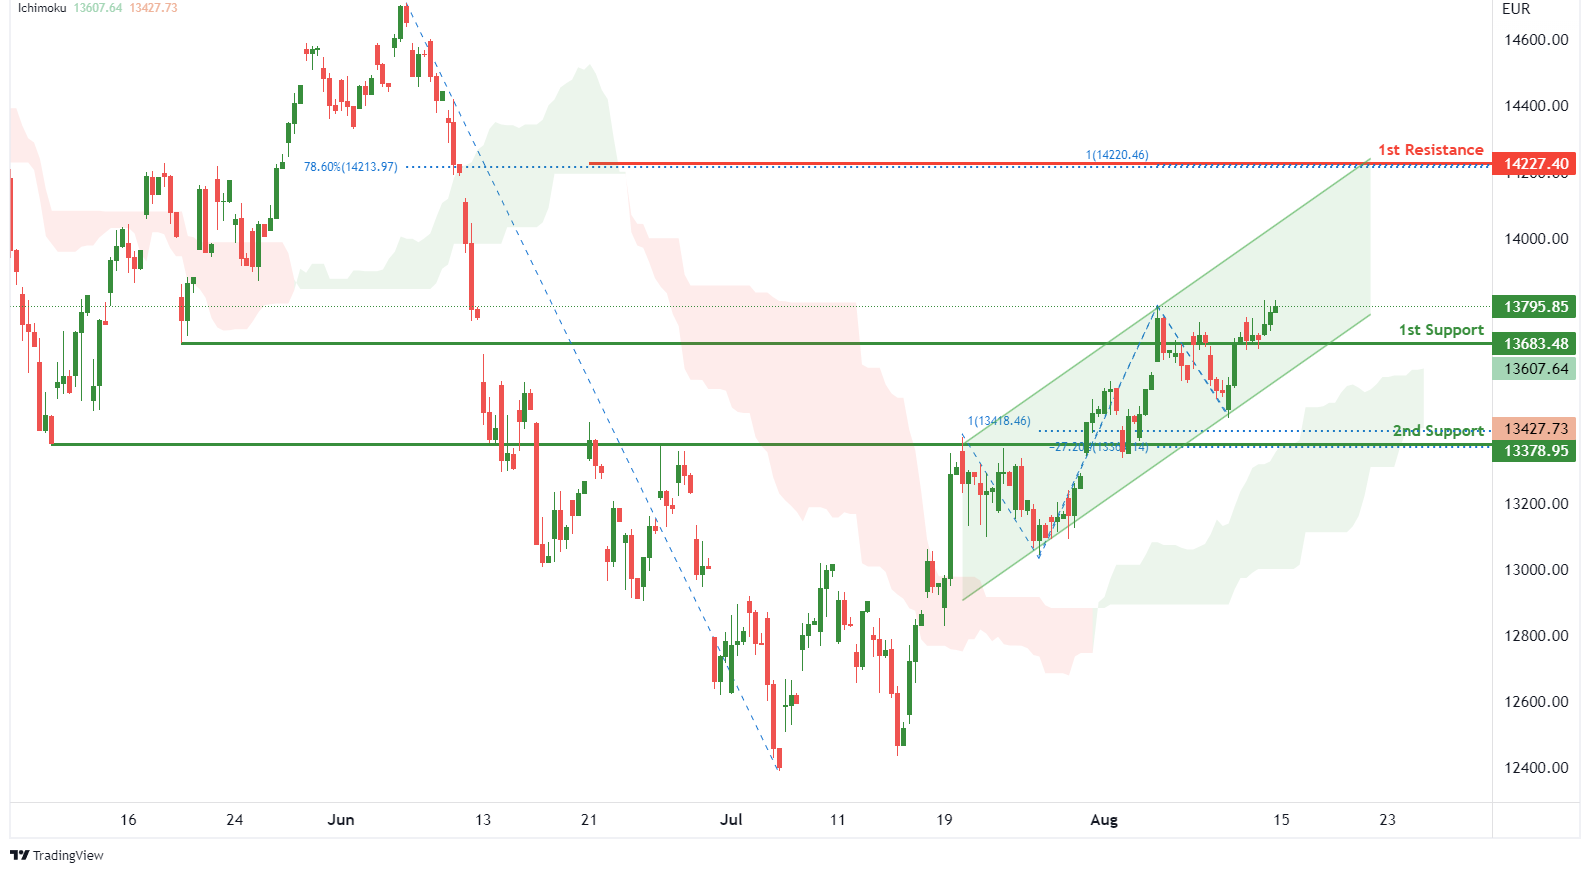
On the H4, with price moving above the ichimoku indicator and within the ascending channel, we have a bullish bias that price will rise from 1st support at 13683.48 where the pullback support is to the 1st resistance at 14227.40 in line with 100% fibonacci projection and 78.6% fibonacci retracement. Alternatively, price could break 1st support and drop to 2nd support at 13378.95 where the overlap support, -27.2% fibonacci expansion and 100% fibonacci projection are.
Areas of consideration:
- H4 time frame, 1st resistance of 14227.40
- H4 time frame, 1st support at 13683.48
ETHUSD:
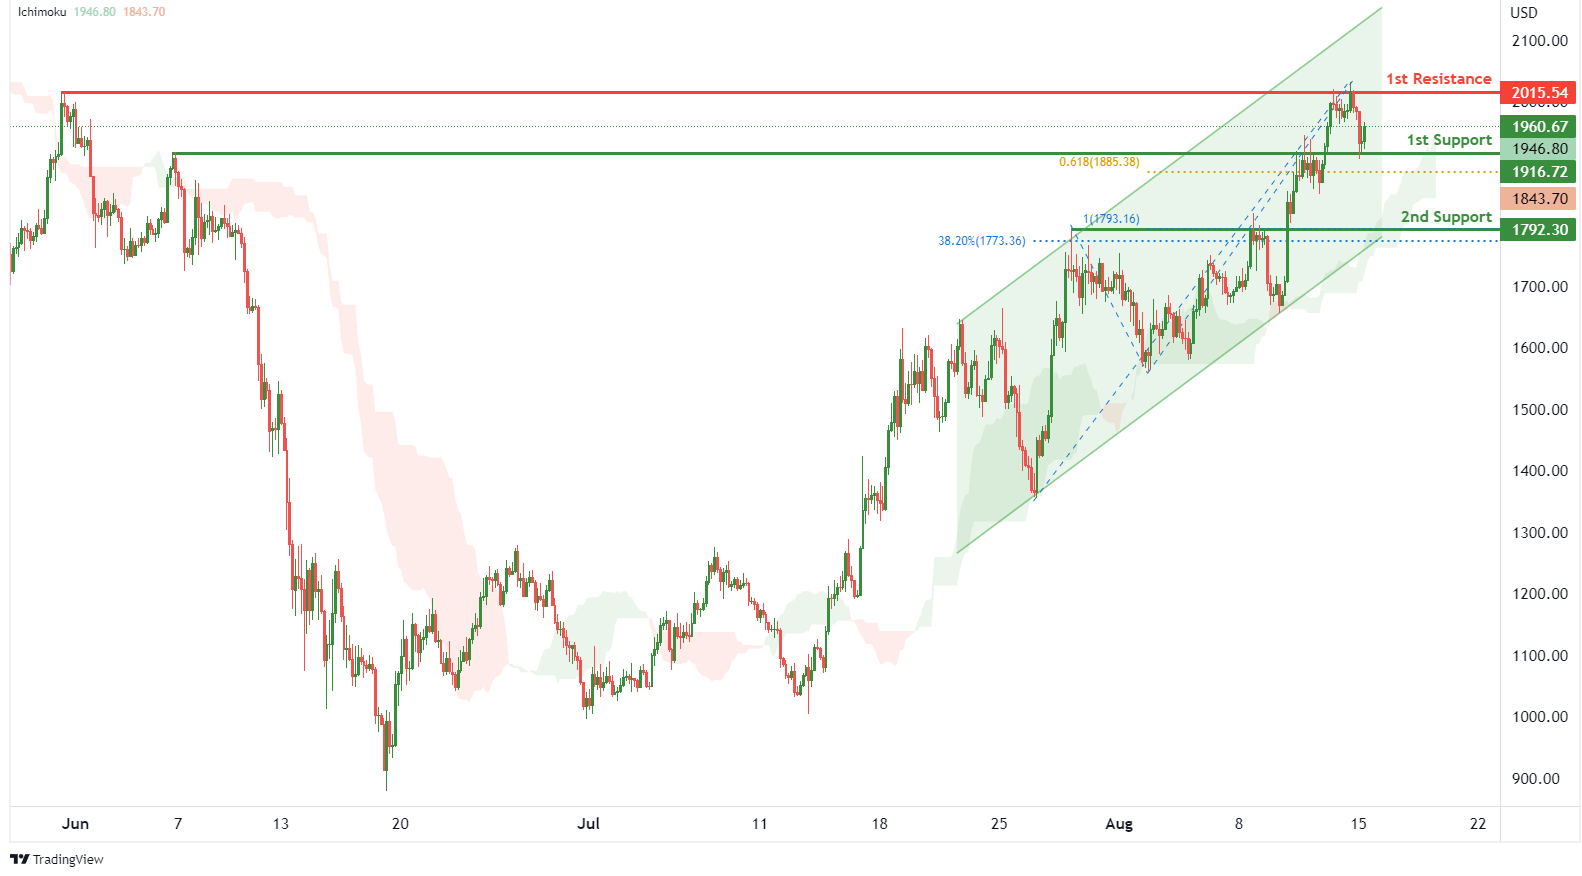
On the H4, with price moving within an ascending channel and above the ichimoku indicator, we have a bullish bias that price will rise from 1st support at 1916.72 where the pullback support and 61.8% fibonacci projection are to the 1st resistance at 2015.54 where the swing high resistance is. Alternatively, price could break 1st support structure and drop to 2nd support at 1792.30 where the overlap support, 38.2% fibonacci retracement and 100% fibonacci projection are.
Areas of consideration:
- H4 time frame, 1st resistance of 2015.54
- H4 time frame, 1st support at 1916.72
BTCUSD:
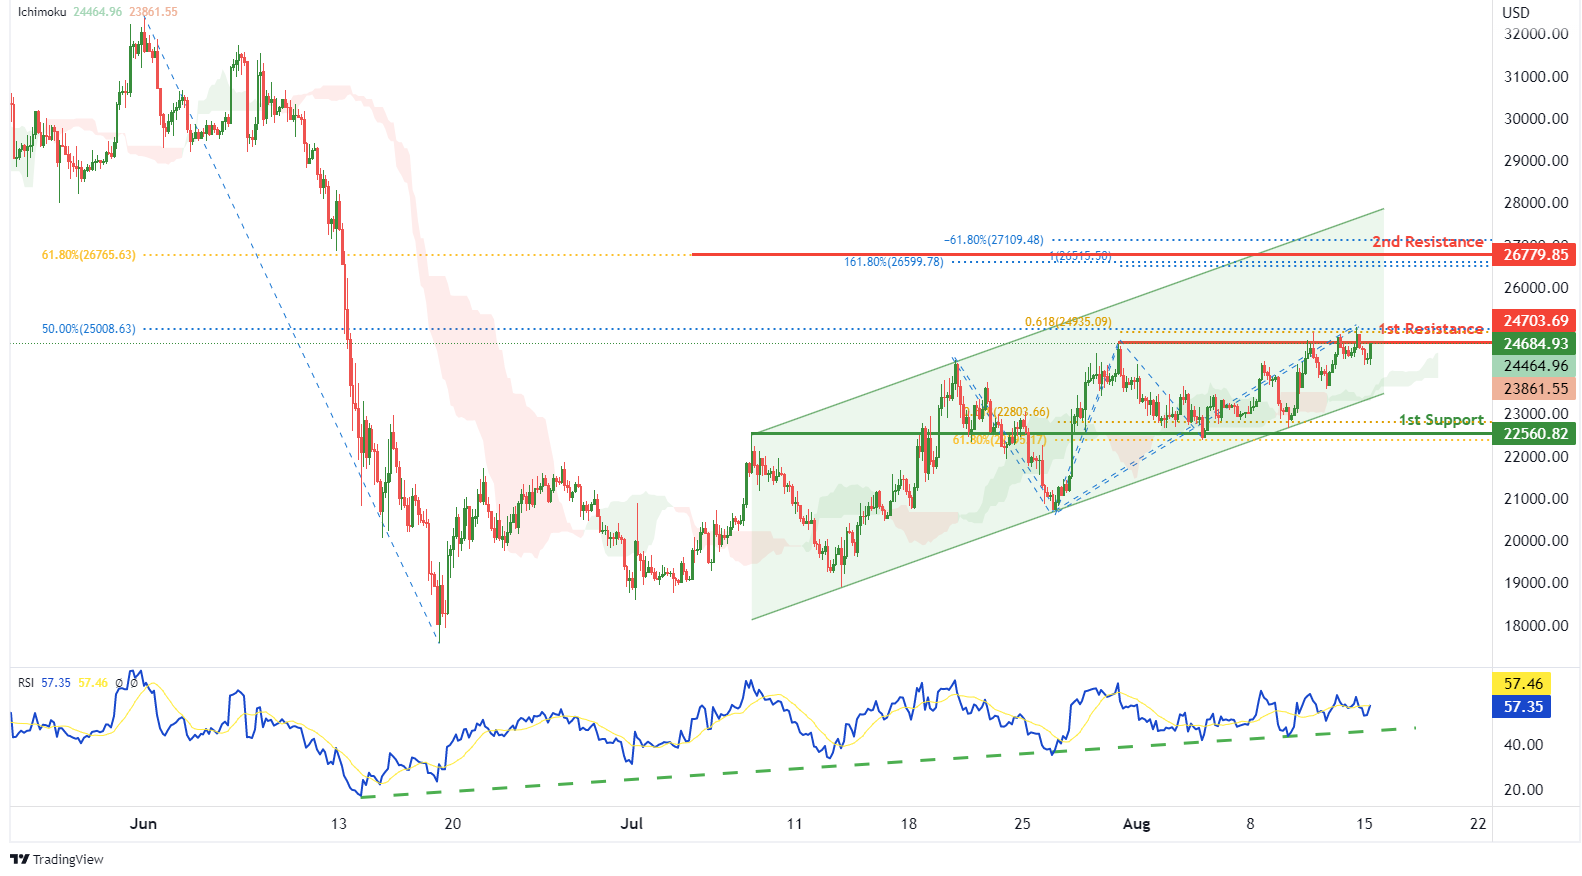
On the H4, with price moving within a bullish channel as well as above the ichimoku indicator and RSI moving along an ascending trendline, we have a bullish bias that price will rise to our 1st resistance at 24703.69 where the swing high resistance, 50% fibonacci retracement and 61.8% fibonacci projection are. Once there is upside confirmation that price has broken 1st resistance structure, we would expect bullish momentum to carry price to 2nd resistance at 26779.85 where the 61.8% fibonacci retracement, -61.8% fibonacci expansion, 161.8% fibonacci extension and 100% fibonacci projection are. Alternatively, price could drop to 1st support at 22560.82 where the pullback support, 61.8% fibonacci retracement and 61.8% fibonacci projection are.
Areas of consideration:
- H4 time frame, 1st resistance of 24703.69
- H4 time frame, 1st support at 22560.82
S&P 500:
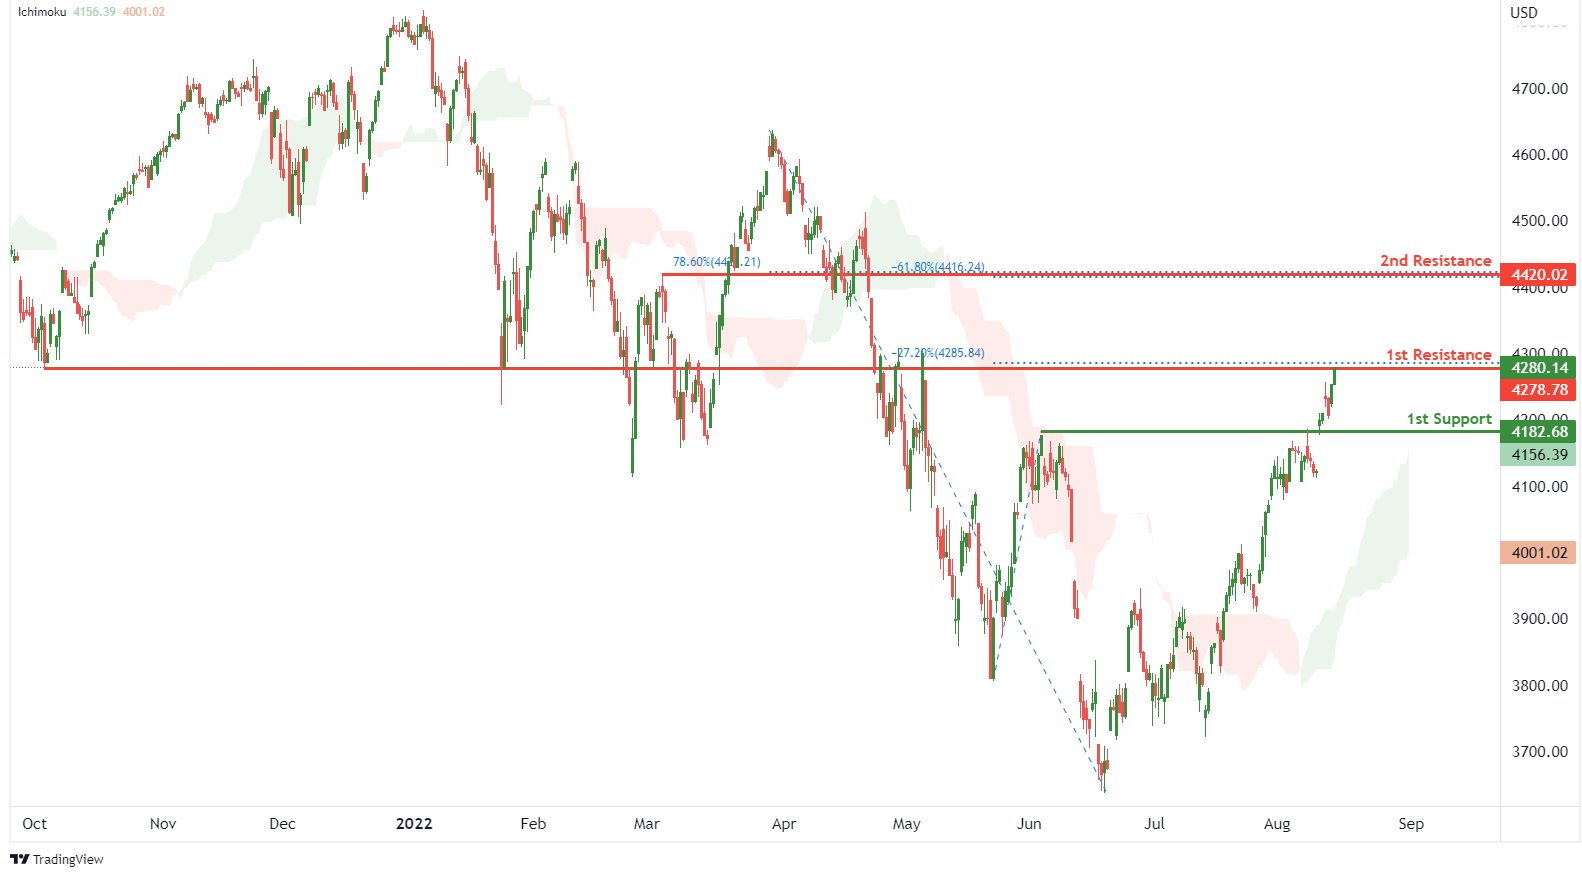
On the H4, with prices moving above the ichimoku indicator, we have a bullish bias that price will rise to 1st resistance at 4278.78 where the overlap resistance and -27.2% fibonacci expansion are. Once there is upside confirmation that price has broken 1st resistance structure, we would expect bullish momentum to carry price to 2nd resistance at 4420.02 where the pullback resistance, 78.6% fibonacci retracement and -61.8% fibonacci expansion are. Alternatively, price could drop to 1st support at 4182.68 where the pullback support is.
Areas of consideration:
- H4 time frame, 1st resistance of 4278.78
- H4 time frame, 1st support at 4182.68
EUR/USD Holds Support, Can Bulls Save The Day?
Key Highlights
- EUR/USD struggled to stay above the 1.0350 pivot zone.
- A major bullish trend line is forming with support near 1.0235 on the 4-hours chart.
- Gold price rallied further above the $1,780 resistance.
- GBP/USD started a downside correction from the 1.2280 resistance zone.
EUR/USD Technical Analysis
The Euro gained pace above the 1.0220 resistance zone against the US Dollar. EUR/USD even cleared the 1.0250 and 1.0300 levels before the bears appeared.
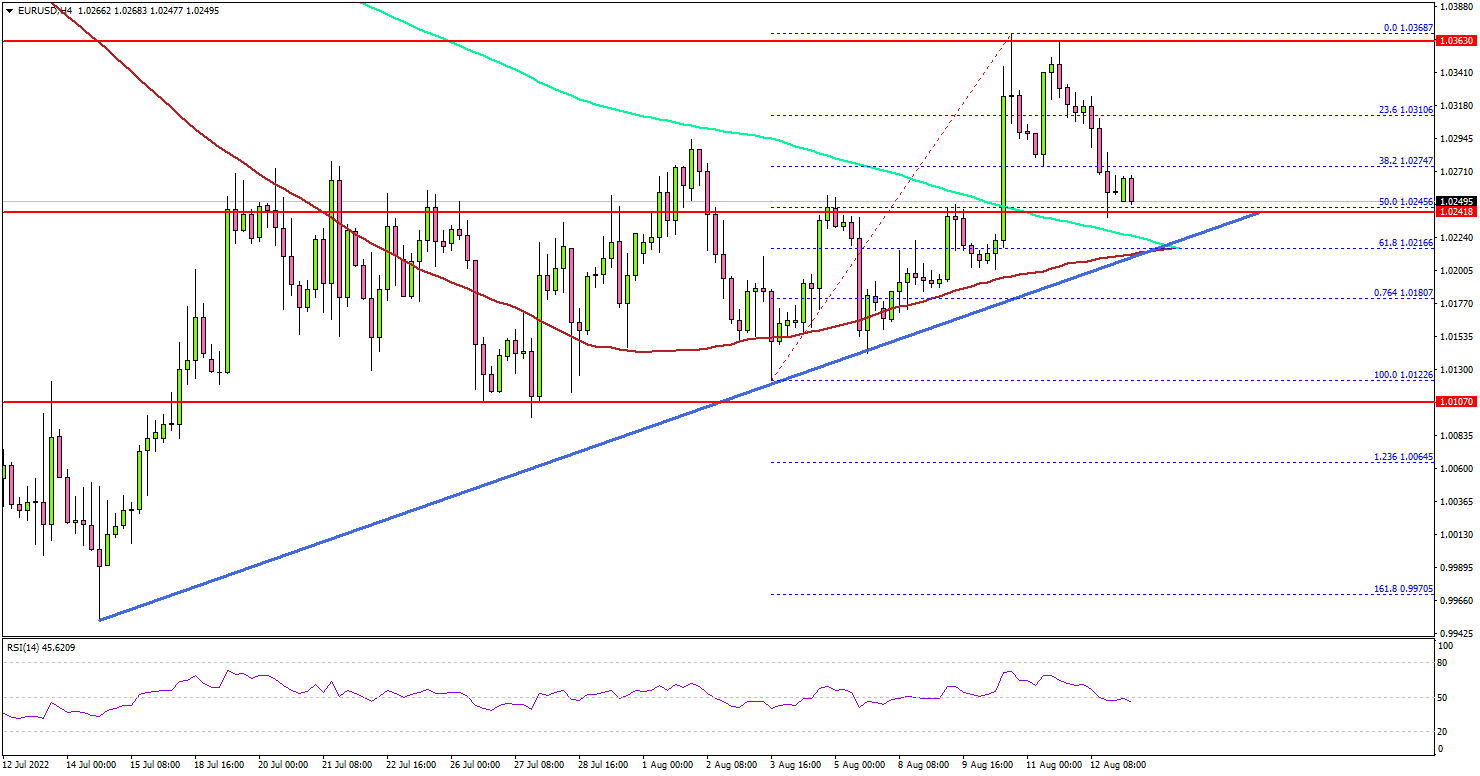
Looking at the 4-hours chart, the pair settled above the 1.0250 level, the 100 simple moving average (red, 4-hours), and the 200 simple moving average (green, 4-hours). There was a spike above the 1.0350 level and the pair traded as high as 1.0368.
The pair is now correcting lower and trading below the 1.0300 level. There was a test of the 50% Fib retracement level of the upward move from the 1.0122 swing low to 1.0368 high.
On the downside, there is a decent support forming near 1.0235 level. There is also a major bullish trend line forming with support near 1.0235 on the same chart.
The main support is now forming near the 1.0200 level. A downside break below the 1.0200 support might spark more losses. The next major support is near the 1.0150 level. Any more losses might send the pair towards the 1.0100 zone.
On the upside, the pair is facing resistance near the 1.0320 level. The next major resistance is near the 1.0350 level. A clear move above the 1.0350 resistance might send the pair higher towards the 1.0400 level.
The next major resistance is 1.0420, above which the pair could accelerate higher. In the stated case, the pair could rise towards the 1.0500 resistance zone in the near term.
Looking at GBP/USD, the pair climbed higher above the 1.2220 resistance level, but it failed to gain strength above the 1.2280 level and corrected lower.
Economic Releases
- NY Empire State Manufacturing Index for August 2022 – Forecast 8.5, versus 11.1 previous.