Sample Category Title
RBNZ to Deliver Another Double Hike, Spotlight on OCR Projections
After nearly two weeks of absence, central banks return to the agenda, with the Reserve Bank of New Zealand taking the torch on Wednesday, at 02:00 GMT. The Bank is widely expected to deliver another 50bps liftoff and thus, a hike of this size by itself may not excite NZD traders. Any market reaction could come from the Bank’s updated official cash rate (OCR) projections.
July decision points to willingness for more tightening
At its latest gathering, the RBNZ decided to deliver its third double hike, taking the number of consecutive liftoffs since it began this tightening cycle to six. The Committee agreed to continue lifting the OCR to a level where they are confident that inflation will settle within the 1-3% target range, staying comfortable with the rate path outlined in the May Monetary Policy Statement (MPS).
Although there was some speculation beforehand that the Bank could soften its rhetoric due to deterioration in businesses and consumer confidence, and an accelerating decline in house prices, the minutes revealed that household spending has remained resilient and that rising mortgage rates will help take house prices to more sustainable levels.
What is the data saying?
Since then, data showed that New Zealand’s CPI accelerated from 6.9% YoY to 7.3% in Q2, the fastest pace in three decades, allowing some market participants to add a few bets with regards to a 75bps liftoff. The unemployment rate ticked up just a tenth of a percentage point above its Q1 historic low of 3.2%, while the Labor Costs Index accelerated to a 14-year high of 3.4%.
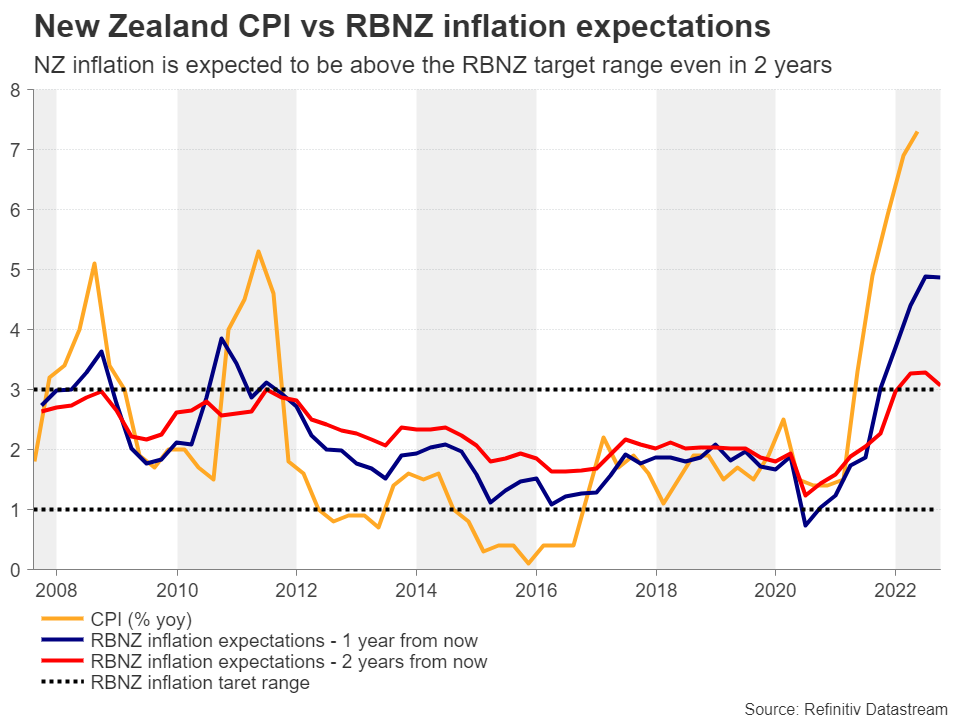
Although this may have widened the smile of those betting for a triple hike, yesterday, the Real Estate Institute of New Zealand said that house prices fell 2.8% more in July compared to June, recording their first annual fall since 2011. Also, let’s not forget that the whole economy of New Zealand contracted in Q1, albeit marginally.
What does the market expect and how could it respond?
Thus, the latter data does not add credence to the idea of a triple hike, but it does not suggest that the RBNZ could turn dovish either. Indeed, market pricing implies a 12% chance for a 75bps increase, but the remaining 88% is assigned to another 50bps one. After all, officials already had the Q1 GDP data in hand when they made their minds in July, while a 1.6% YoY slide in house value may not be as concerning as a 7.3% YoY inflation rate.
A fourth double hike will not come as a surprise and is unlikely to be the reason for any reaction in the kiwi. Participants may quickly lock their gaze on the accompanying statement and especially the new projected path of the OCR. According to the May MPS, the OCR is expected to top at 3.95 in Q3 2023, with a 25bps fully priced in Q1 2025. On the other hand, the financial community sees faster hikes in the short run, expecting the same peak in April 2023, but they also expect rates to start falling just thereafter.
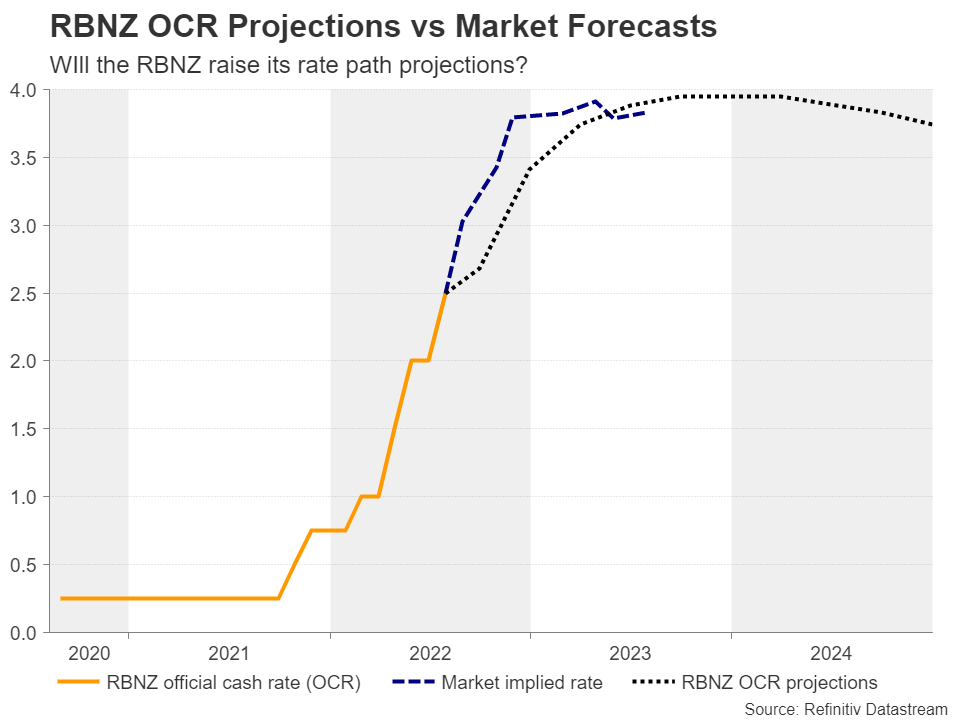
Thus, for the New Zealand dollar to extend its latest recovery, the RBNZ may need, not only to bring forth its rate path projections, but to also keep the timing of when it expects rates to start falling beyond that implied by the market. With the Bank itself expecting inflation to be around 4.9% YoY one year from now, and still above the upper end of its 1-3% target range in two years, that scenario appears to be very likely. Kiwi/dollar could extend its latest recovery and perhaps challenge the 0.6565 zone, marked by the peaks of May 5 and June 3. A break higher could send it towards the 0.6720 zone.
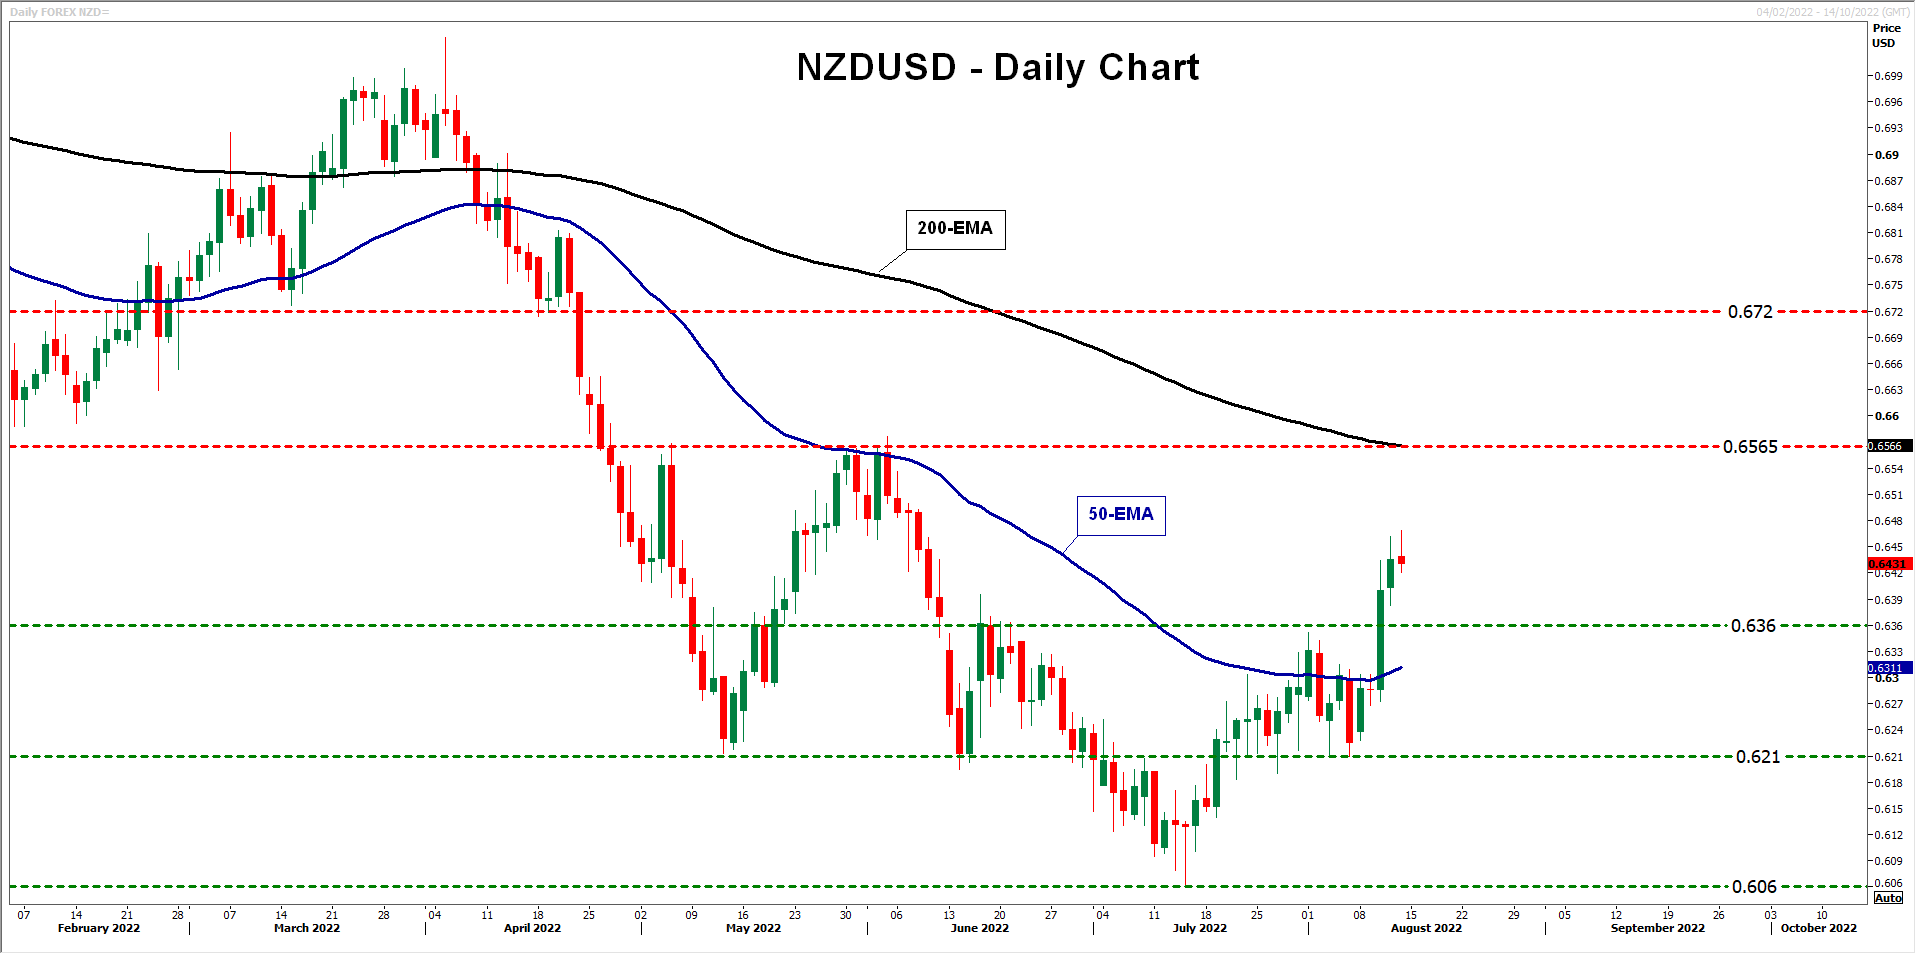
For a decent retreat to be signaled, the Bank may have to bring forth the timing of when it expects to start cutting rates and/or signal a lower peak. This could take the kiwi below the key 0.6360-dollar mark, allowing a dive towards the 0.6210 support, the break of which could set the stage for the 2-year low of July 14, at 0.6060.
Week Ahead – A Plethora of Data, RBNZ Meeting, Nut Focus on Fed Minutes
There will be no shortage of data releases in the coming week and the RBNZ is poised to hike rates again. But with investors still undecided about the implications of the latest US inflation report on Fed policy, the FOMC minutes might steal the limelight. Meanwhile, thinning liquidity as more traders head for their holiday destinations increases the likelihood of big knee-jerk reactions as markets obsess about the pace of monetary tightening and the risks of a recession.
RBNZ leading the tightening race
The Reserve Bank of New Zealand is tipped to lift its official cash rate (OCR) for the seventh straight meeting on Wednesday, becoming the first major central bank to take borrowing costs as high as 3% in this cycle. However, the hawkish posturing may be reaching the end of the line and there are downside risks for the New Zealand dollar from the meeting.
Back in May, the Bank had forecast that the OCR would peak just below 4% by September 2023. That means there would only be a 100-basis-point increase remaining if it hikes rates by 50 bps in August as expected. But that is assuming that the rate path doesn’t get revised lower.
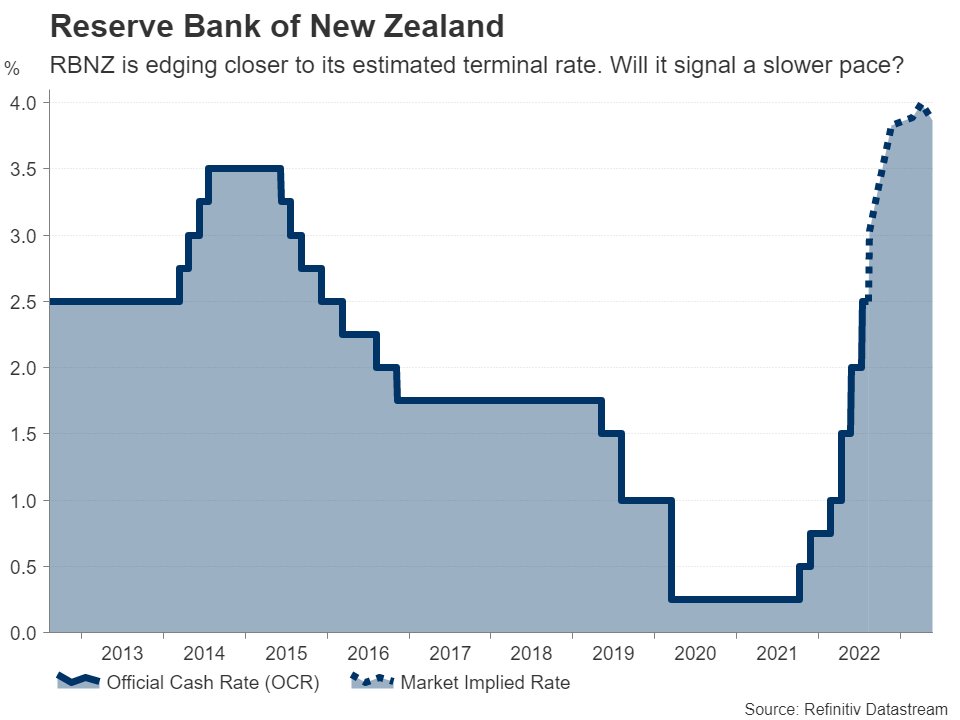
The RBNZ will publish updated forecasts in its quarterly Monetary Policy Statement and given the recent easing in energy and other commodity prices, policymakers might predict a slightly lower terminal rate. But it’s not just the inflation outlook that’s changing. Economic growth is slowing too.
Consumption in New Zealand has been subdued lately and the jobless rate unexpectedly ticked up in the second quarter, prompting policymakers to emphasize the negative risks to growth in the July policy statement.
Hence, the kiwi, whose rebound versus the US dollar picked up speed over the last week, faces the possibility of being knocked down by either a lower projection of the terminal rate or hints that the pace of tightening could soon switch to 25-bps increments, or both.
Aussie hoping for more upside before next RBA decision
In neighbouring Australia, the July employment report due Thursday will be the highlight, though wage data for the second quarter a day earlier will be important too. The Reserve Bank of Australia abandoned the use of forward guidance at its last meeting amid the uncertainty surrounding the forecasts for both inflation and growth, so the upcoming releases will likely play a significant role in swaying the odds for or against a 50-bps rate hike in September.
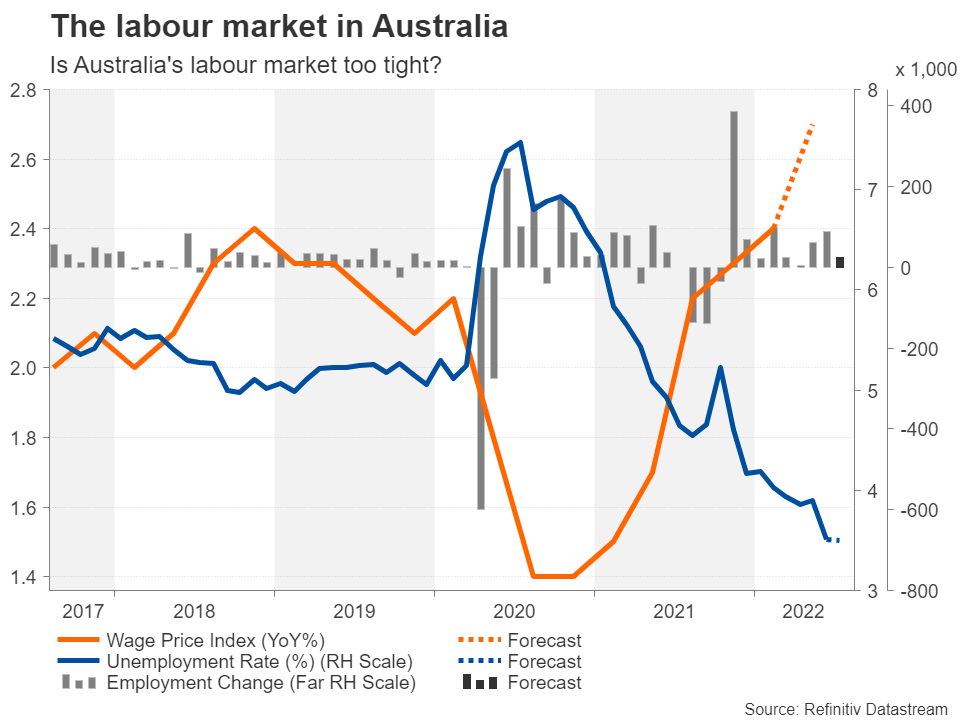
Investors widely believe the RBA will raise rates by only 25 bps next month so the scope for expectations to shift towards a 50-bps move is quite large if the job figures impress. There may also be some clues about the size of the next hike in the minutes of the August meeting out on Tuesday.
Having just surged back above the $0.70 handle, the Australian dollar could extend its strong gains if rate hike expectations are ratcheted up. Ahead of the domestic agenda, traders will be keeping an eye on some key metrics out of China on Monday. Growth in industrial output and retail sales is anticipated to have accelerated in July. If the data confirms that China’s recovery is gathering steam, there could be a boost for the aussie, as well as broader risk appetite at the start of the week.
Will retail sales and Fed minutes spoil the mood?
Signs of cooling inflation in America have tempered bets of a 75-bps rate rise by the Federal Reserve in September, hurting the dollar but reviving the stalled rally on Wall Street. It comes after both consumer and producer prices moderated in July. Next week’s slew of indicators will turn the attention back on the economic momentum.
The housing market is one of the sectors of the economy being closely watched right now for possible signs of a downturn. Building permits and housing starts for July are released on Tuesday, followed by existing home sales on Thursday.
There will be several clues on the manufacturing sector too as the New York and Philadelphia Feds publish their monthly surveys on Monday and Thursday, respectively, while industrial output is out on Tuesday.
However, most of the focus will be on Wednesday when the latest retail sales numbers and the minutes of the Fed’s July meeting are due. Retail sales likely decelerated substantially in July and analysts have pencilled in month-on-month growth of just 0.1%, after jumping by 1% in June.
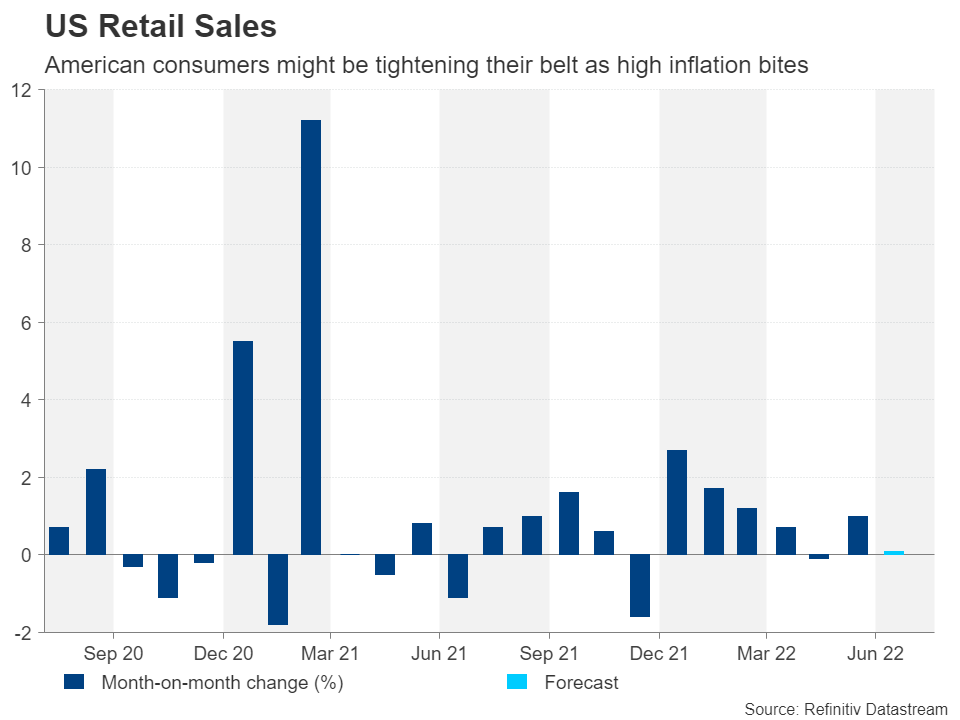
Recent data that’s been on the soft side has had a mixed effect in dampening risk sentiment despite fuelling recession fears as the negative pressure has been countered by falling Treasury yields. However, with Fed officials standing firm on their determination to get inflation down towards their 2% target even after the CPI miss, the pullback in yields has likely gone as far as it can for now.
A poor retail sales print could therefore spark a bigger reaction this time, at least in equity markets. Though, the fallout for the dollar might be more limited as investors will probably want to wait for the Fed minutes to help them make up their minds about which way policymakers will lean in September.
The minutes are unlikely to add anything new to the rate hike debate, but if they reinforce the view that the majority of FOMC members are still keen on frontloading, it could push the odds of a 75-bps increase back up, having dipped below 40% this week, while keeping Treasury yields supported.
Pound might shrug off UK data flurry
After the US, the inflation spotlight will turn to the UK where the headline rate of the consumer price index is forecast to hit a fresh four-decade high of 9.7% y/y in July. Despite the Bank of England getting an earlier start on monetary tightening than many of its peers, Britain now boasts the highest inflation rate among the major economies.
The pain on consumers is already being felt. Retail sales have grown only once this year, in April, and are projected to have been flat in July.
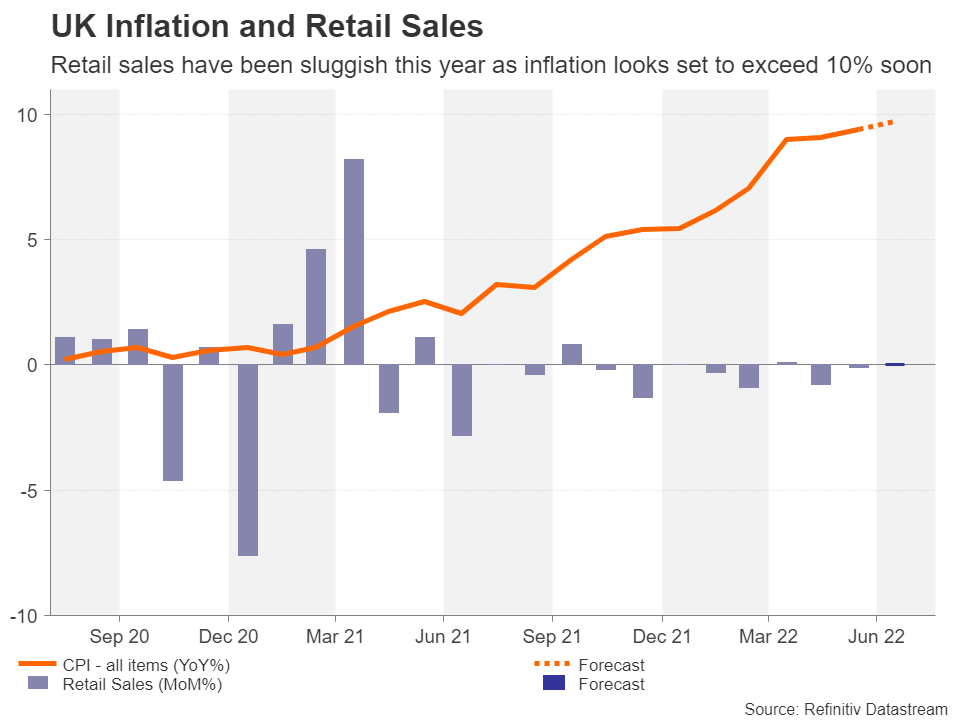
With neither the CPI figures on Wednesday, nor Friday’s retail sales estimates likely providing much cheer, there might be some good news from Tuesday’s labour market report, as the unemployment rate is expected to have held steady at 3.8% in the three months to June.
Although strong employment numbers might offer some support to sterling, another jump in CPI would probably heighten the risk of stagflation following the contraction in UK GDP in the second quarter, weighing on the currency.
Canadian and Japanese inflation data on tap
Inflation readings are also due in Canada and Japan next week. The Canadian CPI data, out on Tuesday, will be followed by producer prices and retail sales figures on Friday. Japanese traders on the other hand will be watching the Q2 GDP estimate on Monday ahead of Friday’s inflation stats.
Japan’s economy is predicted to have expanded by a solid 0.6% q/q in the June quarter, helped by stronger consumption and a rebound in exports. Inflation, meanwhile, is expected to have heated up in July, with core CPI edging up to 2.4% y/y.
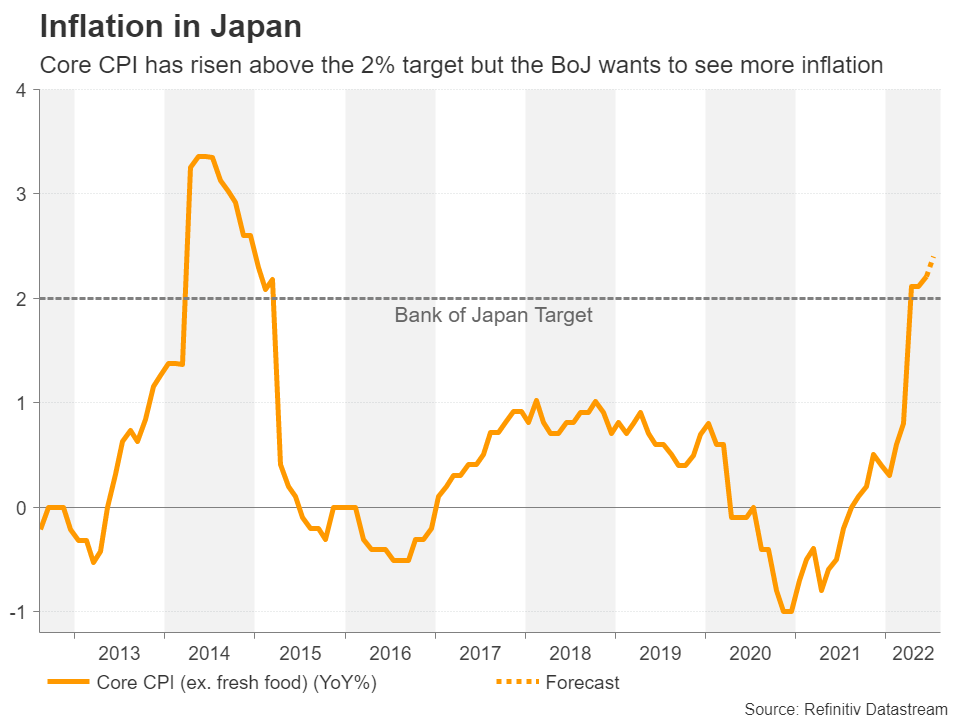
Nevertheless, upbeat numbers would probably do little to defend the yen when US yields are being bolstered by renewed hawkish rhetoric from the Fed. Aside from widening yield spreads, Japan’s growing trade deficit has also been a sore point for the safe-haven Japanese currency amid soaring energy costs. Trade data out on Wednesday is expected to show the deficit rose in July, with energy-driven imports far outstripping the jump in exports.
A new headache for the euro
In Europe, it’s going to be a quieter week as the only key releases are the second GDP estimate for Q2 (Wednesday) and the final CPI reading for July (Thursday). Germany’s ZEW economic sentiment gauge on Tuesday might attract some attention too, while outside of the euro area, the Norwegian krone will be on standby for a repeat by the country’s central bank of the double hike from the last meeting when it sets rates again on Thursday.
But when it comes to the euro, investors will probably be more interested in headlines concerning the Rhine River – a major transport route for Europe, particularly Germany. The worsening drought on the continent has led to shrinking water levels in European rivers and some ships have already started to reduce their loads.
If water levels continue to decline, it will become increasingly difficult to transport commodities and other raw materials across Europe, hitting coal and petrol shipments and exacerbating the energy crunch.
Weekly Focus – A Hot Summer Adds to Euro Area Stagflation Challenge
US CPI offered the first positive surprise on inflation in a long time being flat on the month of July versus consensus expectations of 0.2% m/m. And it was not all due to lower gasoline prices as core inflation also undershot expectations rising 0.3% m/m versus consensus of 0.5% m/m. The good news is that there are clear signs that pressure on goods prices are easing: commodity prices have come down, freight costs are lower, supply chains are easing and pricing power is weaker as demand has softened and inventories are high. We also see tentative signs that inflation expectations have peaked.
However, it is too early to declare victory over US inflation as several Fed speakers also highlighted afterwards. The labour market is still very tight and employment growth has not yet cooled down suggesting that wage growth will continue to run high. It is currently close to 6%, which is much too high to bring inflation back to 2% on a sustained way. Hence, we still look for the Fed to hike 75bp on 21 September to get rates quickly back to neutral and into restrictive area. Admittedly the probability of only 50bp has increased and the decision will most likely be determined by the next round of payrolls and inflation in early September.
In the euro zone the inflation picture has been further complicated over the summer by a strong rise in gas and electricity prices. The warm weather has increased demand for air-conditioning and curtailed electricity production due to droughts that lower water levels in reservoirs and rivers and also led to a reduction in French nuclear power production. For environmental reasons French nuclear plants face restrictions on discharging water into waterways when river temperatures get too high. French electricity prices have doubled over the past three months and are now 10 times higher than in April. The increase is set to push up inflation even further and add to recession risks, thus exacerbating the stagflationary environment.
On the geopolitical front China concluded military exercises around Taiwan in what has been the largest scale drills around Taiwan ever. It comes in response to the visit by US speaker of the House Nancy Pelosi, which in China's view is a breach of the 'One-China policy' and a further move towards supporting Taiwan independence. This week we sent out a paper looking into the background of the crisis and assessing the risk of war, see Research China: The risk of a Taiwan war and what it implies - part 1, 11 August.
Markets mainly responded to the lower-than-expected US inflation print this week by sending equities and EUR/USD higher. Bond yields initially dropped following the release but moved higher again Thursday as optimism about lower inflation and slower rate hikes faded again.
Looking into next week the main releases will be US data on retail sales, regional business surveys for August and housing data. In Europe we get the German ZEW and the final CPI print for August, which provides more details than the flash estimate. China will publish it monthly batch of industrial production, retail sales and home sales. Especially the latter will be interesting given the continued stress in the property market. Norges Bank is set to increase rates by 50bp on Thursday.
USD/JPY Mid-Day Outlook
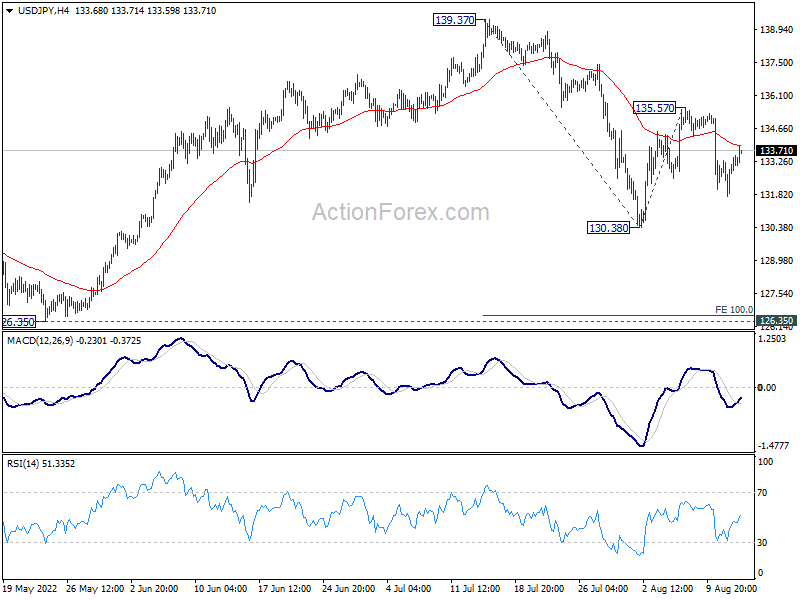
Daily Pivots: (S1) 132.04; (P) 132.67; (R1) 133.62; More...
Intraday bias in USD/JPY remains neutral for the moment. Overall outlook is unchanged that price actions from 139.37 are developing into a corrective pattern to larger up trend. Below 130.38 will target 100% projection of 139.37 to 130.38 from 135.57 at 126.58. But downside should be contained by 126.35 structure support. On the upside, above 135.57 will resume the rebound form 130.38 to retest 139.37, but firm break there is not expected even in this case.
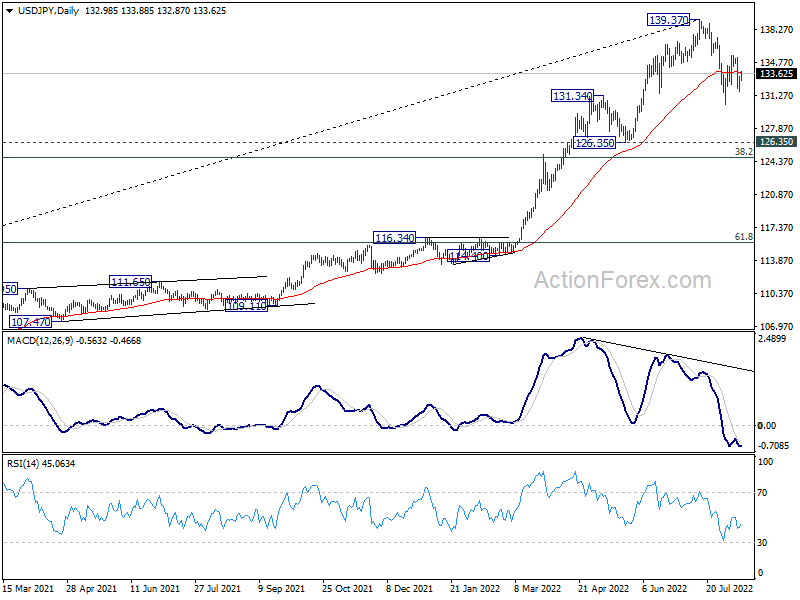
In the bigger picture, fall from 139.37 medium term top is seen as correcting whole up trend from 101.18 (2020 low). While deeper decline cannot be ruled out, outlook will stays bullish as long as 55 week EMA (now at 121.84) holds. Long term up trend is expected to resume through 139.37 at a later stage, after the correction finishes.
USD/CHF Mid-Day Outlook
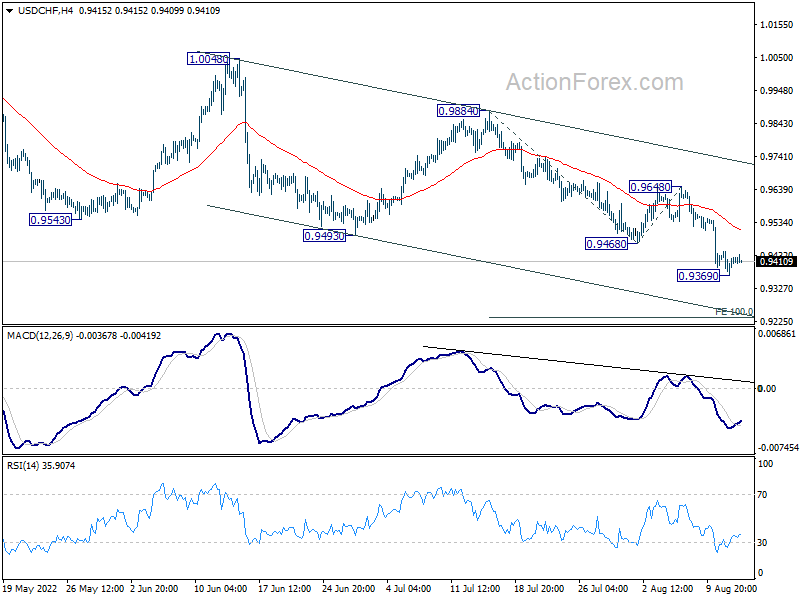
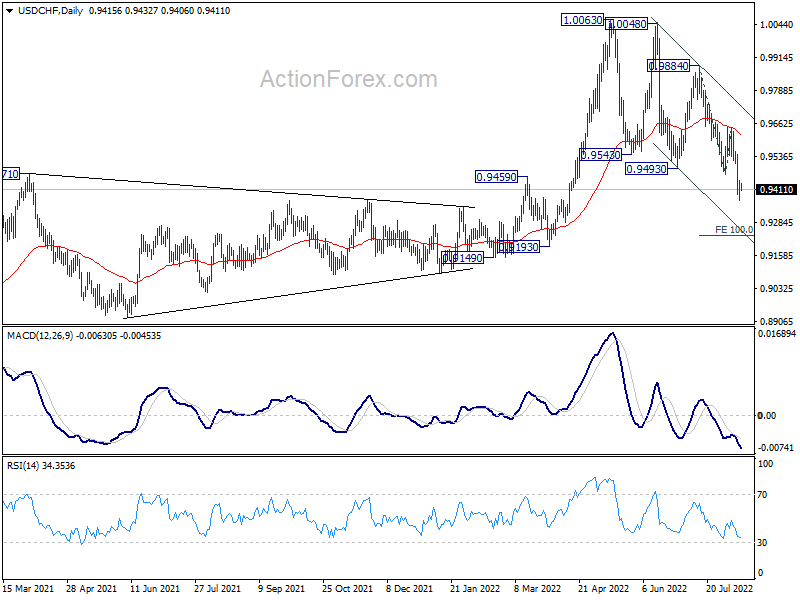
Daily Pivots: (S1) 0.9366; (P) 0.9455; (R1) 0.9517; More...
Intraday bias in USD/CHF remains neutral for consolidation above0.9369 temporary low. Upside of recovery should be limited below 0.9648 resistance to bring another decline. Break of 0.9369 will resume larger fall to 100% projection of 0.9884 to 0.9468 from 0.9648 at 0.9232.
In the bigger picture, break of 0.9471 support turned resistance argues that medium term up trend from 0.8756 has completed with three waves up to 1.0063. Long term sideway pattern might have started another falling leg. Deeper decline would now be in favor as long as 0.9648 resistance holds, to 0.9149 structural support. Sustained break there could pave the way back to 0.8756.
EUR/USD Mid-Day Outlook
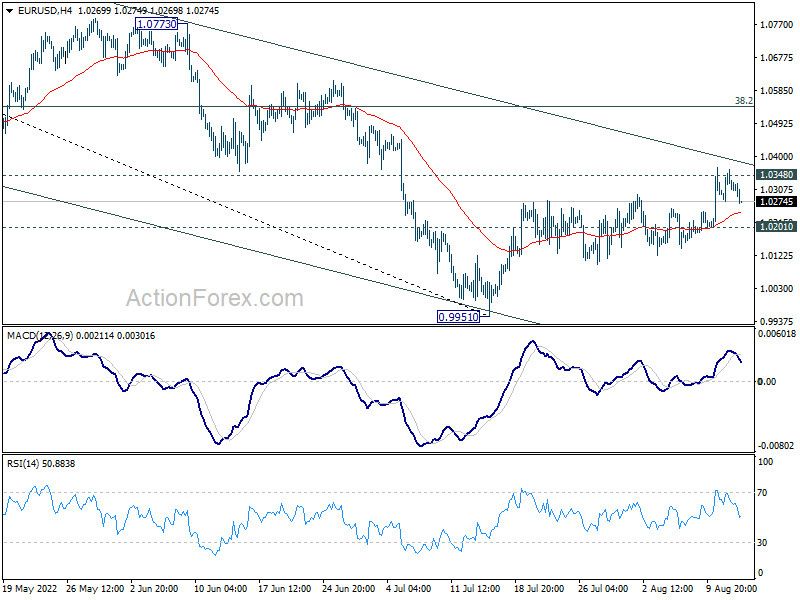
Daily Pivots: (S1) 1.0275; (P) 1.0320; (R1) 1.0363; More...
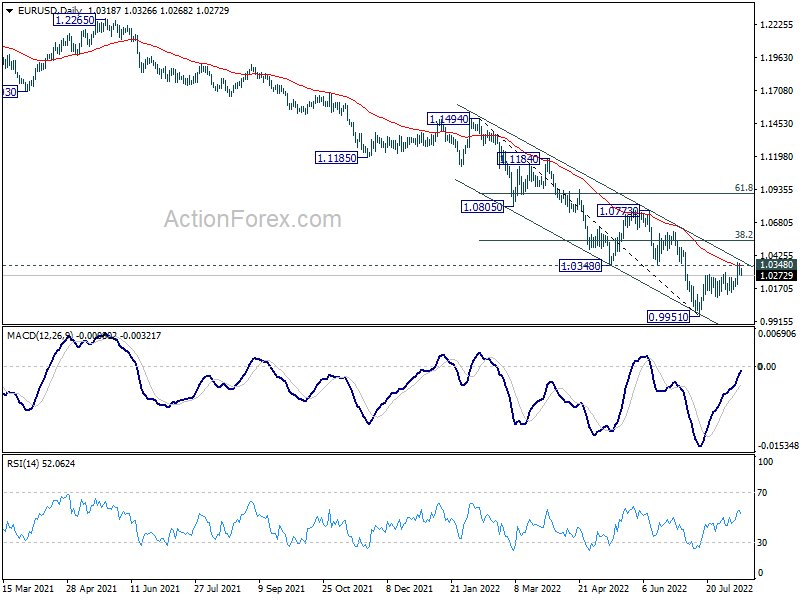
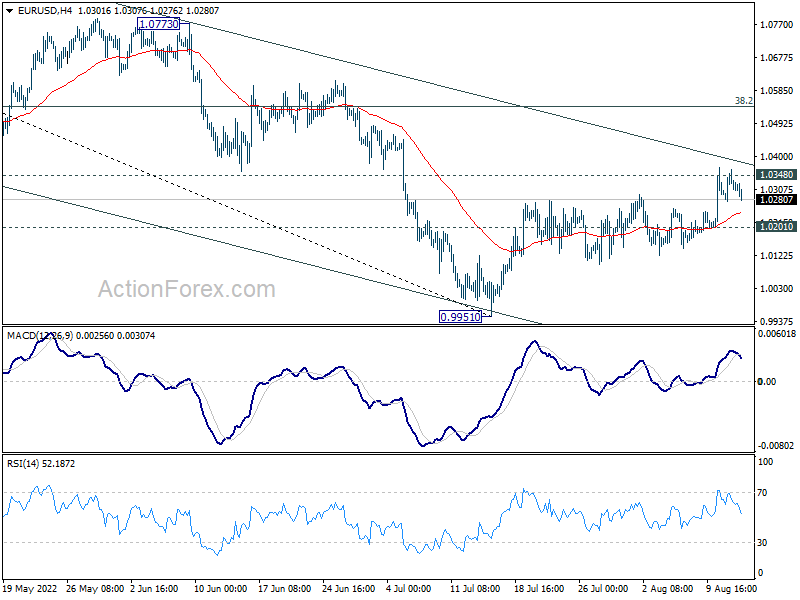
Intraday bias in EUR/USD remains neutral first, with focus staying on 1.0348 support turned resistance, which is close to 55 day EMA (now at 1.0346). Decisive break there argue that rally from 0.9951 is at least correcting the fall from 1.1494. Further rise should then be seen to 38.2% retracement of 1.1494 to 0.9951 at 1.0540. On the downside, break of 1.0201 minor support will suggest that such rebound has completed and bring retest of 0.9951 low instead.
In the bigger picture, down trend from 1.6039 (2008 high) is still in progress. Next target is 100% projection of 1.3993 to 1.0339 from 1.2348 at 0.8694. In any case, outlook will stay bearish as long as 1.0773 resistance holds, in case of strong rebound.
GBP/USD Mid-Day Outlook
Daily Pivots: (S1) 1.2173; (P) 1.2212; (R1) 1.2240; More...
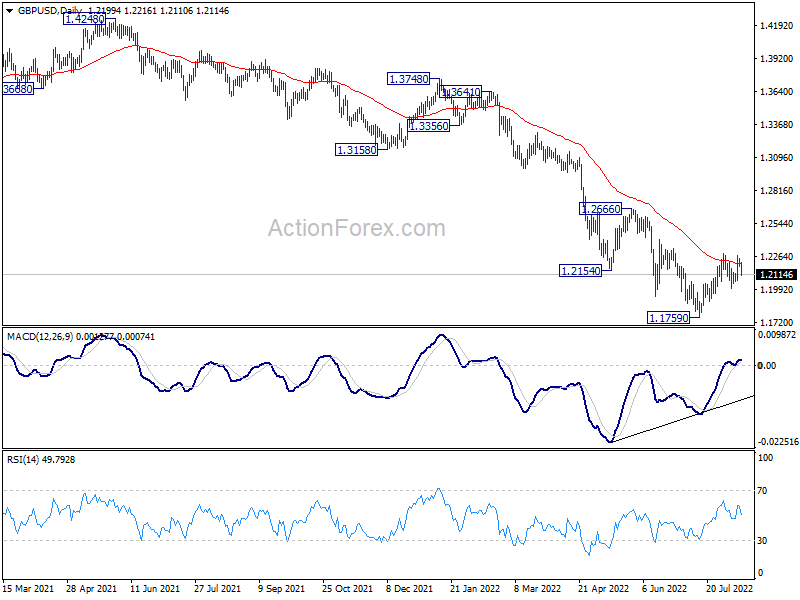
GBP/USD dips notably today but stays in range of 1.2002/2292 and intraday bias stays neutral. On the upside, decisive break of 1.2292 resistance will complete a head and shoulder bottom pattern (ls: 1.1932; h: 1.1769; rs: 1.2002). Further rally should then be seen to 1.2666 key resistance next. On the downside, however, break of 1.2002 will bring deeper fall back to retest 1.1759 low.
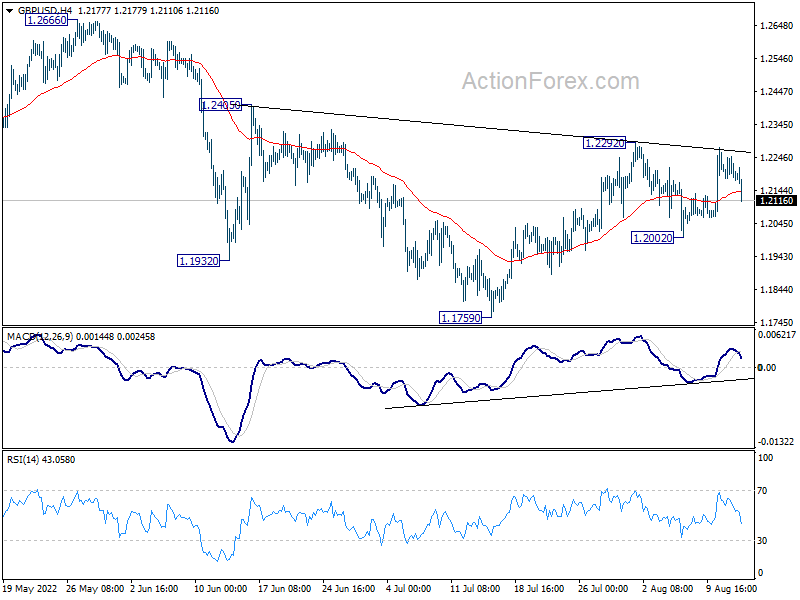
In the bigger picture, fall from 1.4248 (2018 high) could be a leg inside the pattern from 1.1409 (2020 low), or resuming the longer term down trend. Deeper decline is expected as long as 1.2666 resistance holds. Next target is 1.1409 low. However, firm break of 1.2666 will bring stronger rise back to 55 week EMA (now at 1.2925).
Sterling Falls Broadly after GDP, Dollar Paring Losses
Sterling falls broadly today while smaller than expected GDP contraction didn't ease recession worry. Euro is also weak following decline in Germany benchmark yield, but Yen was worse. Dollar, on the other hand, is trying to reverse this week's losses, with help from the strong rebound in 10 year yield. But upside of the greenback is capped, especially against commodity currencies, on risk-on sentiment.
Technically, for now, it appears that EUR/USD struggles to break through 1.0348 support turned resistance with conviction. Rejection by this level, followed by break of 1.0201 support, will argue that recent rebound from 0.9951 has completed. And, larger down trend is ready to resume. This will be the focus from now till the early part of next week.
In Europe, at the time of writing, FTSE is up 0.32%. DAX is up 0.56%. CAC is up 0.23%. Germany 10-year yield is down -0.0001 at 0.973. Earlier in Asia, Nikkei rose 2.62%. Hong Kong HSI rose 0.46%. China Shanghai SSE dropped -0.15%> Singapore Strait Times dropped -0.99%. Japan 10-year JGB yield dropped -0.0037 to 0.189.
NIESR: UK economy entered recession in Q2, to stay there until Q1
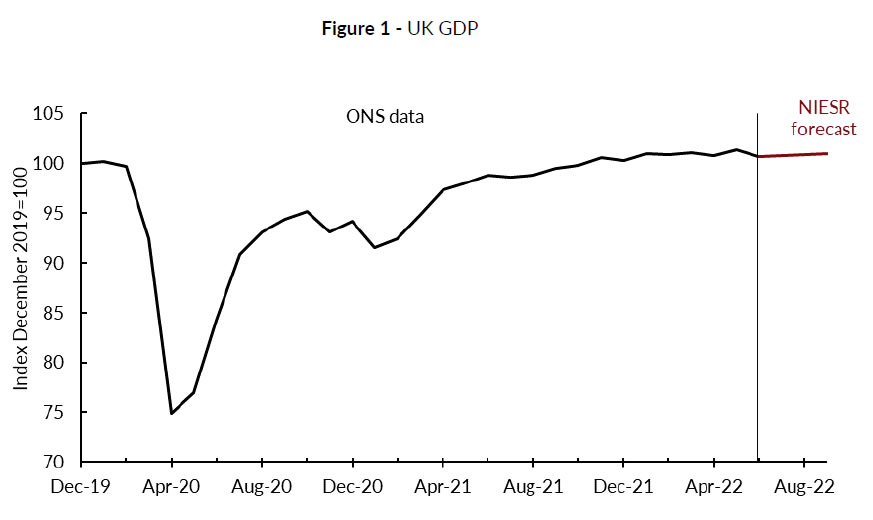
NIESR projects the UK economy to contract -0.1% in Q2, with growth likely to slow further as inflation drags on consumer demand. UK appears to have entered a recession in Q2 already. It expects the recession to last until Q1 of 2023.
GDP growth is estimated at 3.5% in 2022 and 0.5% in 2023. It expects CPI inflation to peak close to 11% in Q3, and return to around 3% a year later, resulting from "slowing in energy price inflation, a tightening in monetary policy and falls in real incomes leading to falling demand".
"It now looks like the UK economy entered a recession in the second quarter of this year as GDP fell by 0.1 per cent, and we expect output to continue falling over the next three quarters. On the expenditure side, the fall in Q2 was driven by a 0.2 per cent fall in consumption; on the output side, by a 0.4 per cent fall in services, particularly, health and social work. GDP fell by 0.6 per cent in June after a revised rise of 0.4 per cent in May as the Platinum Jubilee celebrations affected the monthly profiles." Stephen Millard, Deputy Director for Macroeconomic Modelling and Forecasting, NIESR.
UK GDP down -0.6% mom in Jun, -0.1% qoq in Q2
UK GDP contracted -0.6% mom in June, better than expectation of -1.3% mom. All main sectors contributed negatively to the monthly GDP estimate. Services was the main contributor, down -0.5%. Production dropped -0.9% mom. while construction also fell by -1.4% mom. Monthly GDP was still 0.9% above its pre-coronavirus levels in February 2020.
For the whole of Q2, GDP contracted -0.1% qoq, above expectation of -0.2% qoq. The level of GDP was 2.9% yoy higher than Q2 2021. Also, compared with the same quarter a year ago, the implied GDP deflator rose by 6.0%, primarily reflecting the 7.3% increase in the price of household consumption expenditure, which is the fastest annual household deflator growth rate since 1991.
Eurozone industrial production rose 0.7% mom in June, EU up 0.6% mom
Eurozone industrial production rose 0.7% mom in June, above expectation of 0.0% mom. Production of capital goods rose by 2.6% mom and energy by 0.6% mom, while production of intermediate goods fell by -0.1% mom, durable consumer goods by -0.6% mom and non-durable consumer goods by -3.2% mom.
EU industrial production rose 0.6% mom. Among Member States for which data are available, the highest monthly increases were registered in Ireland (+6.7%), Malta (+4.8%) and Greece (+3.4%). The largest decreases were observed in Romania (-3.9%), Belgium (-2.2%), Italy and Latvia (both -2.1%).
GBP/USD Mid-Day Outlook
Daily Pivots: (S1) 1.2173; (P) 1.2212; (R1) 1.2240; More...
GBP/USD dips notably today but stays in range of 1.2002/2292 and intraday bias stays neutral. On the upside, decisive break of 1.2292 resistance will complete a head and shoulder bottom pattern (ls: 1.1932; h: 1.1769; rs: 1.2002). Further rally should then be seen to 1.2666 key resistance next. On the downside, however, break of 1.2002 will bring deeper fall back to retest 1.1759 low.
In the bigger picture, fall from 1.4248 (2018 high) could be a leg inside the pattern from 1.1409 (2020 low), or resuming the longer term down trend. Deeper decline is expected as long as 1.2666 resistance holds. Next target is 1.1409 low. However, firm break of 1.2666 will bring stronger rise back to 55 week EMA (now at 1.2925).
Economic Indicators Update
| GMT | Ccy | Events | Actual | Forecast | Previous | Revised |
|---|---|---|---|---|---|---|
| 22:30 | NZD | Business NZ PMI Jul | 52.7 | 49.7 | ||
| 06:00 | GBP | GDP M/M Jun | -0.60% | -1.30% | 0.50% | |
| 06:00 | GBP | GDP Q/Q Q2 P | -0.10% | -0.20% | 0.80% | |
| 06:00 | GBP | Industrial Production M/M Jun | -0.90% | -0.80% | 0.90% | 1.30% |
| 06:00 | GBP | Industrial Production Y/Y Jun | 2.40% | 1.60% | 1.40% | 1.80% |
| 06:00 | GBP | Manufacturing Production M/M Jun | -1.60% | -1.70% | 1.40% | 1.70% |
| 06:00 | GBP | Manufacturing Production Y/Y Jun | 1.30% | 1.30% | 2.30% | 2.60% |
| 06:00 | GBP | Index of Services 3M/3M Jun | -0.40% | -0.40% | 0.10% | 0.00% |
| 06:00 | GBP | Goods Trade Balance (GBP) Jun | -22.8B | -22.3B | -21.4B | |
| 08:00 | EUR | Italy Trade Balance (EUR) Jun | -2.17B | 0.35B | -0.01B | -0.06B |
| 09:00 | EUR | Eurozone Industrial Production M/M Jun | 0.70% | 0.00% | 0.80% | 2.10% |
| 12:30 | USD | Import Price Index M/M Jul | -1.40% | -0.50% | 0.20% | 0.30% |
| 14:00 | USD | Michigan Consumer Sentiment Index Aug P | 52.3 | 51.5 |
NIESR: UK economy entered recession in Q2, to stay there until Q1
NIESR projects the UK economy to contract -0.1% in Q2, with growth likely to slow further as inflation drags on consumer demand. UK appears to have entered a recession in Q2 already. It expects the recession to last until Q1 of 2023.
GDP growth is estimated at 3.5% in 2022 and 0.5% in 2023. It expects CPI inflation to peak close to 11% in Q3, and return to around 3% a year later, resulting from "slowing in energy price inflation, a tightening in monetary policy and falls in real incomes leading to falling demand".
"It now looks like the UK economy entered a recession in the second quarter of this year as GDP fell by 0.1 per cent, and we expect output to continue falling over the next three quarters. On the expenditure side, the fall in Q2 was driven by a 0.2 per cent fall in consumption; on the output side, by a 0.4 per cent fall in services, particularly, health and social work. GDP fell by 0.6 per cent in June after a revised rise of 0.4 per cent in May as the Platinum Jubilee celebrations affected the monthly profiles." Stephen Millard, Deputy Director for Macroeconomic Modelling and Forecasting, NIESR
A $66 Slump Could Follow Oil’s Ironic Rebound
WTI crude has gained more than 6.5% this week, and this strengthening has a pinch of irony.
Stock indices managed to surpass the highs of the previous week’s pullback and the weak inflation report’s main driver of increased risk appetite.
A sharp slowdown in price growth and a reduction in the fuel component fuelled speculation that the Fed would slow policy tightening. But oil is a risky asset, so the rest of the market enjoyed a rise. The implication is that oil rose this week because the economy showed the effects of its decline in the previous two months.
It is also interesting that the reversal of stock indices from decline to rising was only a few days after oil reached its peak.
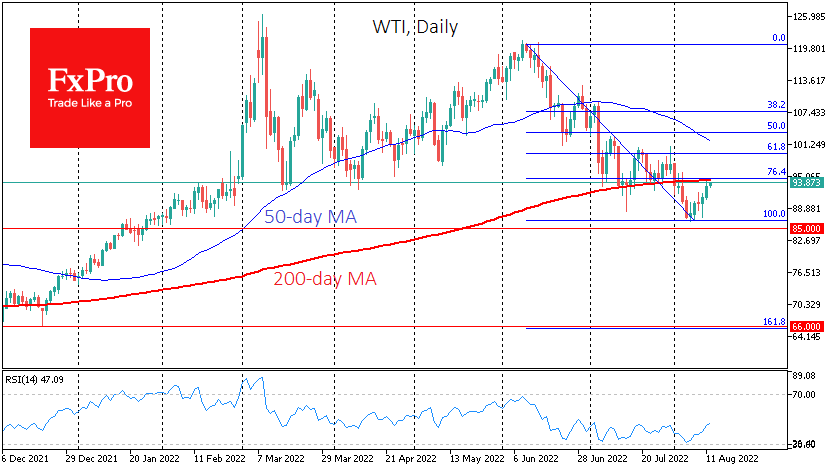
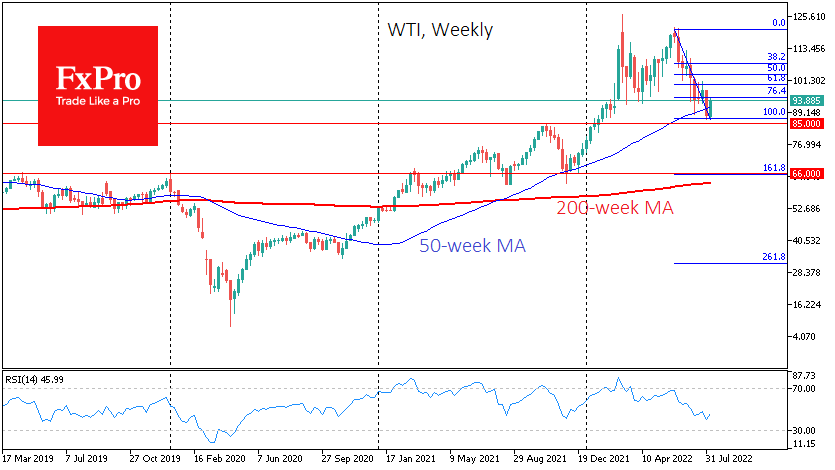
WTI crude oil took the initial setback at the beginning of August and is now testing its 200-day MA, a significant long-term trend line, from the downside. We considered the dip below it on the first day of August as an additional confirmation of the trend reversal to bearish.
However, we would venture to guess that under macroeconomic pressure, the current rebound in oil is a short-term correction after oversold conditions and that the primary trend of the last two months will remain predominant.
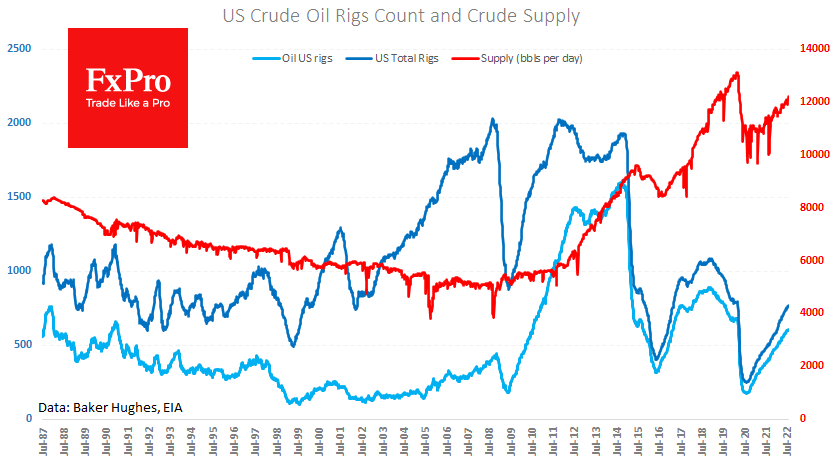
The latest weekly estimates have marked a rise in US oil production to 12.2 million BPD – a new high since April 2020 and a return to a rising trend. Besides, recently, the IEA and OPEC revised their forecasts to a less profound fall in Russian crude production, with cartel output rising. A small production surplus over consumption is forecast, adding pressure on prices.
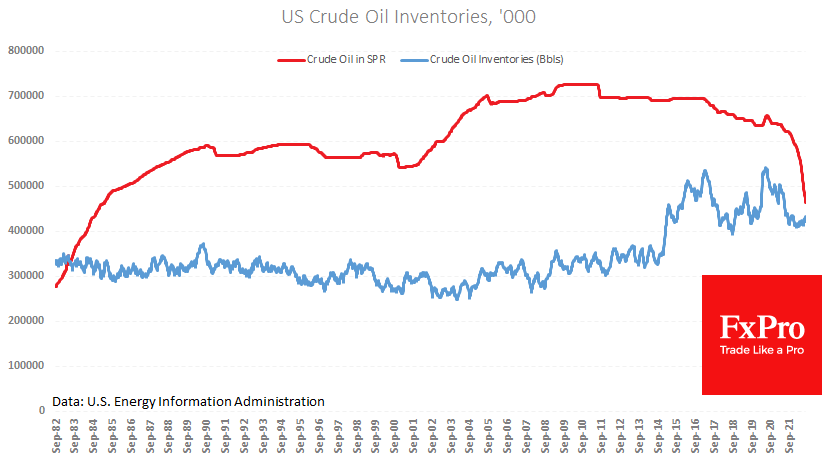
Meanwhile, the US continues to sell off strategic stocks, despite stabilisation and a moderate increase in commercial inventories. US policymakers are now focused on bringing the price of oil down as much as possible and are not prepared to stop. The intention to return to restocking only in 2023 works to encourage US companies to invest in production, as the government will have an increased demand for their raw materials in the future.
In addition, we note that the monetary policy tightening that has taken place over the past few months around the world is only beginning to work to slow demand.
The world could find itself in a stagnant or falling demand situation with continued production growth in addition to the surplus production already in the market and the sell-off from reserves.
The price rally of the past week fits into a corrective rebound picture. If the bulls do not find a new fundamental reason to buy at current levels near $94 for WTI in the next few days, we should expect a bear market recovery.
Short-term downside targets include the October 2021 highs near $85, which the price almost missed last week. A decisive move below that level would make the $66 target relevant. It includes 161.8% of the anti-rally of the past two months, the November and August retracement lows of last year, and the 2019-2020 highs.