

Sample Category Title
EUR/JPY Mid-Day Outlook
Daily Pivots: (S1) 136.63; (P) 137.18; (R1) 137.46; More....
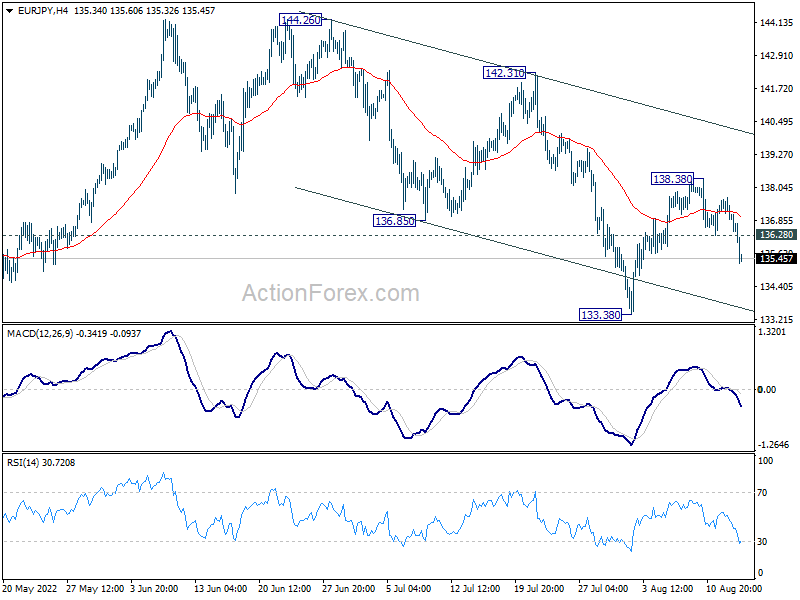
EUR/JPY's break of 135.63 minor support indicates that rebound from 133.38 has completed at 138.38 already. Intraday bias is back on the downside for retesting 133.38 first. Sustained break of 133.38/134.11 support zone will carry larger bearish implications. On the upside, above 136.28 minor resistance will turn intraday bias neutral first.
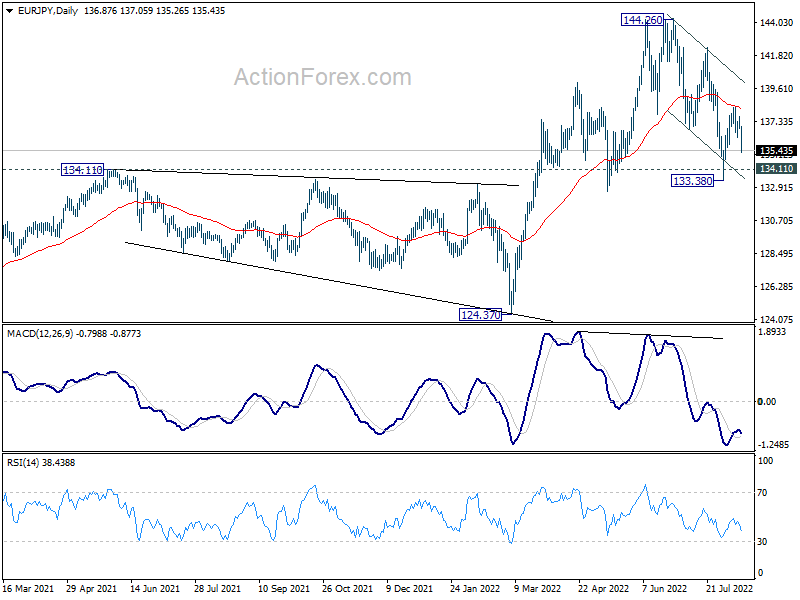
In the bigger picture, up trend from 114.42 (2020 low) is seen as the third leg of the pattern from 109.30 (2016 low). Further rally is in favor as long as 134.11 resistance turned support holds, even in case of deep pull back. Next target is 149.76 (2015 high). However, sustained break of 134.11 will be a sign of medium term bearish reversal and turn focus to 124.37 support for confirmation.
EUR/USD Mid-Day Outlook
Daily Pivots: (S1) 1.0223; (P) 1.0276; (R1) 1.0312; More...
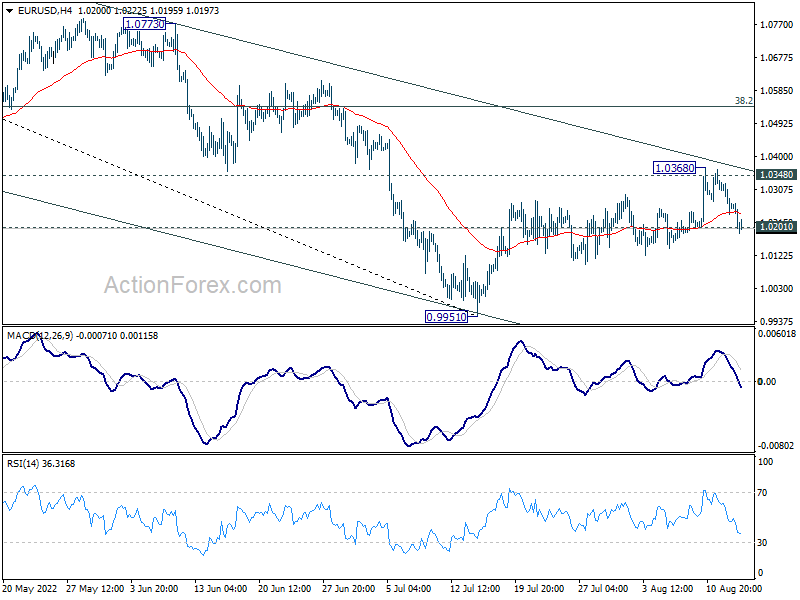
Intraday bias in EUR/USD stays neutral. Firm break of 1.0201 support will argue that rebound from 0.9951 is completed, after rejection by 55 day EMA too. Intraday bias will be back to the downside for retesting 0.9951 low. Nevertheless, firm break of 1.0348 will argue that rally from 0.9951 is at least correcting the fall from 1.1494. Further rise should then be seen to 38.2% retracement of 1.1494 to 0.9951 at 1.0540.
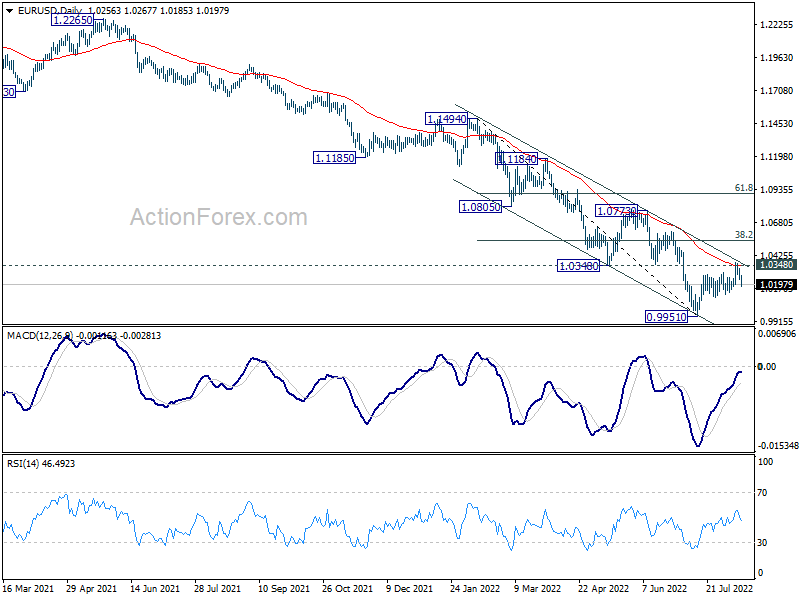
In the bigger picture, down trend from 1.6039 (2008 high) is still in progress. Next target is 100% projection of 1.3993 to 1.0339 from 1.2348 at 0.8694. In any case, outlook will stay bearish as long as 1.0773 resistance holds, in case of strong rebound.
GBP/USD Mid-Day Outlook
Daily Pivots: (S1) 1.2085; (P) 1.2150; (R1) 1.2201; More...
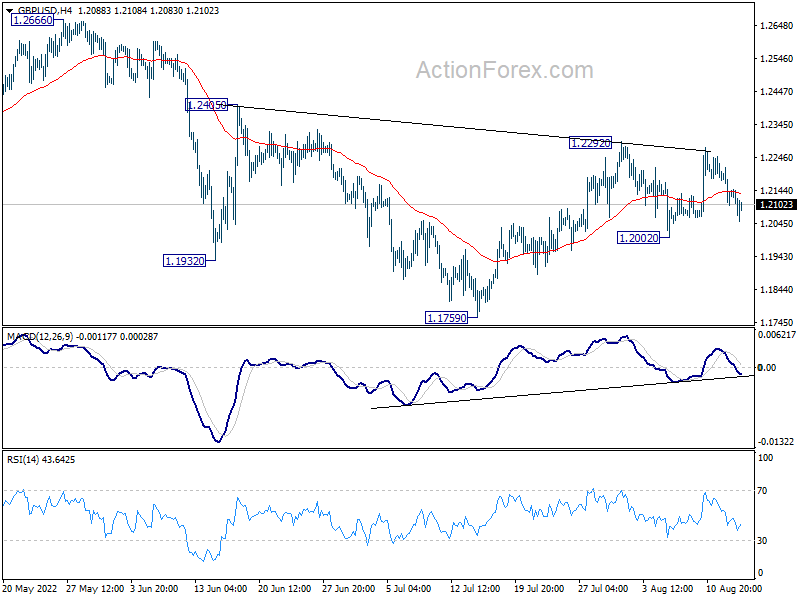
Intraday bas in GBP/USD stays neutral first. Break of 1.2922 resistance will resume the rise from 1.1759, and target 1.2666 key resistance next. On the downside, however, break of 1.2002 will bring deeper fall back to retest 1.1759 low.
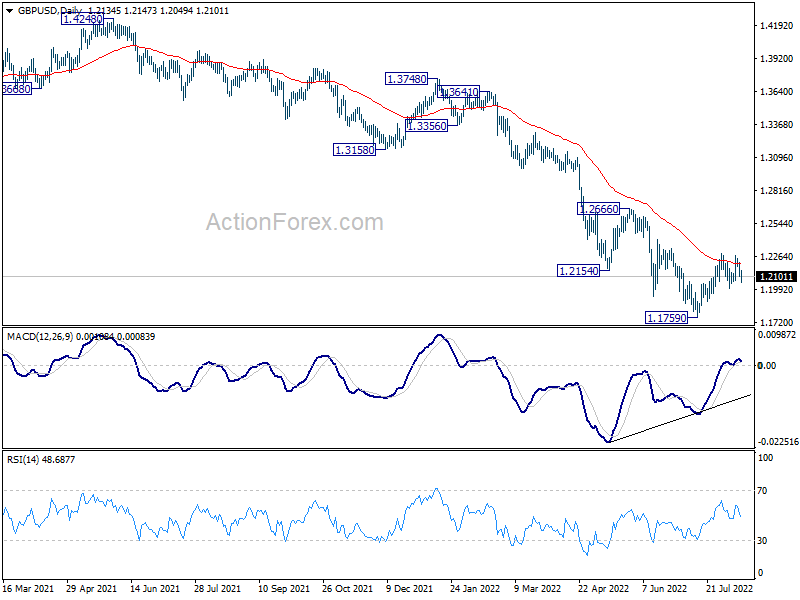
In the bigger picture, fall from 1.4248 (2018 high) could be a leg inside the pattern from 1.1409 (2020 low), or resuming the longer term down trend. Deeper decline is expected as long as 1.2666 resistance holds. Next target is 1.1409 low. However, firm break of 1.2666 will bring stronger rise back to 55 week EMA (now at 1.2897).
USD/CHF Mid-Day Outlook
Daily Pivots: (S1) 0.9397; (P) 0.9423; (R1) 0.9440; More...
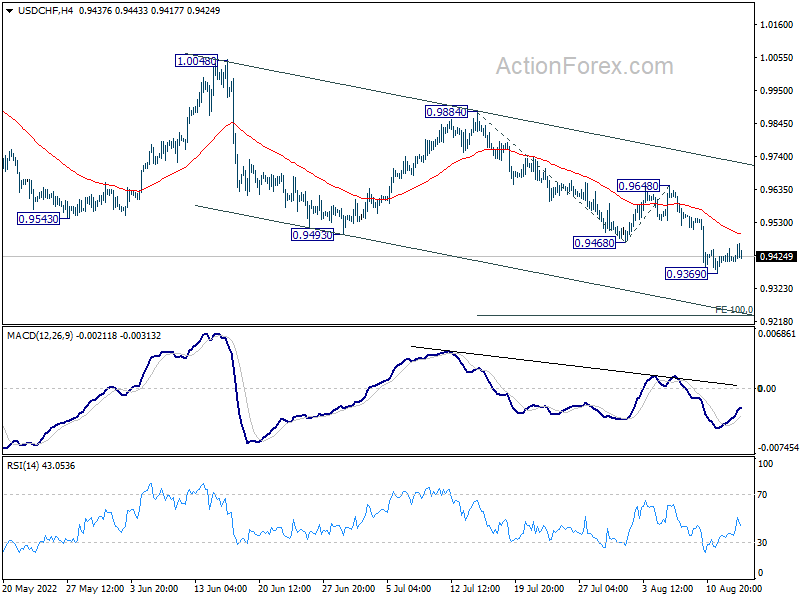
USD/CHF is staying in consolidation above 0.9369 temporary low and intraday bias stays neutral. Upside should be limited well below 0.9648 resistance to bring another fall. Break of 0.9369 will resume larger fall to 100% projection of 0.9884 to 0.9468 from 0.9648 at 0.9232.
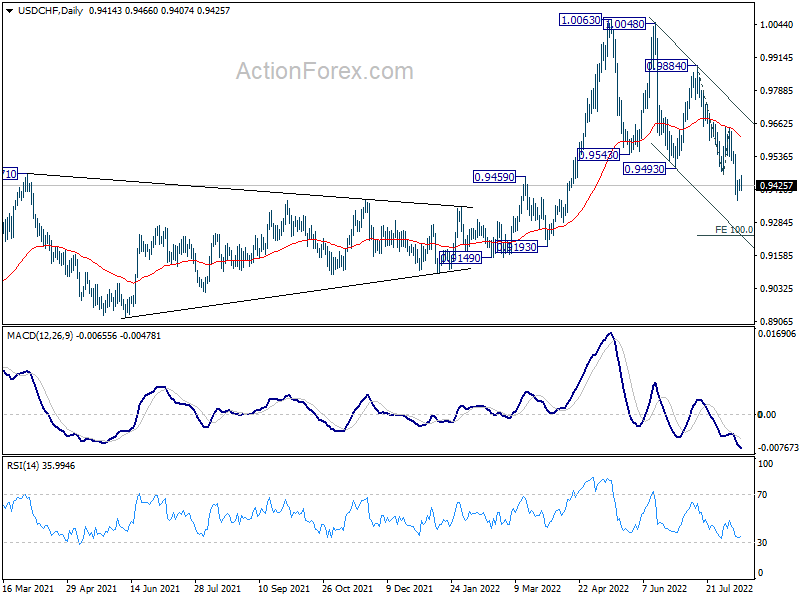
In the bigger picture, break of 0.9471 support turned resistance argues that medium term up trend from 0.8756 has completed with three waves up to 1.0063. Long term sideway pattern might have started another falling leg. Deeper decline would now be in favor as long as 0.9648 resistance holds, to 0.9149 structural support. Sustained break there could pave the way back to 0.8756.
USD/JPY Mid-Day Outlook
Daily Pivots: (S1) 132.96; (P) 133.42; (R1) 133.96; More...
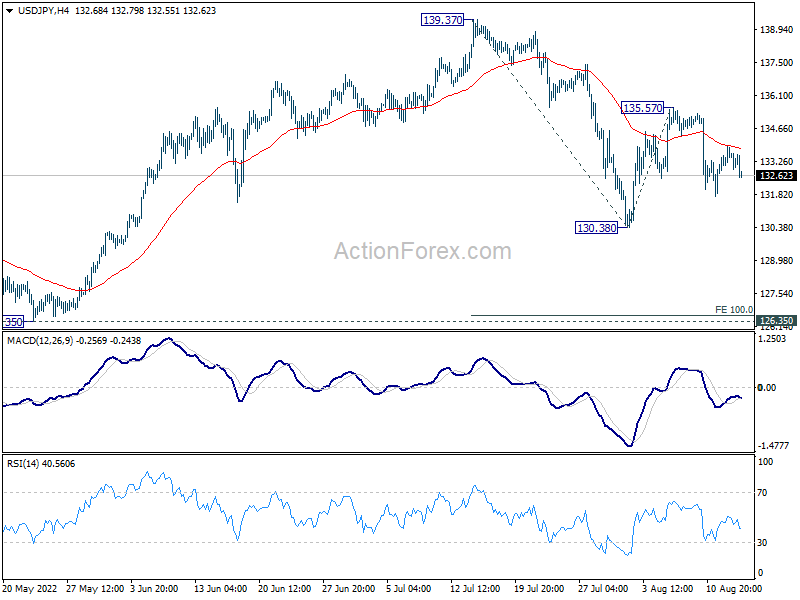
Intraday bias in USD/JPY stays neutral and the corrective pattern from 139.37 is still unfolding. Range trading between 126.35/139.37 will continue for a while. On the downside, break of 130.38 will target 100% projection of 139.37 to 130.38 from 135.57 at 126.58. On the upside, above 135.57 will resume the rebound form 130.38 to retest 139.37.
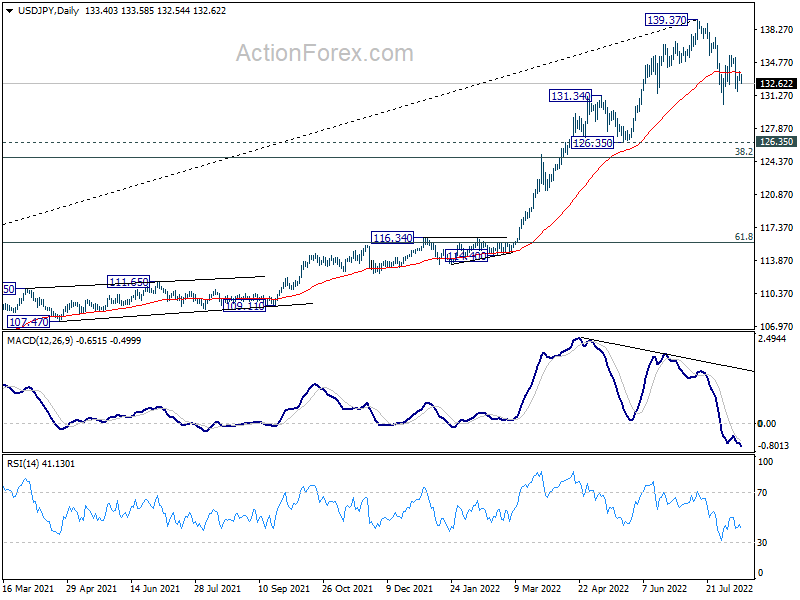
In the bigger picture, fall from 139.37 medium term top is seen as correcting whole up trend from 101.18 (2020 low). While deeper decline cannot be ruled out, outlook will stays bullish as long as 55 week EMA (now at 122.70) holds. Long term up trend is expected to resume through 139.37 at a later stage, after the correction finishes.
USD/CAD Mid-Day Outlook
Daily Pivots: (S1) 1.2744; (P) 1.2773; (R1) 1.2807; More...
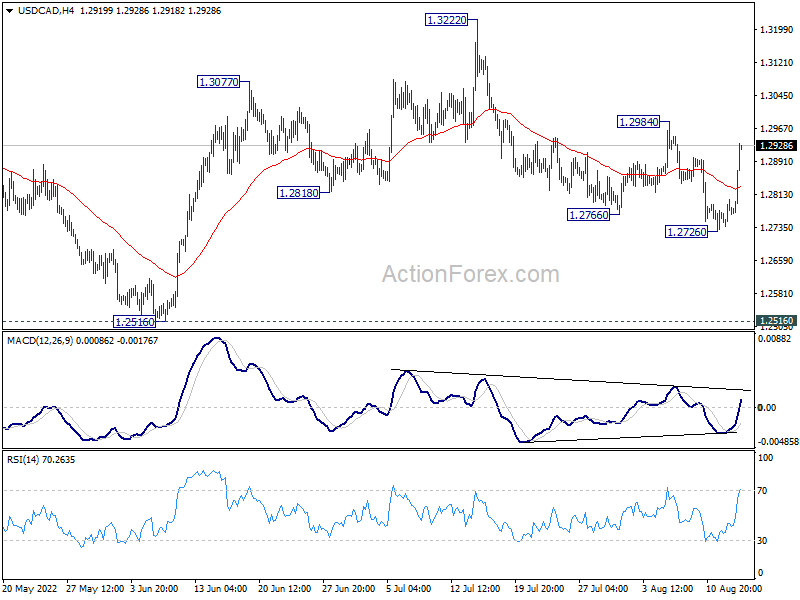
Intraday bias in USD/CAD is back on the upside as rebound from 1.2726 accelerates higher. Firm break of 1.2984 resistance will argue that corrective fall from 1.3222 has completed with three waves down to 1.2726. Further rally would be seen back to retest 1.3222 high. On the downside, touching of 4 hour 55 EMA (now at 1.2833) will turn intraday bias neutral first.
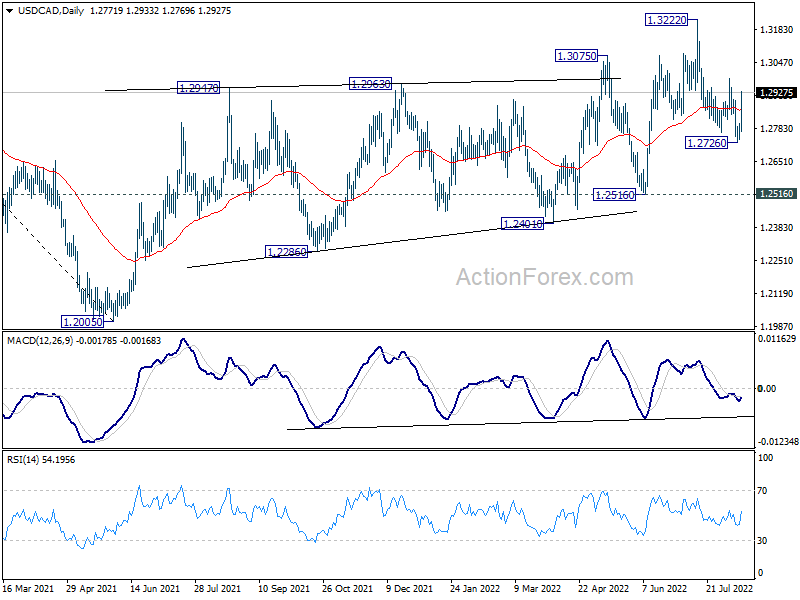
In the bigger picture, down trend from 1.4667 (2020 high) should have completed at 1.2005, after defending 1.2061 long term cluster support. Rise from there should target 61.8% retracement of 1.4667 to 1.2005 (2021 low) at 1.3650. This will remain the favored case now as long as 1.2516 support holds.
Yen Extending Rally on Negative Sentiment
Negative sentiment started earlier in the day following weak economic data from China, and spread particular serious to some commodities like oil and copper. Aussie is currently leading New Zealand and Canadian Dollar down. Yen is trading generally higher, taking Dollar and Swiss Franc up. Meanwhile, Euro and Sterling continue to trade mixed.
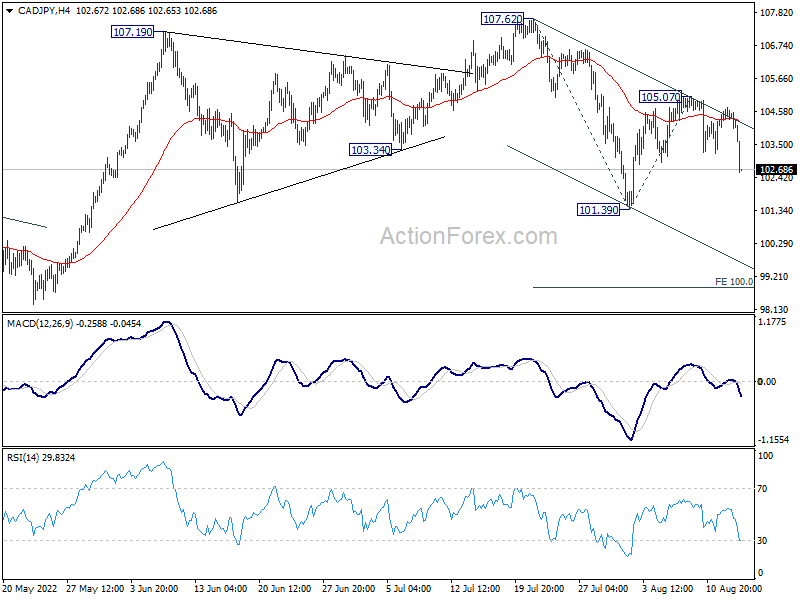
Technically, the selloff in Yen crosses are making progress today, with EUR/JPY and GBP/JPY breaking 135.63 and 161.08 minor support levels. Deeper decline would be seen to 133.38 and 159.42 support next. CAD/JPY's decline also suggest that recovery from 101.39 has completed at 105.07. Deeper fall would be seen to 101.39 support. Firm break there will resume whole fall from 107.62, to 100% projection of 107.62 to 101.39 from 105.07 at 98.84.
In Europe, at the time of writing, FTSE is down -0.47%. DAX is down -0.39%. CAC is down -0.27%. Germany 10-year yield is down -0.0857 at 0.904. Earlier in Asia, Nikkei rose 1.14%. Hong Kong HSI dropped -0.67%. China Shanghai SSE dropped -0.02%. Singapore Strait Times dropped -0.38%. Japan 10-year JGB yield dropped -0.0023 to 0.187.
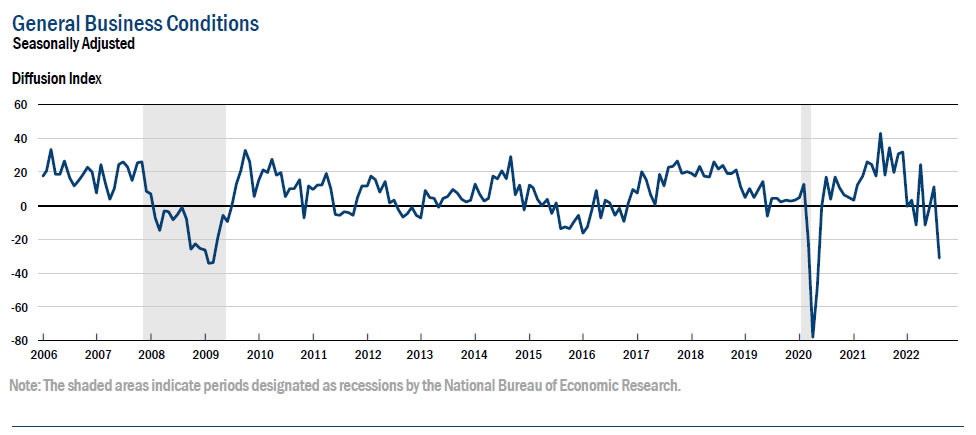
US Empire state manufacturing fell to -31.3, second largest monthly plunge on record
US Empire State manufacturing index plunged sharply from 11.1 to -31.3 in August, well below expectation of 5.1. The -42 pts decline was the second largest monthly fall on record. 12% of respondents reported conditions had improved while 55% reported worsened condition.
Expectations for six months ahead, on the other hand, rose from -6.2 to 2.1. The reading suggests that firms were not optimism about the six-month outlook.
Canada manufacturing sales dropped -0.8% mom
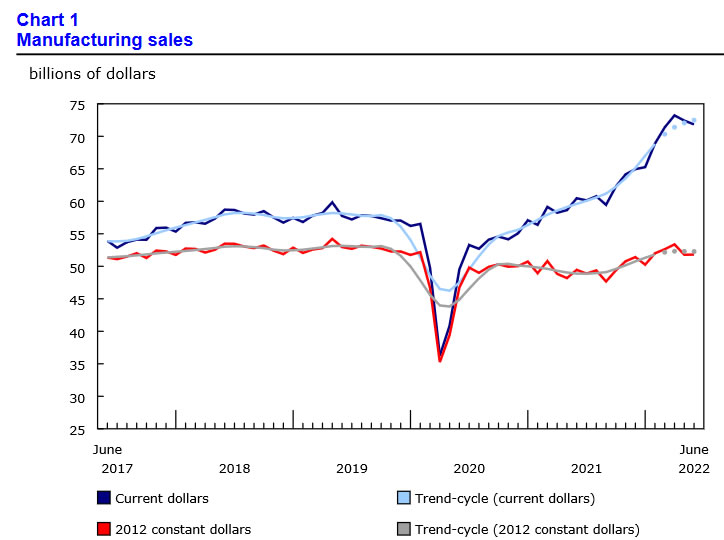
Canada manufacturing sales dropped -0.8% mom to CAD 71.8b in June, slightly worse than expectation of -0.7% mom. Sales were lower in 8 of 21 industries.
The decline was led by the petroleum and coal product (-7.8%), wood product (-7.2%) and aerospace product and parts (-16.8%) industries. Meanwhile, sales of motor vehicles (+13.8%) and chemical products (+6.0%) increased the most.
Japan GDP grew 0.5% qoq in Q2, exceeding pre-pandemic level finally
Japan GDP grew 0.5% qoq in Q2, below expectation of 0.6% qoq. In annualized term, GDP grew 2.2%, below expectation of 2.5%. The size of the economy was lifted to JPY 542.1T, exceeding pre-pandemic level in Q4 2019.
Growth was driven by 1.1% gain in private consumption. Capital expenditure rose 1.4%. Public investment rose 0.9%. Exports and imports rose 0.9% and 0.7% respectively.
NZ BusinessNZ services dropped to 51.2, back below average
New Zealand BusinessNZ Performance of Services Index dropped from 54.7 to 51.2 in July. Activity/Sales dropped from 55.8 to 54.4. Employment dropped from 52.7 to 49.2.New orders/business dropped from 60.5 to 52.5. Stocks/inventories dropped from 54.0 to 53.1. Supplier deliveries dropped from 48.4 to 47.3.
BNZ Senior Economist Doug Steel said that "it is difficult to be sure from one month's data, but July's outcome is the lowest since February, has retreated further from the recent 54.9 peak set in May, and is back below average."
China data disappoints, PBoC cuts MLF rate
China industrial production rose 3.8% yoy in July, below expectation of 4.6% yoy, slowed from 3.9% yoy. Retail sales rose 2.7% yoy, below expectation of 5.0% yoy, slowed from 3.1% yoy. Fixed asset investment rose 5.7% ytd yoy, below expectation of 6.2%.
"The national economy maintained strong recovery momentum," the NBS said in a statement. But it warned of rising stagflation risks globally and said "the foundation for the recovery of the domestic economy has yet to be consolidated."
Separately, PBoC cut a key interest rate for the second time this year and withdrew some cash from the banking system on Monday The rate on one-year medium-term lending facility (MLF) loans is lowed by 10 bps to 2.75%. The PBOC attributed its move to "keep banking system liquidity reasonably ample".
WTI resumes down trend, eyeing 85.9 support
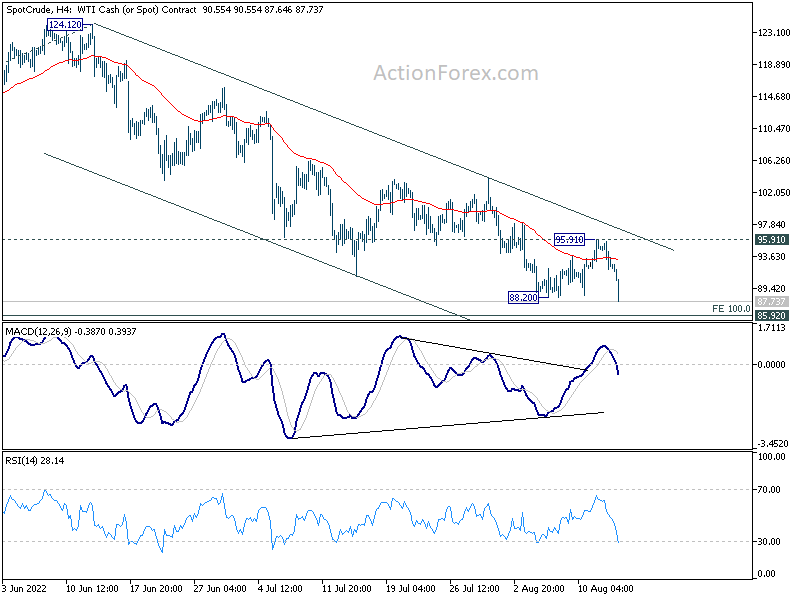
WTI crude oil falls through 88.20 support today to resume the decline from 124.12.The selloff came following a batch of weaker than expected economic data from China. In particular, refiners processed only 53.21 tonnes of crude oil in July, -8.8% lower than a year ago. The daily equivalent of 12.53m bpd was the lowest since March 2020. Overall, economic data prompt concerns of slowing oil demand from China.
On the supply side, it could be boosted is the US and Iran could revive the 2015 nuclear deal. Iran's Foreign Minister Hossein Amirabdollahian indicated that an agreement can be concluded if the US agrees to three remaining issues.
Immediate focus is now on cluster support at 85.92 in WTI. Current fall from 124.12 is seen as the third leg of the corrective pattern from 131.82. Strong support should be seen from 85.92 to bring reversal to complete the pattern. Break of 95.91 resistance will be the first sign of reversal.
However, sustained break of 85.92 will argue that fall from 131.82 is probably more than just a correction. Deeper decline would be seen back to 62.90 support.
USD/CAD Mid-Day Outlook
Daily Pivots: (S1) 1.2744; (P) 1.2773; (R1) 1.2807; More...
Intraday bias in USD/CAD is back on the upside as rebound from 1.2726 accelerates higher. Firm break of 1.2984 resistance will argue that corrective fall from 1.3222 has completed with three waves down to 1.2726. Further rally would be seen back to retest 1.3222 high. On the downside, touching of 4 hour 55 EMA (now at 1.2833) will turn intraday bias neutral first.
In the bigger picture, down trend from 1.4667 (2020 high) should have completed at 1.2005, after defending 1.2061 long term cluster support. Rise from there should target 61.8% retracement of 1.4667 to 1.2005 (2021 low) at 1.3650. This will remain the favored case now as long as 1.2516 support holds.
Economic Indicators Update
| GMT | Ccy | Events | Actual | Forecast | Previous | Revised |
|---|---|---|---|---|---|---|
| 23:01 | GBP | Rightmove House Price Index M/M Aug | -1.30% | 0.40% | ||
| 23:50 | JPY | GDP Q/Q Q2 P | 0.50% | 0.60% | -0.10% | |
| 23:50 | JPY | GDP Deflator Y/Y Q2 P | -0.40% | -0.80% | -0.50% | |
| 02:00 | CNY | Retail Sales Y/Y Jul | 2.70% | 5.00% | 3.10% | |
| 02:00 | CNY | Fixed Asset Investment YTD Y/Y Jul | 5.70% | 6.20% | 6.10% | |
| 02:00 | CNY | Industrial Production Y/Y Jul | 3.80% | 4.60% | 3.90% | |
| 04:30 | JPY | Industrial Production M/M Jun F | 9.20% | -7.50% | -7.50% | |
| 06:30 | CHF | Producer and Import Prices M/M Jul | -0.10% | 0.40% | 0.30% | |
| 06:30 | CHF | Producer and Import Prices Y/Y Jul | 6.30% | 6.70% | 6.90% | |
| 12:30 | CAD | Manufacturing Sales M/M Jun | -0.80% | -0.70% | -2.00% | -1.10% |
| 12:30 | CAD | Wholesale Sales M/M Jun | 0.10% | 0.60% | 1.60% | 0.90% |
| 12:30 | USD | Empire State Manufacturing Index Aug | -31.3 | 5.1 | 11.1 | |
| 14:00 | USD | NAHB Housing Market Index Aug | 55 | 55 |
Canada manufacturing sales dropped -0.8% mom
Canada manufacturing sales dropped -0.8% mom to CAD 71.8b in June, slightly worse than expectation of -0.7% mom. Sales were lower in 8 of 21 industries.
The decline was led by the petroleum and coal product (-7.8%), wood product (-7.2%) and aerospace product and parts (-16.8%) industries. Meanwhile, sales of motor vehicles (+13.8%) and chemical products (+6.0%) increased the most.
US Empire state manufacturing fell to -31.3, second largest monthly plunge on record
US Empire State manufacturing index plunged sharply from 11.1 to -31.3 in August, well below expectation of 5.1. The -42 pts decline was the second largest monthly fall on record. 12% of respondents reported conditions had improved while 55% reported worsened condition.
Expectations for six months ahead, on the other hand, rose from -6.2 to 2.1. The reading suggests that firms were not optimism about the six-month outlook.
WTI resumes down trend, eyeing 85.9 support
WTI crude oil falls through 88.20 support today to resume the decline from 124.12.The selloff came following a batch of weaker than expected economic data from China. In particular, refiners processed only 53.21 tonnes of crude oil in July, -8.8% lower than a year ago. The daily equivalent of 12.53m bpd was the lowest since March 2020. Overall, economic data prompt concerns of slowing oil demand from China.
On the supply side, it could be boosted is the US and Iran could revive the 2015 nuclear deal. Iran's Foreign Minister Hossein Amirabdollahian indicated that an agreement can be concluded if the US agrees to three remaining issues.
Immediate focus is now on cluster support at 85.92 in WTI. Current fall from 124.12 is seen as the third leg of the corrective pattern from 131.82. Strong support should be seen from 85.92 to bring reversal to complete the pattern. Break of 95.91 resistance will be the first sign of reversal.
However, sustained break of 85.92 will argue that fall from 131.82 is probably more than just a correction. Deeper decline would be seen back to 62.90 support.