Sample Category Title
Gold Pulls Below 1,800; Bias Still Neutral
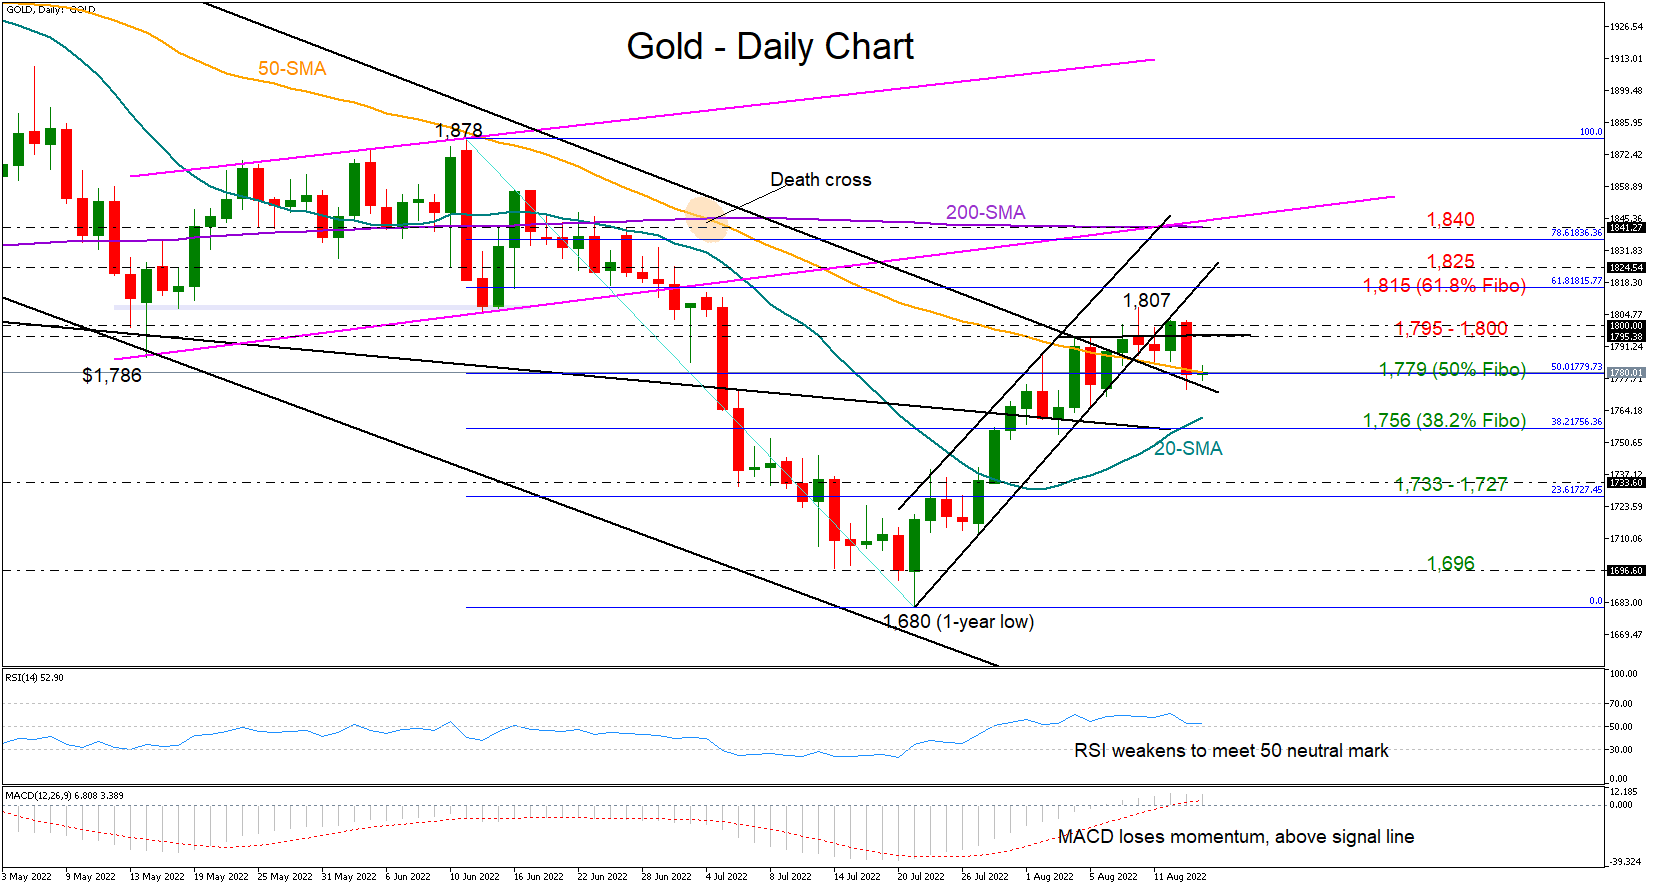
Gold started the week on the wrong foot, sliding to a low of 1,772 on Monday after two days of unsuccessful efforts to claim the 1,800 psychological mark.
The bearish correction, however, has not raised alarms yet, as the price seems to be setting a foothold around the broken bearish channel from March and the 50-day simple moving average (SMA) at 1,779. The 50% Fibonacci retracement of the 1,878 – 1,680 is also cementing that base. Moreover, the RSI, although weaker, is marginally above its 50 neutral mark and the MACD keeps fluctuating above its red signal line despite recently losing momentum, suggesting a neutral bias instead.
If that floor cracks, the precious metal may seek support somewhere between the 20-day SMA and the 38.2% Fibonacci of 1,756. Lower, the sell-off could accelerate towards the 1,733 – 1,727 constraining zone, a break of which could trigger another significant decline towards the bottom of $1,696 - $1,680.
Otherwise, a bounce on 1,779 may again push for a close above the nearby ceiling of 1,795 - 1,800. Should the bulls succeed this time, the next obstacle could develop within the 1,815 - 1,825 region, while not far above, the flattening 200-day SMA around 1,840 could be a more important resistance.
In brief, gold has not flipped back to a bearish bias despite its latest pullback. For that to happen, the price will need to breach the 1,779 base.
Oil Prices Slipping and Went into Tailspin
Markets
Disappointing July Chinese eco data and some PBOC monetary policy easing were the main talking point at the start of the new trading week. The Chinese central bank cut its 1-yr medium term lending facility rate unexpectedly by 10 bps, from 2.85% to 2.75%. It was the first cut since January. The decision came just before the release of July economic data which pointed to decelerating growth in production (3.8% Y/Y; 3.5% YTD YoY), retail sales (2.7% Y/Y; -0.2% YTD YoY) and investments (5.7% YTD YoY). New Covid-outbreaks and the governments zero-Covid policy dampened growth at the start of Q3 while also clouding the outlook. The country last month toned down its guidance for this year’s growth target from around 5.5% to “trying to achieve the best possible outcome”. The monthly eco data amplified global growth worries and provided an early bid for core bonds.
Oil prices were slipping and went into tailspin once Iran’s foreign minister Amirabdollahian signaled that a new nuclear deal is near. The country sent its official response to reviving the 2015 the Joint Comprehensive Plan of Action (JCPOA) to the EU while it’s already nearer to a deal with the US. Relancing JCPOA implies a return of Iranian oil to the market. Brent crude yesterday fell from around $98/b to $93/b.
An empty European eco calendar meant that Chinese growth and the Iranian nuclear deal remained the key trading input up until the release of the August Empire Manufacturing index. NY business sentiment unexpectedly crashed from 11.10 to -31.3, by far the weakest reading since May 2020. Details offered no relief. New orders slumped from 6.2 to -29.6 with shipments collapsing from 25.3 to -24.1. Employment and average workweek indicators fell as well with producer input prices showing a second month of steep decline following over 12 months (April 2021 – June 2022) at sky-high levels. All these sub-indicators are a warning signal for H2 growth. We’ll look for more regional confirmation in this week’s Philly Fed Business Outlook and next week’s Richmond Fed Manufacturing index.
US Treasuries spiked higher after the Empire Manufacturing Survey with the front end of the curve outperforming. The curve turned less inverse with yields ceding 6.2 bps (2-yr) to 0.9 bps (30-yr). German yields lost around 8 bps across the curve. The dollar extended Friday’s gains. EUR/USD’s failure to regain first resistance around 1.0350 (May & June lows / topside downward trend channel) prompted rebound action lower with the pair currently changing hands at 1.0165.
EUR/GBP copied that move south with the pair closing at 0.8428 from an 0.8453 open. This morning’s decent labour market figures don’t spark a market reaction. UK employment rose by 160k in the 3 months ending June, below 268k consensus with the unemployment rate stabilizing at 3.8% over that same period. Average weekly earnings accelerated to 4.7% Y/Y ex. Bonuses. Monthly (July) data showed a 73k net job gains with jobless claims falling by 10.6k.
News Headlines
The German government decided that consumers will have to pay and extra 2.419 euro cents per kilowatt hour for natural gas from October onwards. Economic minister Habeck said that the levy is a consequence of Russian President Putin’s illegal war of aggression against Ukraine and the artificial energy shortage caused by Russia. The levy will be imposed through April 1 2024 and suggests an annual cost of about €290 for a 4-person household. Some households will be granted some subsidies to dampen the impact of the price rise. The latter will deteriorate German inflation dynamics (already at 8.5% Y/Y in July) further. The Reserve Bank of Australia published Minutes of its early August policy meeting, when it hiked the policy rate by 50 bps from 1.35% to 1.85%. The board expects to take further steps in the process of normalizing monetary conditions over the months ahead, but it is not on a pre-set path. The central bank hinted to get (at least) towards a neutral level of around 2.5% with money markets expecting a 3.25% policy rate by the end of the year.
Daily Technical Analysis
EUR/USD
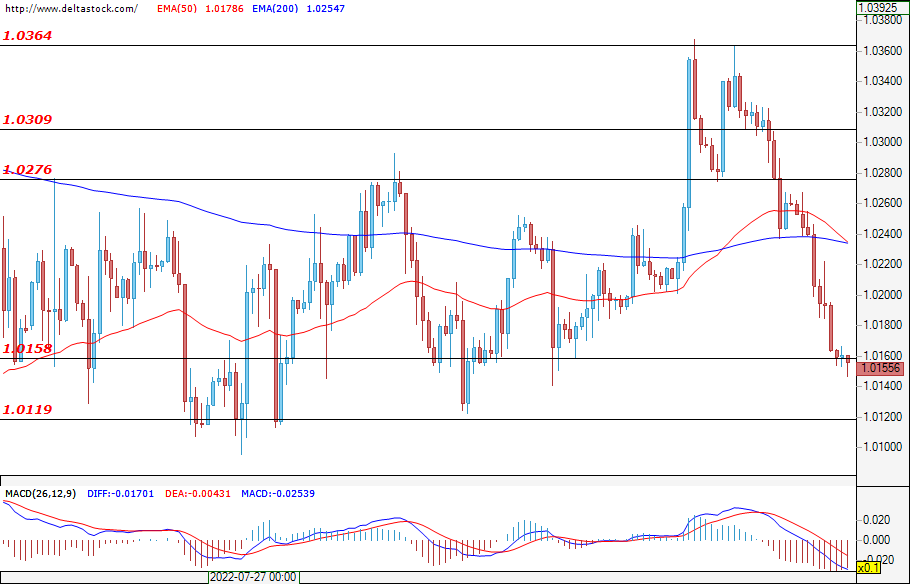
The European common currency lost quite a bit of ground against the U.S. dollar, and during the early hours of today`s trading, the price tested the support at 1.0158. A confirmed breach for the bears could easily deepen the decline towards the next target at 1.0119, where a violation could lead to new losses and could strengthen the negative expectations for the future path of the pair. If the buyers enter the market instead, then their first resistance can be found at 1.0276, followed by the upper zone at 1.0309.
USD/JPY
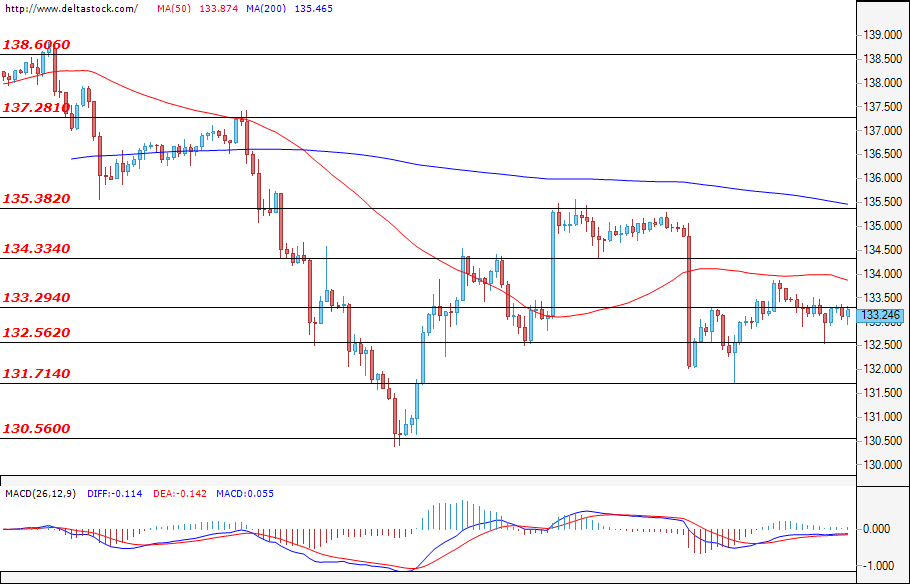
Neither the bulls nor the bears managed to gain enough momentum and trading remained in the zone between 132.56 and 133.29. A breach of the lower border, followed by a violation of the next target at 131.71, could easily mark the current move as corrective and could pave the way for a test of the low at 130.56. If the buyers prevail instead, then a new successful attack on the zone at 133.29 and a breach of the resistance at 134.33 could result in a continuous recovery towards the important level at 135.38.
GBP/USD
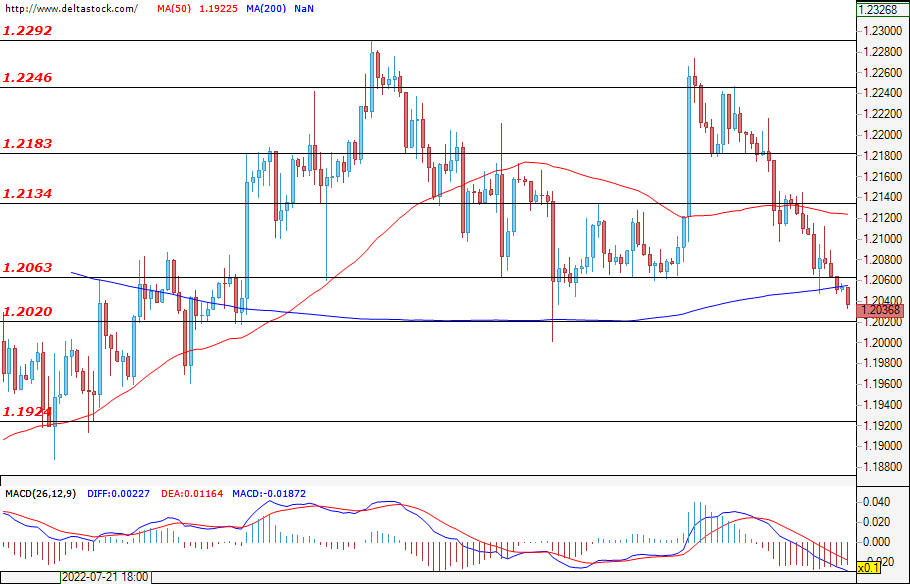
The Sterling continued to lose ground against the dollar, and after the breach of the support at 1.2063, the pair consolidated around the current price at 1.2036. The current expectations are for a test of the level at 1.2020, and if successful, a deepening of the decline could easily head the price towards the support at 1.1924. If the bearish momentum fades and buyers take control instead, then a violation of the mentioned zone at 1.2063, which is now acting as resistance, could lead to an appreciation towards the next target at 1.2134. A violation of the upper zone at 1.2183 could result in a change in the current sentiment and could prime the Cable for a new attack on the local high at 1.2246.
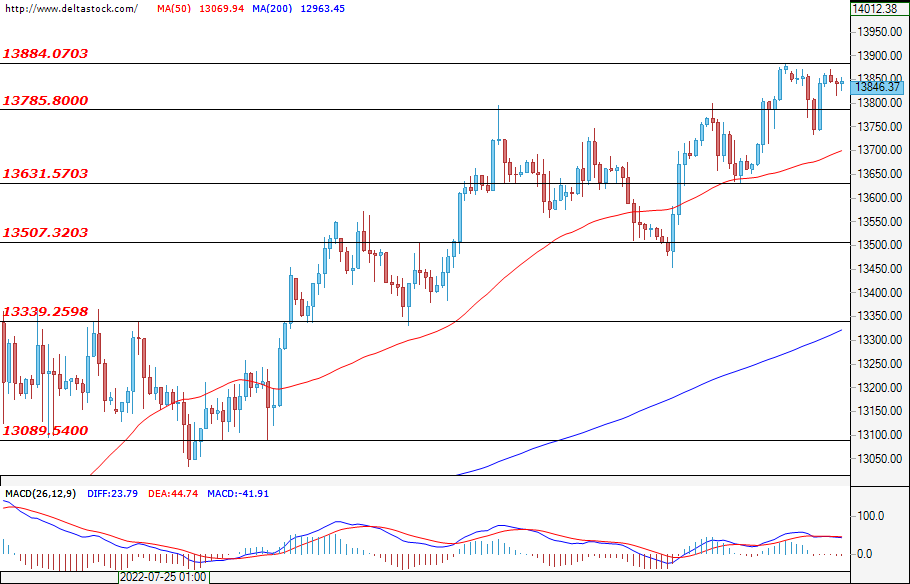
EUGERMANY40
The German index recovered some of its recent losses, and at the time of writing the analysis, the price is hovering just under the resistance at 13884. If the bulls manage to gain enough momentum and breach the mentioned zone, then the expectations would be for new gains and a further rally towards 13400. Worse-than-expected data on the ZEW economic sentiment in Germany (today; 09:00 GMT) could help the bears prevail. А potential correction here could be limited to the support zone at 13785, followed by the lower level at 13631.
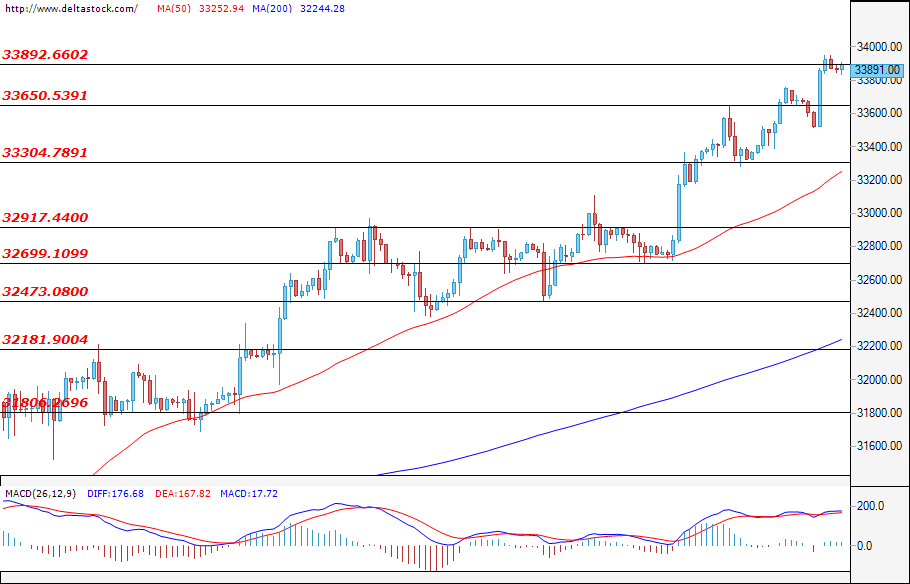
US30
The positive sentiments remained unchanged and the American index appreciated and tested the resistance at 33892. If the bullish attack continues, then a successful violation could easily lead to new gains towards the levels from March 2021 at around 34800. Оn the flipside, if the bears enter the market and violate the support at 33650, then a potential deeper correction could be limited to the lower zone at 33304, followed by the major level at 32917.
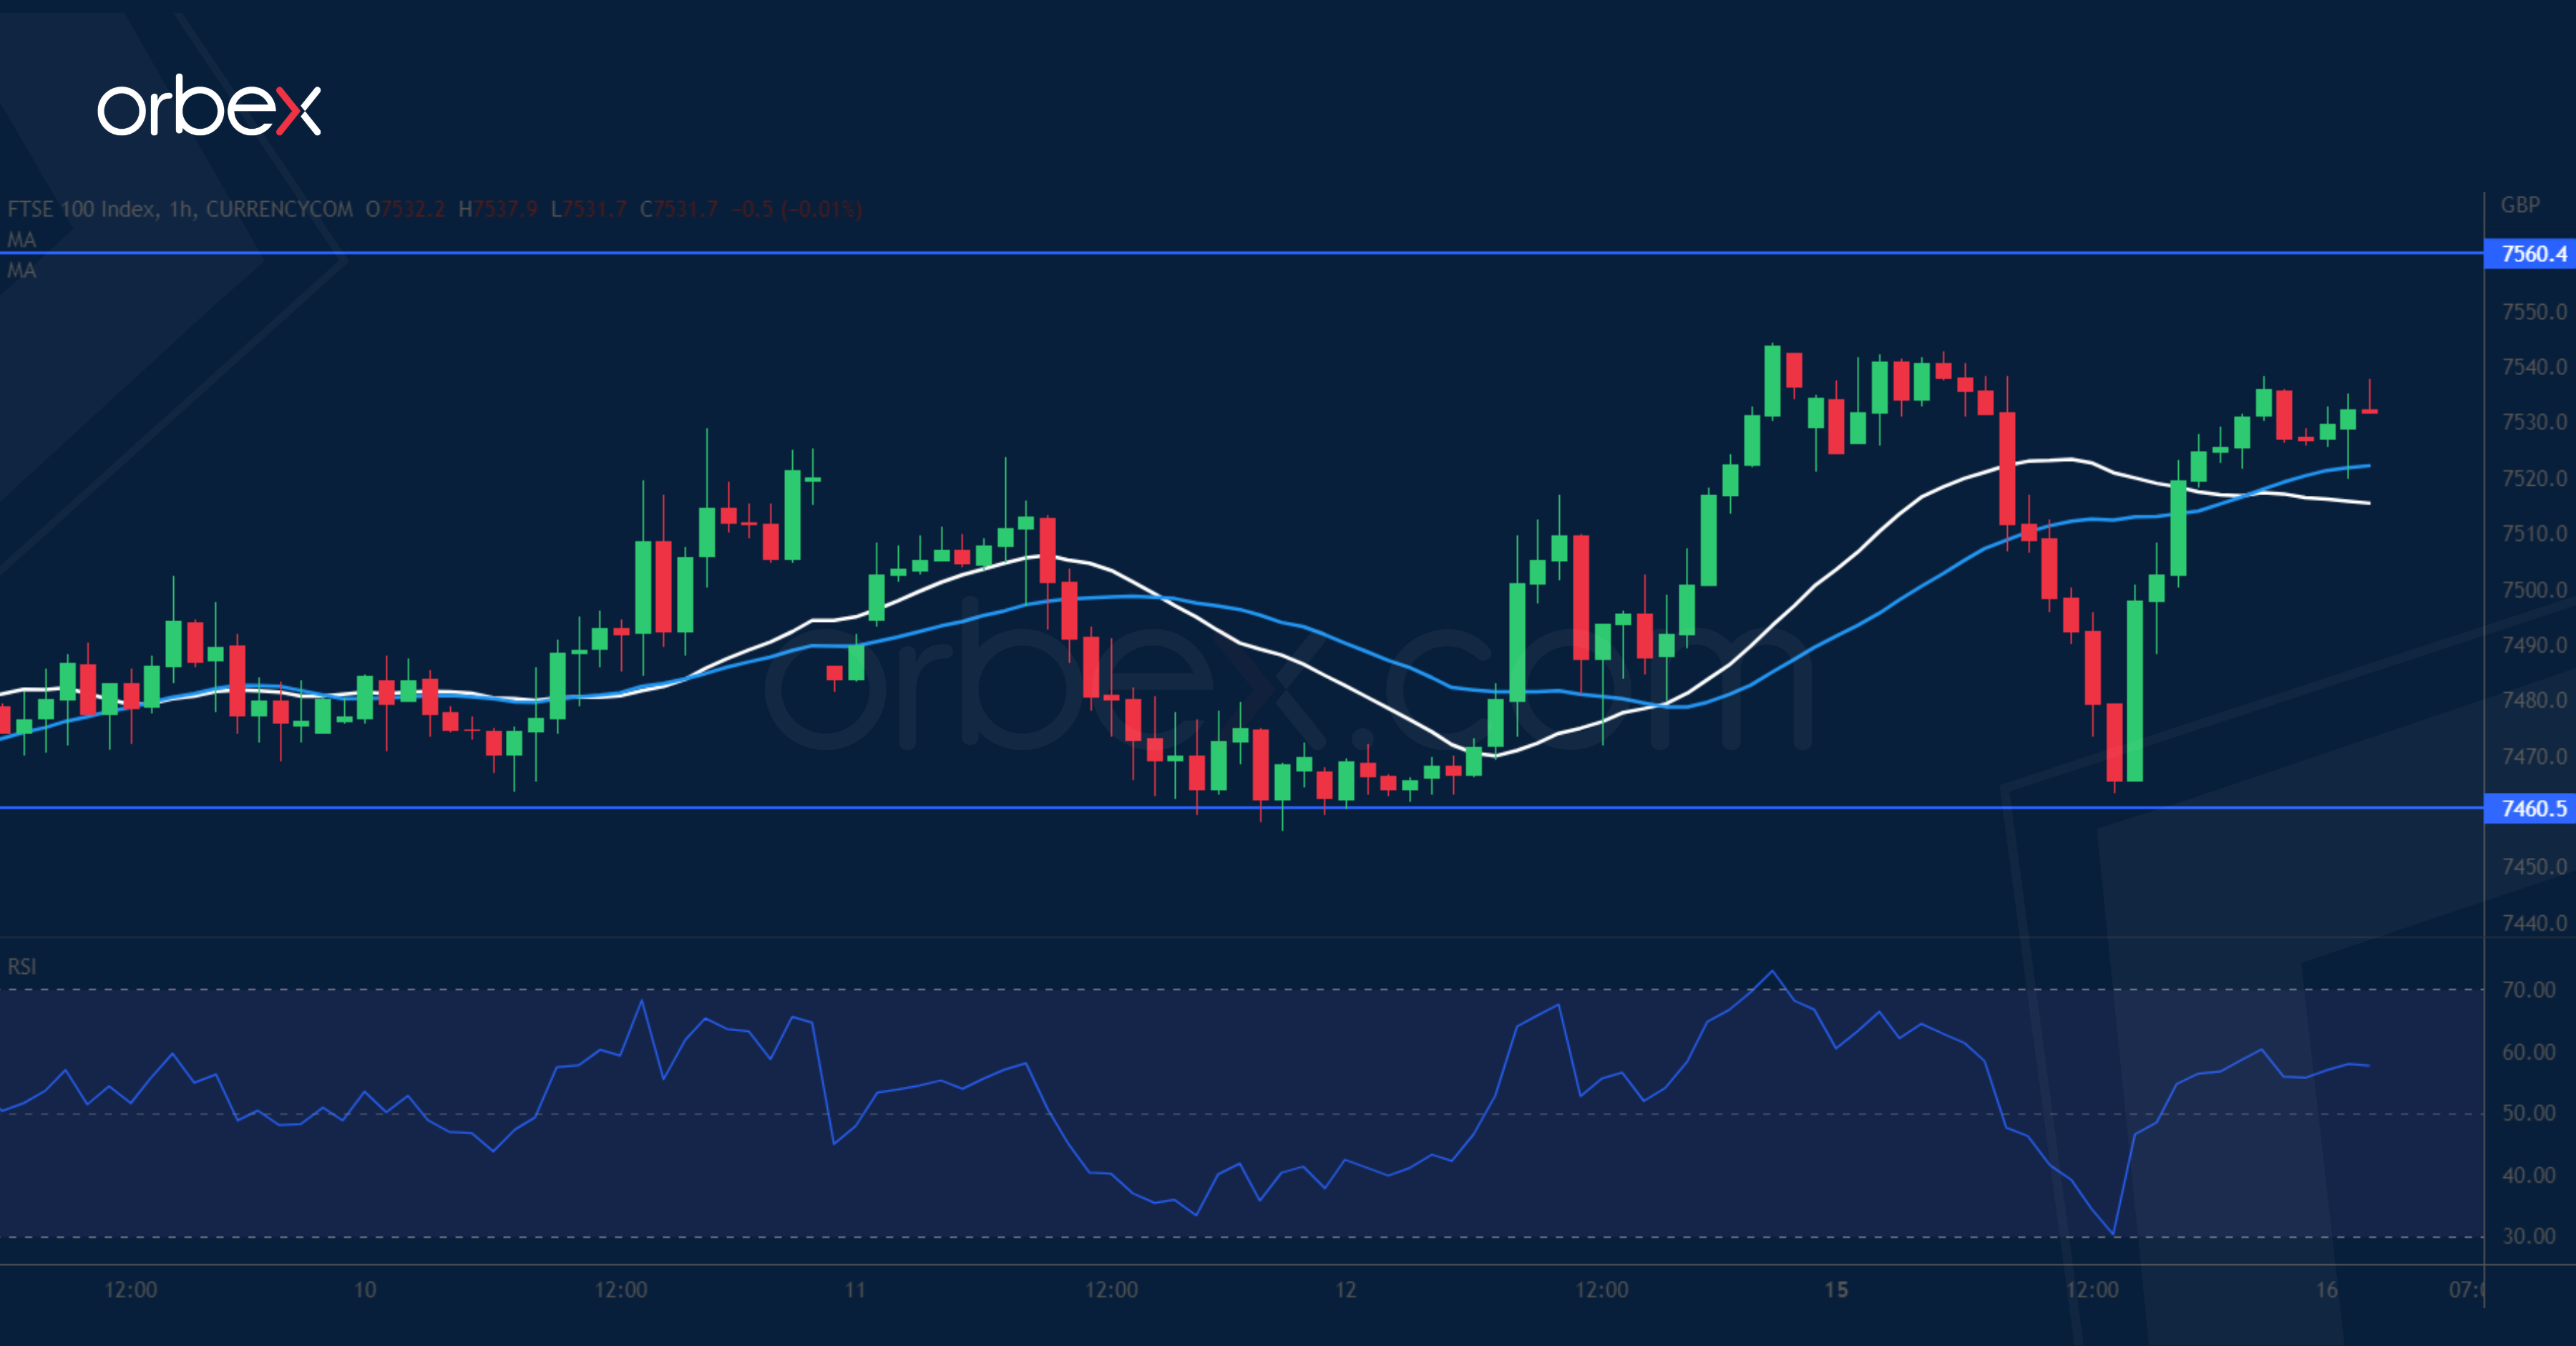
FTSE 100 Inches Up
Equities rally as investors find some relief in China cutting interest rates. The FTSE is looking to hold onto its gains as it grinds its way towards a new high. 7560 at the origin of June’s liquidation is a major hurdle and strong selling interest could be expected from those who believe in a bear market in the medium-term. The RSI’s repeated overbought condition may make buyers wary of chasing after the rally. 7460 is the immediate support and 7370 over the 30-day moving average an important level to prevent a correction.
US Oil Breaks Support
WTI slides as weak Chinese economic data raise concerns over demand. The bulls’ struggle to keep higher lows indicates that sentiment remains downbeat. A short-lived rebound to 95.00 which sits on the 20-day moving average is another sign that the bears have firm control of the direction. A fall below 87.50 would invalidate the bounce and attract more selling. 82.00 near a seven-month lows would be the next target. As the RSI recovers from oversold territory, 92.00 is the resistance and sellers may continue to fade rebounds.

AUD/USD Seeks Support
The Australian dollar falls as China’s industrial and retail data disappoint. The pair turned south in the supply zone (0.7130) at the start of a sell-off back in June. A combination of profit-taking and new selling may keep the aussie under pressure in the short-term. A bearish RSI divergence indicates overextension and a break below 0.7060 could be seen as a confirmation, triggering a liquidation of leveraged positions. 0.6960 at the base of the recent rebound is a key support while 0.7060 has turned into a fresh resistance.

GBP/JPY Daily Outlook
Daily Pivots: (S1) 160.00; (P) 161.05; (R1) 161.73; More...
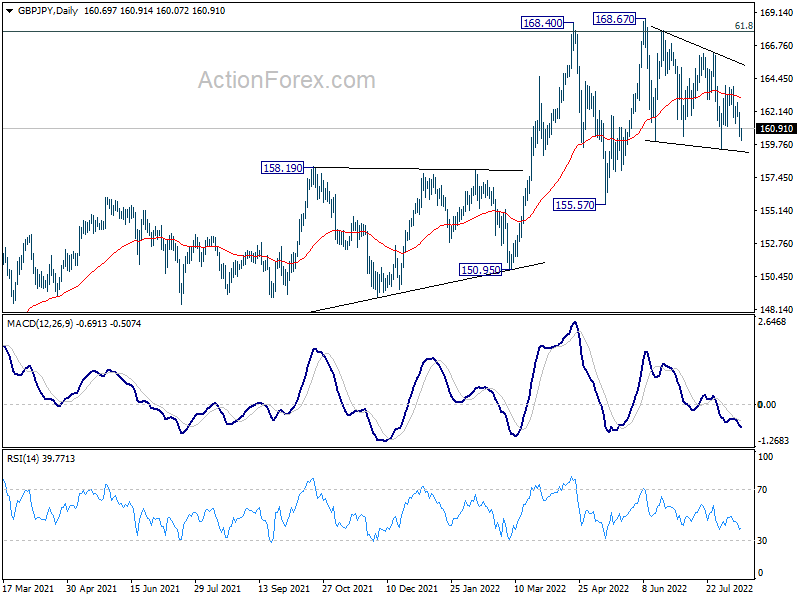
Intraday bias in GBP/JPY stays on the downside for 159.42 support. Sustained break there will target 155.57 support next. On the upside, above 162.77 minor resistance will turn bias back to the upside for 163.91 resistance instead.
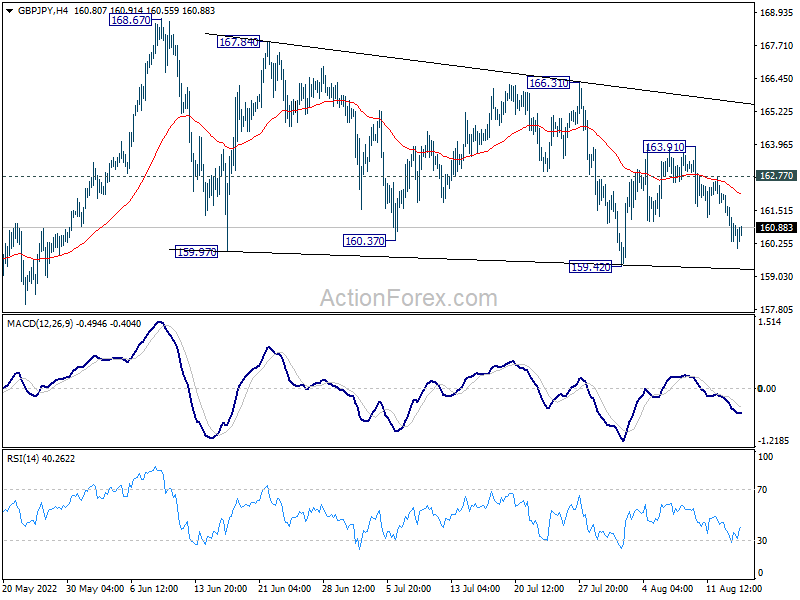
In the bigger picture, up trend from 123.94 (2020 low) is still in progress. Sustained break of 61.8% retracement of 195.86 (2015 high) to 122.75 (2016 low) at 167.93 will be a long term bullish signal, and could pave the way back to 195.86 high. This will remain the favored case as long as 155.57 support holds, even in case of deep pull back.
EUR/JPY Daily Outlook
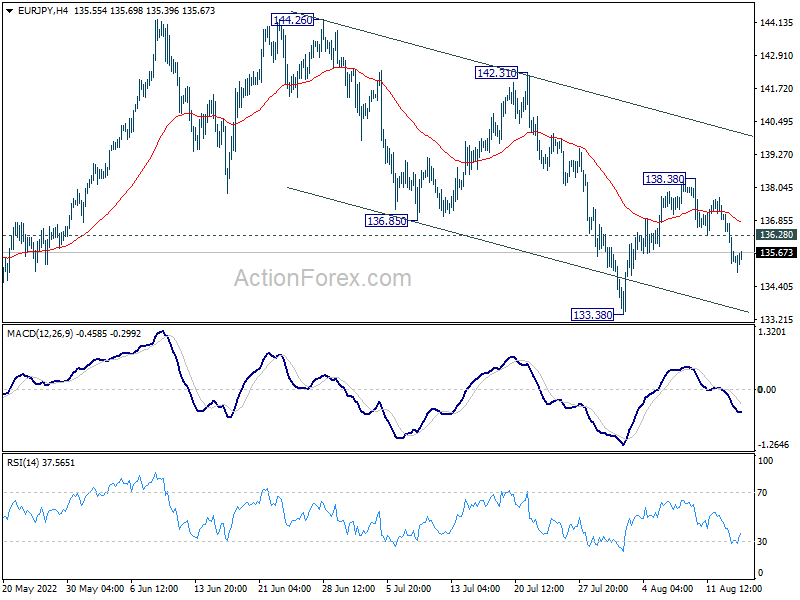
Daily Pivots: (S1) 134.78; (P) 135.92; (R1) 136.57; More....
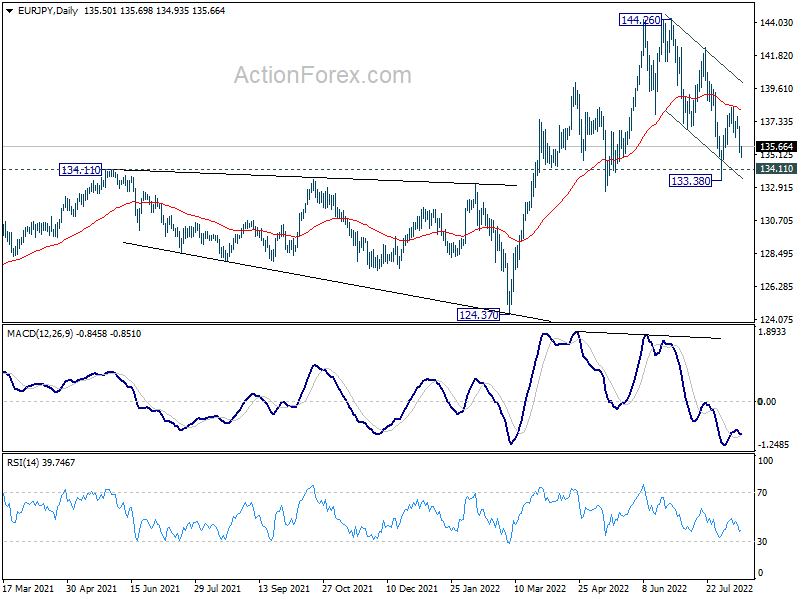
Intraday bias in EUR/JPY remains on the downside at this point. Deeper fall would be seen back to retest 133.38 low. Sustained break of 133.38/134.11 support zone will carry larger bearish implications. On the upside, above 136.28 minor resistance will turn intraday bias neutral first.
In the bigger picture, up trend from 114.42 (2020 low) is seen as the third leg of the pattern from 109.30 (2016 low). Further rally is in favor as long as 134.11 resistance turned support holds, even in case of deep pull back. Next target is 149.76 (2015 high). However, sustained break of 134.11 will be a sign of medium term bearish reversal and turn focus to 124.37 support for confirmation.
EUR/GBP Daily Outlook
Daily Pivots: (S1) 0.8407; (P) 0.8439; (R1) 0.8459; More...
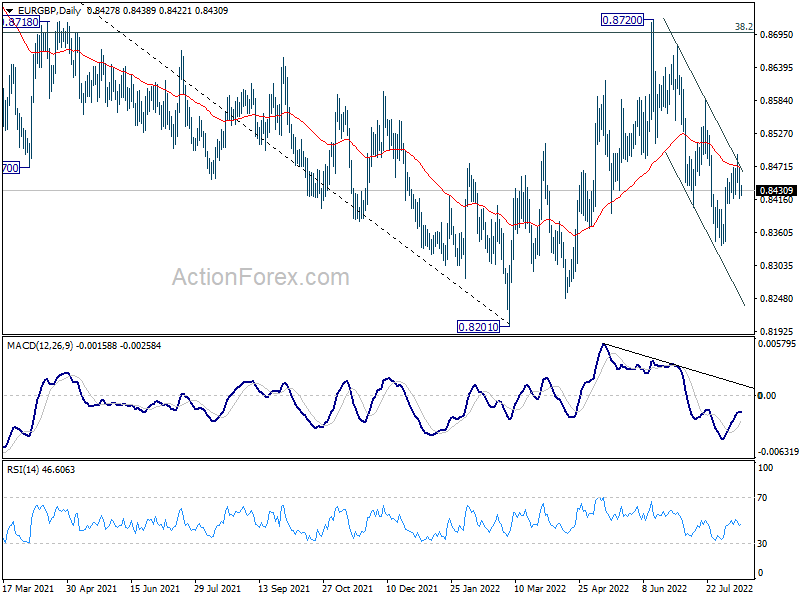
Outlook in EUR/GBP is unchanged and intraday bias stays neutral. Fall from 0.8720 is still expected to resume as long as 0.8585 resistance holds. Firm break of 0.8338 support will target a retest on 0.8201 low.
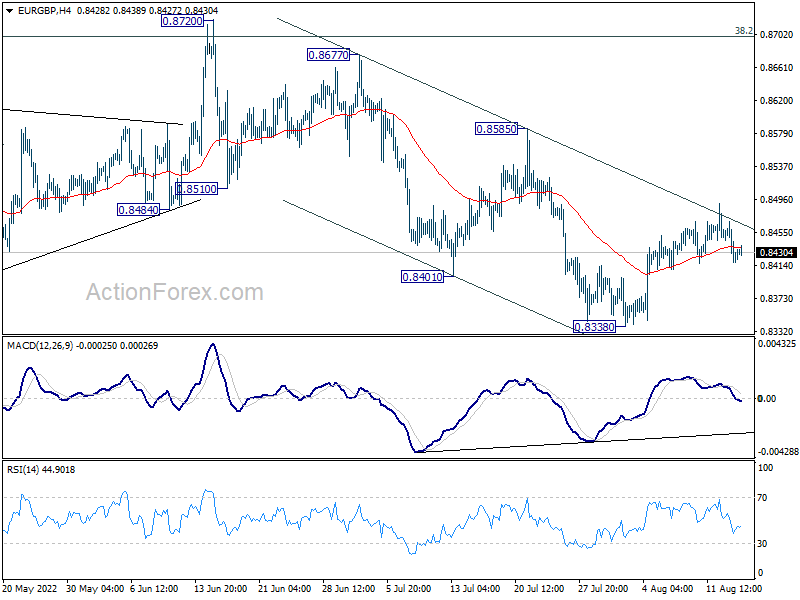
In the bigger picture, current development suggests rejection by 38.2% retracement of 0.9499 to 0.8201 at 0.8697. Medium term bearishness is maintained. Break of 0.8201 will resume larger down trend from 0.9499 (2020 high). Nevertheless, sustained break of 0.8697 will affirm the case that rise from 0.8201 is a medium term up trend itself.
EUR/AUD Daily Outlook
Daily Pivots: (S1) 1.4394; (P) 1.4470; (R1) 1.4540; More...
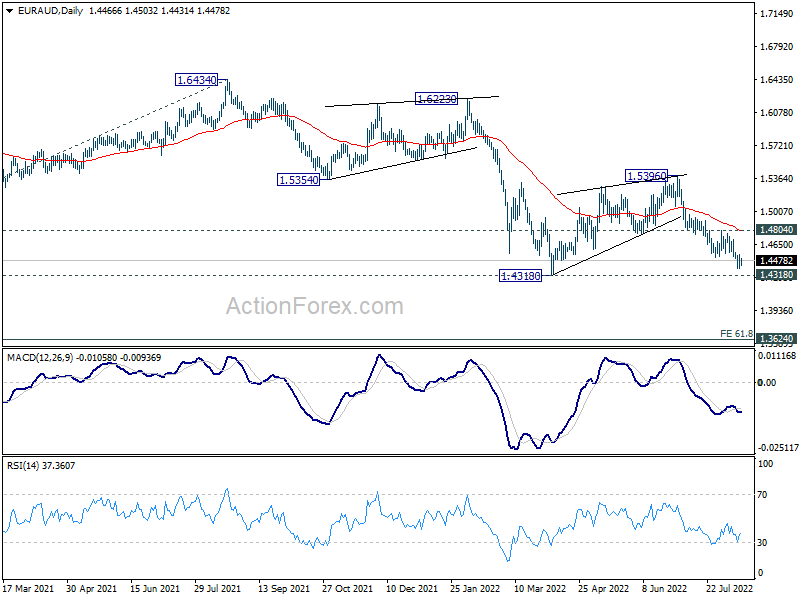
Further decline is expected in EUR/AUD despite some loss of downside momentum. Next target is 1.4318 low. Firm break there will resume larger down trend to medium term projection level at 1.3623. On the upside, break of 1.4804 resistance is needed to indicate short term bottoming. Otherwise, risk will stay on the downside in case of recovery.
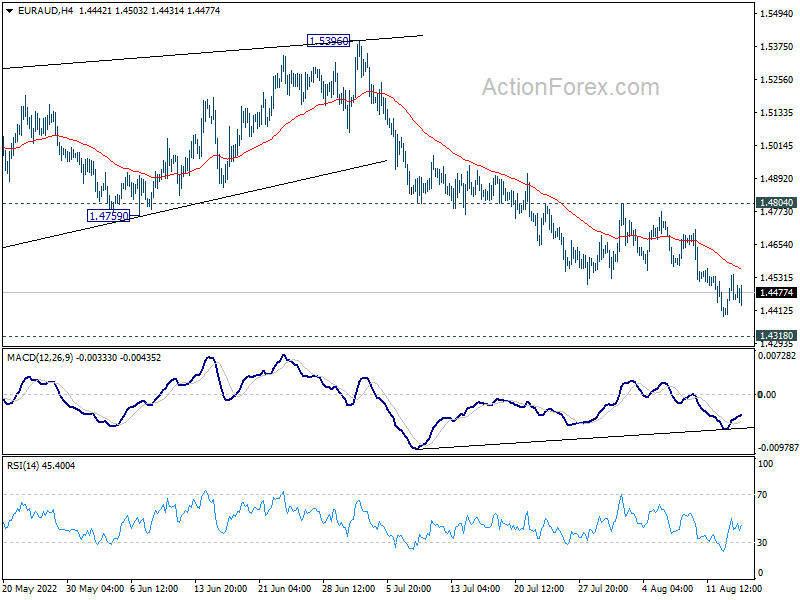
In the bigger picture, down trend from 1.9799 is still in progress. Break of 1.4318 low will target 61.8% projection of 1.9799 to 1.5250 from 1.6434 at 1.3623, which is close to 1.3624 long term support (2017 low). This will remain the favored case now as long as 1.5396 resistance holds.