Sample Category Title
EUR/USD: Bears Regained Control and Eye Key Supports
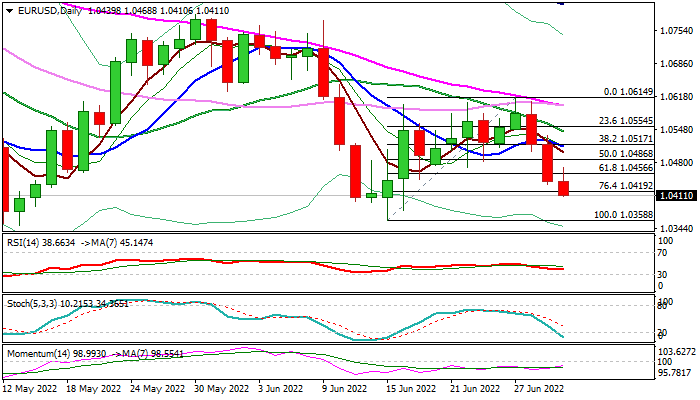
The Euro extends steep fall against the dollar into third straight day on Thursday, following a 1.3% drop in past two days, with probe through 1.0419 (Fibo 76.4% of 1.0358/1.0614 upleg) adding to signals that the corrective phase is over.
Bears eye key supports at 1.0358/49/40 (June 15 low / 2022 low / 2017 low), with firm break here to signal continuation of a larger downtrend from 2008 peak, paused for 2017/2022 consolidation.
Bearish studies on larger timeframes (day / week / month) support the scenario, though oversold conditions warn of headwinds from this critical support zone.
Fundamentals also do no work in favor of Euro as fears that slowing EU economy is likely sliding into recession are growing, with the latest data showing rise in German unemployment, adding to negative signals.
Res: 1.0435; 1.0456; 1.0486; 1.0513
Sup: 1.0380; 1.0358; 1.0349; 1.0340
USDCAD Showing Reaction From The Blue Box Area
Hello fellow traders. USDCAD has given us another trading opportunity recently. As our members know, we’ve been favoring the long side in USDCAD and buying the dips in 3,7,11 swings. Reason for expecting further rally is incomplete bullish structure the pair is showing in the weekly cycle from the 05.30. low . In this technical blog we’re going to take a quick look at the Elliott Wave charts of USDCAD, published in members area of the website.
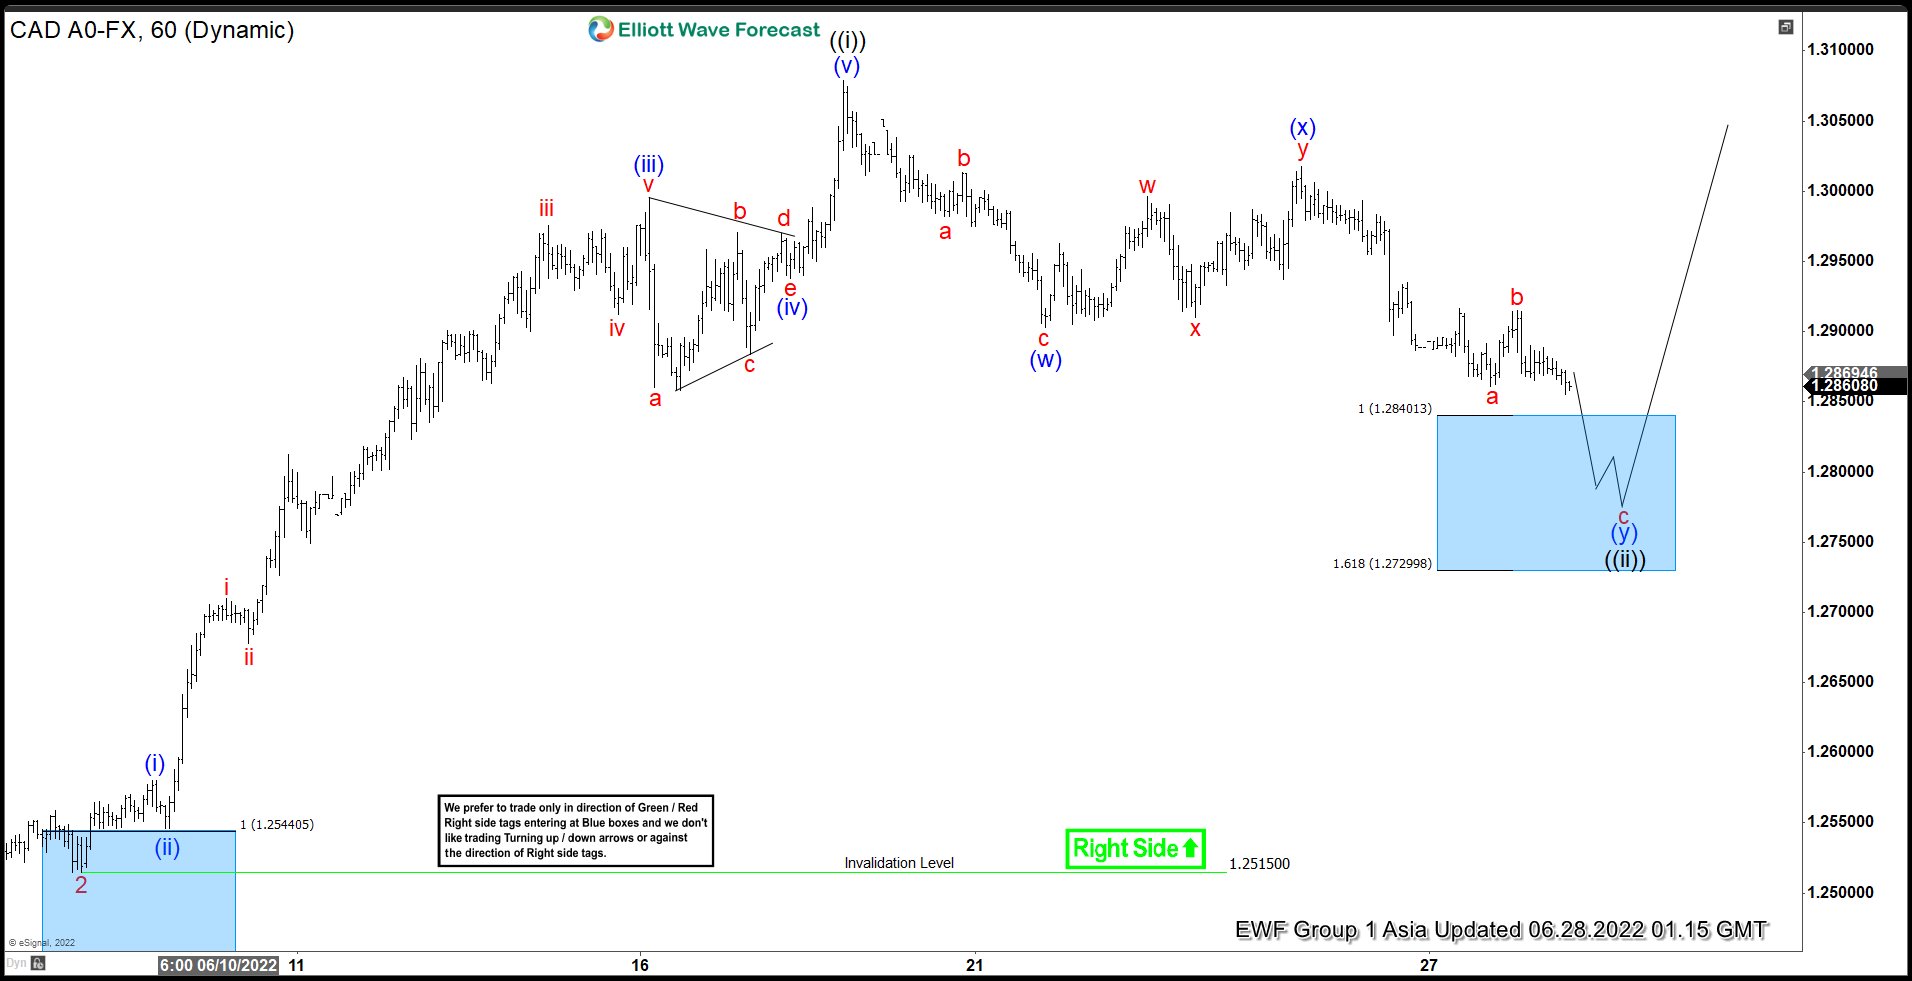
USDCAD Elliott Wave 1 Hour Chart 06.28.2022
USDCAD ended 5 waves up in the cycle from the 1.2515 low as wave ((i)) black . Currently we are getting wave ((ii)) black pull back. Correction is unfolding as Elliott Wave Double Three pattern. First leg of the pull back looks like 3 waves structure,then we got 3 waves bounce (x) and now looking for another leg down to have 3 waves in (y) blue leg as well. .
We don’t recommend selling the pair against the main bullish trend. Strategy is buying the dips at the marked blue box zone : 1.28401-1.2729 once it gets reached. As the main trend is bullish we expect buyers to appear at the blue box for 3 waves bounce at least. Once bounce reaches 50 Fibs against the (x) blue high, we will make long position risk free ( put SL at BE).
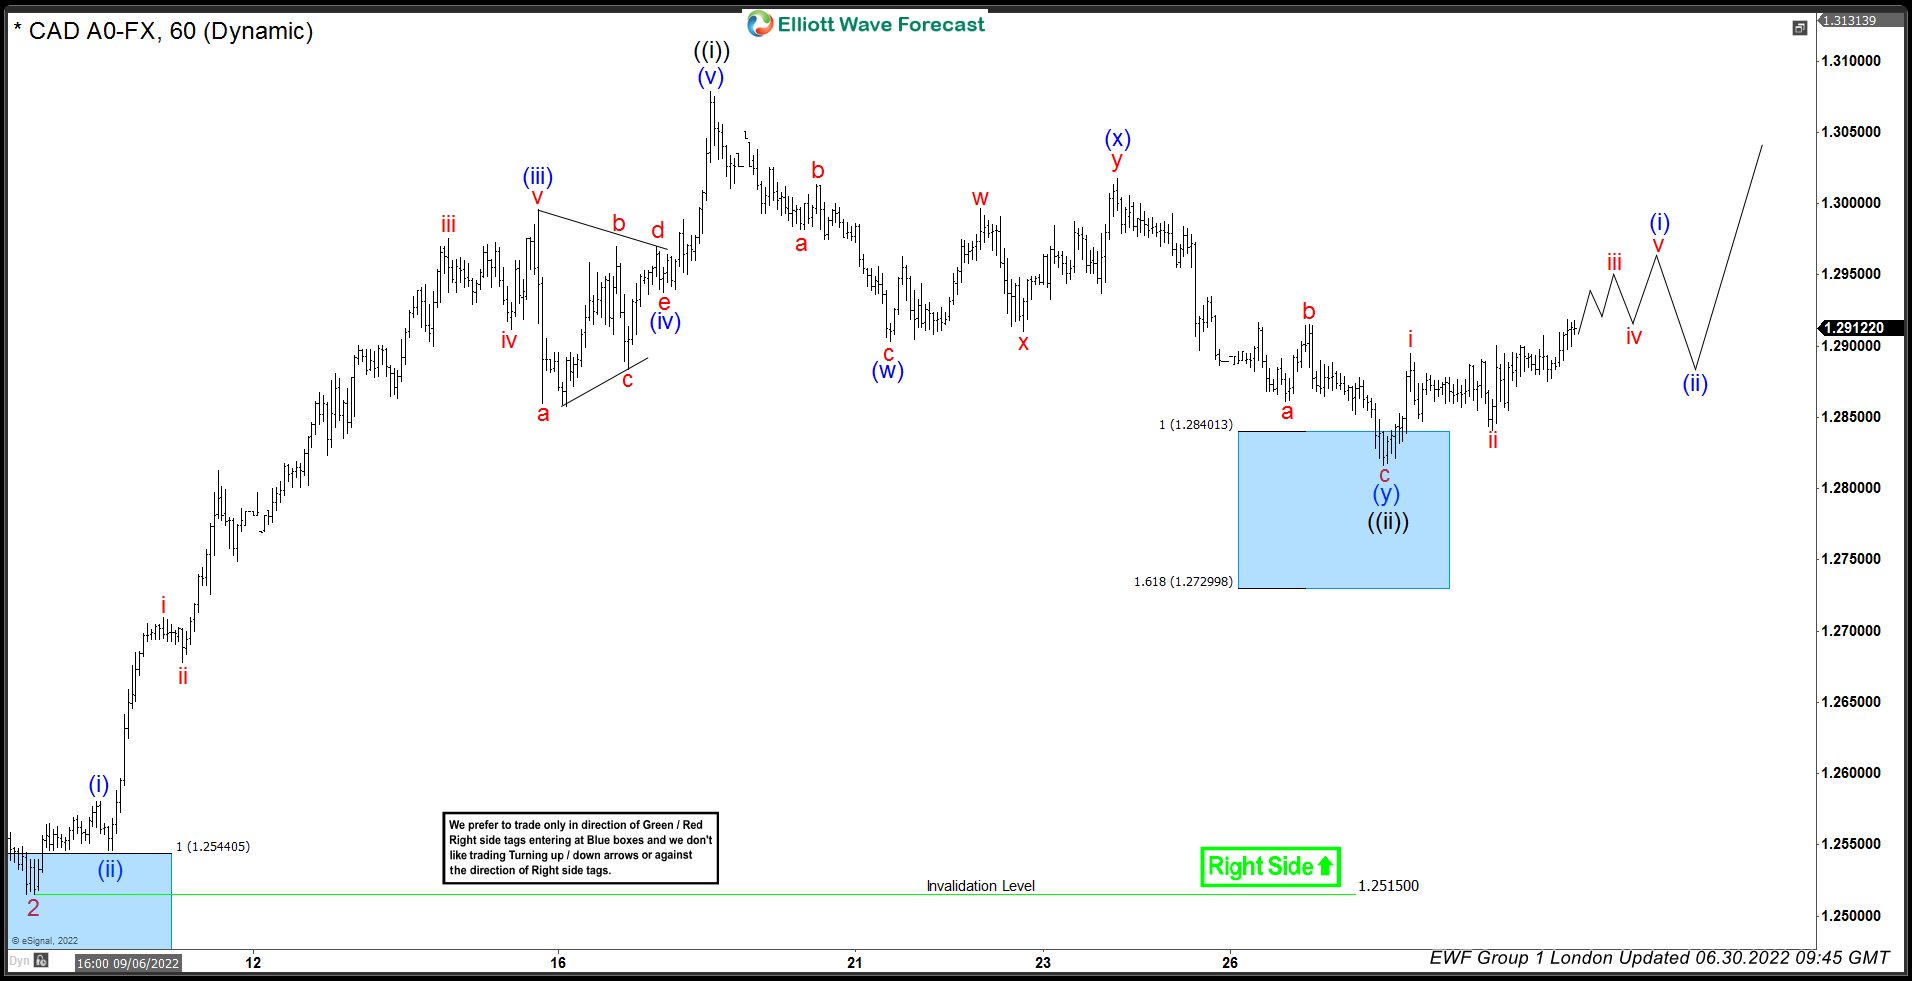
USDCAD Elliott Wave 1 Hour Chart 06.30.2022
Buyers appeared at the Blue Box area and we are getting reaction from there. The rally from the blue box already reached and exceeded 50 fibs against the (x) connector so,we booked partial profits and made trades risk free ( put SL at BE). Pull back ((ii)) is counted completed at 1.2816 low as Elliott Wave Double Three pattern. Now we need to see break of June 17th peak to confirm next leg up is in progress.
Keep in mind that market is dynamic and presented view could have changed in the mean time. You can check most recent charts in the membership area of the site. Best instruments to trade are those having incomplete bullish or bearish swings sequences. We put them in Sequence Report and best among them are shown in the Live Trading Room
Canadian Dollar Eyes GDP
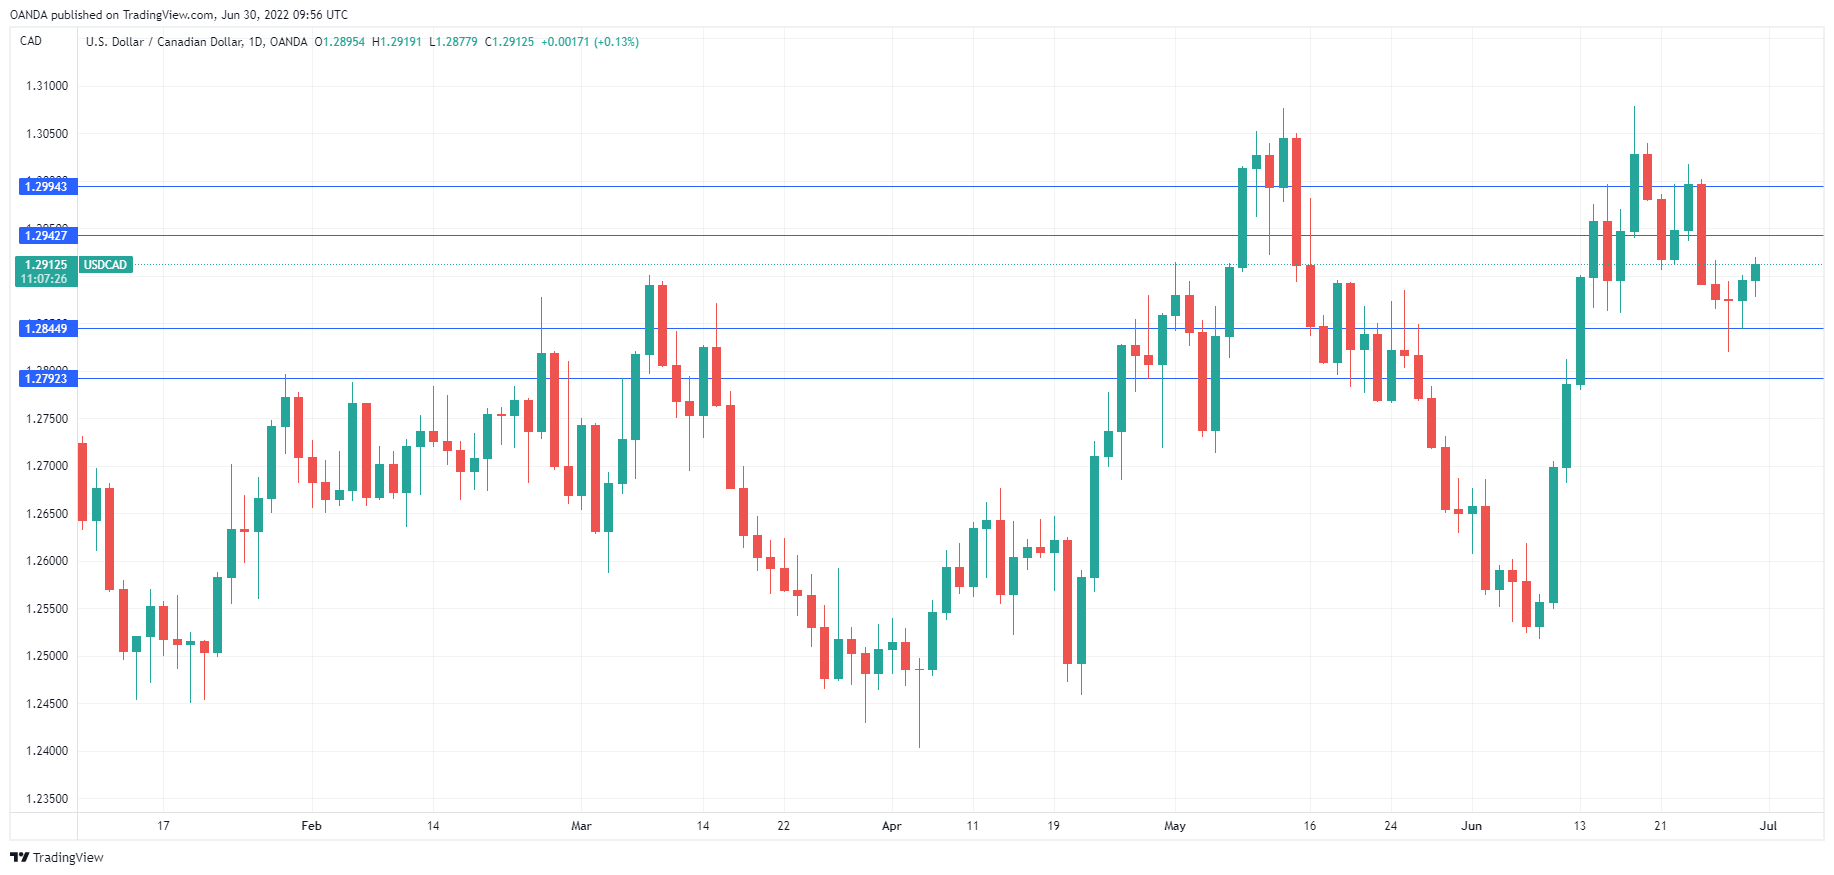
The Canadian dollar is trading quietly today, just above the 1.2900 level. That could change in the North American session, with the release of Canada’s GDP for April.
GDP expected to soften
Canada’s monthly GDP releases have been pointing southwards. In March, GDP slowed to 0.7, down from 0.9% prior. The April estimate stands at just 0.3%. This is a sign of concern, although there are some bright clouds on the horizon. The war in Ukraine, which has disrupted oil and grain supplies and sent commodity prices soaring, has proved to be a boon for the Canadian economy, as Canada is the world’s fourth-largest producer of both oil and wheat. The IMF is projecting that Canada will lead the G-7 nations in growth with a GDP of 3.9%.
Canada has not been immune from spiralling inflation, as headline CPI rose to 7.7% in May, its highest level since January 1983. Similar to the Federal Reserve, the Bank of Canada has scrambled to tighten policy in order to wrestle down inflation, which has become the central bank’s public enemy number one. There are expectations that the BoC may follow the Fed’s lead and deliver a super-size 0.75% rate hike at its July 12th meeting. Inflationary pressures are broad-based across the economy, which raises the risk of inflation (and inflation expectations) becoming entrenched.
The BoC’s aggressive rate-hike cycle has led to the start of a correction in the housing market, but the long-sought-after inflation peak remains elusive. The BoC has the daunting challenge of trying to guide the economy to a soft landing – if interest rates rise more than the economy can handle, the result will be a recession. The BoC, like the Fed, appears to prefer a recession over entrenched inflation, which is why we can expect the BoC’s aggressive rate moves to continue.
USD/CAD Technical
- There is resistance at 1.2942 and 1.2994
- USD/CAD has support at 1.2844 and 1.2792
EURUSD Bearish Momentum Gains Steam
The EURUSD pair declined sharply as key central banks warned that the era of easy money was coming to an end. Speaking at an ECB conference in Portugal, officials said that higher interest rates were necessary to curb soaring inflation. In his statement, Jerome Powell said that the Fed has accepted higher recession risks in its policies. He argued that the Fed must do whatever it takes to stabilize prices and restore stability. The same view was shared by Christine Lagarde of the ECB and Andrew Bailey of the BOE. Analysts now expect that the ECB will hike rates by either 0.25% or 0.50% in the coming meeting.
The US dollar rose against other currencies after the US published weak economic data. According to the statistics agency, the country’s economy contracted by 1.6% in the first quarter. This decline was worse than the previous estimate of -1.5%. The bureau pointed to lower consumer spending, higher trade deficit, and low government spending for the contraction. Analysts expect that the second quarter will also contract. The currency will next react to the upcoming personal consumption expenditure data. The median estimate by a Reuters poll is that core PCE dropped from 4.9% in April to 4.8% in June.
The British pound dropped below an important support level ahead of the upcoming UK economic data. Economists expect the numbers to reveal that the country’s economy rose by 0.8% in the first quarter. Analysts believe that the rising inflation and weak consumer spending will lead to a contraction in the second quarter. Other important data will be the house price index (HPI) data by Nationwide Society. With mortgage rates surging, most analysts believe that the HPI dropped from 11.2% in May to 10.8% in June.
GBPUSD
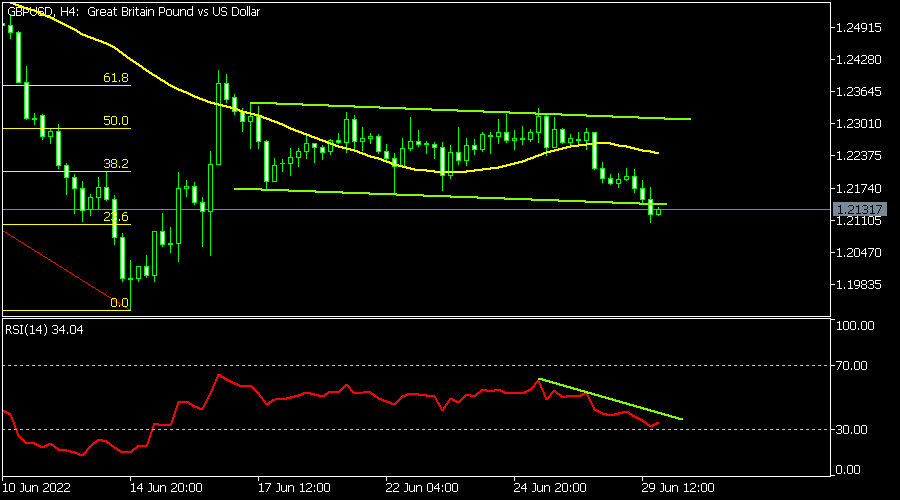
The GBPUSD pair retreated to a two-week low of 1.2128 after the hawkish tone by Powell and Bailey. As it dropped, it managed to move below the lower side of the descending channel shown in green. It has also fallen below the 25-day moving average, slightly above the 23.6% Fibonacci retracement level. The Relative Strength Index has moved close to the oversold level. Therefore, the pair will likely continue falling today.
EURUSD
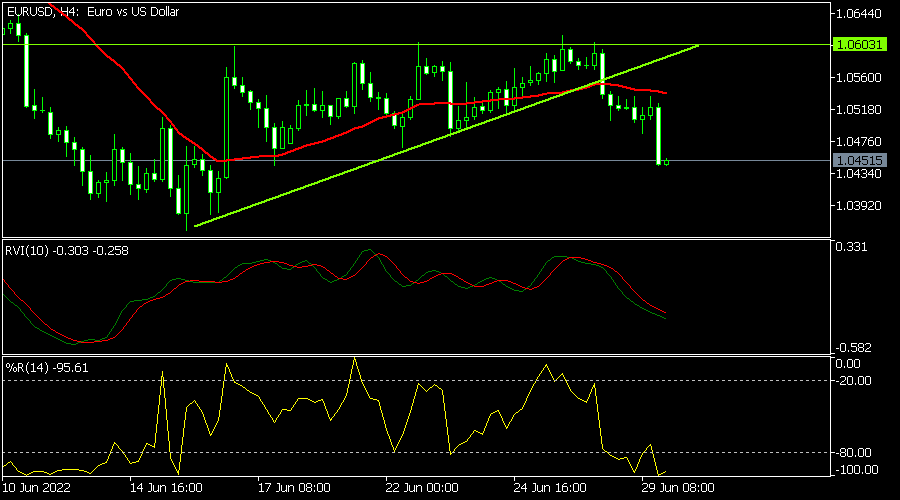
The EURUSD pair dropped to the lowest level since June 18 after the hawkish statement by Powell and Lagarde. It has moved below the 25-day moving average and the ascending trendline shown in green. The Relative Vigor Index (RVI) has fallen while the Williams % Range has dropped to the oversold level. The pair will likely continue falling, with the next key support being at 1.0400.
EURCHF
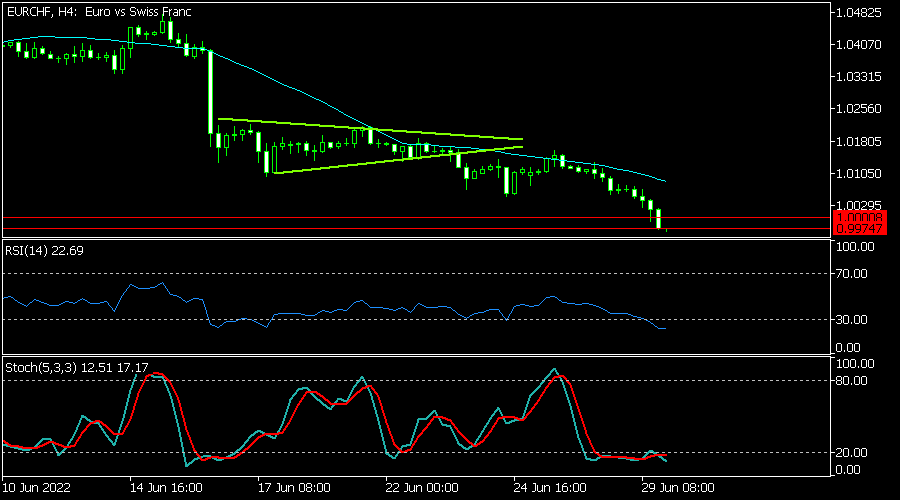
The EURCHF dropped below the parity level of 1.00 as the Swiss franc strength continued. It is trading at 0.9975, which was the lowest level since March this year. It has moved below the 25-day and 50-day moving averages while most oscillators have moved to the oversold point. The pair will likely continue falling as the Swiss franc gains momentum.
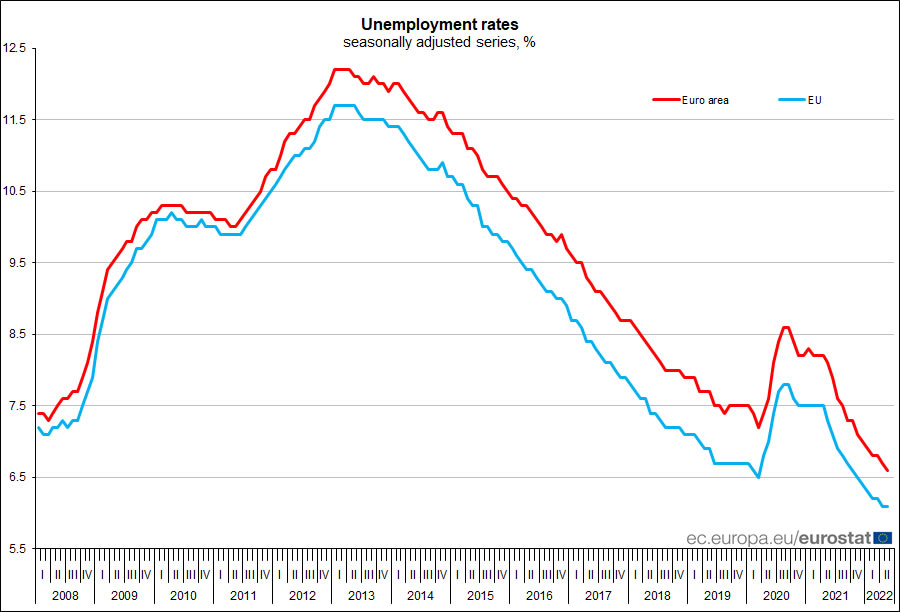
Eurozone unemployment rate dropped to 6.6% in May, EU unchanged at 6.1%
Eurozone unemployment rate dropped from 6.7% to 6.6% in May, better than expectation of 6.8%. EU unemployment rate was unchanged at 6.1%. Eurostat estimates that 13.066m men and women in the EU, of whom 11.004m in the Eurozone , were unemployed in May
The Cryptocurrency Market is Stuck at Past Highs
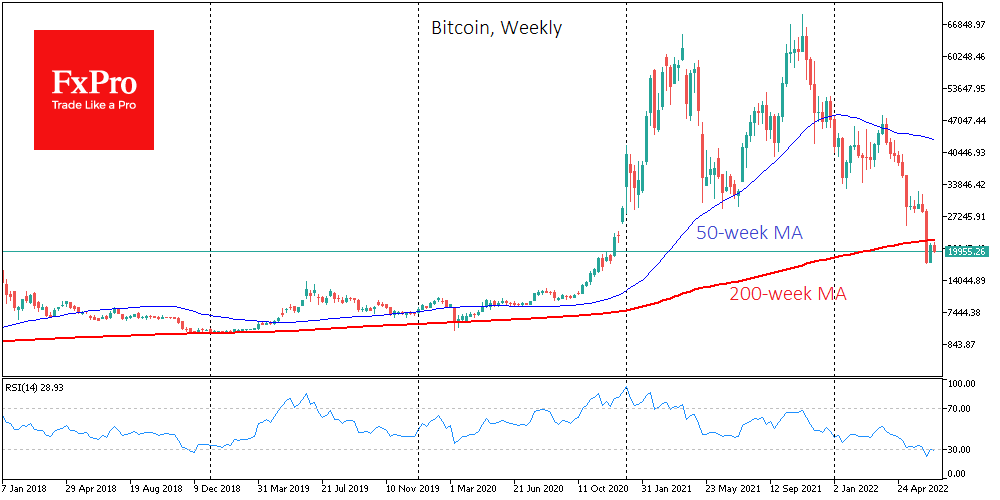
Bitcoin changed little over Wednesday and is trading slightly below $20K on Thursday morning, keeping the controversy at bay, which is now a defining moment for the cryptocurrency market. Ethereum lost 5.1% in 24 hours to $1090. Altcoins in the top 10 fell from 0.7% (Tron) to 8.5% (Solana). The exception was Dogecoin (+0.9%).
The Cryptocurrency Fear and Greed Index was down 2 points to 11 by Thursday and remains in a state of “extreme fear”.
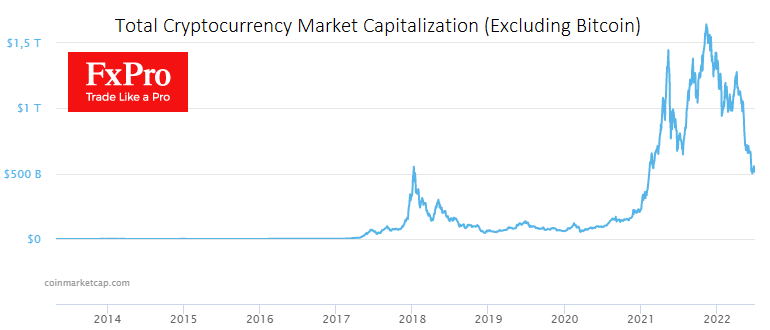
Total crypto market capitalisation, according to CoinMarketCap, sagged 2% overnight to $891bn. Market capitalisation without Bitcoin falls back to 500bn, where it briefly fell from mid-month.
The hypothesis that the crypto market is holding above the highs of the previous peak continues to pass an important test. This applies to Bitcoin with its protracted test of 20k and to altcoins, whose total capitalisation is now near past peaks, at the start of 2018.
MicroStrategy has bought an additional 480 BTC at an average price of around $20,817, CEO Michael Saylor said. As of 28 June, MicroStrategy owns 129,699 BTCs purchased for $3.98bn at an average price of $30,664. Against the backdrop of the first cryptocurrency’s collapse, the company’s loss from bitcoin holdings exceeded $1bn.
A court in the British Virgin Islands has liquidated hedge fund Three Arrows Capital (3AC), headquartered in Singapore. Founded in 2012, the hedge fund had raised tens of billions in investments in the crypto market but suffered losses of at least $400m in the last year when it liquidated its stock positions.
Investment firm Cypherpunk Holdings sold all its assets in bitcoin and Ethereum amid a falling market. The total proceeds from the sale of the cryptocurrencies amounted to almost $5 million.
The current crisis in the cryptocurrency industry will benefit the industry and weed out those who don’t belong in it, American rapper Snoop Dogg said.
A survey by Alto found that nearly 40% of Americans aged 25 to 40 prefer to invest in cryptocurrencies rather than traditional financial instruments. In terms of appeal, digital assets have almost equalled equities.
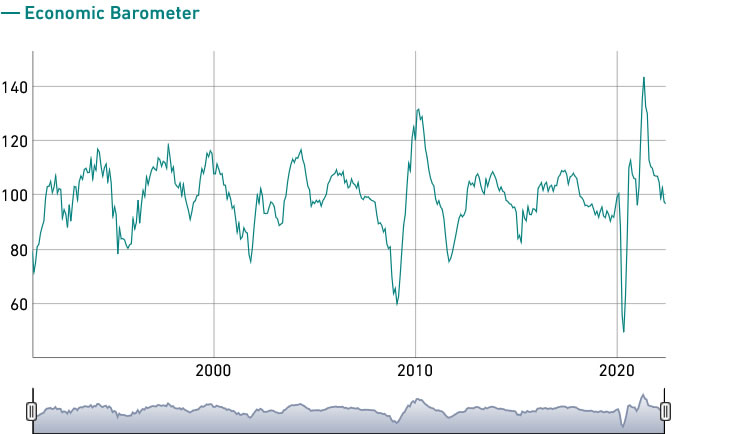
Swiss KOF economic barometer dropped to 96.9 in Jun, subdued outlook in upcoming months
Swiss KOF Economic Barometer dropped from 97.7 to 96.9 in June, slightly above expectation of 96.8. It's now below long-term average for the second month in a row. KOF said, "the outlook for the Swiss economy in the upcoming months therefore remains subdued."
KOF added: "The downward movement of the barometer is primarily driven by bundles of indicators for foreign demand and manufacturing. Only indicators for the financial and insurance services sector and for the construction sector are at a nearly constant level. However, indicator bundles for private consumption show a slight positive trend."
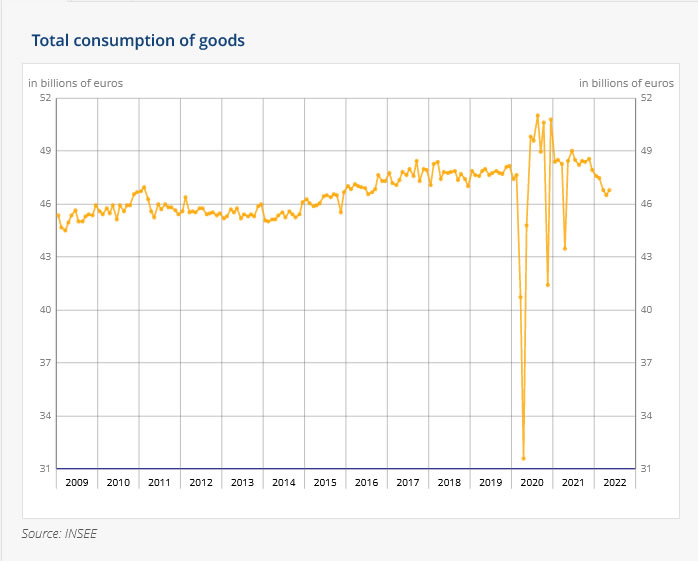
France consumer spending rose 0.7% mom in May, almost exclusively on manufactured goods
France consumer spending rose 0.7% mom in May, slightly above expectation of 0.6% mom. That's the first increase after five months of contraction. The increase was almost exclusively due to the clear rebound in consumption of manufactured goods (+2.7% after -1.3% in April). Food consumption was stable (+0.1% after -1.2%) while energy consumption decreased significantly (-2.6% after +1.9%).
AUDUSD on the Verge of a Downtrend Resumption
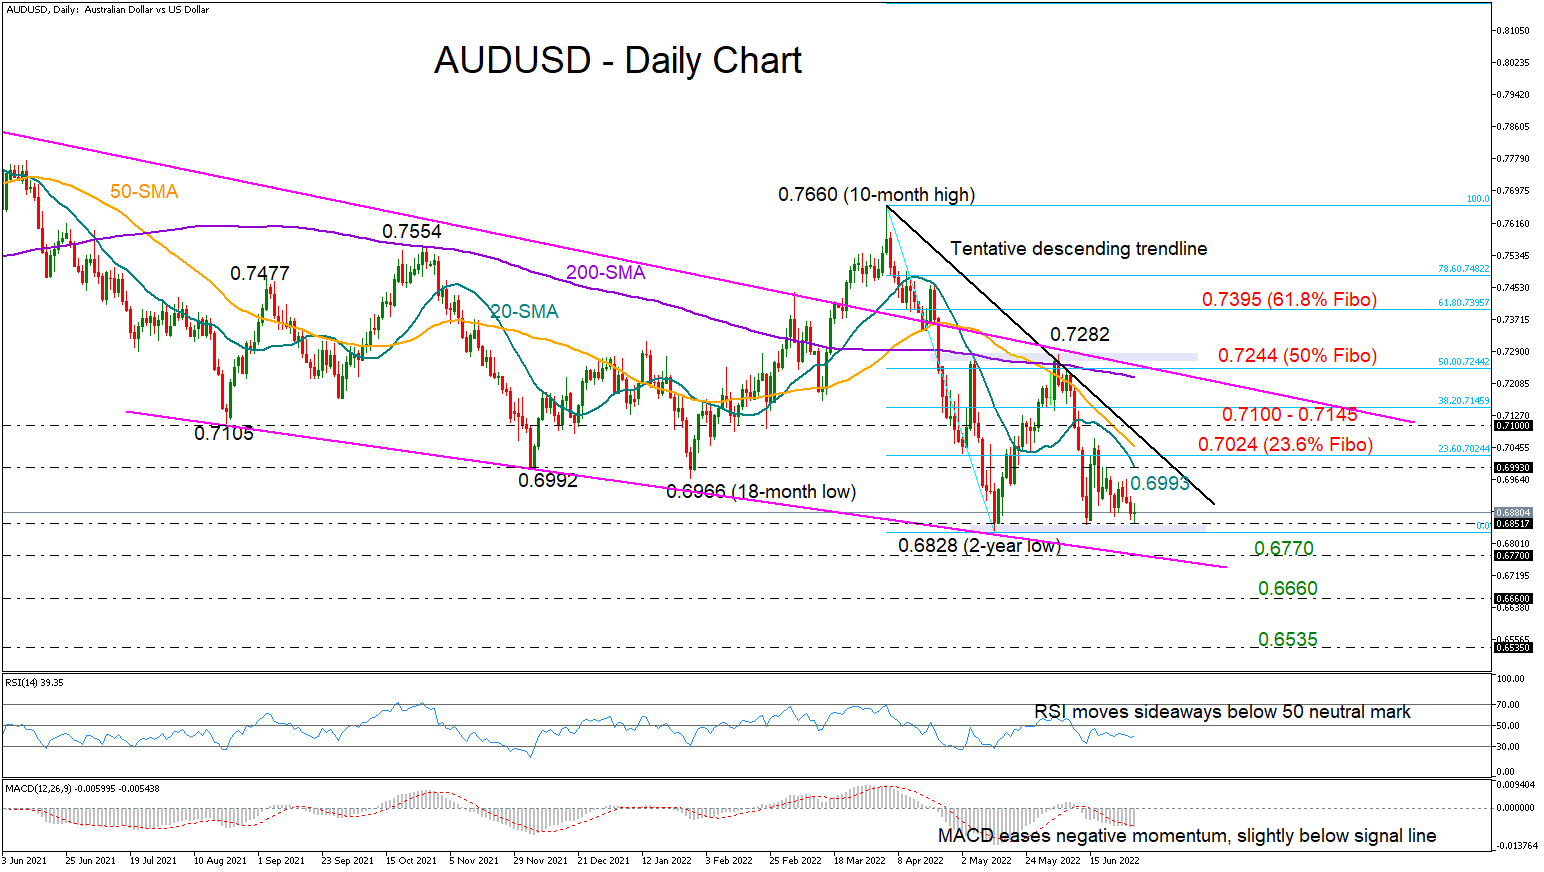
AUDUSD has completely reversed its mid-June bullish move to trade at the bottom of its broad downtrend and marginally above the familiar support zone of 0.6850.
The falling simple moving averages (SMAs) are signaling a continuation of the long-term negative trend after a short period of consolidation, though the momentum indicators are rather directionless, with the RSI moving sideways below its 50 neutral mark and the MACD stabilizing its decline slightly below its red signal line.
In the event the price tumbles below the 0.6850 floor, the strong support line drawn from 0.7105 (August 2021) could be an ideal place for a rebound around 0.6770. A clear close below that bar could intensify selling pressures towards the 0.6660 barricade, which had been strongly rejecting upside and downside moves during the 2019 – 2020 period. If that collapses as well, the pair could next visit the 0.6535 mark from May 2020.
In the bullish scenario, where the 0.6850 base keeps a strong footing under the price, the pair may attempt to crawl above last week’s resistance of 0.6993. The 20-day SMA is currently intersecting that barrier, while not far above, the 23.6% Fibonacci retracement of April’s downfall and the tentative descending trendline that is seen at 0.7024 may block the way towards the 0.7100 – 0.7145 zone. Should buying forces dominate from here, the spotlight will immediately turn to the 200-day SMA and the long-term constraining line from the 2021 top of 0.8000 currently sitting around the 61.8% Fibonacci of 0.7260.
Summarizing, AUDUSD is on the verge of an outlook deterioration as the price is testing the bottom of its long-term downtrend. A decisive step below 0.6850 is expected to trigger the next bearish action, while a fast rally above the 0.7024 area is required to bring buyers into play.
GBP/JPY Daily Outlook
Daily Pivots: (S1) 165.23; (P) 165.79; (R1) 166.17; More...
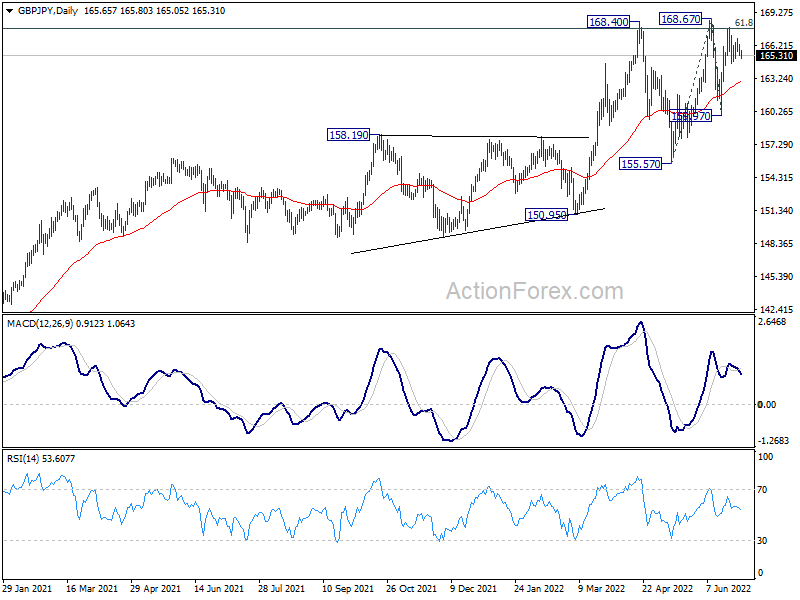
Outlook in GBP/JPY is unchanged and intraday bias stays neutral for the moment. On the upside, decisive break of 168.67 resistance will resume larger up trend. Next near term target is 100% projection of 155.57 to 168.67 from 159.97 at 173.07. On the downside, below 164.45 minor support will turn bias back to the downside for 159.97 support instead.
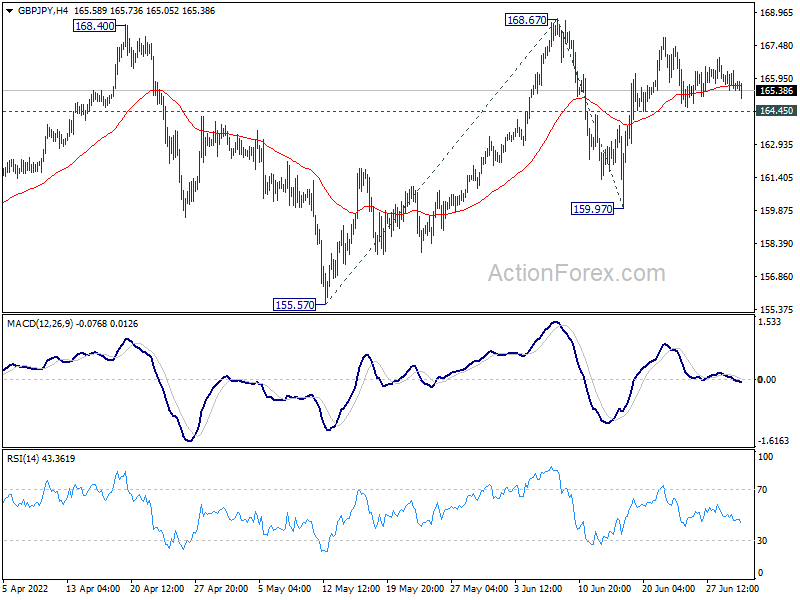
In the bigger picture, up trend from 123.94 (2020 low) is still in progress. Sustained break of 61.8% retracement of 195.86 (2015 high) to 122.75 (2016 low) at 167.93 will be a long term bullish signal, and could pave the way back to 195.86 high. This will now remain the favored case as long as 155.57 support holds, even in case of deep pull back.