Sample Category Title
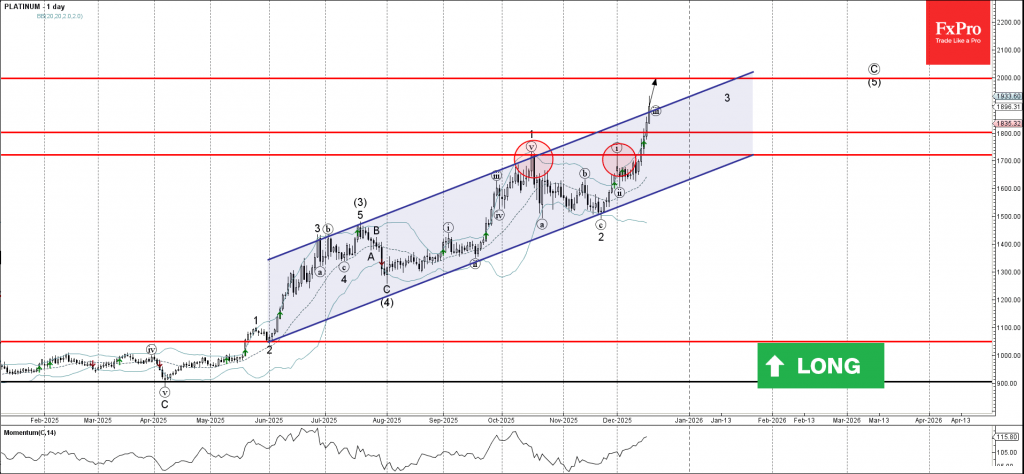
Platinum Wave Analysis
Platinum: ⬆️ Buy
- Platinum broke resistance level 1800.00
- Likely to rise to resistance level 2000.00
Platinum rising inside the accelerated the impulse wave 3 which recently broke the resistance area between the resistance level 1800.00 and the resistance trendline of the daily up channel from June.
The breakout of this resistance area strengthened the bullish pressure on Platinum.
Given the predominant daily uptrend, Platinum can be expected to rise further to the next round resistance level 2000.00 (target price for the completion of the active impulse wave (5)).
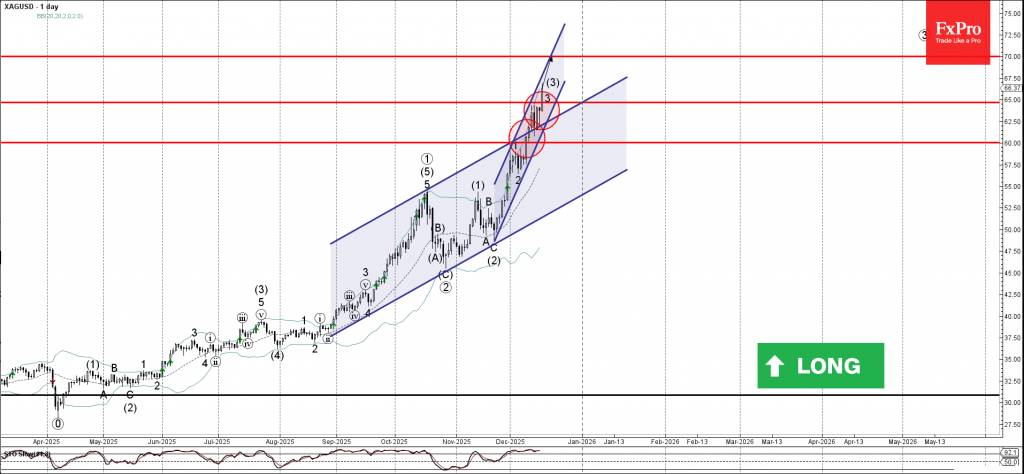
Silver Wave Analysis
Silver: ⬆️ Buy
– Silver broke resistance zone
– Likely to rise to resistance level 70.00
Silver recently broke the resistance zone between the resistance levels 60.00 and 65.00 as well as the resistance trendline of the daily up channel from August.
The breakout of this resistance zone accelerated the active short-term impulse wave 3 of the intermediate impulse wave (3) from the end of November.
Given the strong daily uptrend, Silver can be expected to rise further to the next round resistance level 70.00 (target price for the completion of the active impulse wave (3)).
Metals Explode: Silver (XAG/USD) Hits Record $66 as Platinum (XPT/USD) Breaks 2011 Highs
The Debasement Trade continues to roar today.
Despite slowing inflows into Cryptocurrencies and Stocks sending mixed signals since Friday, Metals are shining bright.
As observed in our Overnight brief, Silver has exploded to yet another fresh record at $66, surpassing targets explored in our pre-FOMC analysis. There are some technical warnings arising however,
Platinum is also profiting massively from these inflows, finally breaking its 2011 highs of $1,915.
More rare than Gold, the White Metal is now standing just 15% away from its 2008 All-Time Highs ($2,300) and appears on track to test that historic level.
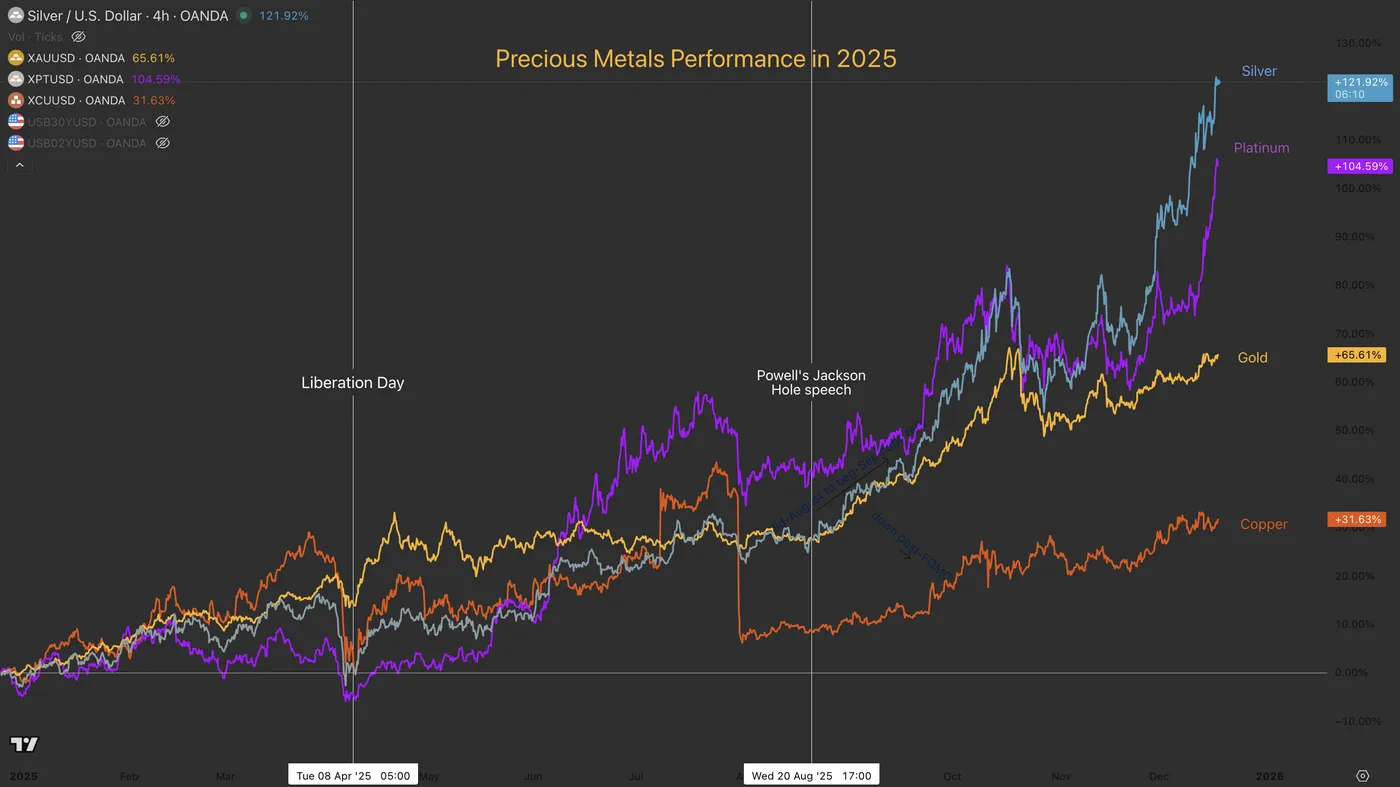
Metal Performance in 2025. December 17, 2025 – Source: TradingView. Spot the accelerations after Liberation Day and Powell's Jackson Hole Speech.
Why are metals rallying again?
The answer lies in the aftermath of the recent Non-Farm Payrolls report.
While the Unemployment Rate ticked higher, overall employment levels still do not guarantee a Fed cut in January. This policy ambiguity, combined with lingering doubts regarding the future path of the economy, is bolstering demand for precious metals as primary safe havens amidst the uncertainty.
However, the picture may only clear up after tomorrow's high-importance CPI report.
Let's dive into a multi-timeframe analysis (Monthly and Intraday) of Silver and Platinum to spot what technical levels and signals are arising.
Silver (XAG/USD) Monthly Chart
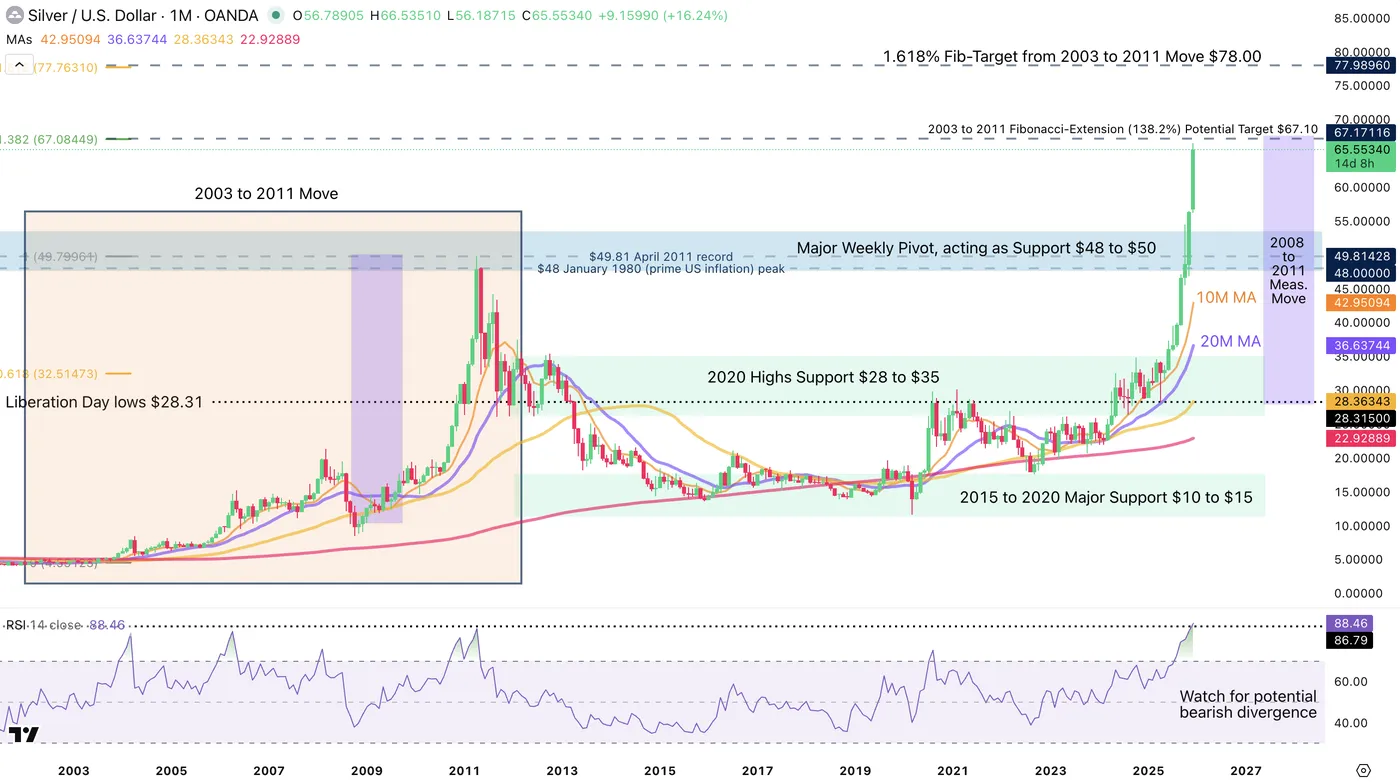
Silver (XAG/USD) Monthly Chart. December 17, 2025 – Source: TradingView
Silver is exploding to its record prices in quite a high fashion.
The Monthly chart offers a stellar view of how significant the move is.
Up 100% since June, what recently were historic peaks are now far-away.
The $48 to $53 zone acts as a major high timeframe pivot of the price action in the event of any retracement.
Moving below could trigger a huge bearish event, while holding above in a retest would allow for a significant dip-buying opportunity.
Keep an eye on Weekly RSI bearish divergence if a top forms anywhere near current levels.
A Fibonacci-Extension from the 2003 to 2011 could point to $67.10 potentially acting as major resistance, particularly with the current breakout reaching similar stretches as the 2008-2011 move (purple squares)
Silver (XAG/USD) 4H Chart and Technical Levels
Silver (XAG/USD) 4H Chart. December 17, 2025 – Source: TradingView
Silver is still evolving within its intraday upward channel.
Keep an eye on how it reacts to its boundaries. Currently at its highs, some profit-taking (Selling) flows could arise.
Naturally, watch for a potential breakout to the upside or downside depending on tomorrow's CPI!
Levels to watch for Silver (XAG/USD) trading:
Resistance Levels:
- Resistance $65 to $67 at Current All-time Highs
- Key Fibonacci Target $67.10
- 1.618% Potential Fib-Target from 2003 to 2011 Move $78.00
- $66.53 session highs
Support Levels:
- Major Intraday Pivot $61 to $63
- Pre-FOMC Support $58.00 to $60
- $53.50 to $54 Previous ATH resistance now Support
- Major Weekly Pivot, acting as Support $48 to $50
- $45 October Lows
Platinum (XPT/USD) Monthly Chart
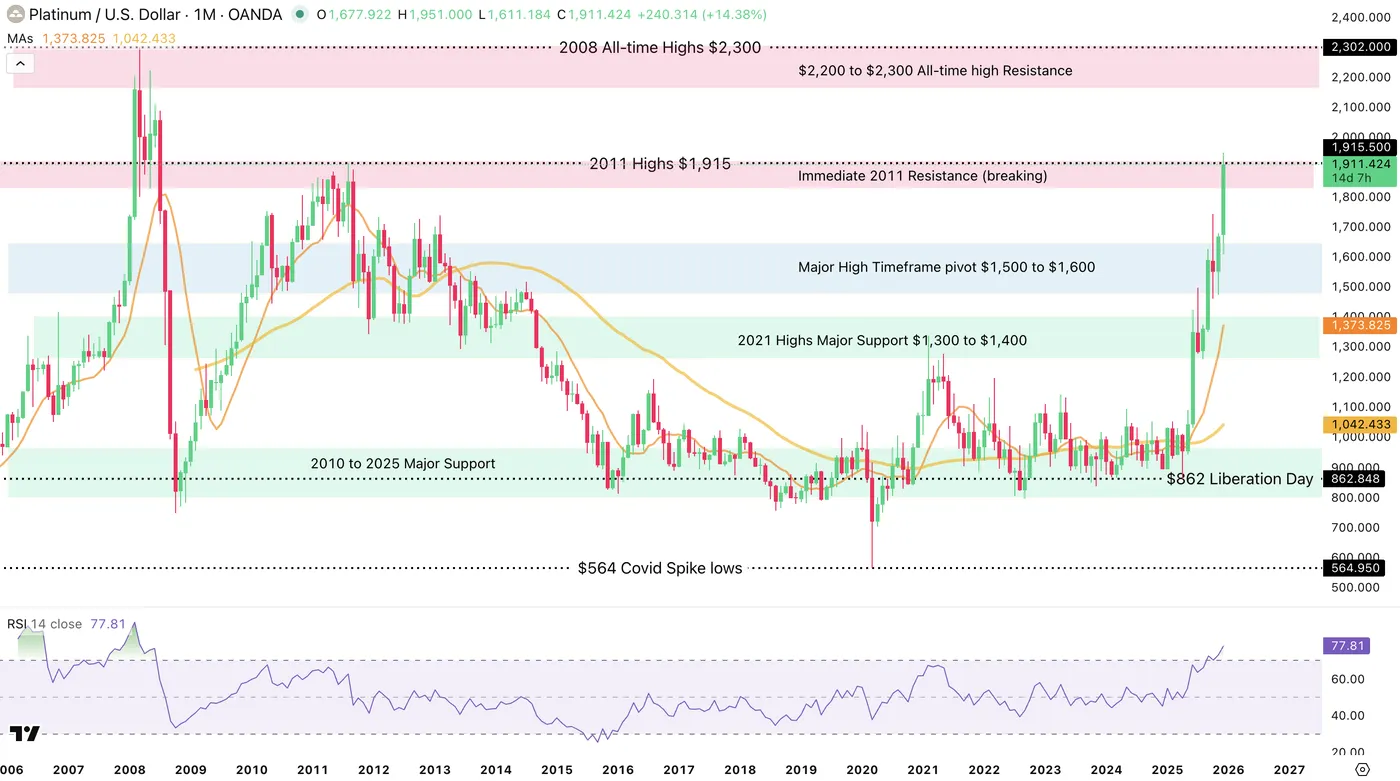
Platinum (XPT/USD) Monthly Chart. December 17, 2025 – Source: TradingView
Platinum is a late bloomer within the current Metal Supercycle, but it's catching up to its peers quite fast.
Our previous analysis of the Metal pointed to the idea of Platinum potentially catching up to Gold. Necessary for many technological developments, its demand should keep increasing throughout the years – But what prevents it from reaching similar levels to Gold is Central Bank demand (A huge fundamental boost to all metals since 2025).
After stalling its ascent while Silver and Gold advanced, bulls are now breaking above its 2008 highs.
Inflows into the metal are still dependent on other metals such as Gold or Silver advancing further, but XPT/USD could offer a very interesting option for those who missed the rally in the yellow and grey precious metals.
From what it looks like, the current rally is occurring on these flows. To get more details of Platinum fundamentals, I strongly invite you to check out our End-November analysis.
Platinum (XPT/USD) 4H Chart and Technical Levels

Platinum (XPT/USD) 4H Chart. December 17, 2025 – Source: TradingView
XPT/USD has broken out to the upside from its 2025 ascending channel.
The ongoing move is a very strong one (look at how steep the current uptrend is.)
Some small profit-taking flows are occurring at overbought levels, indicative of a prompt retracement – The new 14 year highs are at $1,950 and breaking higher would see no resistance until $2,050 to $2,100.
For dip-buyers, keep a close look at how the metal reacts to the retest of the 2025 highs upper bound at $1,850.
The same occurred in Silver and led to a 100% move since.
Platinum Technical Levels to keep on your charts:
Resistance levels
- Immediate Resistance at 2011 Highs $1910 to $1,950 (breaking?)
- Session highs $1,950
- May 2008 Pivotal Resistance $2,050 to $2,100
- $2,300 2008 All-time highs
Support levels
- 2025 Channel upper bound $1,850 (Mini-Support)
- 2013 and Current year highs $1,700 to $1,750
- $1,620 to $1,650 FOMC Support
- Major High Timeframe pivot $1,500 to $1,600
Safe Trades!
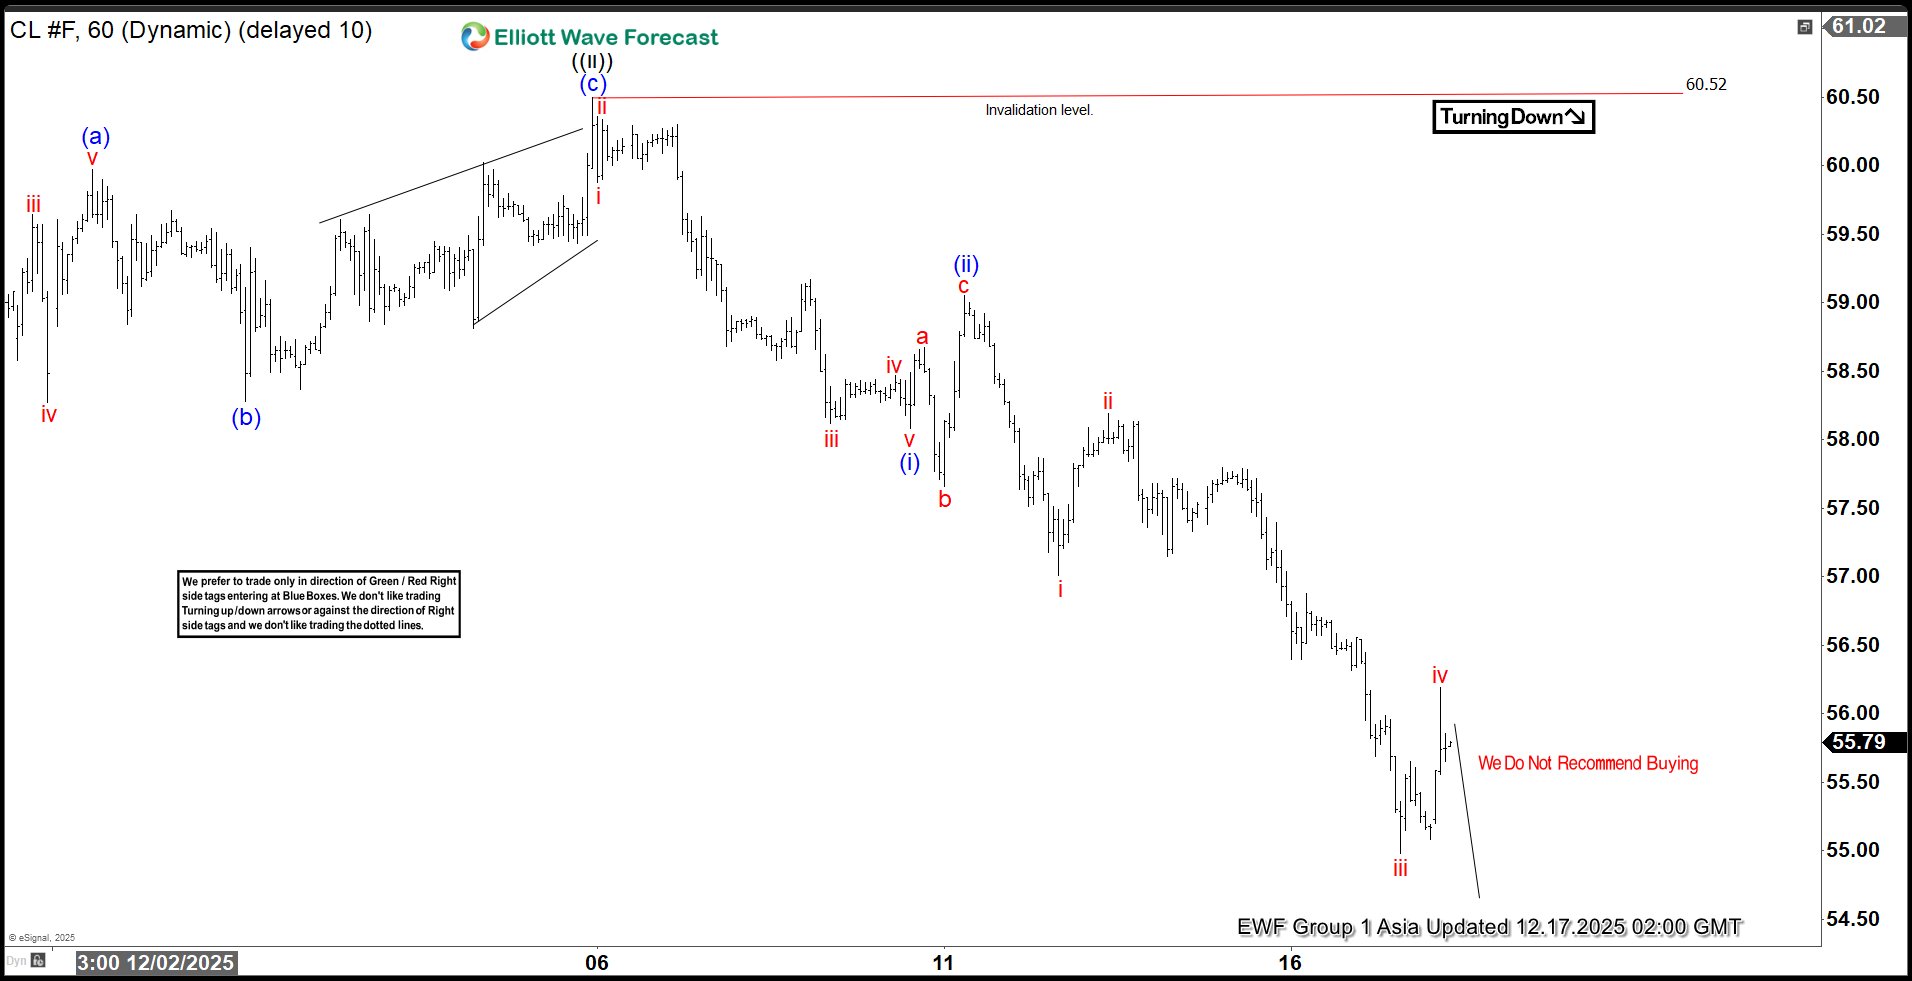
Bearish Sequence Pressures Oil (CL) Lower
Light Crude Oil (CL) has decisively broken below the April 2025 low of $55.12. This breach confirms a continuation of the bearish sequence that has persisted since the March 2022 peak. The short-term decline from the October 24, 2025 high is unfolding in the form of a five-wave Elliott Wave impulse, which provides a clear structural framework for the ongoing weakness.
From the October 24 peak, wave ((i)) concluded at $57.10. The subsequent rally in wave ((ii)) developed as a zigzag Elliott Wave structure. Within this corrective phase, wave (a) terminated at $59.97, wave (b) ended at $58.28, and wave (c) advanced to $60.50. This final push completed wave ((ii)) at a higher degree, setting the stage for renewed downside pressure.
Oil then turned lower in wave ((iii)). From the termination of wave ((ii)), wave (i) ended at $58.08, while the rally in wave (ii) reached $59.05. The decline in wave (iii) is now progressing as an impulse of lesser degree. Within this sequence, wave i ended at $57.01, wave ii rallied to $58.19, and wave iii dropped sharply to $54.98. A corrective bounce in wave iv extended to $59.19, but momentum remains tilted to the downside. Near term, as long as the pivot at $60.50 holds firm, rallies are expected to fail in corrective sequences of three, seven, or eleven swings. This technical condition suggests further weakness ahead, reinforcing the broader bearish outlook for crude oil prices.
Light Crude Oil (CL) 60-Minute Elliott Wave Chart From 12.17.2025
CL Elliott Wave Video:
https://www.youtube.com/watch?v=WVXexahQ3pw
Crypto Rebound Fades With a 40% Drop Possible
Market Overview
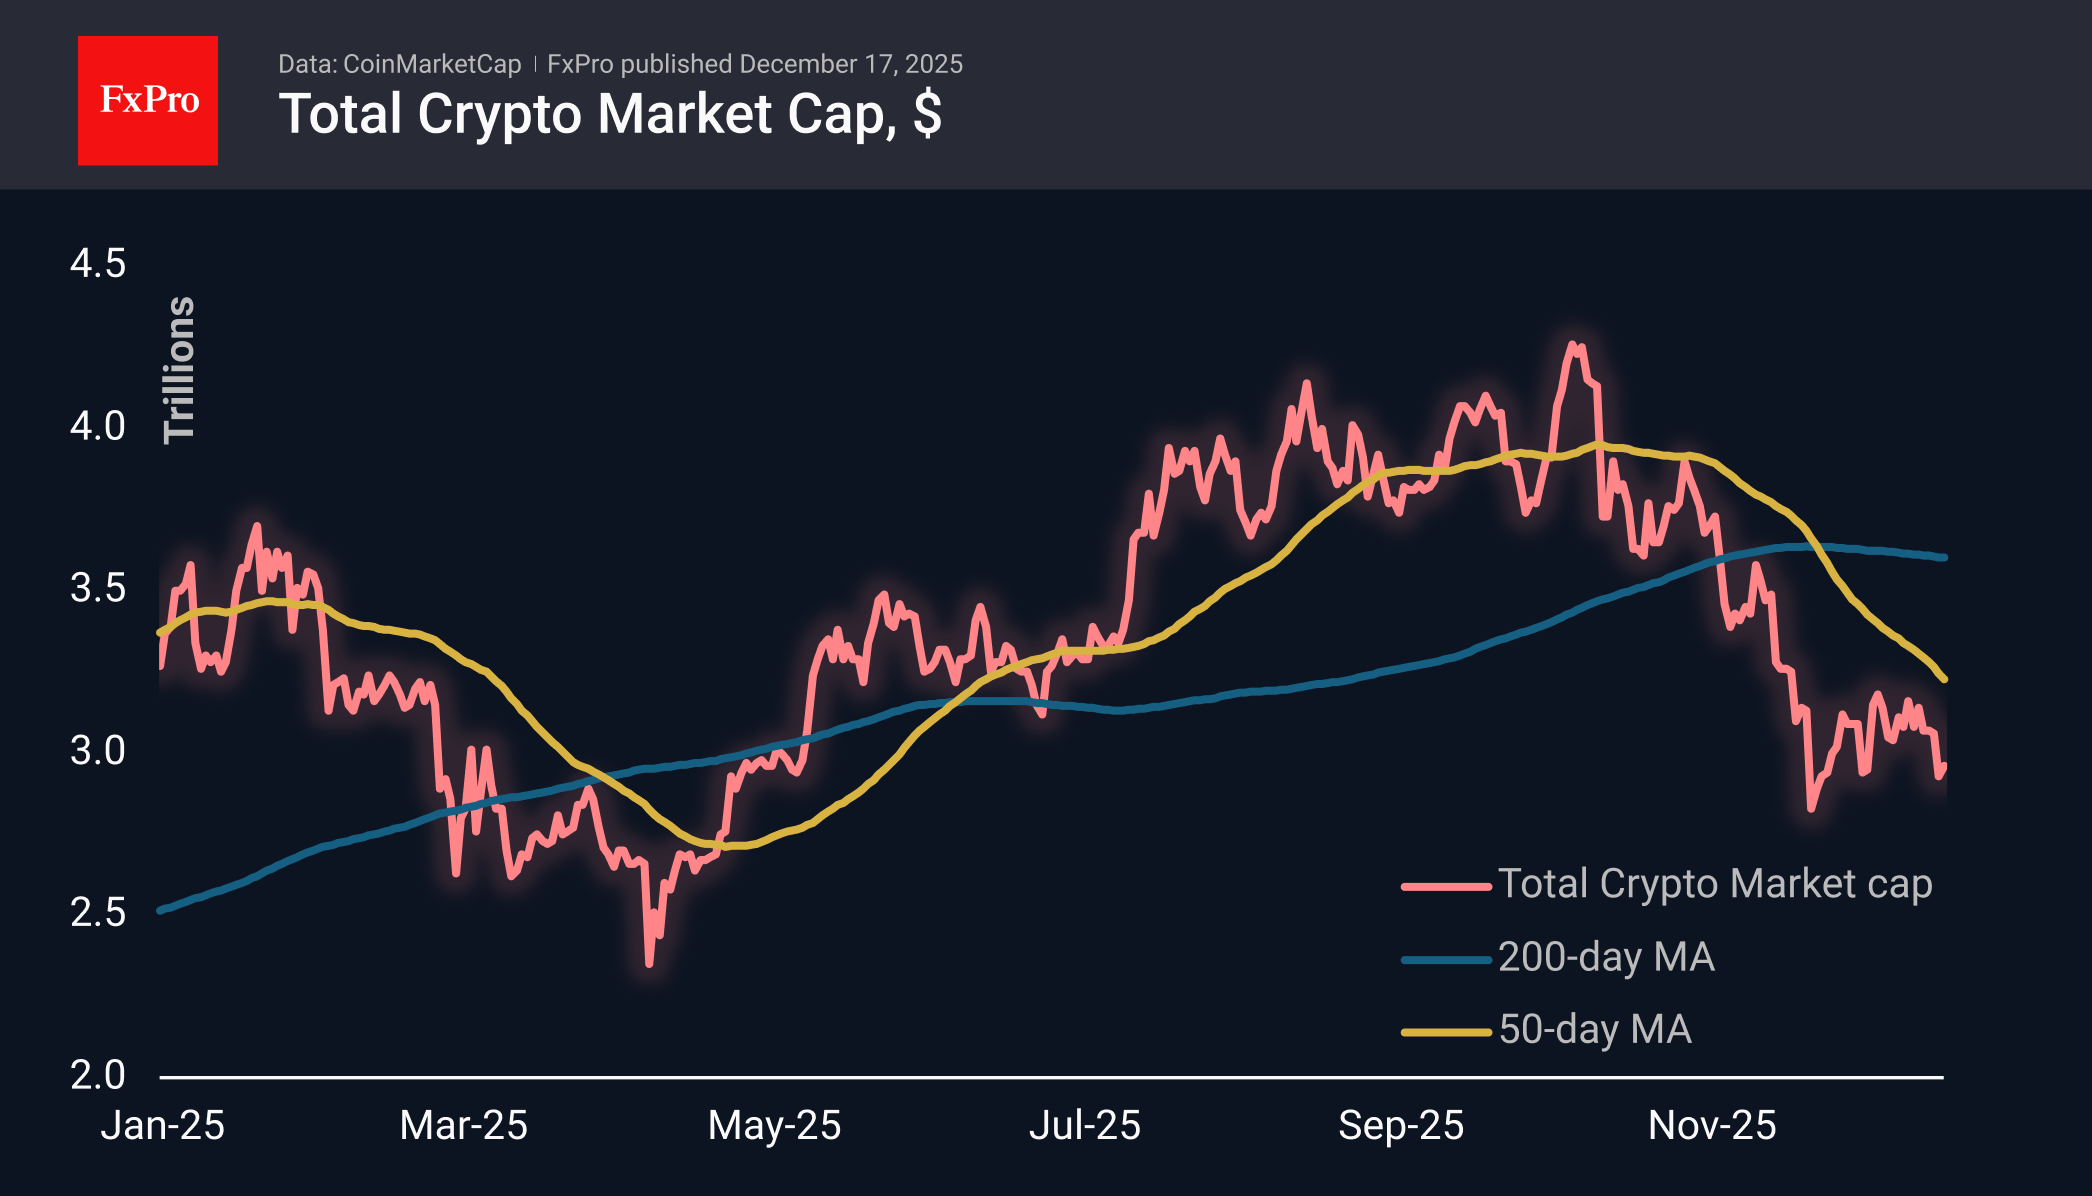
The crypto market capitalisation has changed little over the past 24 hours to $2.96T, remaining close to its late November lows. In the short term, the situation suggests that the rebound has run its course, and we should prepare for a new downward momentum, similar to what was observed in early October. If it falls below $2.75T, it will open a direct path to the $1.8T area, according to the Fibonacci extension pattern. Very close by, in the $1.8T–$1.9T area, is the area of local lows for 2024, which reinforces its importance.
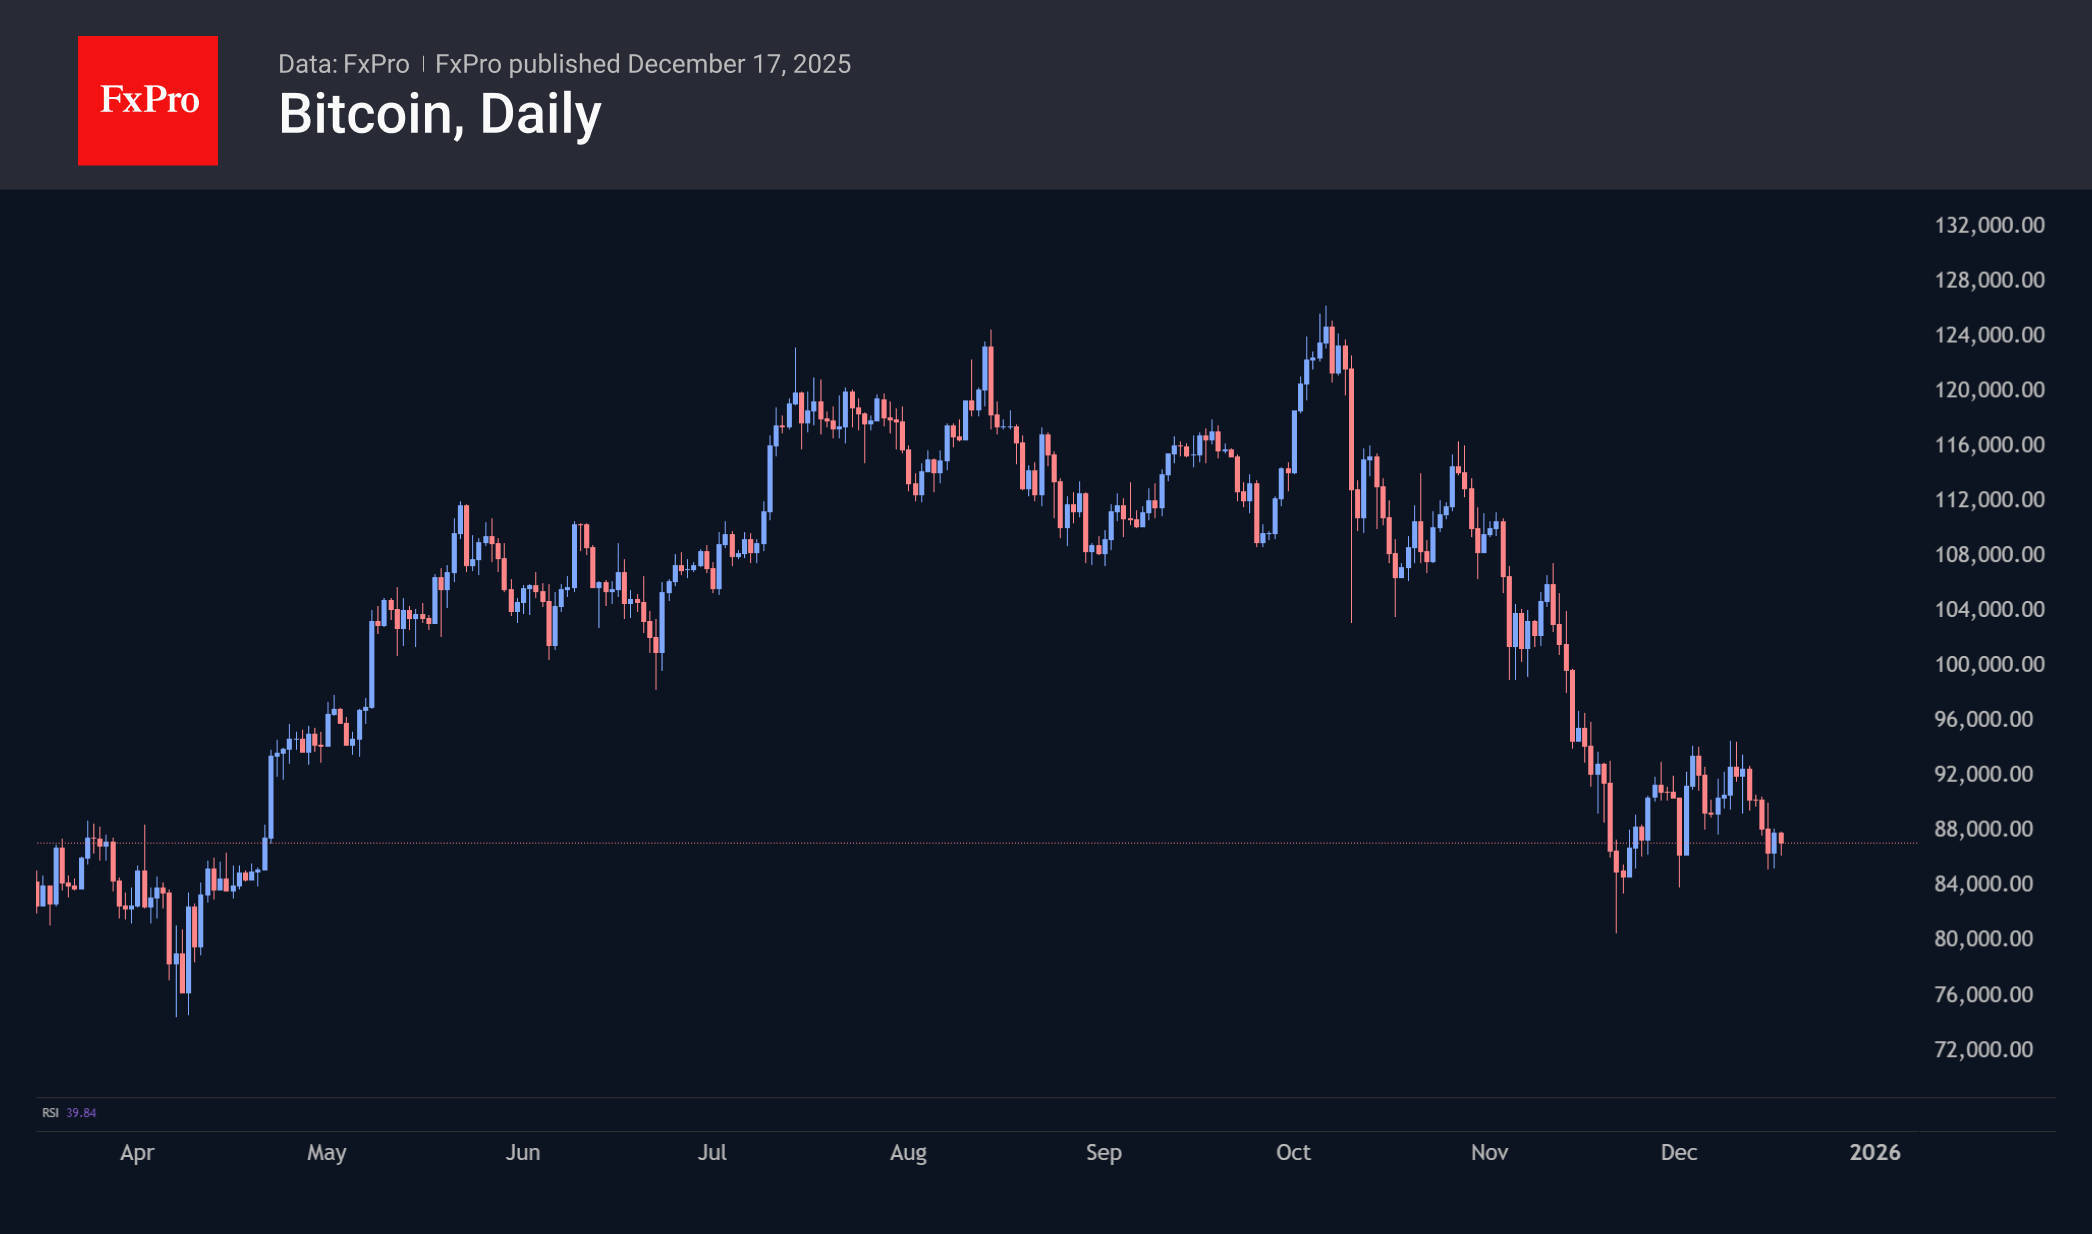
Bitcoin rose to $88K on Tuesday and then returned below $87K on Wednesday afternoon. As with the market as a whole, we are seeing impressive selling pressure with short pauses for a rebound. Bitcoin is still underperforming the stock market. However, this time we see it more as a sign of internal weakness in the crypto market and widespread profit-taking, rather than a bad omen for stocks, but it cannot be completely ruled out.''
News Background
Short-term Bitcoin holders are incurring losses, as the asset has been trading below their average entry price ($104,000) for over a month, according to CryptoQuant. At the same time, long-term holders of the first cryptocurrency continue to actively sell it. According to Glassnode, they have reduced their holdings by ~500,000 BTC since July.
Bitcoin could crash to $10,000 in 2026, warned Bloomberg Intelligence commodities strategist Mike McGlone. He suggested that the next economic recession will be triggered by the collapse of highly speculative digital assets with unlimited supply.
Analyst Peter Brandt predicted that Bitcoin could fall 80% from its record high to $25,240 due to a disruption in the asset’s growth structure.
At the same time, Bitwise and Grayscale predict that Bitcoin will reach new record highs in 2026, as the classic BTC cycle model is outdated.
Japanese financial conglomerate SBI Holdings and Web3 company Startale Group have signed a memorandum of understanding to jointly develop a stablecoin pegged to the yen. The partners plan to launch the asset in the first quarter of 2026.
The number of Britons owning cryptocurrency has fallen from 12% to 8% over the year. However, the average value of assets held by investors has increased.
Sunset Market Commentary
Markets
UK gilts outperform global peers today, dragging yields 4.6-6.5 bps lower in a bull steepening move. It started after this morning’s inflation numbers all but cemented a Bank of England rate cut (to 3.75% from 4%) tomorrow. All kinds of gauges missed expectations: headline dropped 0.2% m/m which lowered the 3.6% annual print to 3.2%, the slowest since March. The underlying series (ex. food and energy) mimicked headline dynamics with the 3.2% y/y here being a YtD low. Price growth in the services sector, a key worry for the hawks at the Bank of England due to its close ties with wages and the labour market, equally slowed to a YtD low of 4.4%. In October’s 5-4 close call for holding rates steady, governor Bailey casted the swing vote. He wanted proof that disinflation would resume after inflation had been rising from 1.7% in September 24 to 3.8% by September 2025. That happened in both October and November, readying Bailey for a position switch. The implied market probability for a rate cut rose from 91% to near-100%. Room for further policy normalization after Thursday is limited though given still too high inflation and yesterday’s PMI’s suggesting the economy holds up relatively well. There’s maybe one additional cut on the horizon. Sterling erases all of yesterday’s gains against the euro, lifting EUR/GBP back towards the 0.88 barrier. The YtD high of EUR/GBP 0.8865 remains nearby and serves as the first technical reference to watch.
FI in the US and Europe shows modest bear steepening. US rates add 1.3-2.3 bps, European swap yields up to 2.4 bps. The 30-yr swap tenor yesterday suffered from fear of heights after nearing the 2023 multiyear high but is ready to give it another shot. Except for a minor rise in oil prices we saw few reasons for long term yields to rise. It is perhaps testament to the strength of the underlying forces (eg. risk premia) driving the move. Real yields in Germany – which capture amongst others risk premia – just rose to a new 14-year high. Fed governor Waller hit the wires only to spread out his dovish wings: the labour market is very soft, inflation won’t reaccelerate and rates are still 50-100 bps above neutral, allowing for steady policy normalization (or is it easing?). Brent oil prices gain a tad to <$60/b on the news of the US ordering a blockade of sanctioned Venezuelan tankers and the threat to impose additional sanctions on Russia’s energy sector if the country would reject a peace agreement with Ukraine. The black gold remains mired near the lowest levels in around four years. Economic data today was limited to the German IFO (87.6 from 88) coming in to the low side of expectations, mainly as the expectations component disappointed. It wasn’t a major surprise after yesterday’s PMIs. Attention now turns to the US inflation numbers and the ECB policy meeting scheduled for tomorrow. FX markets ex GBP trade muted with some JPY underperformance ahead of Friday’s BoJ meeting. EUR/USD steadies around 1.173.
News & Views
The Confederation of British Industry’s monthly industrial trends survey showed the manufacturing output decline easing in the three months to December (weighted balance of -21% from -30% in the quarter to November). 15 out of 17 sub-sectors showed decreasing output with the fall being driven by chemicals, metal products and mechanical engineering. Activity was clearly held back by uncertainty ahead of the Budget. Significant headwinds remain nonetheless, with demand still soft, high energy, labour and regulatory costs squeezing margins, and uncertainty around key policies and global conditions continuing to weigh on confidence. Total (-32% from -37%) and export order books (-27% from -31%) improved relative to last month, though remain historically weak. Long run averages of both series are respectively -14% and -19%. Stock adequacy eased (+8% from +16%) but manufacturers report that inventories of finished goods remain more than adequate. Expectations for selling price inflation picked up (+19% from +7%), with the survey balance rising above the long-run average (+8%).
The Swedish Origo group published its quarterly inflation expectations survey conducted on behalf of the Riksbank. Interviewees expect annual CPIF (core) inflation at 1.6% in the year-ahead, at 2% in the twelve months thereafter and at 2.1% in year 5. In the September survey, short term inflation expectations were higher, at 2.1% for both year 1 and 2. Simultaneously, the survey paints a brighter economic picture with growth now expected at 2.3%-2.3%-2.2% for year 1, 2 and 5, up from 1.8%-2.2%-2.1% in September. The Riksbank’s policy rate path is still seen very gradually upward sloping from the current 1.75% towards 2.25%.
Fed’s Waller backs steady, not dramatic easing
Fed Governor Christopher Waller said today that policy remains meaningfully restrictive, estimating rates are still around 50 to 100 basis points above neutral. Despite that gap, Waller emphasized there is no rush to get down" on interest rates, arguing the Fed can move rates down to neutral "steadily" as conditions evolve.
Waller said the labor market continues to "soften", but not in a dramatic or disorderly way. That backdrop supports a measured approach to further rate cuts, with no need for aggressive action. The Fed can proceed at a "moderate pace". "I don't think we have to do anything dramatic," he added.
He also noted that the string of rate cuts delivered in the final months of 2025 has already helped offset some risks to hiring. Looking ahead, Waller said prospects for a stronger economy next year—driven by fiscal policy changes and reduced uncertainty—should further support labor demand. For him, the employment side of the Fed’s mandate remains the priority, while inflation is expected to continue easing.
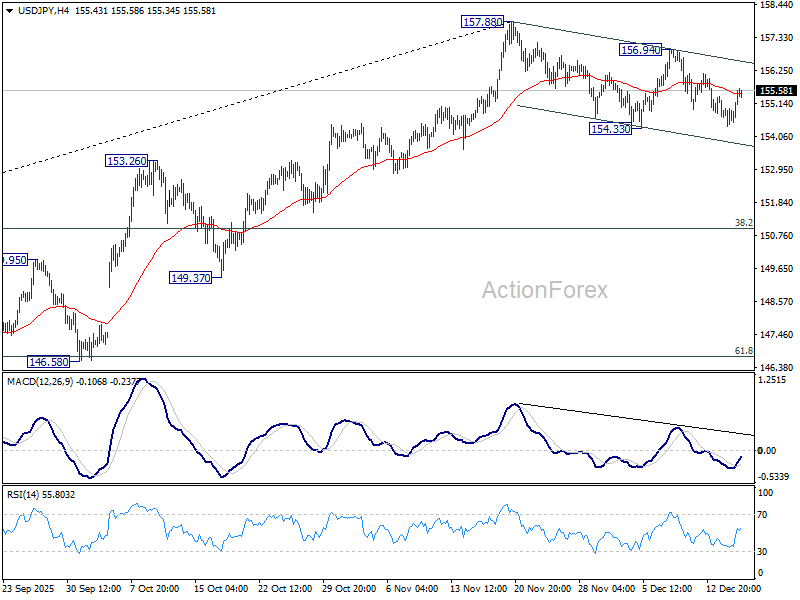
USD/JPY Mid-Day Outlook
Daily Pivots: (S1) 154.30; (P) 154.82; (R1) 155.24; More...
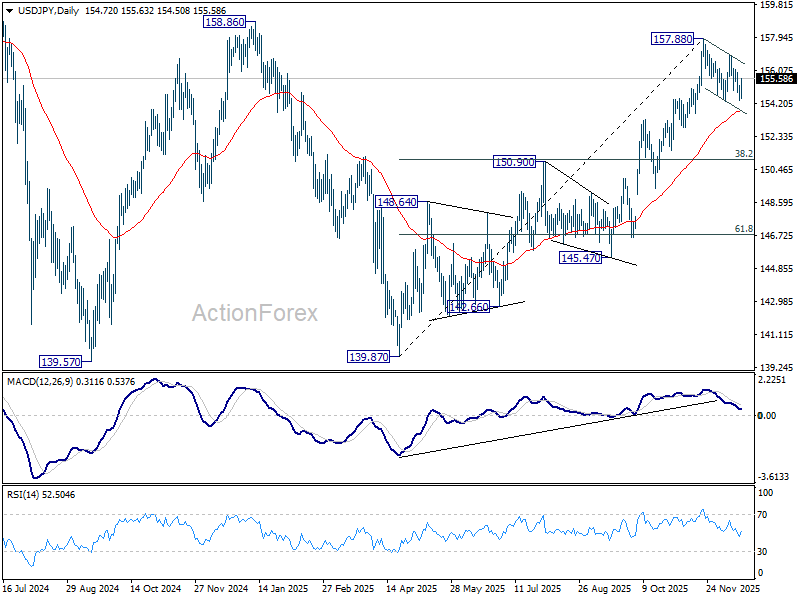
USD/JPY recovered ahead of 154.33 support and intraday bias stays neutral. Overall outlook is unchanged that corrective pattern from 157.88 is still extending. On the downside, break of 154.33 will target 55 D EMA (now at 153.66) and possibly below. On the upside, above 156.94 will bring retest of 157.88. Firm break there will resume whole rally from 139.87 to 158.85 key structural resistance.
In the bigger picture, corrective pattern from 161.94 (2024 high) could have completed with three waves at 139.87. Larger up trend from 102.58 (2021 low) could be ready to resume through 161.94 high. Decisive break of 158.85 structural resistance will solidify this bullish case and target 161.94 for confirmation. On the downside, break of 150.90 resistance turned support will dampen this bullish view and extend the corrective range pattern with another falling leg.
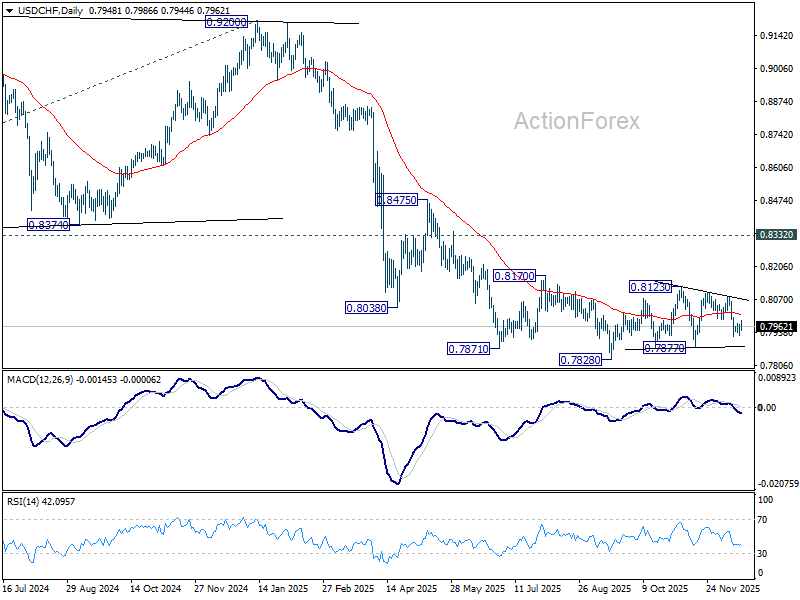
USD/CHF Mid-Day Outlook
Daily Pivots: (S1) 0.7928; (P) 0.7950; (R1) 0.7973; More…
Intraday bias in USD/CHF stays neutral as sideway trading continues. Overall, corrective pattern from 0.7828 is still extending. On the upside, break of 0.7990 support turned resistance will bring stronger rebound towards 0.8084. On the downside, below 0.7923 will target 0.7877 support.
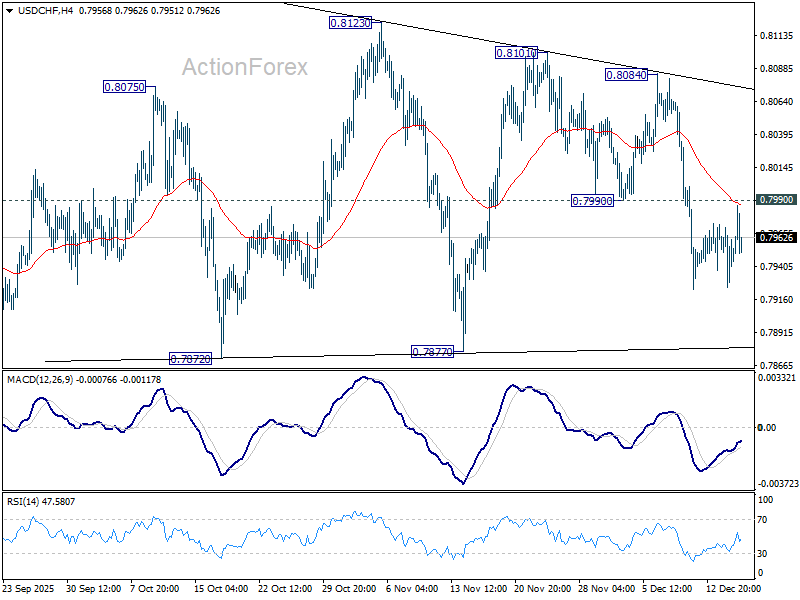
In the bigger picture, outlook will stay bearish as long as 0.8332 support turned resistance holds (2023 low). Long term down trend from 1.0342 (2017 high) is still in progress. Next target is 100% projection of 1.0146 (2022 high) to 0.8332 from 0.9200 at 0.7382.