

Sample Category Title
EUR/GBP Daily Outlook
Daily Pivots: (S1) 0.8325; (P) 0.8352; (R1) 0.8396; More...
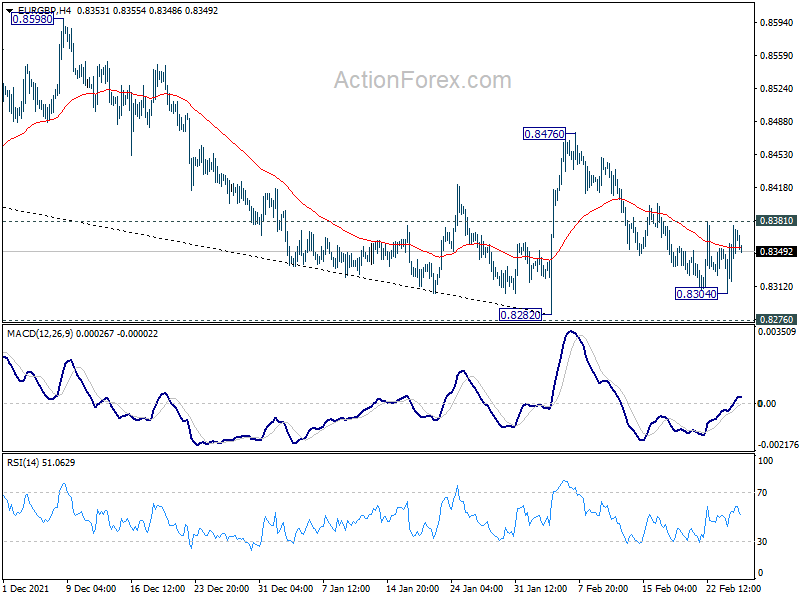
Intraday bias in EUR/GBP is turned neutral again with current recovery. On the downside, below 0.8304 will target 0.8282 low. Sustained break of 0.8276 key long term support will carry larger bearish implication. On the upside, above 0.8381 minor resistance will turn bias back to the upside for 0.8476 resistance. Break there will resume the rebound from 0.8282.
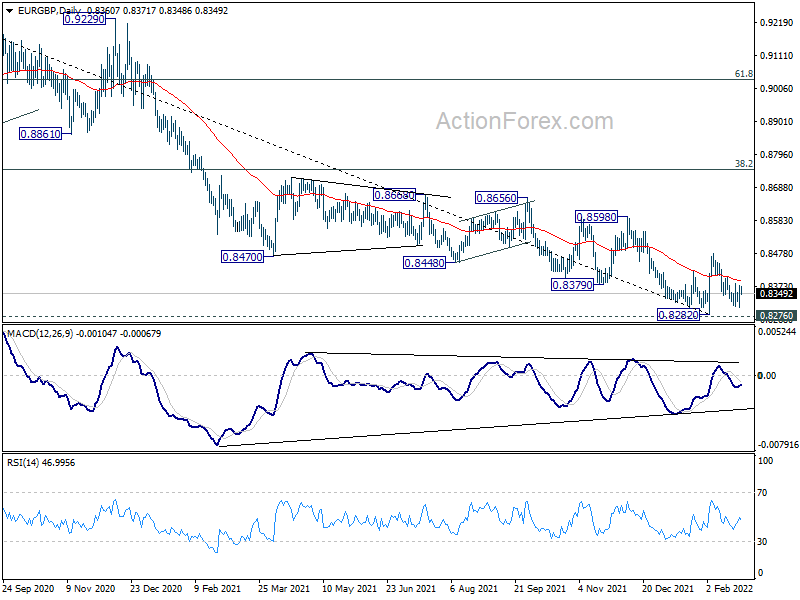
In the bigger picture, price actions from 0.9499 (2020 high) are still seen a corrective pattern that should be contained by 0.8276 long term support (2019 low). Sustained trading above 38.2% retracement of 0.9499 to 0.8282 at 0.8747 will affirm this bullish case. However, sustained break of 0.8276 will argue that the long term trend has reversed. Deeper decline would be seen to 61.8% retracement of 0.6935 to 0.9499 at 0.7917.
EUR/AUD Daily Outlook
Daily Pivots: (S1) 1.5561; (P) 1.5621; (R1) 1.5686; More...
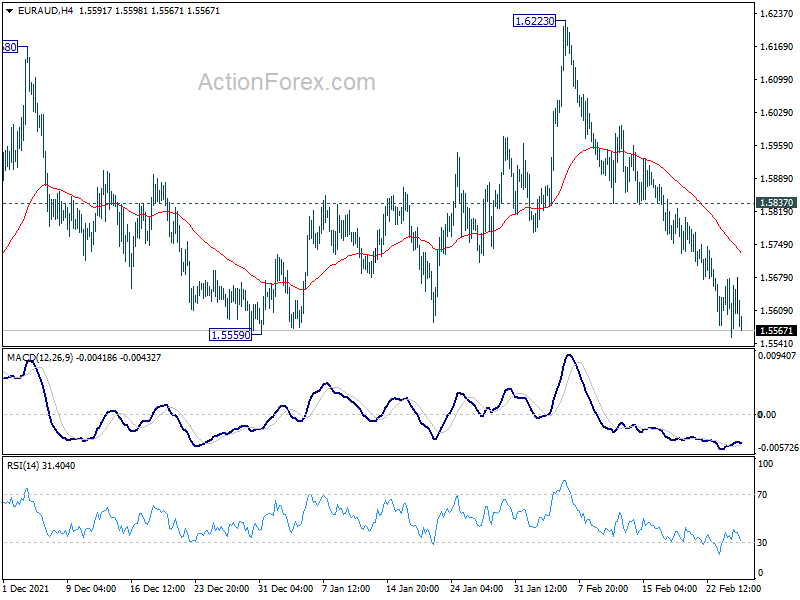
Intraday bias in EUR/AUD remains on the downside for the moment. Firm break of 1.5559 support should indicate that corrective rise from 1.5354 has completed in form of a three wave pattern. Further decline would then be seen back to 1.5250/5354 support zone. For now, risk will stay on the downside as long as 1.5837 resistance holds, in case of recovery.
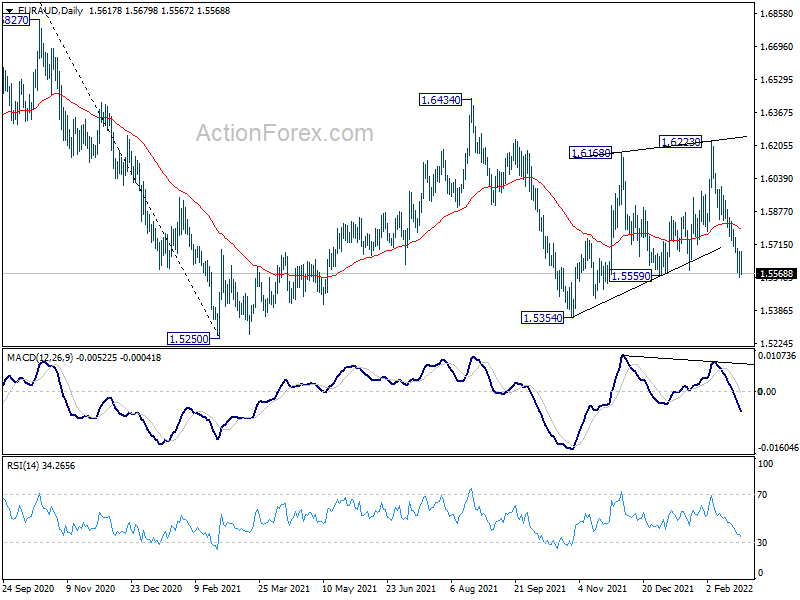
In the bigger picture, price actions from 1.5250 low are seen as a corrective pattern. Further extension could be seen and another rise cannot be ruled out. But strong resistance should be seen at 38.2% retracement of 1.9799 to 1.5250 at 1.6988. Larger down trend from 1.9799 is in favor to extend through 1.5250 at a later stage.
EUR/JPY Daily Outlook
Daily Pivots: (S1) 128.15; (P) 129.09; (R1) 130.27; More....
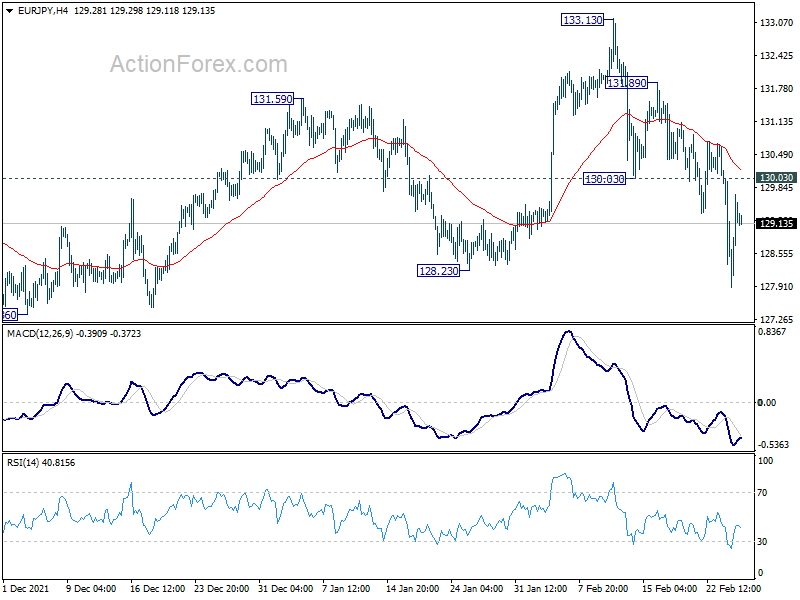
EUR/JPY recovered after hitting 127.90. But further decline is expected with 130.03 support turned resistance intact. Fall from 133.13 is seen as another leg of the correction pattern from 134.11. Deeper fall should be seen to 127.36 low and below. However, firm break of 130.03 will turn bias back to the upside for 133.13 resistance instead.
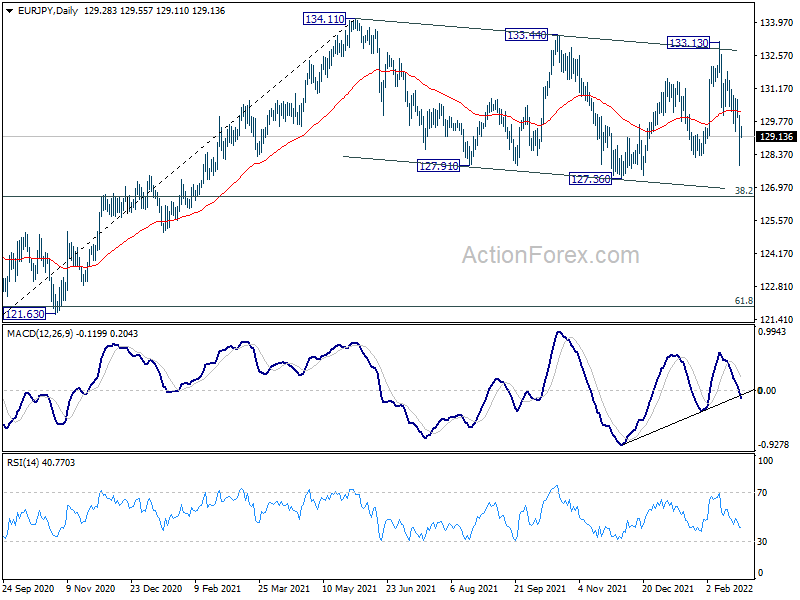
In the bigger picture, price actions from 134.11 are currently seen as a consolidation pattern only. As long as 38.2% retracement of 114.42 (2020 low) to 134.11 at 126.58 holds, up trend from 114.42 is still in favor to continue. Break of 134.11 will target long term resistance at 137.49 (2018 high). However, sustained break of 126.58 will raise the chance of bearish reversal. In this case, deeper decline would be seen to 61.8% retracement at 121.94, and possibly below.
GBP/JPY Daily Outlook
Daily Pivots: (S1) 153.29; (P) 154.59; (R1) 155.80; More...
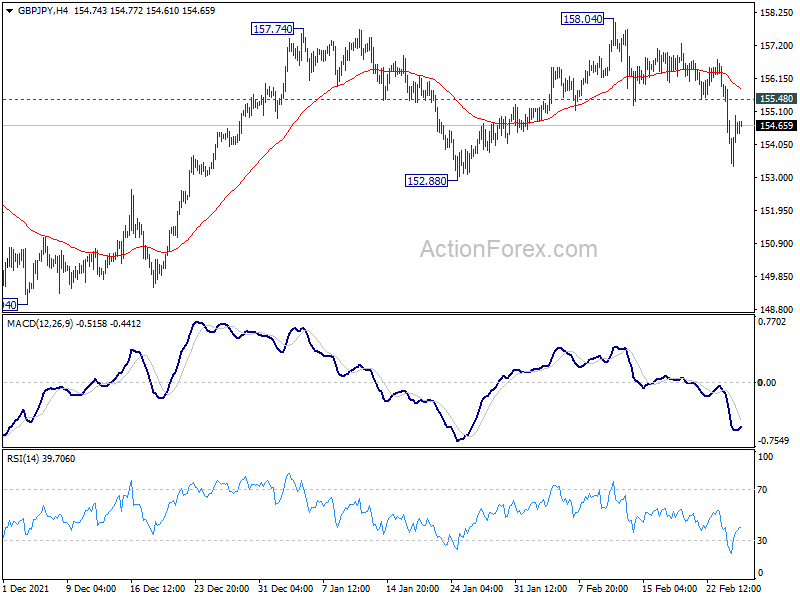
GBP/JPY recovered after dropping to 153.34. But still, with 155.48 support turned resistance intact, further decline is expected. Fall from 158.04 is seen as the third leg of the corrective pattern from 158.19. Break of 152.88 will target 148.94 support next. However, firm break of 155.48 will dampen this view and turn bias back to the upside for 158.04 resistance instead.
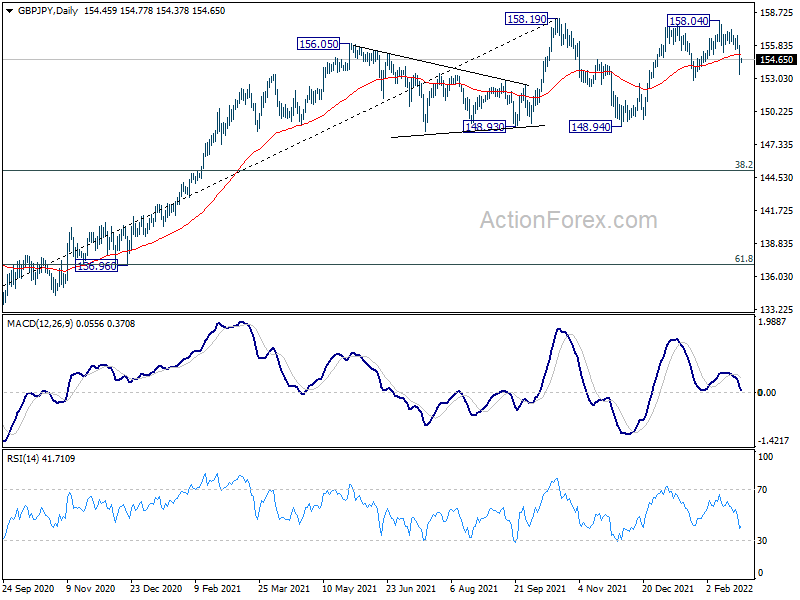
In the bigger picture, price actions from 158.19 are seen as developing into a consolidation pattern to up trend from 123.94 (2020 low). Downside should be contained by 123.94 to 158.19 at 145.10 to bring rebound. Firm break of 158.19 will resume the up trend to long term fibonacci level at 167.93. However, sustained break of 145.10 will raise the chance of trend reversal and target 61.8% retracement at 137.02.
Technical Outlook and Review
DXY:
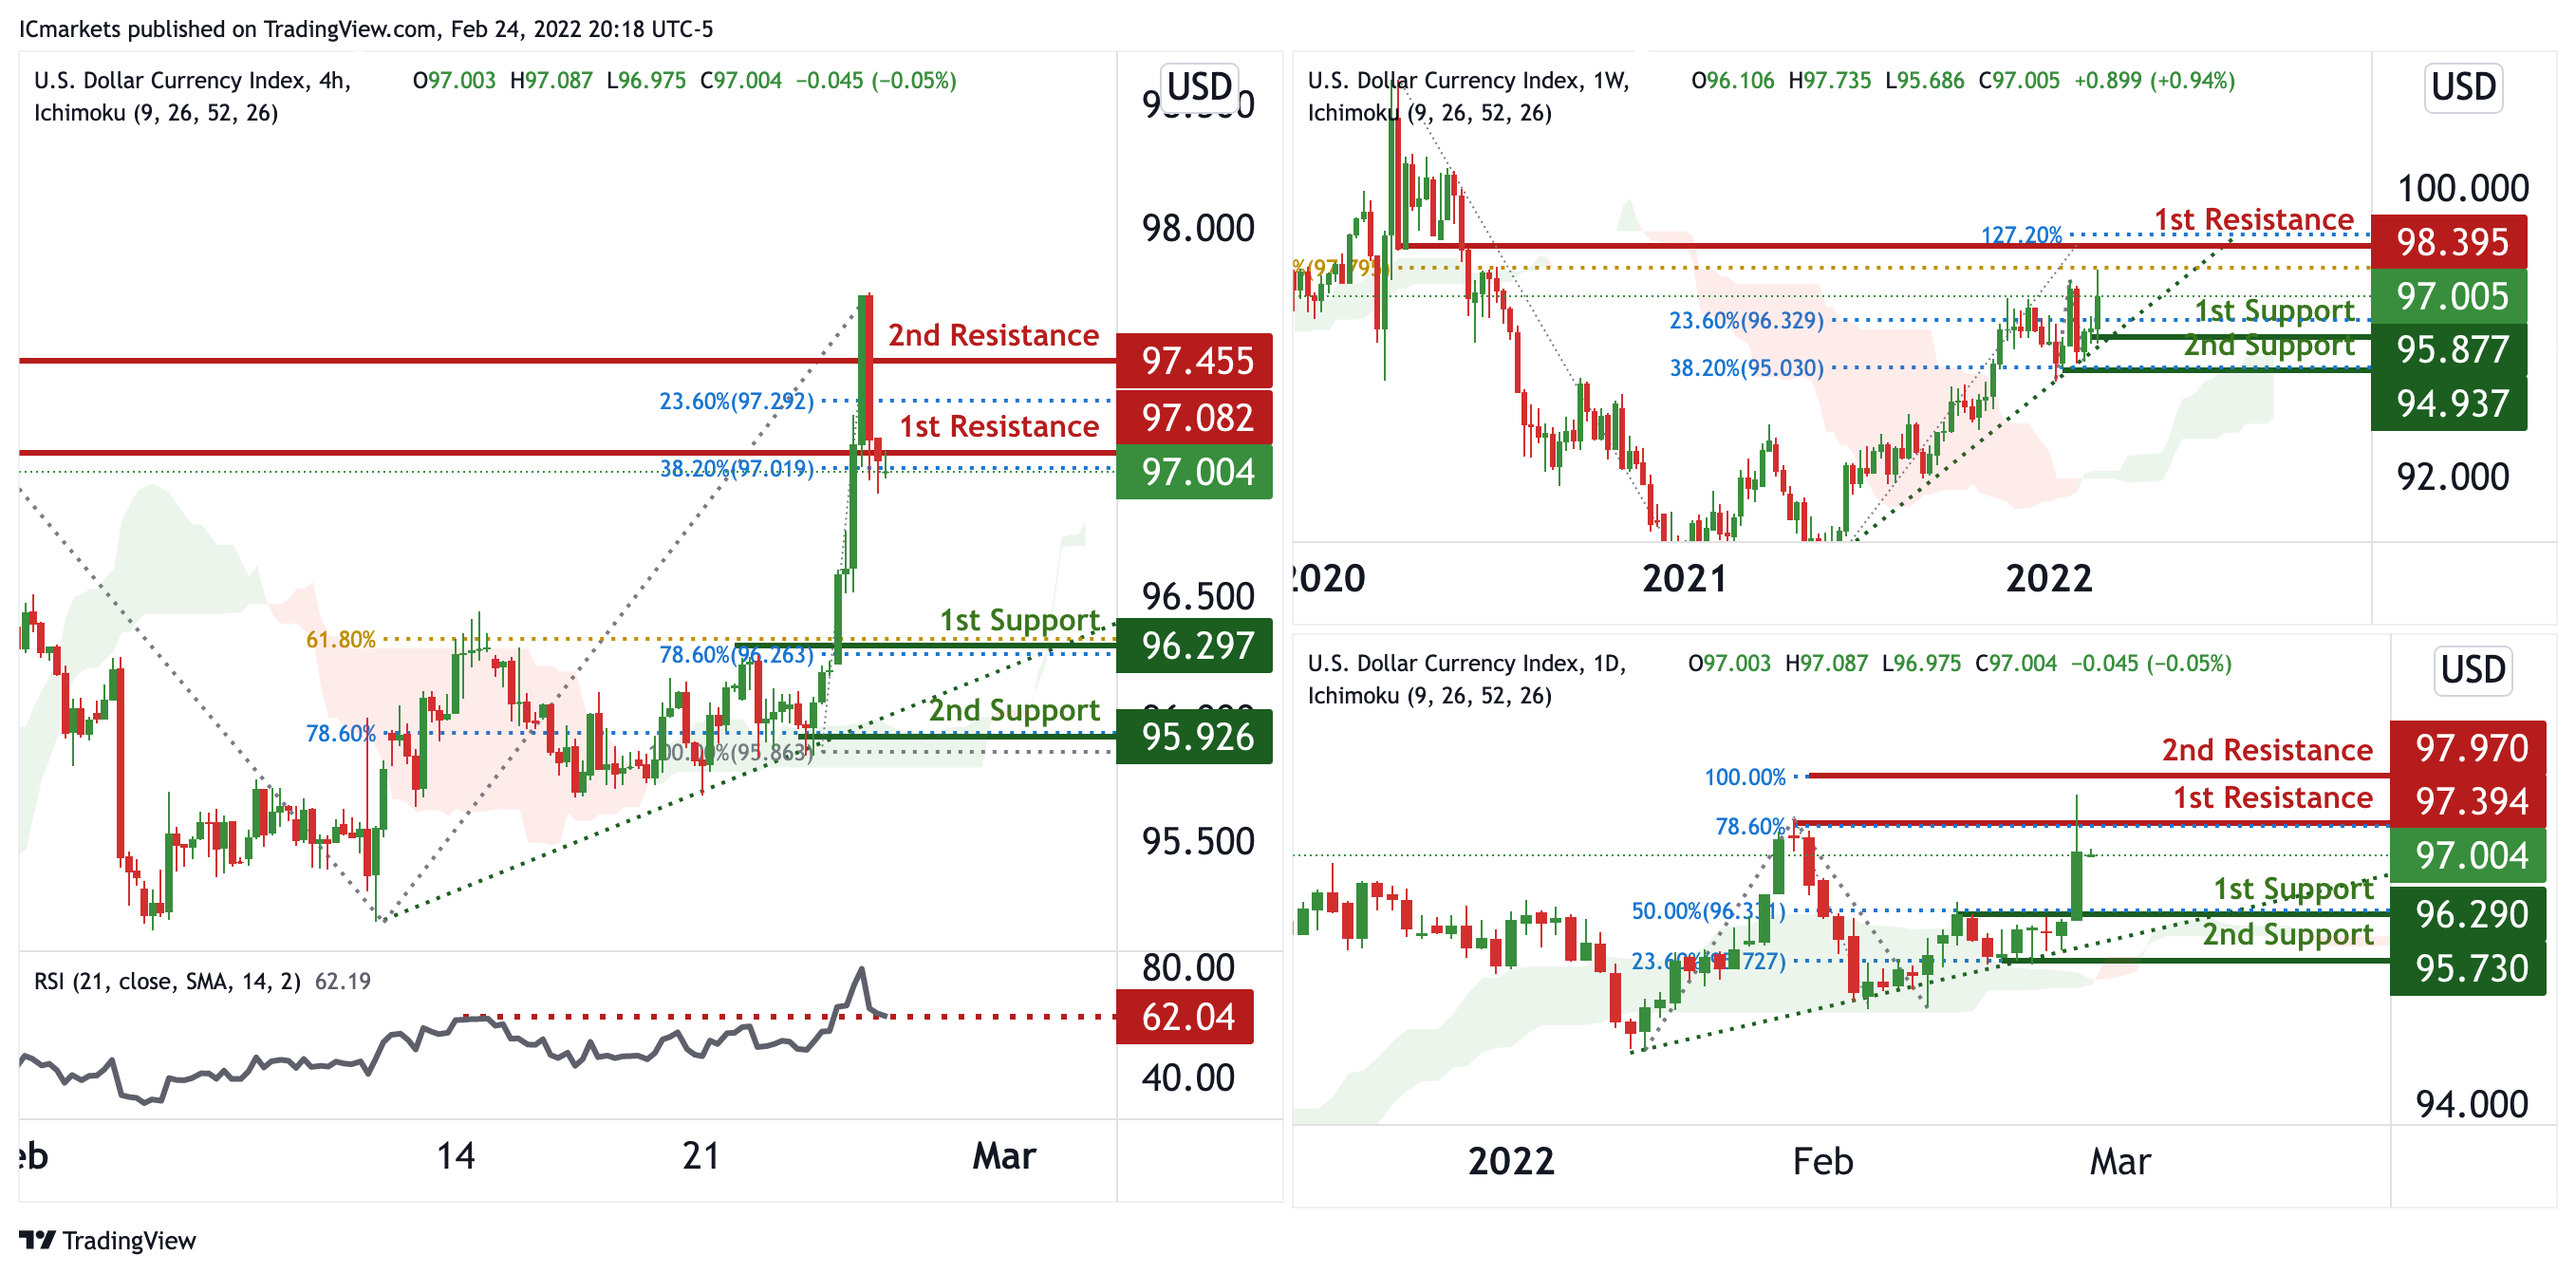
On the weekly, prices are on bullish momentum and abiding to our ascending trendline. We see potential for bullish momentum to climb from our 1st support at 95.877 in line with 23.6% Fibonacci retracement towards our 1st resistance at 98.395 in line with 127.2% Fibonacci extension and 61.8% Fibonacci retracement. Prices are trading above our ichimoku cloud support.
On the daily, prices are on a bullish momentum and abiding to a bullish trendline. We see potential for further bullish continuation from our 1st support at 96.290 in line with 50% Fibonacci retracement towards our 1st resistance at 97.394 in line with 78.6% Fibonacci extension. Prices are abiding to our ascending trendline support and also trading above our ichimoku clouds, further supporting our bullish bias.
On the H4 timeframe, prices are on bullish momentum and abiding to an daily ascending trendline. We see the potential for bearish dip from our 1st resistance at 97.082 in line with 38.2% Fibonacci retracement towards our 1st support at 96.297 in line with 78.6% Fibonacci retracement and 61.8% Fibonacci extension. RSI is at a level where dips occurred previously further supporting our bearish bias.
Areas of consideration:
- H4 time frame, 1st resistance at 97.082
- H4 time frame, 1st support at 96.297
XAU/USD (GOLD):
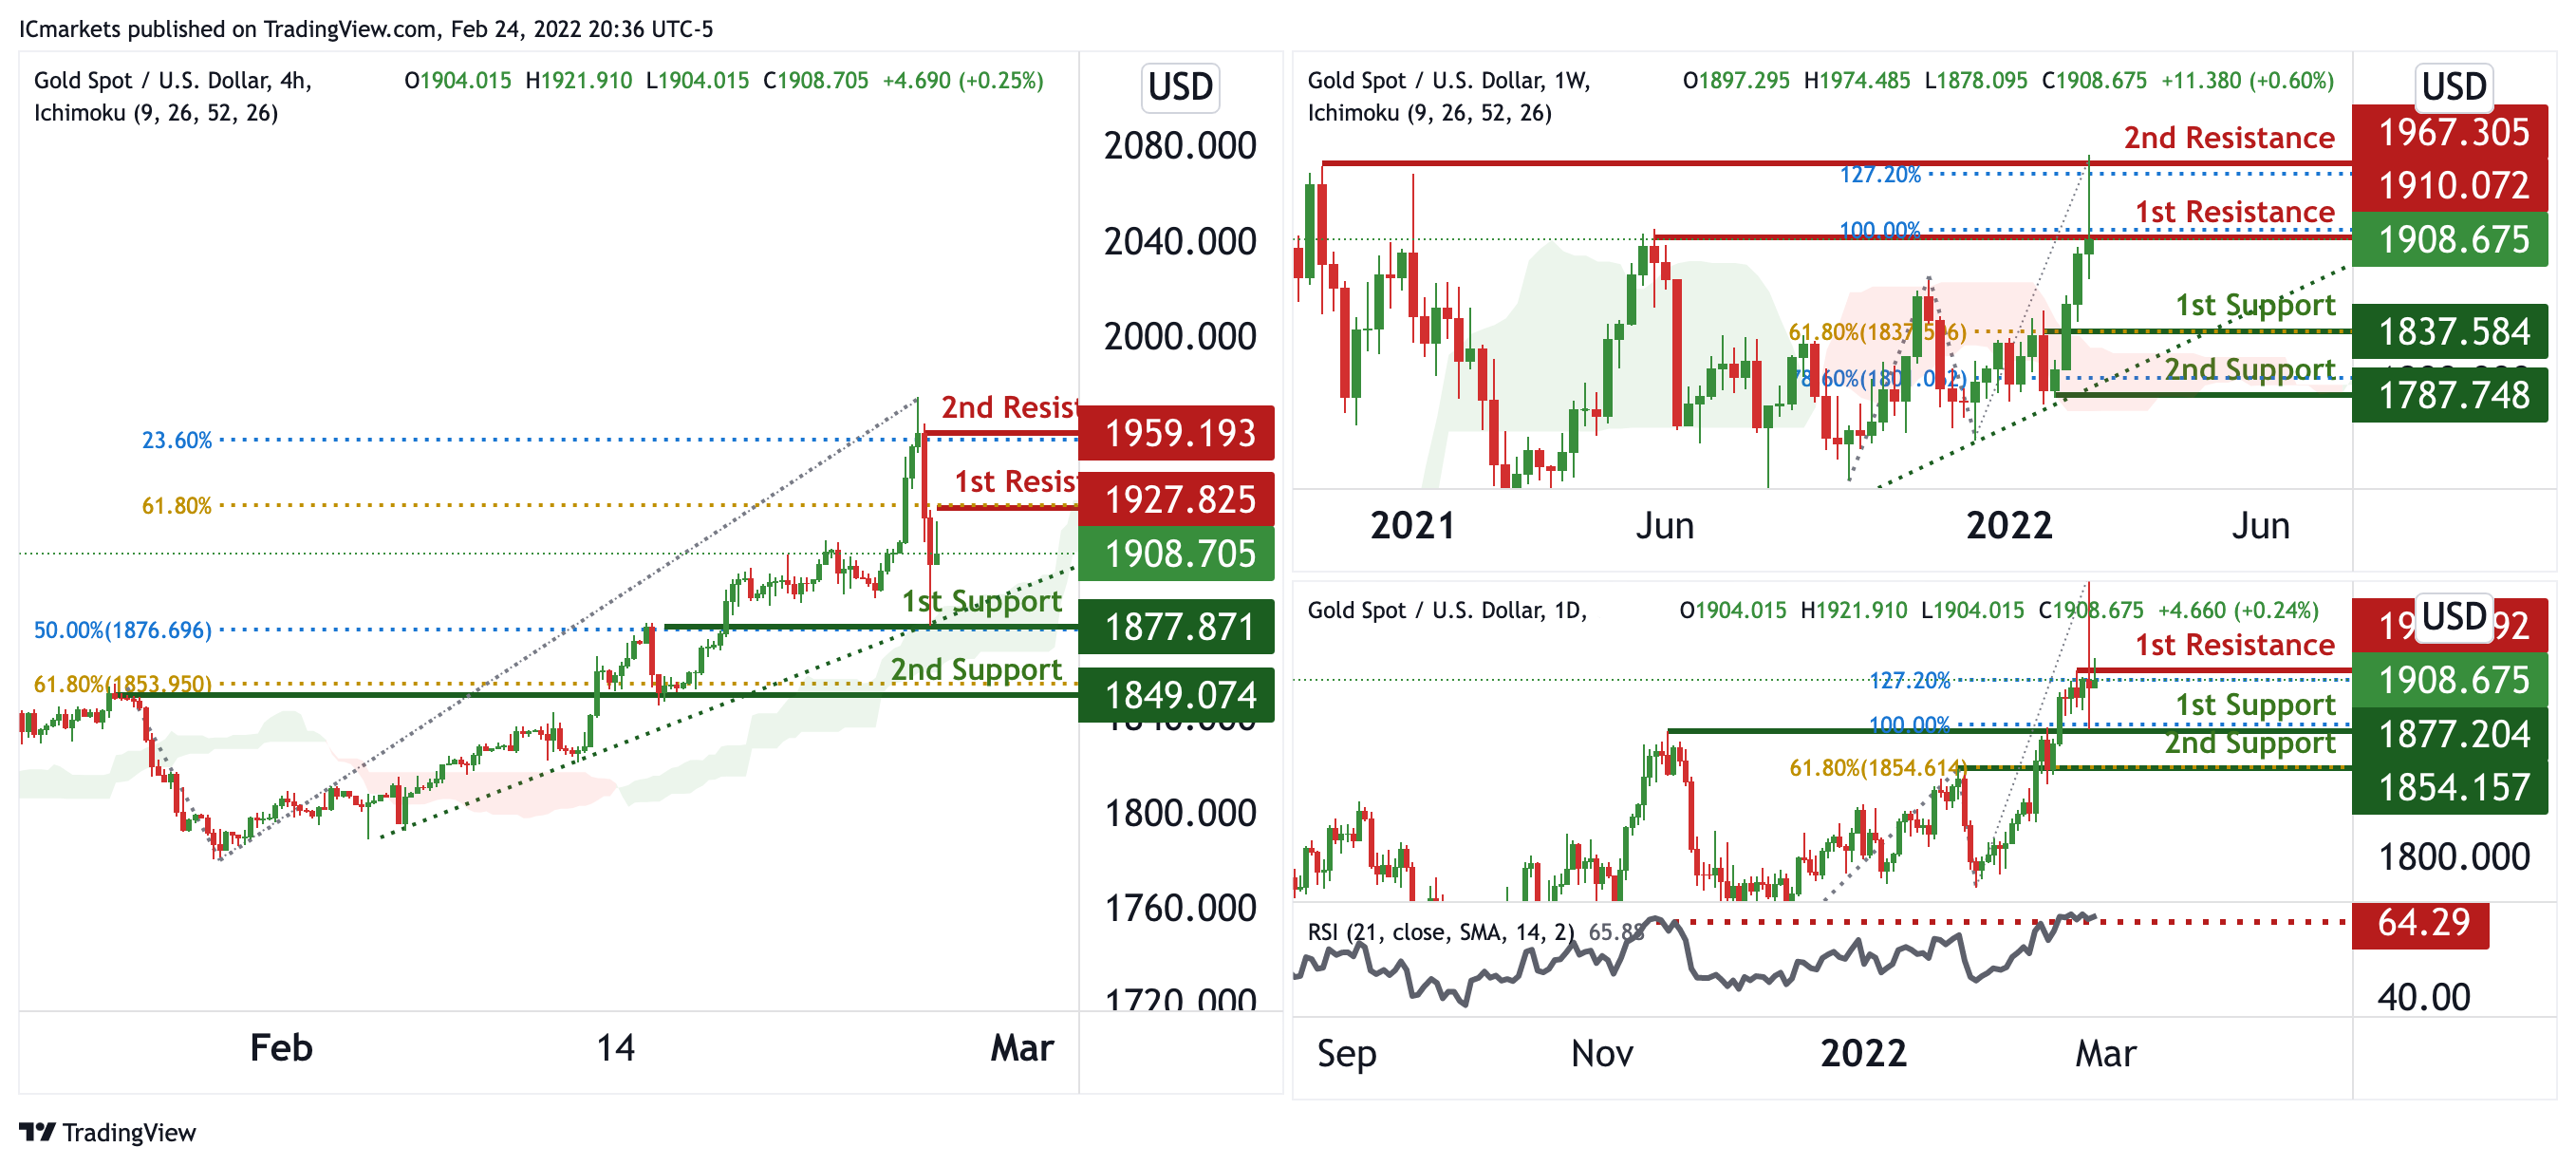
On the weekly, prices are on bullish momentum and abiding to our ascending trendline. We see the potential for prices to do a short pullback from our 1st resistance at 1908.675 in line with 100% Fibonacci extension towards our 1st support at 1837.584 in line with 61.8% Fibonacci retracement and ascending trendline support. Ichimoku are forecasting bearish clouds.
On the daily, prices are at a swing high. We see potential for a dip from our 1st resistance at 1914.2 in line with 127.2% Fibonacci extension towards our 1st support at 1877.204 in line with 100% Fibonacci extension. Our bias is further supported by RSI being at levels where dips previously occurred.
On the H4 chart, prices are abiding to our daily ascending trendline. We see potential for a bounce from our 1st support at 1877.871 in line with 78.6% Fibonacci extension towards our 1st resistance at 1927.825 in line with 61.8% Fibonacci retracement. Our bullish bias is further supported by ichimoku clouds showing bullish momentum.
Areas of consideration:
- 4h 1st support at 1877.871
- 4h 1st resistance at 1927.825
GBP/USD:
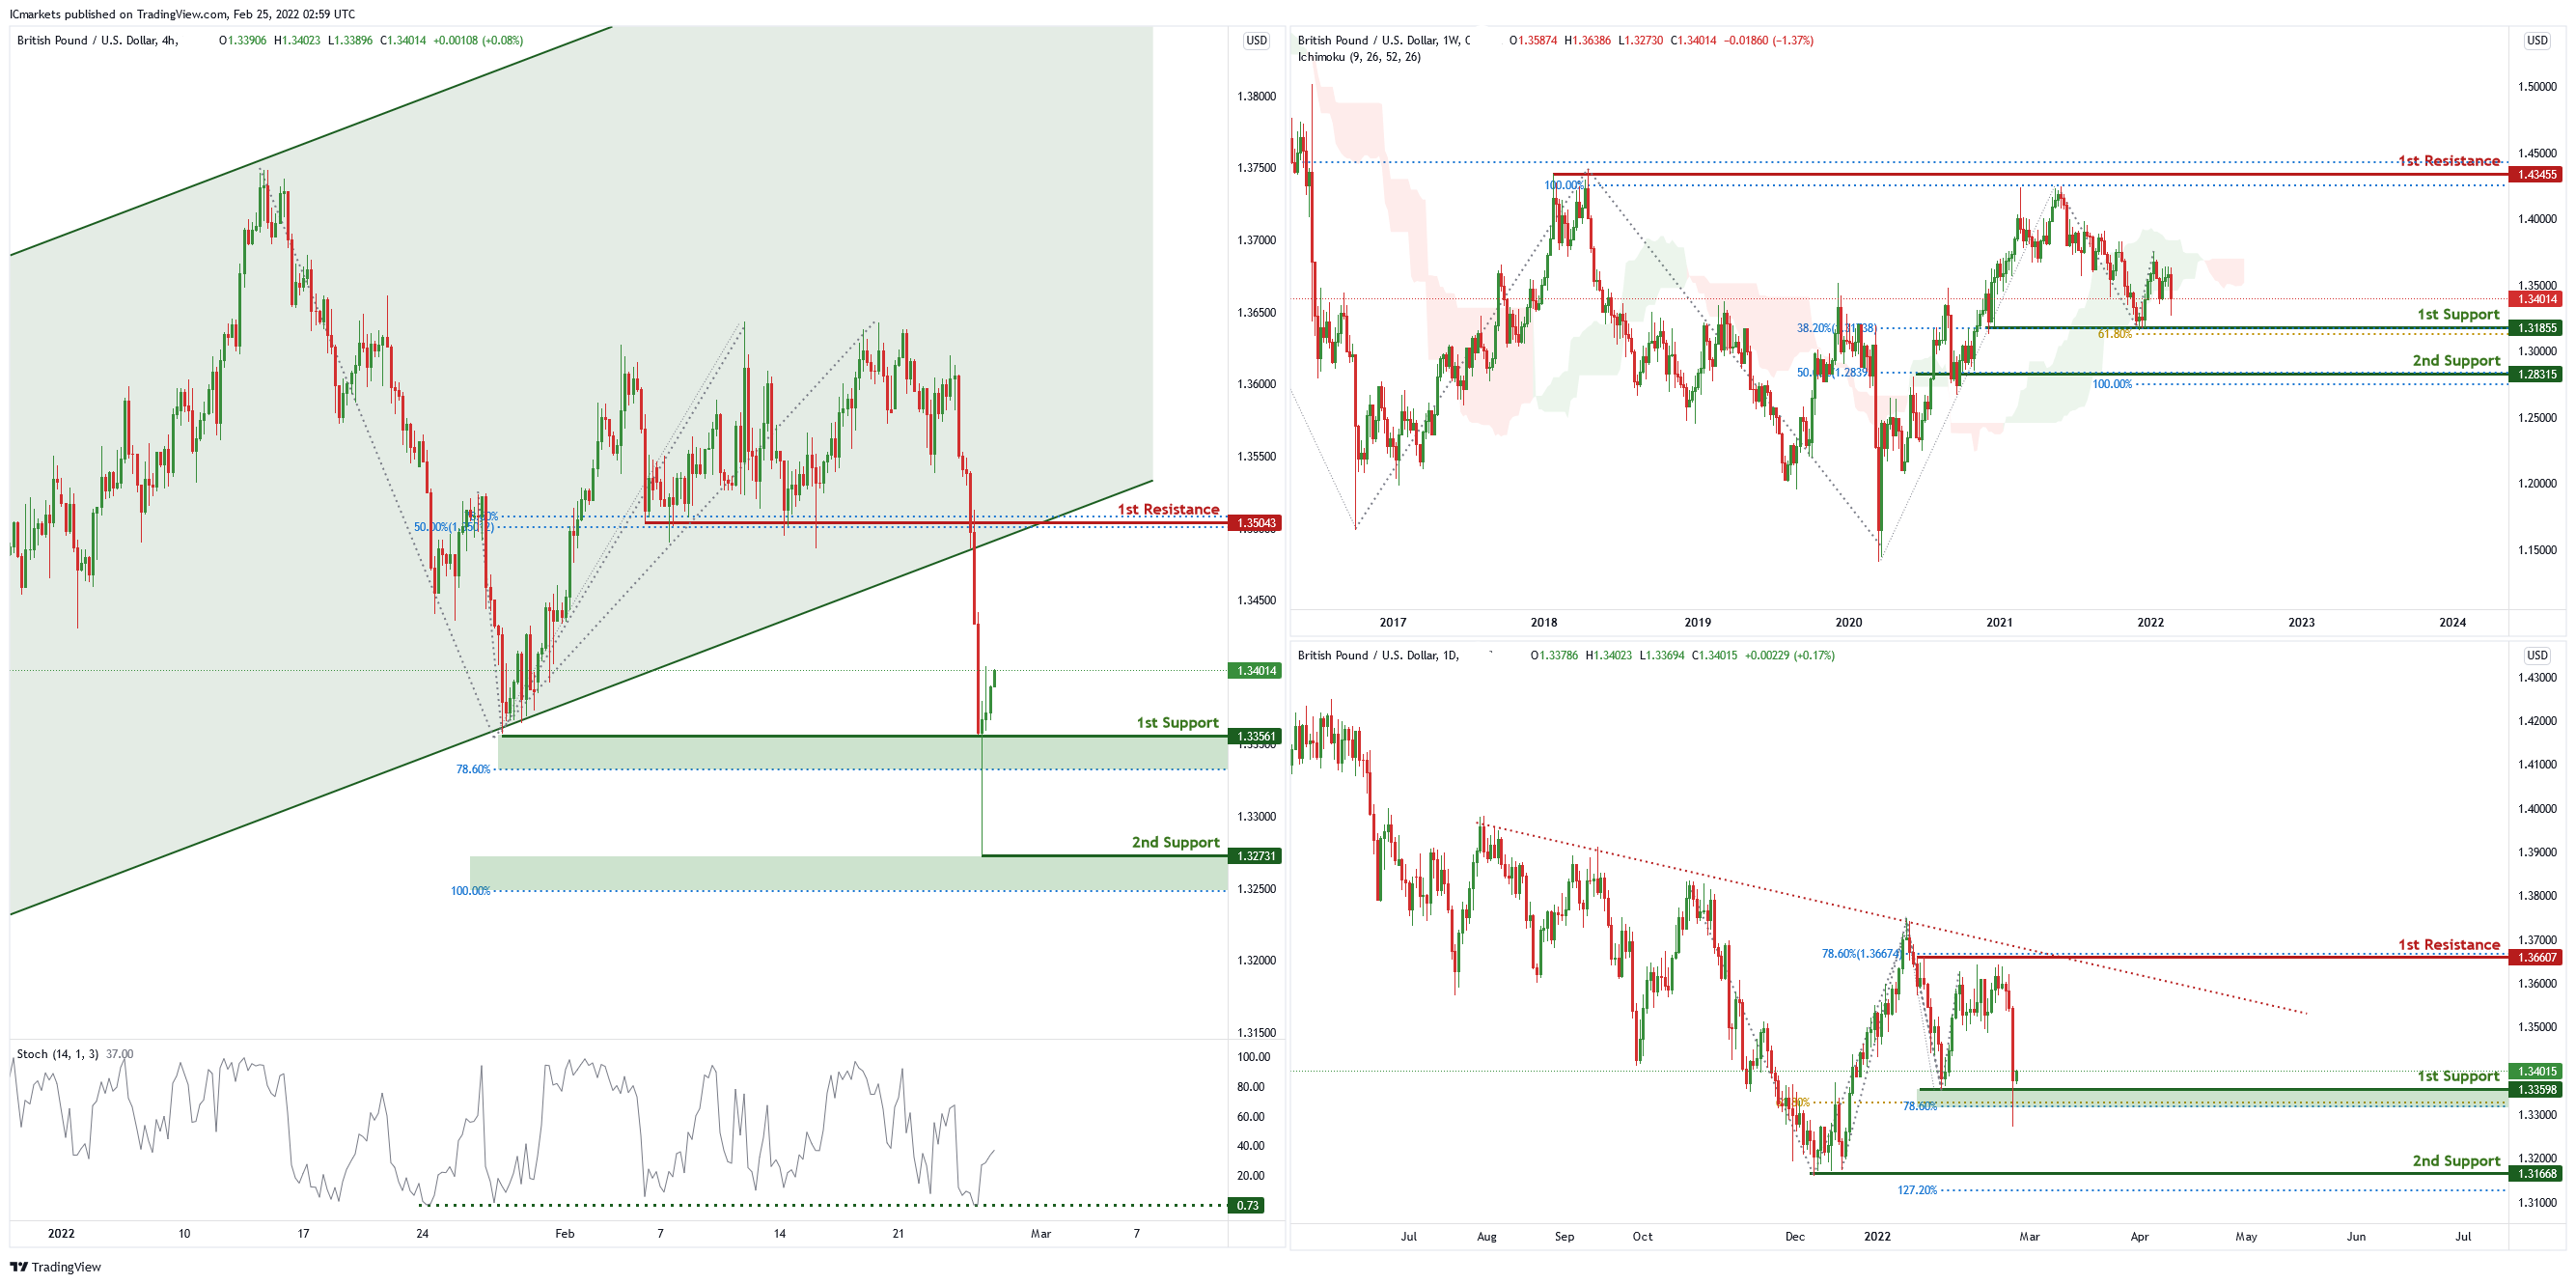
On the weekly chart , price has recently bounced off the 1st support level of 1.31885 which is also 38.2% Fibonacci retracement and 61.8% Fibonacci projection. Price can potentially go to the 1st resistance level of 1.42498 which is also 100% Fibonacci projection and 50% Fibonacci retracement. Our bullish bias is supported by the ichimoku cloud indicator.
On the daily chart , price is abiding by a descending trendline . Price can potentially bounce from the 1st support level of 1.33598 in line with 78.6% Fibonacci retracement and 61.8% Fibonacci projection to the 1st resistance level of 1.36607 in line with 78.6% Fibonacci retracement. Our bullish bias is supported by technical indicators
On the H4 chart , price has recently broken out of the ascending channel and is near 1st support level of 1.33561 in line with 78.6% Fibonacci projection. Price can potentially bounce from this level to 1st resistance level of 1.35043 in line with 50% Fibonacci retracement and 78.6% Fibonacci projection. Our bullish bias is supported by the stochastic indicator as it is at support level
Areas of consideration
- H4 1st resistance at 1.35043
- H4 1st support at 1.33561
USD/CHF:
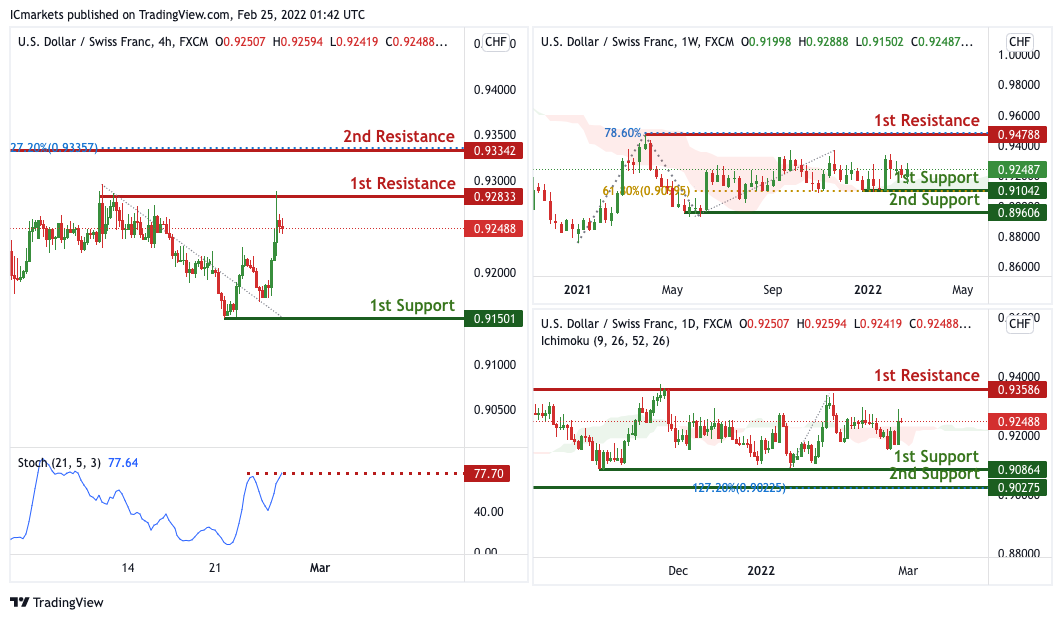
On the Weekly, with price moving above the ichimoku cloud, we can expect bullish continuation from our 1st support at 0.91042 in line with 61.8% Fibonacci retracement towards our 1st resistance at 0.94788 which is a strong resistance and in line with 78.6% Fibonacci projection. Alternatively, price may break 1st support structure and head for 2nd support, which coincides with horizontal swing low support at 0.89606.
On the Daily, with price moving above the ichimoku cloud, we can expect bullish continuation from our 1st support at 0.90864 in line with 38.2% Fibonacci retracement towards our 1st resistance at 0.93586 which is a strong resistance and in line with 127.2% Fibonacci extension. Alternatively, price may break 1st support structure and head for 2nd support, which coincides with horizontal swing low support at 0.90275.
On the H4 timeframe, prices are on bearish momentum and abiding to our descending trendline. We see the possibility of bearish continuation from our 1st resistance at 0.92833 in line with the horizontal swing high resistance towards our 1st support at 0.91501 in line with 100% Fibonacci projections. Our bearish bias is further supported by how price is expected to reverse off the stochastics.
Areas of consideration :
- H4 1st resistance at 0.92833
- H4 1st support at 0.91501
EUR/USD :
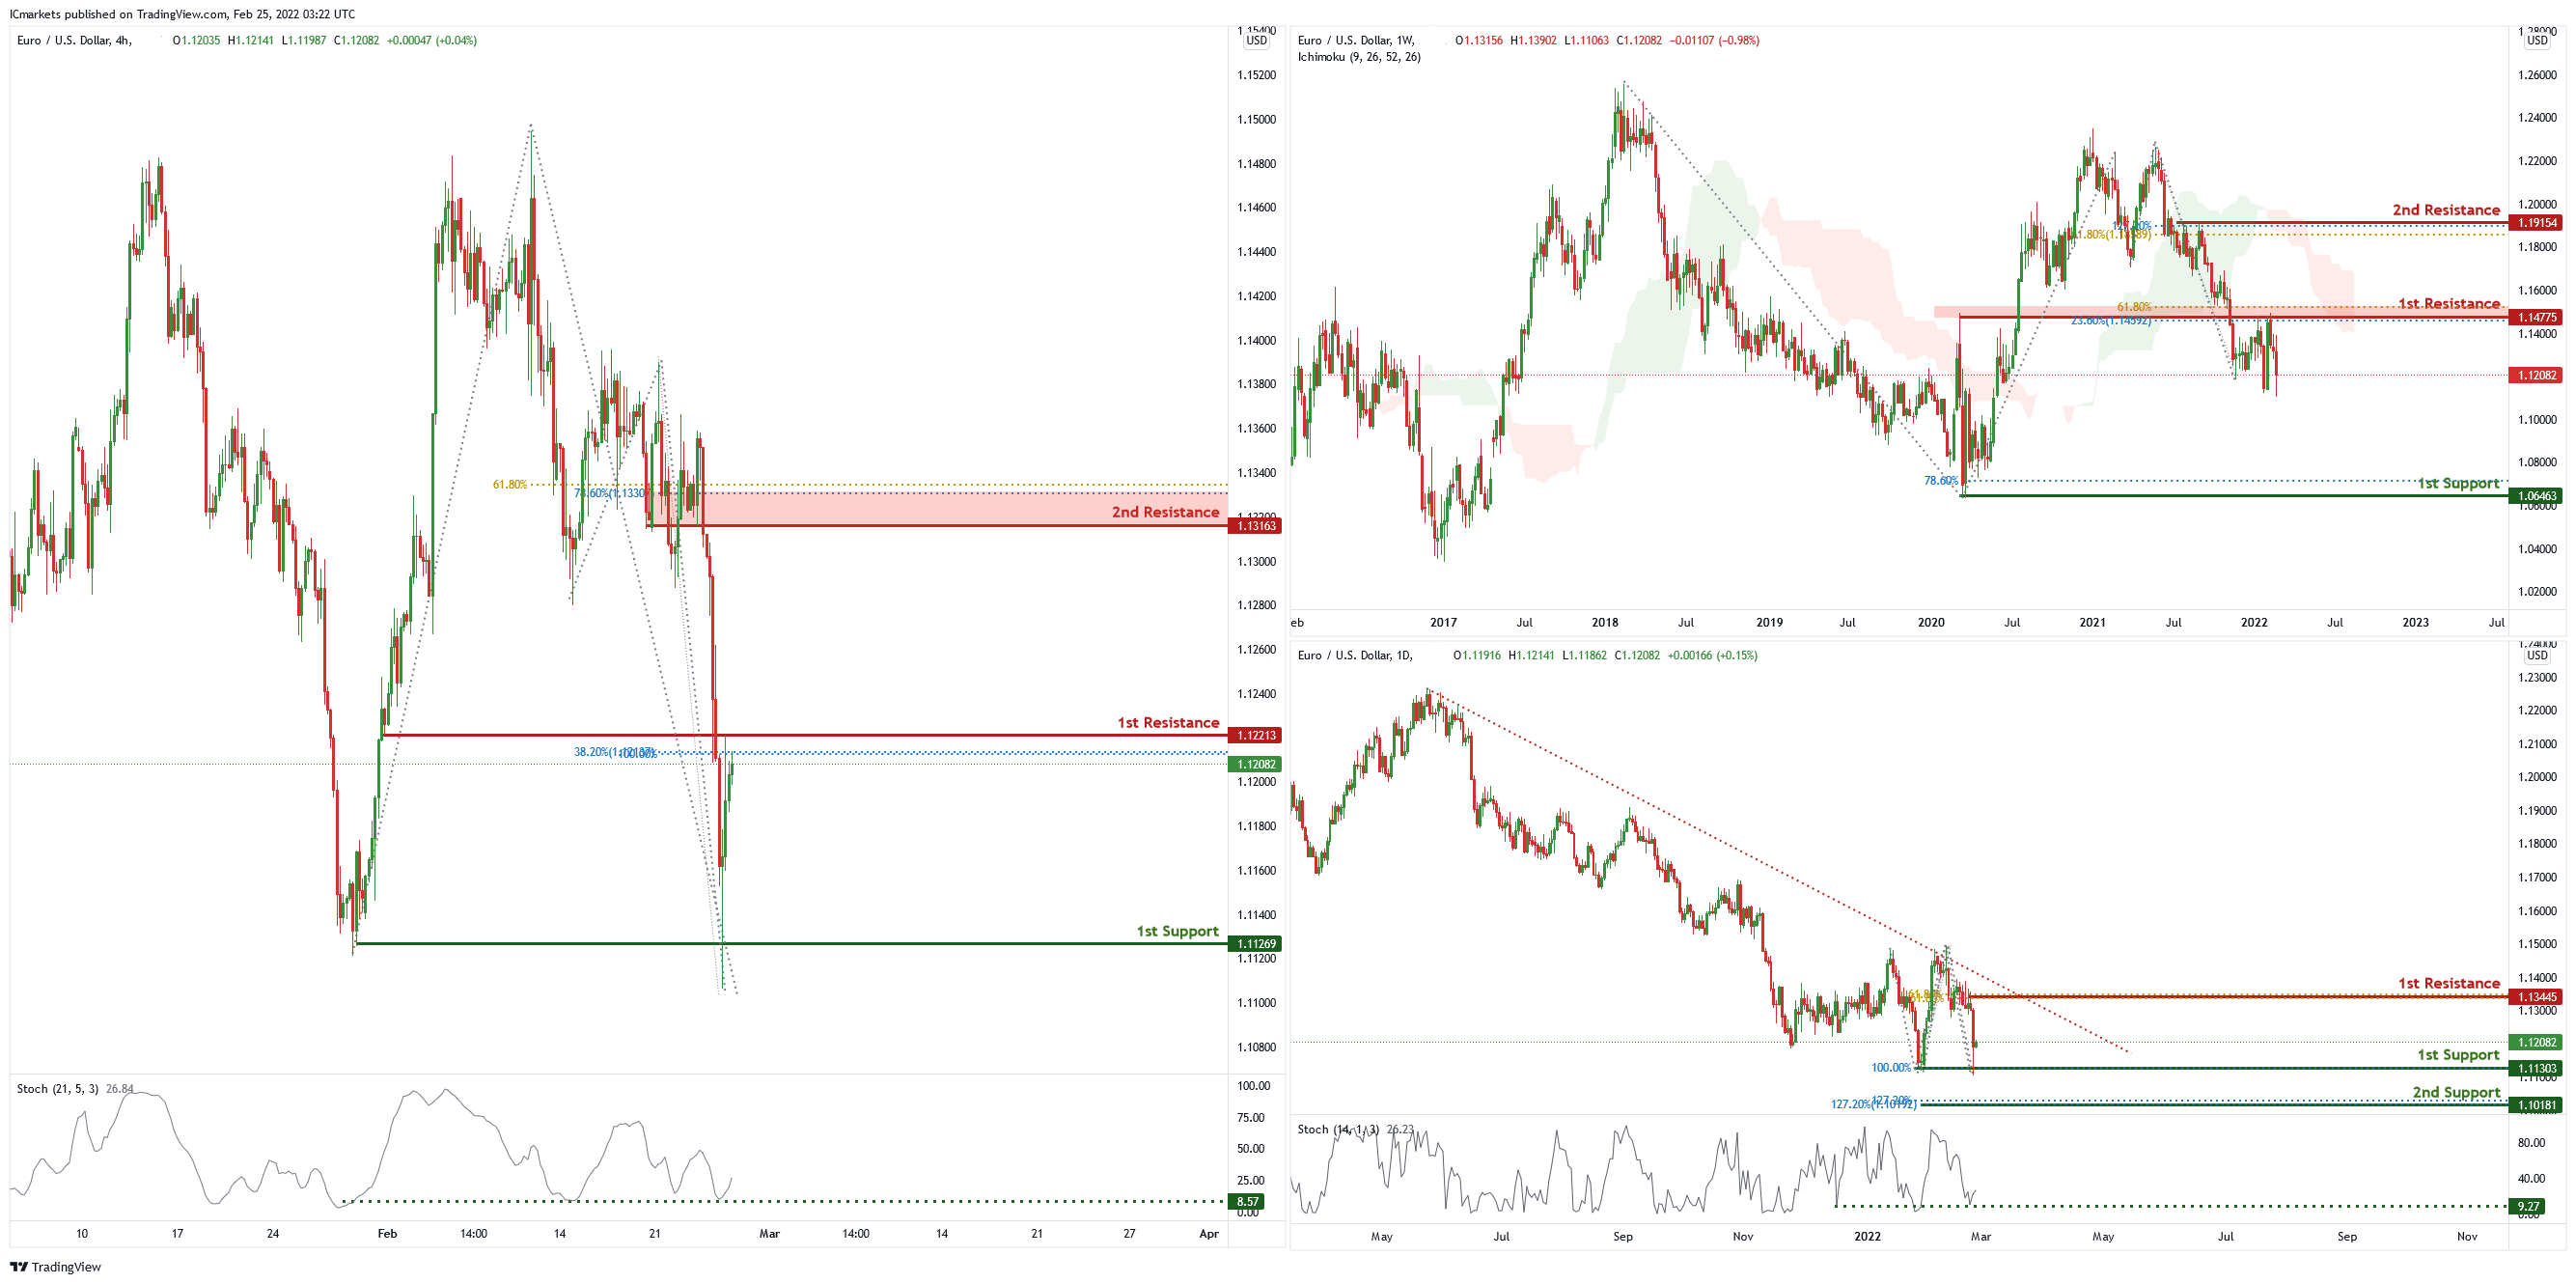
On the weekly chart, price is near 1st resistance level of 1.14226 which is also 61.8% Fibonacci projection and 23.6% Fibonacci retracement. Price can potentially dip to the 1st support level of 1.06475 which is 78.6% Fibonacci projection. Our bearish bias is supported by the ichimoku cloud indicator as price is trading below it.
On the daily chart, price is abiding by the descending trendline and is near 1st support level of 1.11303 in line with 100% Fibonacci projection and graphical swing low. Price can potentially bounce to the 1st resistance level of 1.13445 in line with 61.8% Fibonacci retracement and 61.8% Fibonacci projection. Our bullish bias is supported by the stochastic indicator as it is at support level.
On the H4 chart, price is near 1st resistance level of 1.12213 in line with 38.2% Fibonacci retracement and 100% Fibonacci projection. Price can potentially go to the 2nd resistance level of 1.13163 in line with 61.8% Fibonacci projection and 78.6% Fibonacci retracement. Our bullish bias is supported by the stochastic indicator as it is near support level
- H4 1st resistance at 1.12213
- H4 2nd resistance at 1.13163
USD/JPY
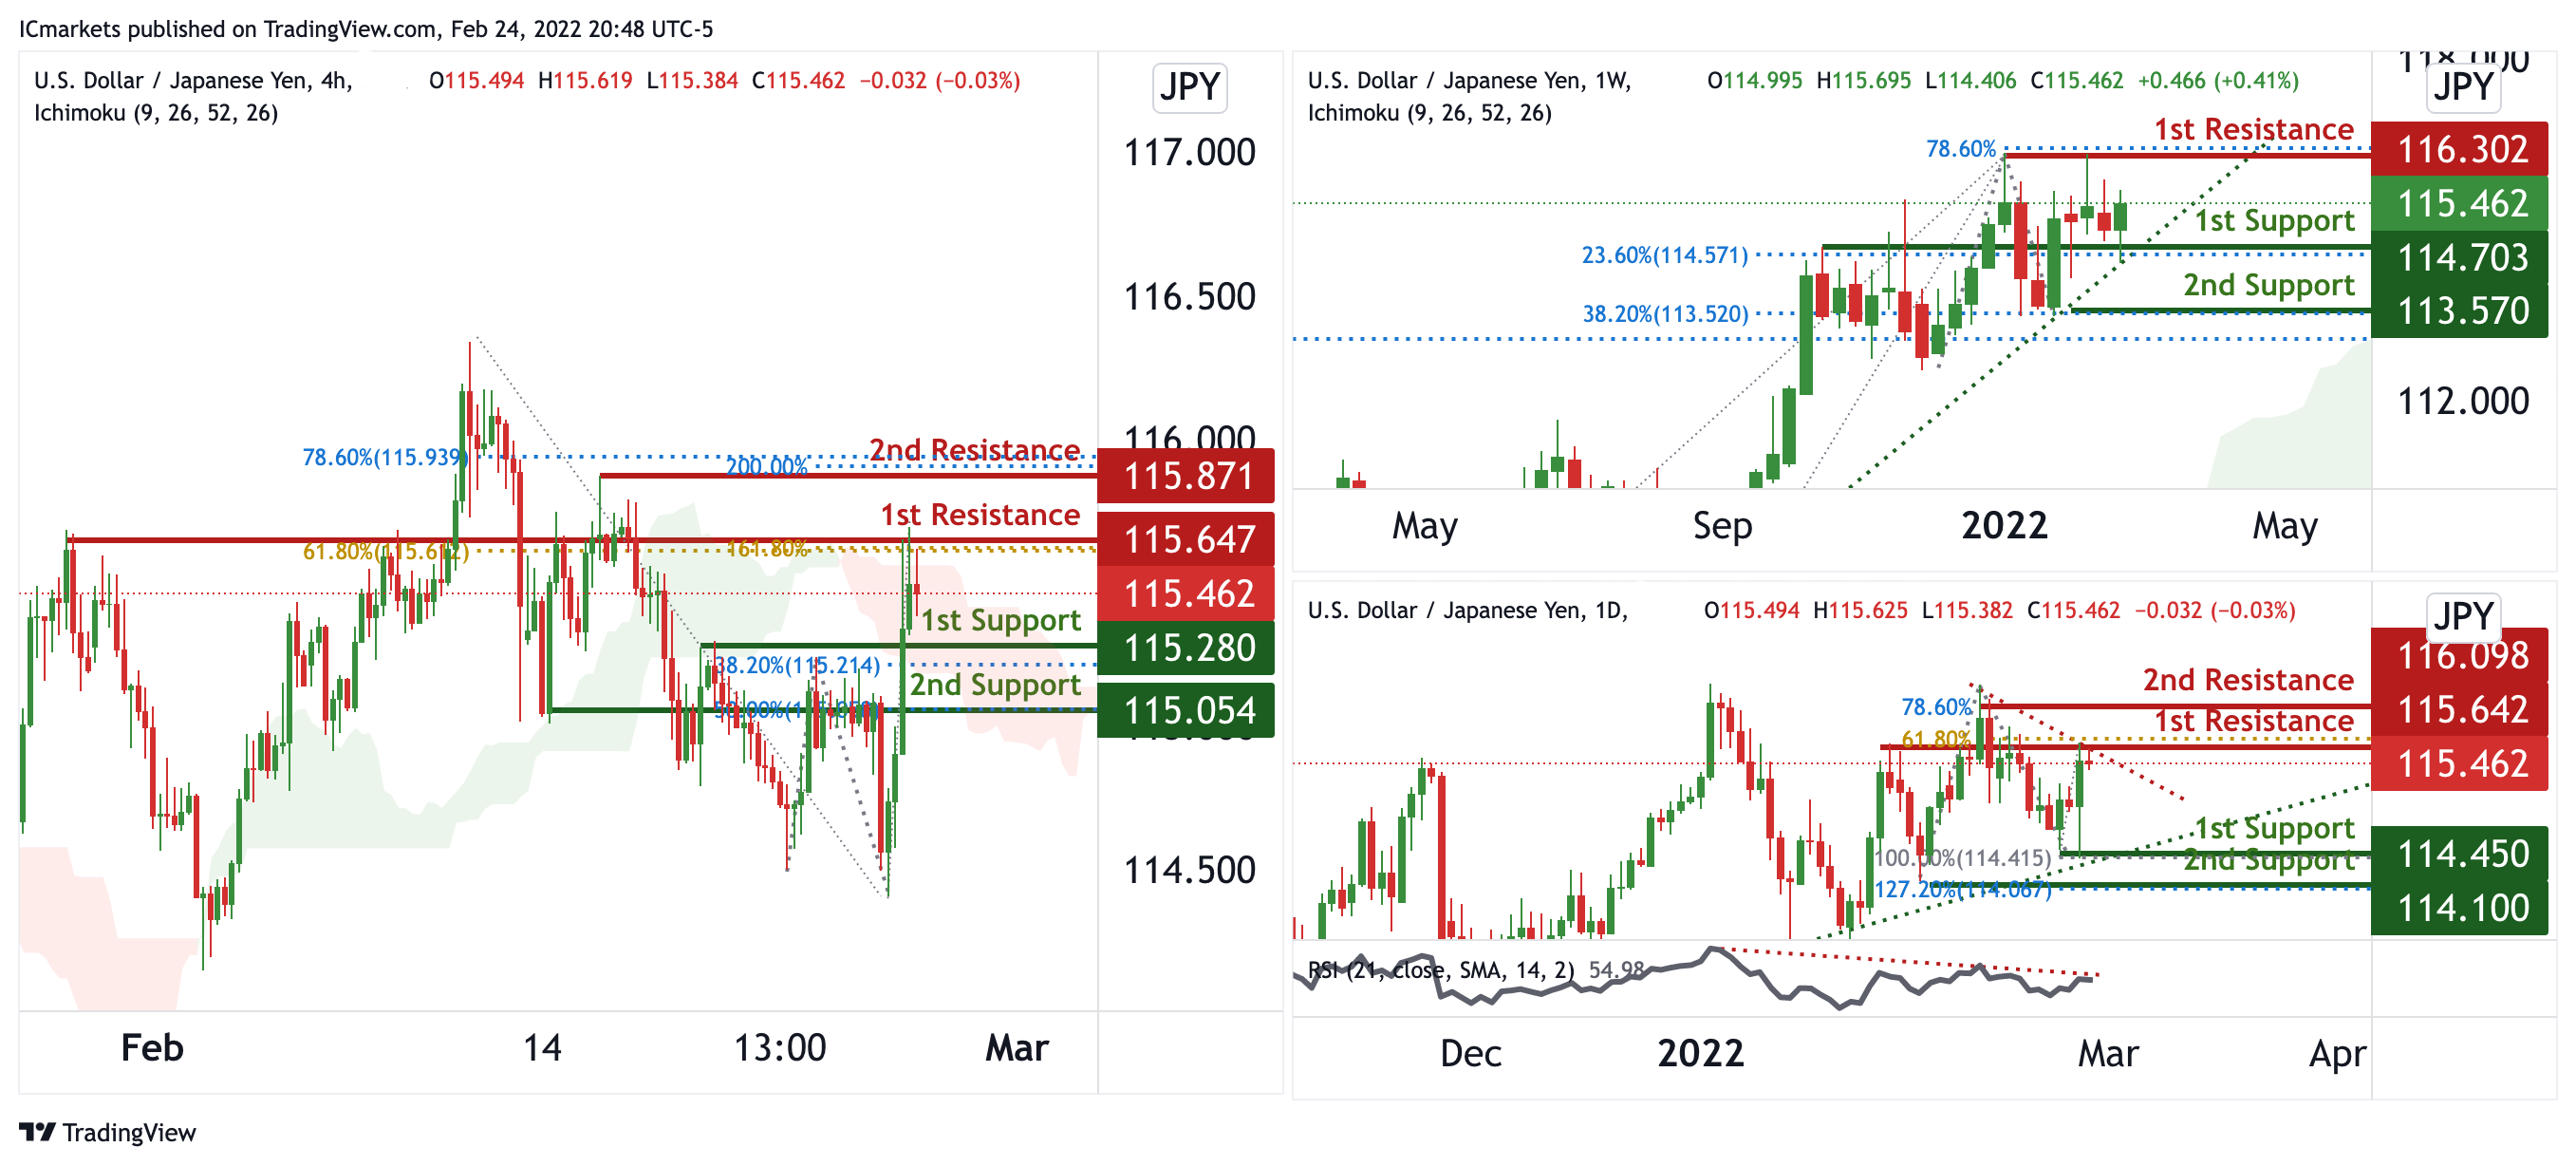
On the weekly, prices are on bullish momentum and abiding to our ascending trendline. We see potential for bullish momentum to climb from our 1st support at 114.703 in line with 23.6% Fibonacci retracement towards our 1st resistance at 116.302 in line with 78.6% Fibonacci extension. Prices are trading above our ichimoku cloud support.
On the daily, prices are consolidating in a triangle. We see potential for a dip from our 1st resistance at 115.642 in line with 61.8% Fibonacci retracement towards our 1st support at 114.450 in line with 100% Fibonacci retracement. RSI is depicting bearish momentum and ichimoku is showing red clouds, further supporting our bearish bias.
On the H4 timeframe, prices are at a strong resistance and pivot. We see the potential for bearish dip from our 1st resistance at 115.647 in line with 61.8% Fibonacci retracement and 161.8% Fibonacci projection towards our 1st support at 115.280 in line with 38.2% Fibonacci retracement and 61.8% Fibonacci extension. Ichimoku is forecasting bearish momentum.
Areas of consideration:
- H4 time frame, 1st resistance at 115.647
- H4 time frame, 1st support at 115.280
AUD/USD:
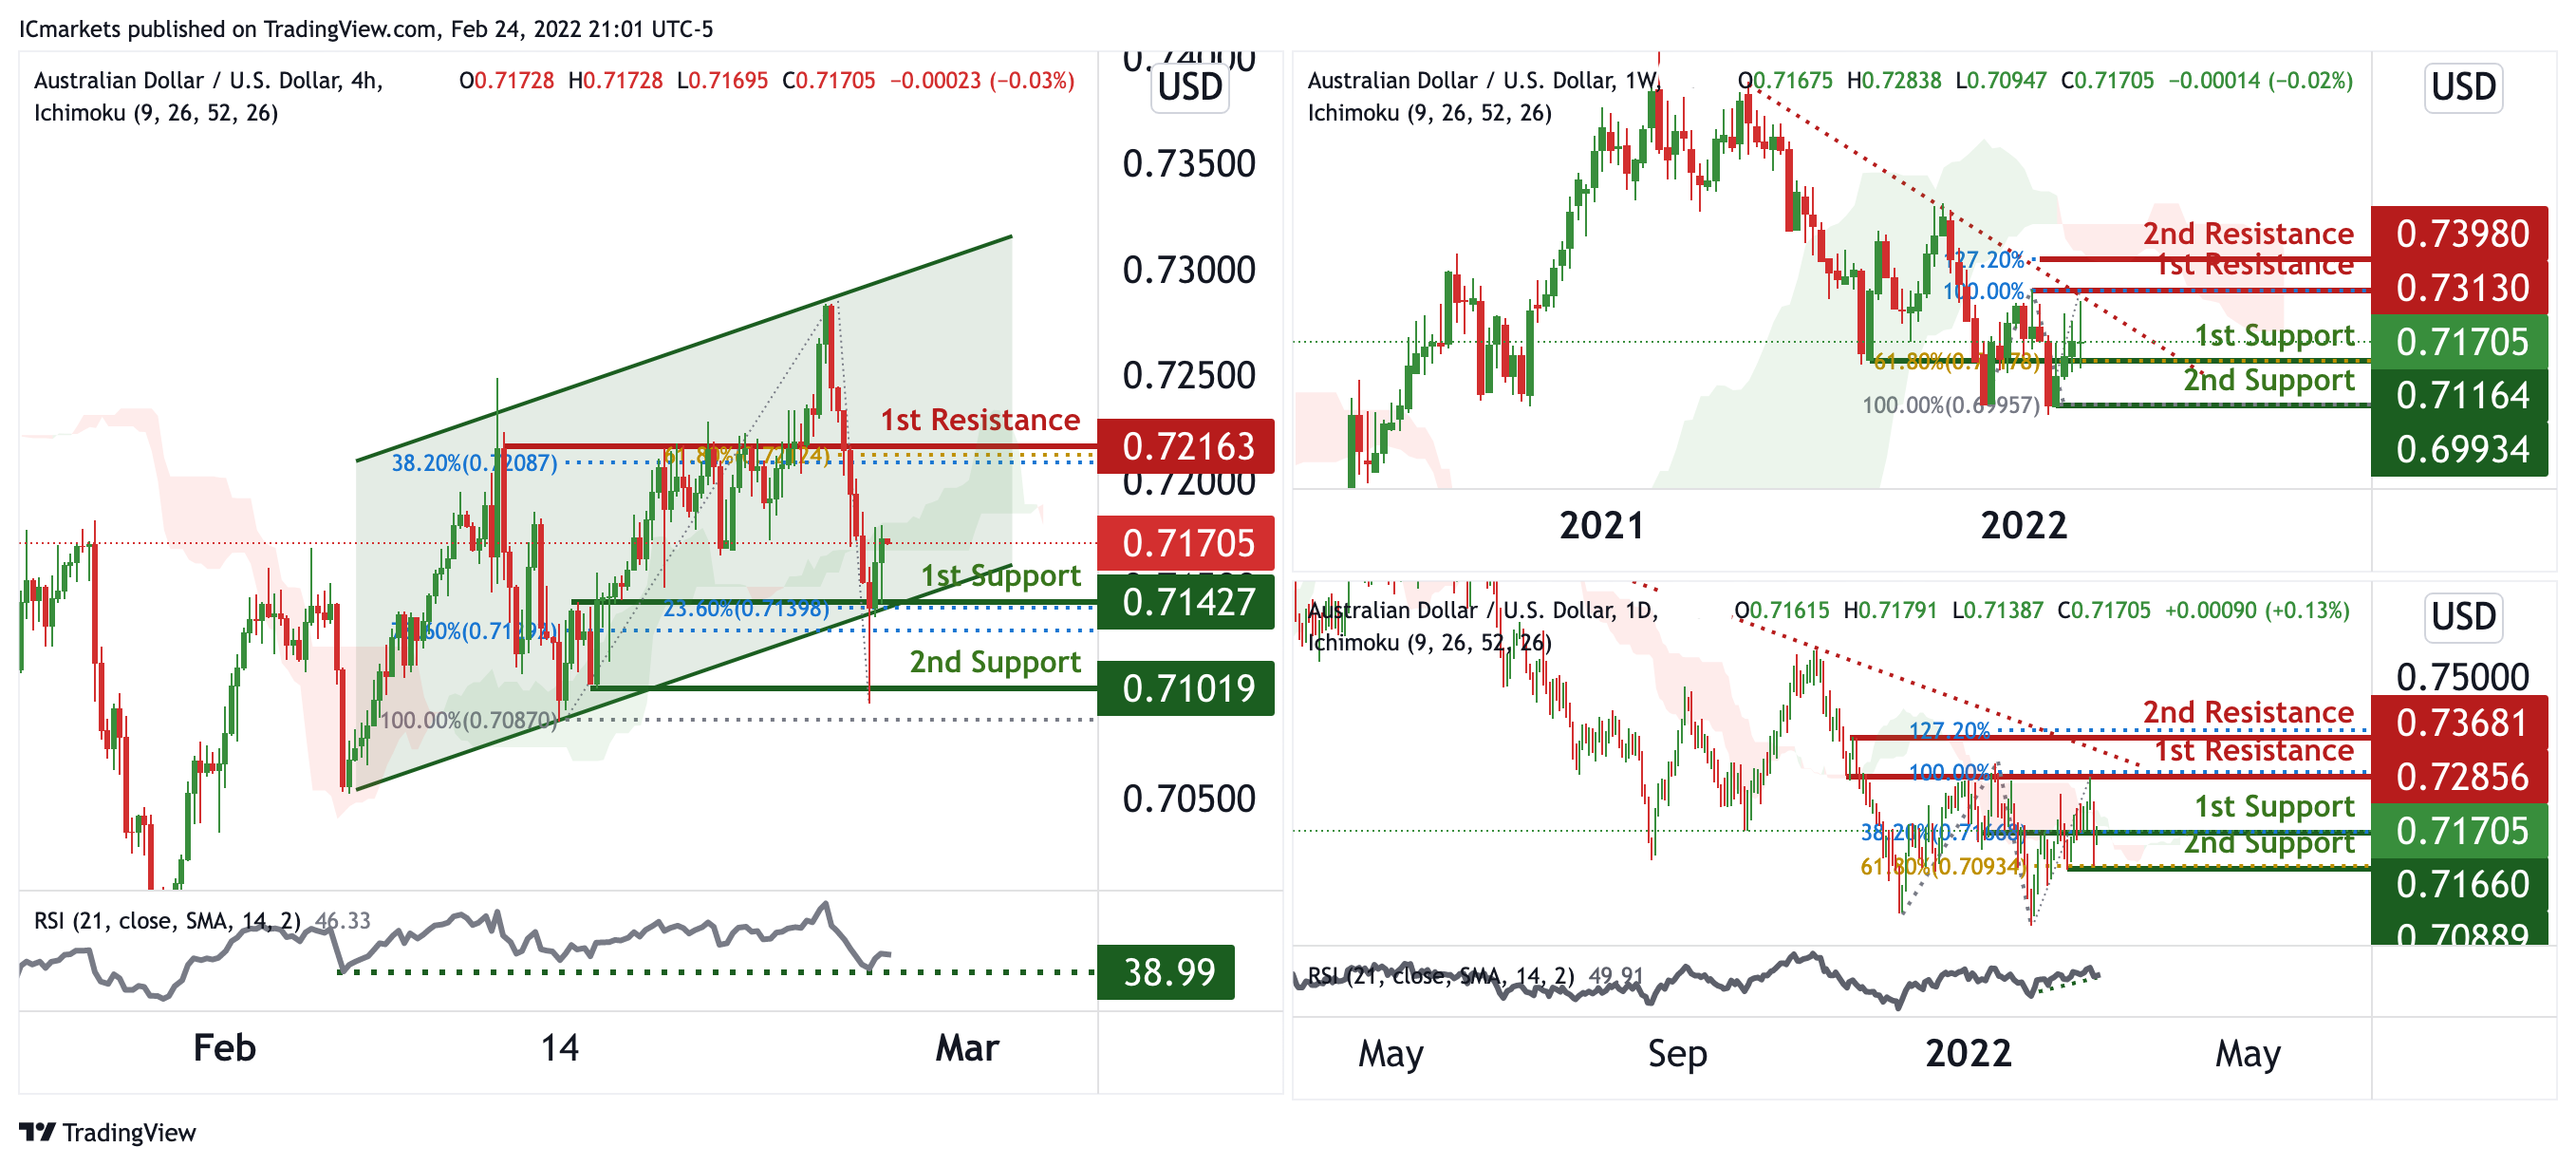
On the weekly, prices are on bearish momentum and abiding to our descending trendline. We see the potential for prices to do a short pullback from our 1st resistance at 0.7313 in line with 100% Fibonacci extension towards our 1st support at 0.71164 in line with 61.8% Fibonacci retracement. Ichimoku are forecasting bearish clouds, supporting our bearish bias.
On the daily, prices are bearish momentum and abiding to our descending trendline, and also at a swing high. We see potential for a bounce from our 1st support at 0.71705 in line with 38.2% Fibonacci retracement towards our 1st resistance at 0.72856 in line with 100% Fibonacci extension. Our bias is further supported by RSI being on bullish momentum.
On the H4 chart, prices are abiding to our bullish channel. We see potential for a bounce from our 1st support at 0.74127 in line with 23.6% Fibonacci retracement and 78.6% Fibonacci extension towards our 1st resistance at 0.72163 in line with 61.8% Fibonacci extension and 38.2% FIbonacci retracement. Our bullish bias is further supported by ichimoku clouds showing bullish momentum and RSI being at levels where bounces previously occurred.
NZD/USD:
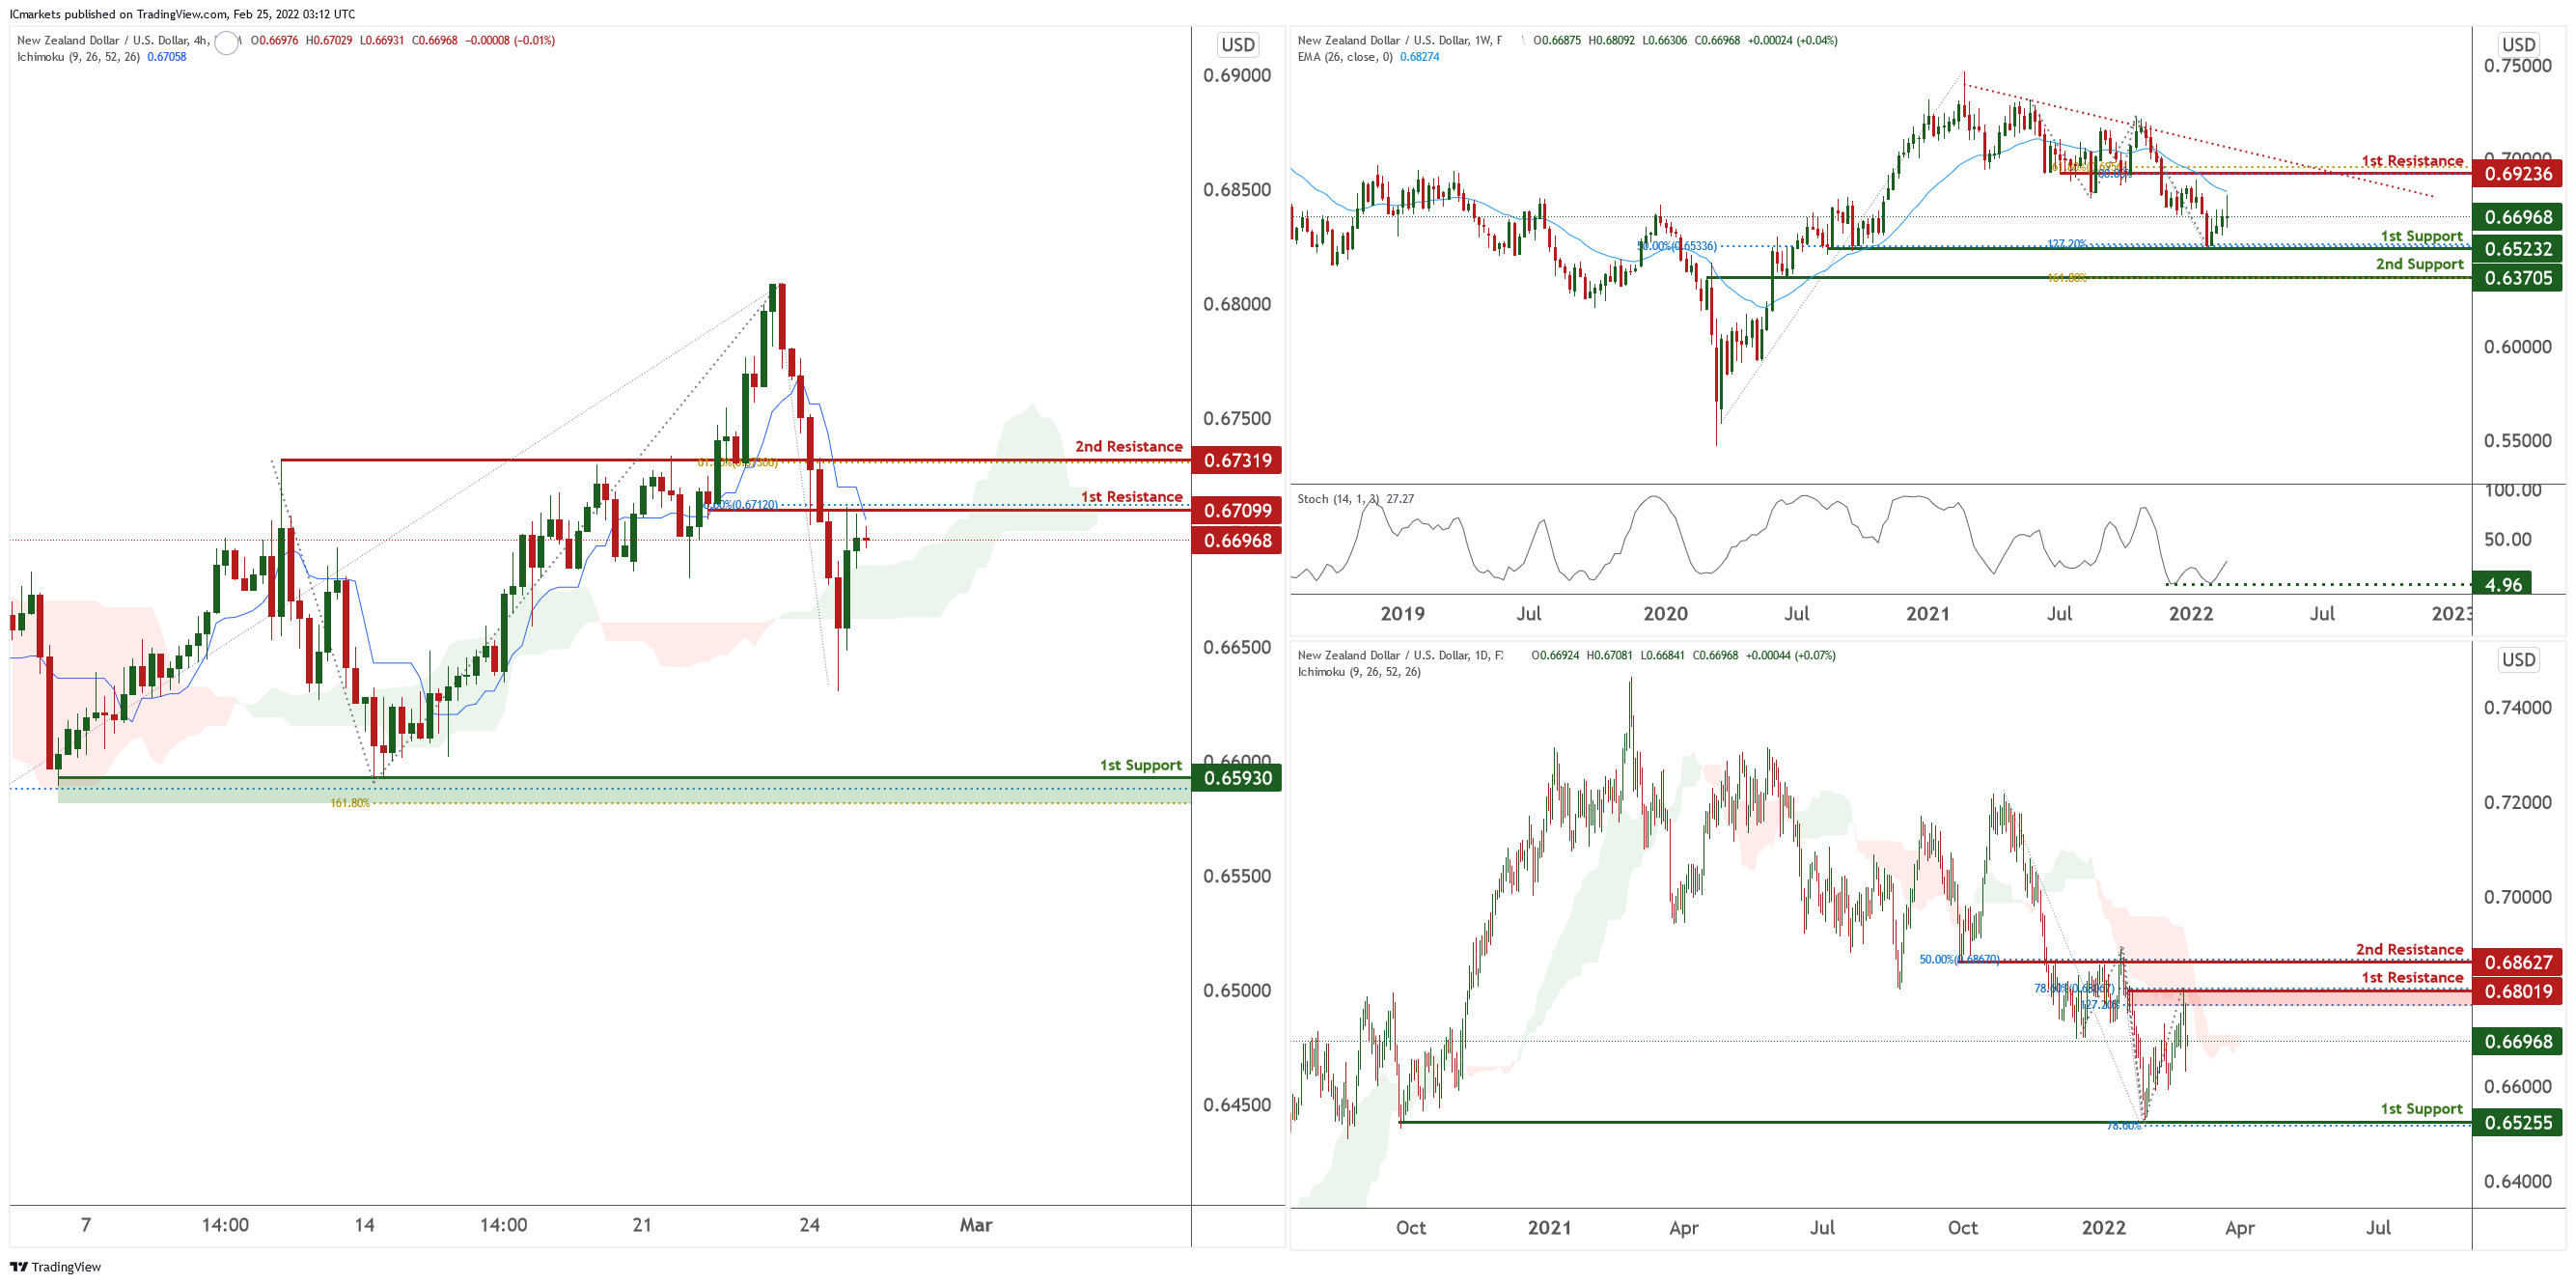
On the weekly time frame price is abiding by a descending trendline and near 1st support level of 0.65232 in line with 50% Fibonacci retracement and 127.2% Fibonacci projection. Price can go to the 1st resistance level of 0.69236 in line with 100% Fibonacci projection and 61.8% Fibonacci retracement. Our bullish bias is supported by stochastic indicator as it is near support level
On the daily chart, price is near 1st resistance level of 0.68019 in line with 78.6% Fibonacci retracement and 127.2% Fibonacci projection. Price can potentially dip to the 1st support level of 0.65255 in line with 78.6% Fibonacci projection. Our bearish bias is supported by the ichimoku cloud indicator as the price is trading below it.
On the daily chart price is near 1st resistance level of 0.67099 in line with 50% Fibonacci retracement. Price can potentially dip to the 1st support level of 0.65930 in line with 78.6% Fibonacci retracement and 161.8% Fibonacci projection. Our bearish bias is supported by technical indicators.
Areas of consideration:
- H4 time frame, 1st resistance at 0.67099
- H4 time frame, 1st support at 0.65930
USD/CAD:
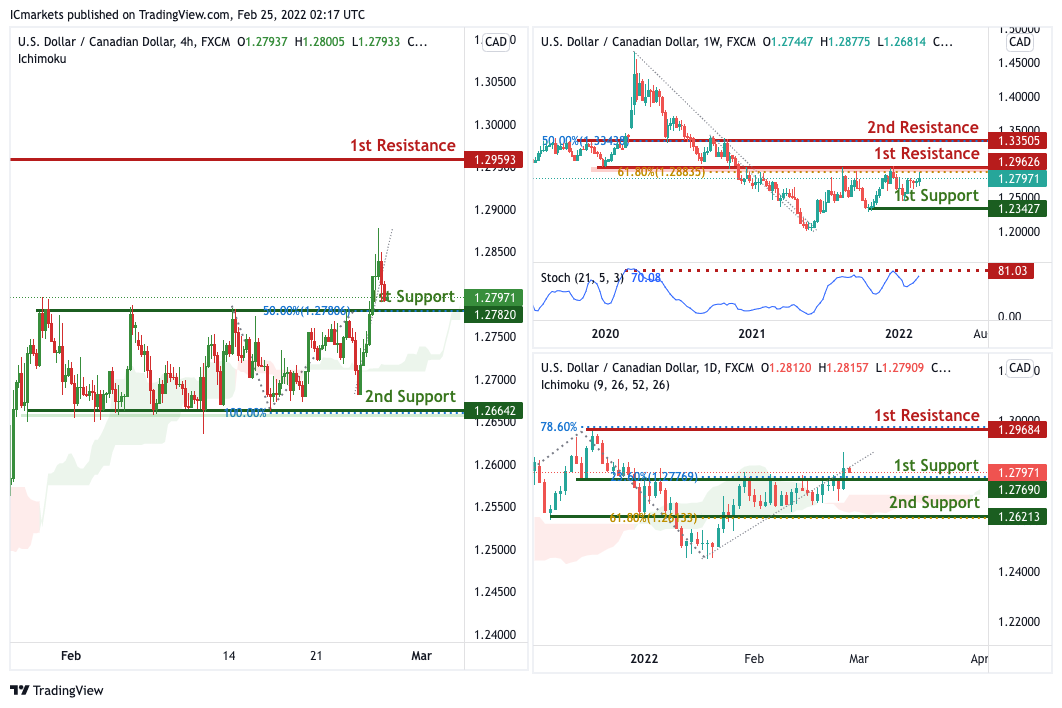
On the Weekly, We see the possibility of bearish continuation from our 1st resistance at 1.29626 in line with horizontal swing high resistance towards our 1st support at 1.23427 in line with the 100% Fibonacci extension level. Our bearish bias is further supported by prices reversing off the stochastic indicator. On the Daily, with price moving above the ichimoku cloud, we can expect bullish continuation from our 1st support at 1.27690 in line with 38.2% Fibonacci retracement towards our 1st resistance at 1.29684 which is a strong resistance and in line with 127.2% Fibonacci extension. Alternatively, price may break 1st support structure and head for 2nd support, which coincides with the ascending trendline and 38.2% Fibonacci retracement at 1.26213.
On the H4, with price moving above the ichimoku cloud, we can expect bullish continuation from our 1st support at 1.27971 in line with 38.2% Fibonacci retracement towards our 1st resistance at 1.29593 which is a strong resistance and in line with 127.2% Fibonacci extension. Alternatively, price may break 1st support structure and head for 2nd support, which coincides with the ascending trendline and 38.2% Fibonacci retracement at 1.26642.
Areas of consideration:
- H4 time frame, 1st support at 1.26642
- H4 time frame, 1st resistance at 1.27971
OIL:
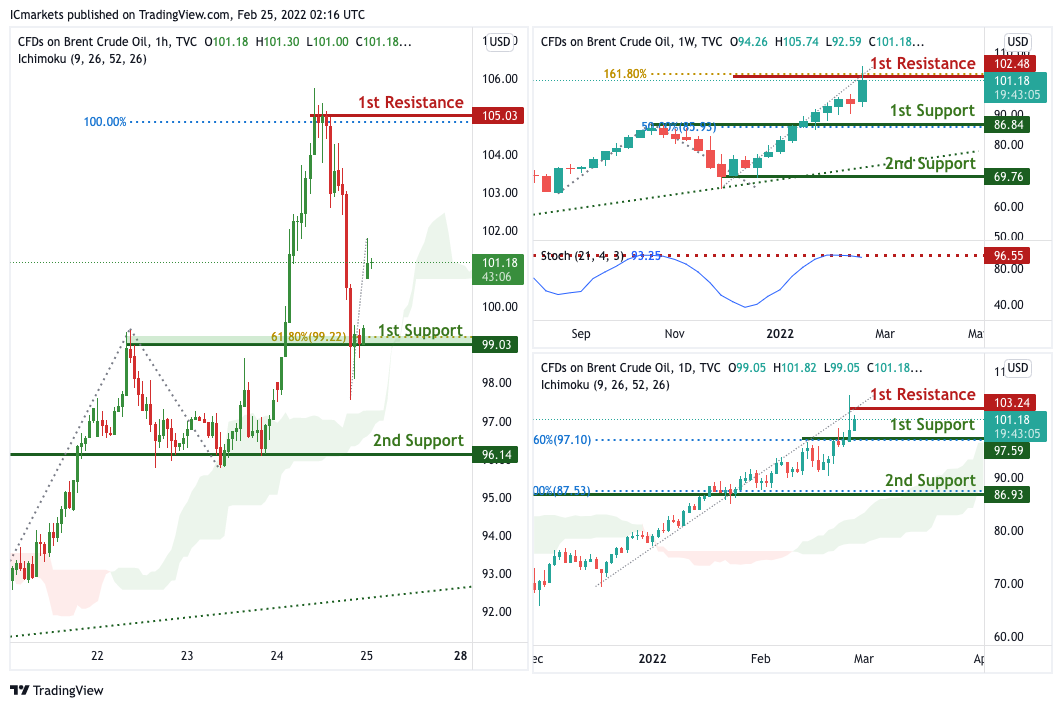
On the Weekly, with price moving above the ichimoku cloud, we can expect bullish continuation from our 1st support at 86.84 in line with 38.2% Fibonacci retracement towards our 1st resistance at 101.18 which is a strong resistance and in line with 127.2% Fibonacci extension. Alternatively, price may break 1st support structure and head for 2nd support, which coincides with the ascending trendline and 38.2% Fibonacci retracement at 67.76.
On the Daily, with price moving above the ichimoku cloud, we can expect bullish continuation from our 1st support at 97.59 in line with 38.2% Fibonacci retracement towards our 1st resistance at 103.24 which is a strong resistance and in line with 127.2% Fibonacci extension. Alternatively, price may break 1st support structure and head for 2nd support, which coincides with the ascending trendline and 38.2% Fibonacci retracement at 86.93.
On the H4, with price moving above the ichimoku cloud, we can expect bullish continuation from our 1st support at 99.03 in line with 38.2% Fibonacci retracement towards our 1st resistance at 105.03 which is a strong resistance and in line with 127.2% Fibonacci extension. Alternatively, price may break 1st support structure and head for 2nd support, which coincides with the ascending trendline and 38.2% Fibonacci retracement at 96.14.
Areas of consideration:
- H4 time frame, 1st resistance of 105.03
- H4 time frame, 1st support of 99.03
Dow Jones Industrial Average:
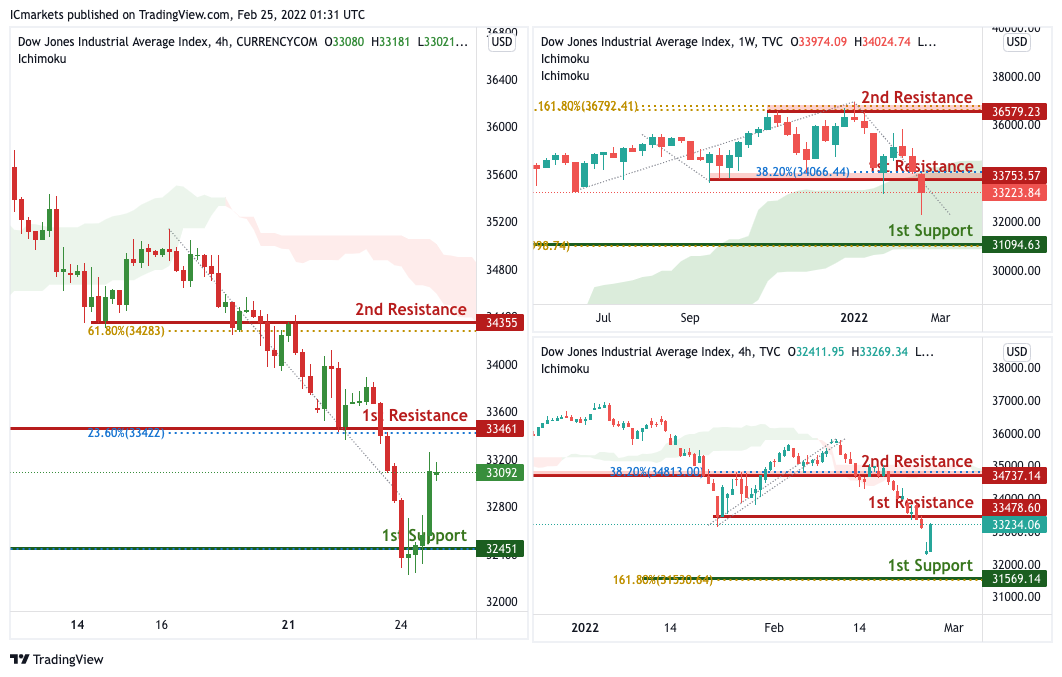
On the Weekly timeframe, We see the possibility of bearish continuation from our 1st resistance at 33753 in line with horizontal overlap resistance towards our 1st support at 31094 in line with the horizontal swing low support. Alternatively, price may break 1st resistance and head for 2nd resistance at 36579 in line with the 50% Fibonacci retracement level. Our bearish bias is further supported by how price is moving below the ichimoku cloud
On the Daily timeframe, We see the possibility of bearish continuation from our 1st resistance at 33478 in line with horizontal overlap resistance towards our 1st support at 31569 in line with the horizontal swing low support. Alternatively, price may break 1st resistance and head for 2nd resistance at 34737 in line with the 50% Fibonacci retracement level. Our bearish bias is further supported by how price is moving below the ichimoku cloud
On the H4 timeframe, We see the possibility of bearish continuation from our 1st resistance at 33461 in line with horizontal overlap resistance towards our 1st support at 32451 in line with the horizontal swing low support. Alternatively, price may break 1st resistance and head for 2nd resistance at 34355 in line with the 50% Fibonacci retracement level. Our bearish bias is further supported by how price is moving below the ichimoku cloud
Areas of consideration :
- H4 1st support at 34451
- H4 1st resistance at 33461
EUR/CHF Daily Outlook
Daily Pivots: (S1) 1.0298; (P) 1.0340; (R1) 1.0402; More....
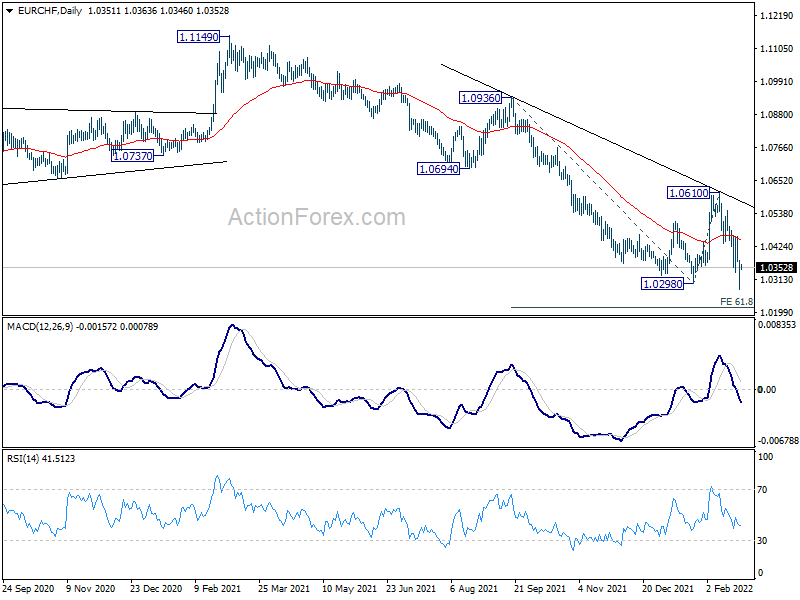
EUR/CHF recovers after diving to 1.0277. But still, with 1.0459 resistance intact, further decline is expected. The down larger down trend from 1.1149 should be resuming. Sustained trading below 1.0298 will target 61.8% projection of 1.0936 to 1.0298 from 1.0610 at 1.0216. However, strong break of 1.0459 will bring further rebound to 1.0610 resistance instead.
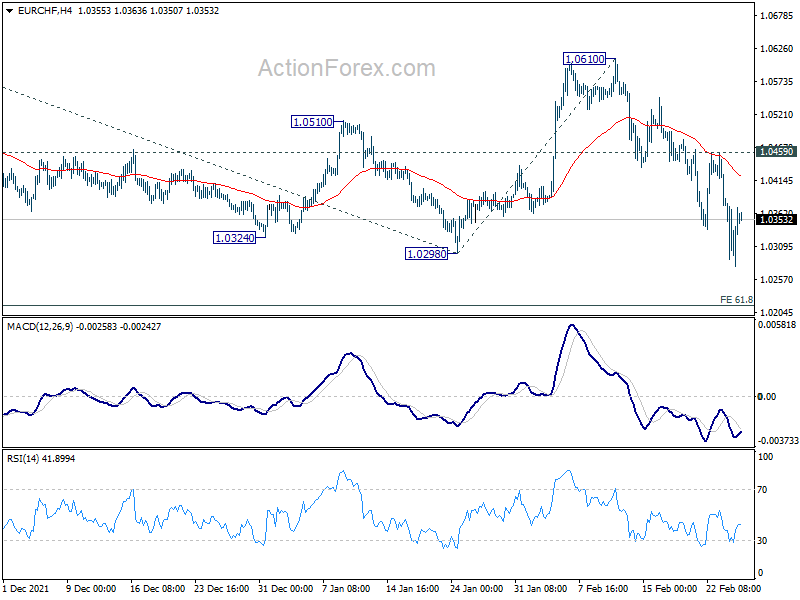
In the bigger picture, long term down trend from 1.2004 (2018 high) is still in progress. Next target is 61.8% projection of 1.2004 to 1.0505 to 1.1149 at 1.0223. Sustained break there will target 100% projection at 0.9650. In any case, break of 1.0610 resistance is needed to be the first sign of bottoming. Otherwise, outlook will remain bearish.
Markets Stabilized from Ukraine Crisis, But Risks Remain
Overall, the markets seem to have stabilized from the shocking invasion of Ukraine by Russia, for now at least. US stock markets staged a late and strong turnaround overnight while Asian markets also recovered. Gold is back pressing 1900 handle while WTI oil is trading around 96, after breaching 100 briefly. In the currency markets, Dollar turned softer with Swiss Franc while Aussie is up with Sterling today.
Technically, attention will be paid on Euro and Sterling for today. As long as 1.1287 minor resistance in EUR/USD and 1.3485 minor resistance in GBP/USD hold, risk stay on the downside for further fall. Similarly, as long as 130.03 minor resistance in EUR/JPY and 155.48 minor resistance in GBP/JPY hold, further declines are in favor. We'll see what's next.
In Asia, at the time of writing, Nikkei is up 1.88%. Hong Kong HSI is down -0.11%. China Shanghai SSE is up 0.71%. Singapore Strait Times is up 0.90%. Japan 10-year JGB yield is up 0.021 at 0.208. Overnight, DOW rose 0.28%. S&P 500 rose 1.50%. NASDAQ rose 3.34%. 10-year yield dropped -0.008 to 1.969.
Fed Waller prefers increasing rate by 100bps by middle of this year
Fed Governor Christopher Waller said in a speech that his preference is to "increase the target range 100 basis points by the middle of this year... appropriate interest rate policy brings the target range up to 1 to 1.25 percent early in the summer." That would be "a bit below" pre-pandemic level when inflation was "considerably lower" and Fed's balance sheet less than halved.
Nevertheless, he added, "of course, it is possible that the state of the world will be different in the wake of the Ukraine attack, and that may mean that a more modest tightening is appropriate."
"I will continue to monitor the geopolitical situation to assess the appropriate timing of this near-term monetary policy tightening," Waller said. "These actions will get us into the second half of the year, when we will have six months of inflation data, and we can assess what the appropriate path will be for the rest of 2022."
Fed Bostic: Events today in the Ukraine are on all of our minds
Atlanta Fed bank President Raphael Bostic said, "events today in the Ukraine are on all of our minds. We'll be watching this closely here in Atlanta and across the Federal Reserve system to assess the economic and financial impacts,"
He still thinks may need to hikes four or more times this year if high inflation persists. However, "I am really open to adjusting this as we get more clarity on how the economy is evolving...the data may come in perhaps more pessimistic in terms of how well we are doing on inflation and if it does I'm going to move my view, maybe 4 (hikes), and depending on how things go it may be more than that."
RBNZ Orr: Raising rates sooner prevents the need for even higher rates
RBNZ Governor Adrian Orr said in a speech, "amongst many of our central bank peers, we were one of the first to begin removing monetary stimulus and start the tightening cycle".
"Financial market pricing for future interest rate levels have been very responsive to our signalling," he added. "Market pricing of future central bank policy rates continue to indicate that New Zealand is expected to tighten policy sooner than many other comparable economies."
"By getting on top of inflation pressures quickly, by raising interest rates sooner, we aim to prevent the need for even higher rates in the future," he said. "In other words, we are taking our foot off the accelerator now to minimise having to use the brakes harder in future."
On the data front
New Zealand retail sales rose 8.6% qoq in Q4, above expectation of 6.2% qoq. Ex-auto sales rose 6.8% qoq, above expectation of 5.5% qoq. Tokyo CPI core rose from 0.2% yoy to 0.5% yoy in February, above expectation of 0.4% yoy. UK Gfk consumer confidence dropped from -19 to -26 in February, below expectation of -16.
Looking ahead, GDP data from Germany and France will be featured. Eurozone will release economic sentiment indicator. Later in the day, US will release personal income and spending with PCE inflation, durable goods orders and pending home sales.
EUR/CHF Daily Outlook
Daily Pivots: (S1) 1.0298; (P) 1.0340; (R1) 1.0402; More....
EUR/CHF recovers after diving to 1.0277. But still, with 1.0459 resistance intact, further decline is expected. The down larger down trend from 1.1149 should be resuming. Sustained trading below 1.0298 will target 61.8% projection of 1.0936 to 1.0298 from 1.0610 at 1.0216. However, strong break of 1.0459 will bring further rebound to 1.0610 resistance instead.
In the bigger picture, long term down trend from 1.2004 (2018 high) is still in progress. Next target is 61.8% projection of 1.2004 to 1.0505 to 1.1149 at 1.0223. Sustained break there will target 100% projection at 0.9650. In any case, break of 1.0610 resistance is needed to be the first sign of bottoming. Otherwise, outlook will remain bearish.
Economic Indicators Update
| GMT | Ccy | Events | Actual | Forecast | Previous | Revised |
|---|---|---|---|---|---|---|
| 21:45 | NZD | Retail Sales Q/Q Q4 | 8.60% | 6.20% | -8.10% | -8.20% |
| 21:45 | NZD | Retail Sales ex Autos Q/Q Q4 | 6.80% | 5.50% | -6.70% | -6.80% |
| 23:30 | JPY | Tokyo CPI Core Y/Y Feb | 0.50% | 0.40% | 0.20% | |
| 00:01 | GBP | GfK Consumer Confidence Feb | -26 | -16 | -19 | |
| 07:00 | EUR | Germany Import Price Index M/M Jan | 0.20% | 0.10% | ||
| 07:00 | EUR | Germany GDP Q/Q Q4 F | -0.70% | -0.70% | ||
| 07:45 | EUR | France Consumer Spending M/M Jan | -0.30% | 0.20% | ||
| 07:45 | EUR | France GDP Q/Q Q4 | 0.70% | 0.70% | ||
| 09:00 | EUR | Eurozone M3 Money Supply Y/Y Jan | 6.70% | 6.90% | ||
| 10:00 | EUR | Eurozone Economic Sentiment Indicator Feb | 113 | 112.7 | ||
| 10:00 | EUR | Eurozone Services Sentiment Feb | 10.3 | 9.1 | ||
| 10:00 | EUR | Eurozone Industrial Confidence Feb | 14.2 | 13.9 | ||
| 10:00 | EUR | Eurozone Consumer Confidence Feb F | -8.8 | -8.8 | ||
| 13:30 | USD | Personal Income M/M Jan | -0.30% | 0.30% | ||
| 13:30 | USD | Personal Spending Jan | 1.50% | -0.60% | ||
| 13:30 | USD | PCE Price Index M/M Jan | 0.30% | 0.40% | ||
| 13:30 | USD | PCE Price Index Y/Y Jan | 5.50% | 5.80% | ||
| 13:30 | USD | Core PCE Price Index M/M Jan | 0.50% | 0.50% | ||
| 13:30 | USD | Core PCE Price Index Y/Y Jan | 4.80% | 4.90% | ||
| 13:30 | USD | Durable Goods Orders Jan | 0.60% | -0.70% | ||
| 13:30 | USD | Durable Goods Orders ex Transportation Jan | 0.40% | 0.60% | ||
| 15:00 | USD | Pending Home Sales M/M Jan | -0.20% | -3.80% | ||
| 15:00 | USD | Michigan Consumer Sentiment Index Feb F | 61.7 | 61.7 |
RBNZ Orr: Raising rates sooner prevents the need for even higher rates
RBNZ Governor Adrian Orr said in a speech, "amongst many of our central bank peers, we were one of the first to begin removing monetary stimulus and start the tightening cycle".
"Financial market pricing for future interest rate levels have been very responsive to our signalling," he added. "Market pricing of future central bank policy rates continue to indicate that New Zealand is expected to tighten policy sooner than many other comparable economies."
"By getting on top of inflation pressures quickly, by raising interest rates sooner, we aim to prevent the need for even higher rates in the future," he said. "In other words, we are taking our foot off the accelerator now to minimise having to use the brakes harder in future."
Fed Waller prefers increasing rate by 100bps by middle of this year
Fed Governor Christopher Waller said in a speech that his preference is to "increase the target range 100 basis points by the middle of this year... appropriate interest rate policy brings the target range up to 1 to 1.25 percent early in the summer." That would be "a bit below" pre-pandemic level when inflation was "considerably lower" and Fed's balance sheet less than halved.
Nevertheless, he added, "of course, it is possible that the state of the world will be different in the wake of the Ukraine attack, and that may mean that a more modest tightening is appropriate."
"I will continue to monitor the geopolitical situation to assess the appropriate timing of this near-term monetary policy tightening," Waller said. "These actions will get us into the second half of the year, when we will have six months of inflation data, and we can assess what the appropriate path will be for the rest of 2022."
Ukraine Tragedy Unlikely to Affect RBA Policy
The tragic developments in the Ukraine have not triggered any significant changes in our views on Australian financial markets.
While the shock of aggressive military action in Europe has rattled equity and commodity markets, the keys to assessing any lasting effects are the direct impact that Ukraine and Russia have on global economic activity and Russia's special role in energy markets.
Apart from energy, Russia has limited global significance – its economic not much larger than Australia's; with a limited role in global supply chains; and, as one US bank points out, representing around 0.1% of all sales across US S&P500 companies.
US President Biden clearly pointed out that sanctions on Russian financial activities would not include energy payments – his argument is that given Russia's significance in energy markets, banning energy exports would place a huge burden on global consumers.
While the US is energy independent, Russia controls around 8% of global oil production, including 25% of the European market and 35% of European gas.
Eliminating such supply in energy markets that are already stretched with perilously low inventory levels would surely put enormous upward pressure on crude prices.
While there is certain to be significant short term volatility, comfort that the crisis is unlikely to severely affect global supplies of energy and therefore add further upward pressure on inflation is likely to see equity markets settle back – as has been the case with previous geopolitical disruptions that do not have lasting effects of global inflation or economic activity.
With this background, our assessment of Thursday's release of the Wage Price Index (WPI) is that while the Index printed in line with our expectations there was evidence of some intensifying wage pressures, ableit insufficient at this stage to justify the RBA raising rates before our schedule of the August meeting.
The headline increase for the quarter was 0.7%, following 0.6% and 0.4% in the previous two quarters.
We expect the March quarter Index to print 0.8% lifting the six month annualised pace to 3% – enough to justify the first rate hike given an expected lift in the other measures of wage pressures that the RBA will also be considering. These include turnover in the labour market; pressure on bonuses and overtime; average wages in the national accounts; job vacancies and job ads; surveys of businesses and the higher frequency components of the WPI covering individual agreements.
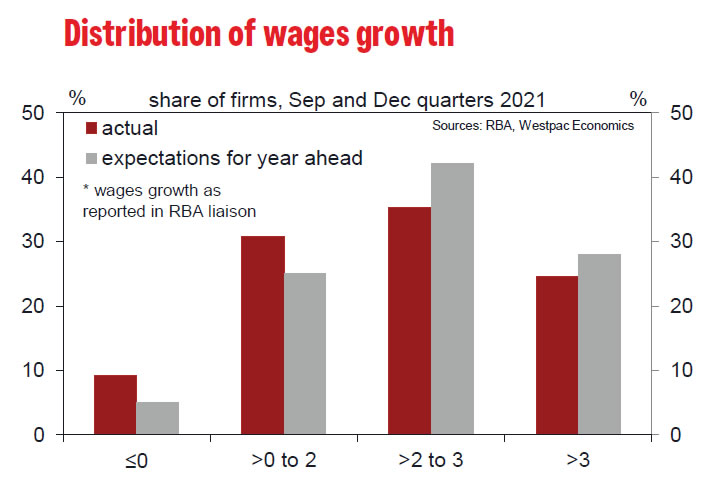
Already the RBA's own liaison work points to the clear movement towards stronger wage pressures, (see figure from RBA's February Statement on Monetary Policy) where there is a clear increase in the number of businesses expecting faster increases in wages.
The components of the latest WPI are difficult to assess given the high seasonality of individual agreements and that these figures are not seasonally adjusted. However, the sectors receiving the highest increases the quarter – hospitality; retail; manufacturing; construction; real estate; and professional services – point to the out-performance of sectors that are more heavily influence by individual agreements.
We do not think it will be necessary for the RBA to wait to see a 3% print for annual growth in the WPI before it can act given that it has already highlighted that the Index only measures base rates.
That 3% print is likely to arrive on August 24 when the June quarter WPI is released. The June quarter 2021 printed a COVIDaffected 0.4%. Once that drops out of the annual numbers the Index will lift significantly.
If, as we expect, the next two WPI prints are 0.8% then the annual growth rate will lift to around 3% in June from 2.5% in March.
But we believe that given the likely prints on headline and underlying inflation for the March and June quarters, which will be printing on on April 27 and July 27, the RBA will have enough information to move in August.
The Governor indicated recently to the Economics Committee of the House of Representatives that he would like to see two more inflation prints – not two more WPI prints.
Remember that central banks favour adopting some form of tightening bias before they actually start the tightening process. By the June Board meeting the March quarter CPI will be known as well as the March quarter WPI.
The March quarter CPI is going to see a very substantial lift in both headline and underlying inflation. Annual headline inflation is forecast to lift from 3.5% to 4.2% and underlying inflation to lift from 2.6% to 3.1%.
That is based on the crude oil price holding in the 'high 90s' implying no significant relief but as discussed above no surge above the US$100/bbl level that would result from disruptions to Russian oil supplies.
In fact we see more upside risk from housing in the March release although we do not expect a significant impact on the underlying measure.
That type of inflation lift combined with the ongoing evidence of a tightening labour market, including the 3% 'momentum' in the WPI will be sufficient for the RBA to begin the process of preparing the market for a rate hike at the June and July meetings.
At the August meeting the Board will have received further evidence of these rising inflationary pressures with the June inflation report where we expect underlying inflation to lift to 3.5% – the final piece to the puzzle to justify the Board delivering on its bias at the August meeting.
Because we are expecting some moderate easing in the oil price by the June quarter, we only expect headline inflation to have lifted to 4.3% from 4.2%.
And, as discussed, these views on the oil price are based on Russia being allowed to maintain its flow of oil.