Sample Category Title
Nasdaq Index Outlook: Microsoft (MSFT) Scares Markets Despite Strong Services PMI Report
Stock Markets opened mixed after a mildly positive overnight session in Futures and Global Indexes trading.
But after the ADP Miss confirming further next week's rate cuts and pricing in higher chances of another January cut (currently at 27% pricing), the fresh Services PMI beat sent conflicting signs to traders.
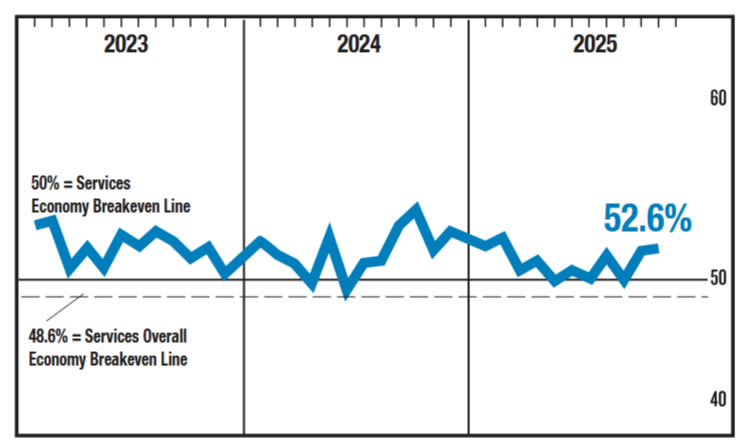
The headline number came in at 52.6 (beating the 52.1 forecast), but the internals provided the real story.
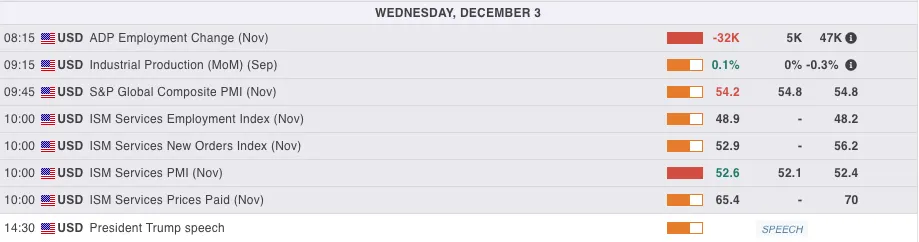
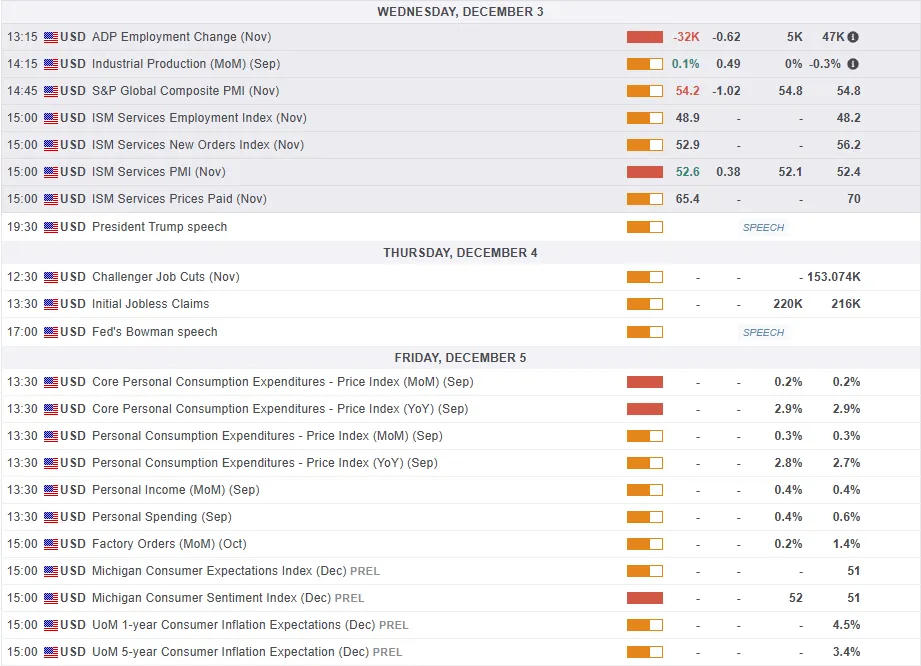
US Data from this morning – December 3, 2025 – MarketPulse Economic Calendar
On a positive note for the inflation outlook, the Prices Paid index declined significantly from 70.0 to 65.4, which confirms that tariff-led inflation was more of a one-time increase rather than a lasting effect—something that allows the Fed to be more flexible.
This view was further solidified by an unchanged import prices report (0.0% vs 0.1% expected) also released at 10:00 A.M (Even if the data is from September).
In other conflicting news, despite a way-more positive mood with the rate cut, Microsoft (MSFT) just sent a scary sign for the rebounding AI trend.
The tech giant gapped lower by 2.80% after a news article reported that the market leader has lowered its sales growth targets for newer AI products due to slower customer adoption.
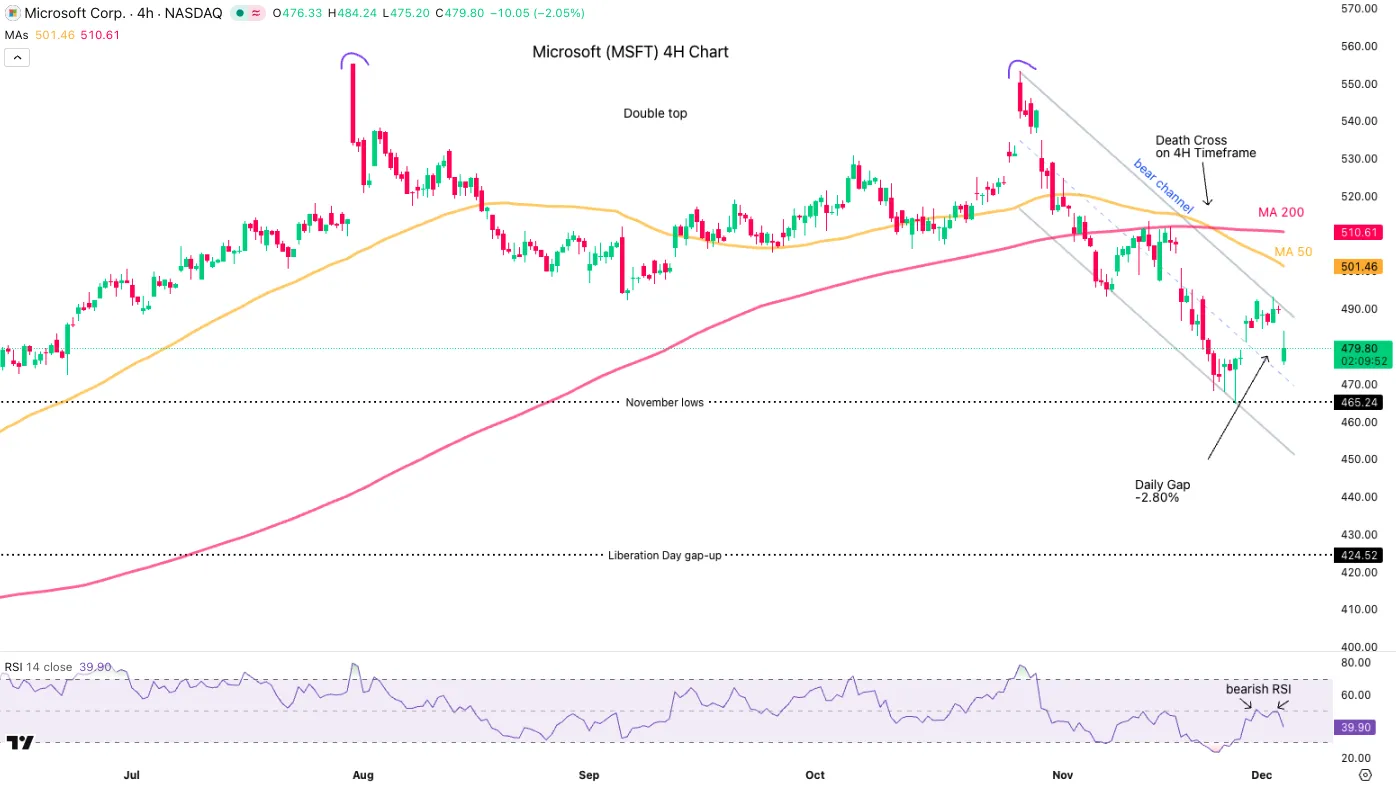
Microsoft (MSFT) 4H Chart, December 3, 2025 – Source: TradingView
This puts the AI-Peak conversations right back on the table.
The Nasdaq is getting dragged lower by this headline and is the only US index down on the current session, diverging sharply from a booming Dow Jones and Russell 2000. Rate cuts don't seem to be enough to offset such specific pessimistic news for the tech sector.
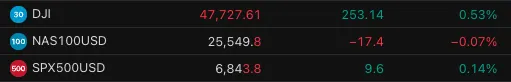
Mid-session Index performance (11:21 A.M) – Nasdaq lower. Source: TradingView
Let's dive into a multi-timeframe analysis of the Tech-heavy index as the divergence persists.
Nasdaq Multi-Timeframe Technical Analysis
Daily Chart
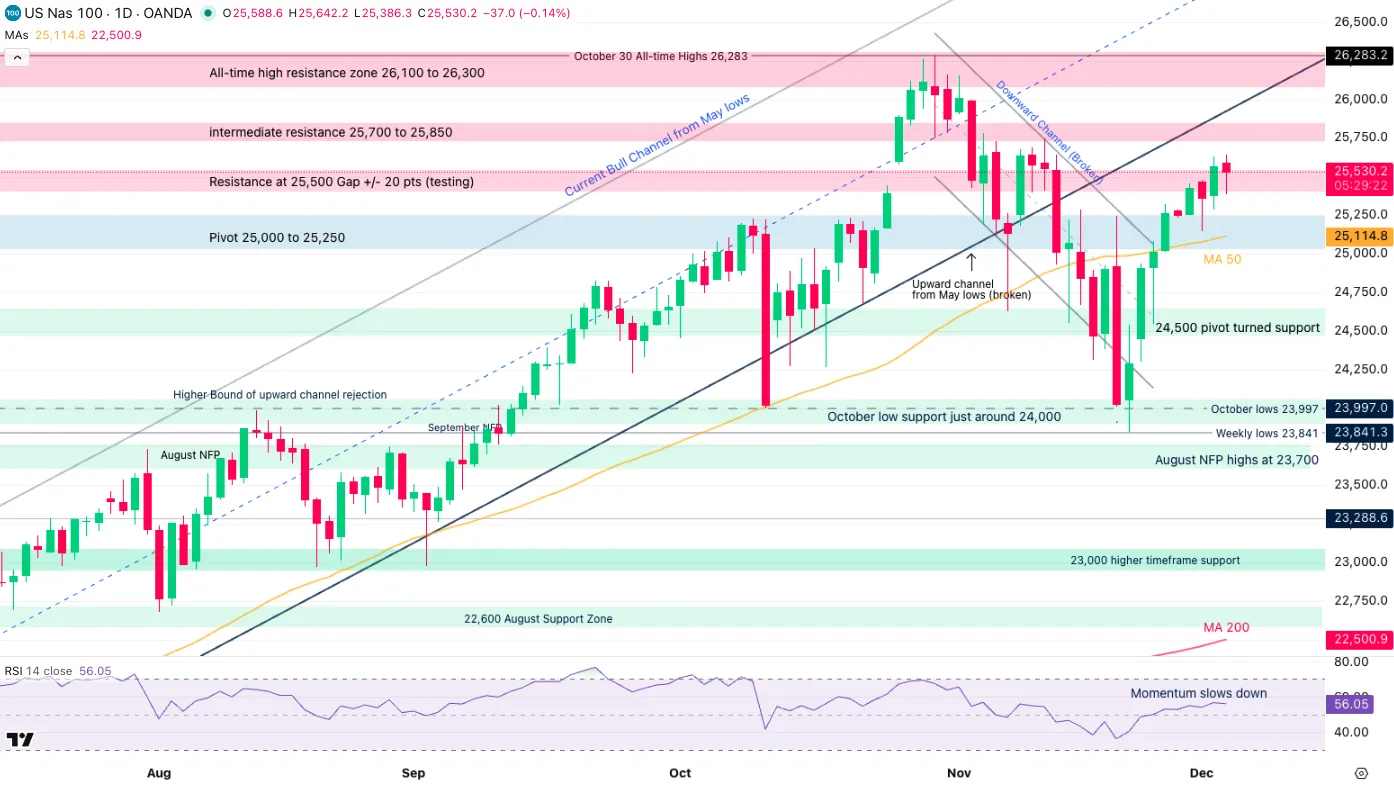
Nasdaq (CFD) Daily Chart, December 3, 2025 – Source: TradingView
The Index has rebounded remarkably from its November lows (23,841) and now trades about 7.40% higher.
An ongoing dip-buying attempts are trying to lift the Index but is getting rejected.
The price action remains above the higher timeframe pivot (25,000 Level) giving bulls the upper hand, particularly after breaking out of the November bear Channel.
If the session doesn't close green, some profit-taking flows can easily take place.
Let's see why on shorter timeframes.
4H Timeframe and Technical Levels
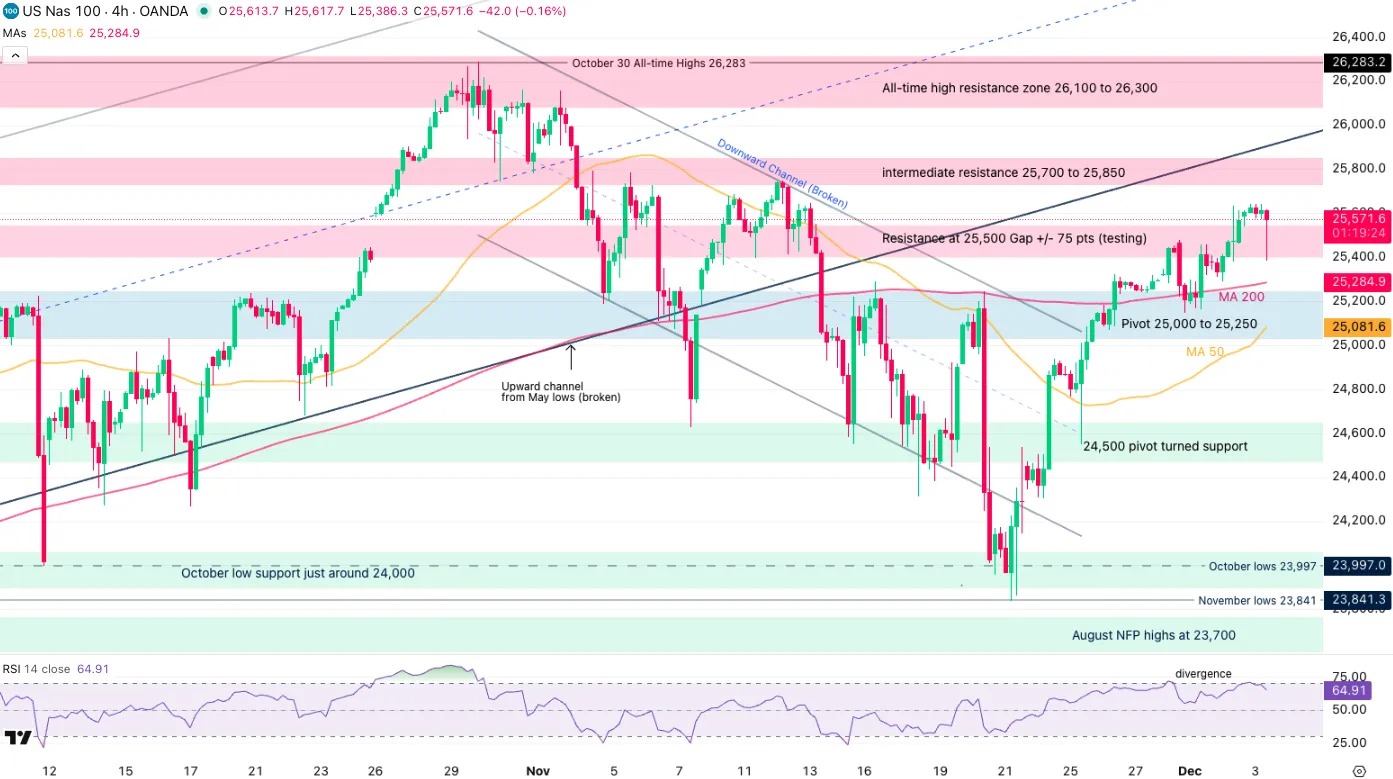
Nasdaq (CFD) 4H Chart, December 3, 2025 – Source: TradingView
Mean-reversion buyers are stepping in as we near the London Fix.
An attempt to break out of the Intermediate 25,000 (+/- 75 pts) Resistance is preventing the spreading of bearish flows as Microsoft attempts to correct the story that shook the Market at the open.
Still, the bearish candle from this morning may form the beginning of a bearish intraday divergence which will need to be tracked closely as Traders await Friday's Core PCE report and next Wednesday's FOMC.
Nasdaq technical levels of interest:
Resistance Levels
- Resistance at 25,500 Gap +/- 75 pts (testing)
- Intermediate resistance and 4H MA 50 25,700 to 25,850
- All-time high resistance zone 26,100 to 26,300
- October 30 All-time Highs 26,283
Support Levels
- Pivot 25,000 to 25,250 (4H MA 50 and 200)
- 24,500 Main Support
- November lows 23,841
- Early 2025 ATH at 22,000 to 22,229 Support
1H Chart
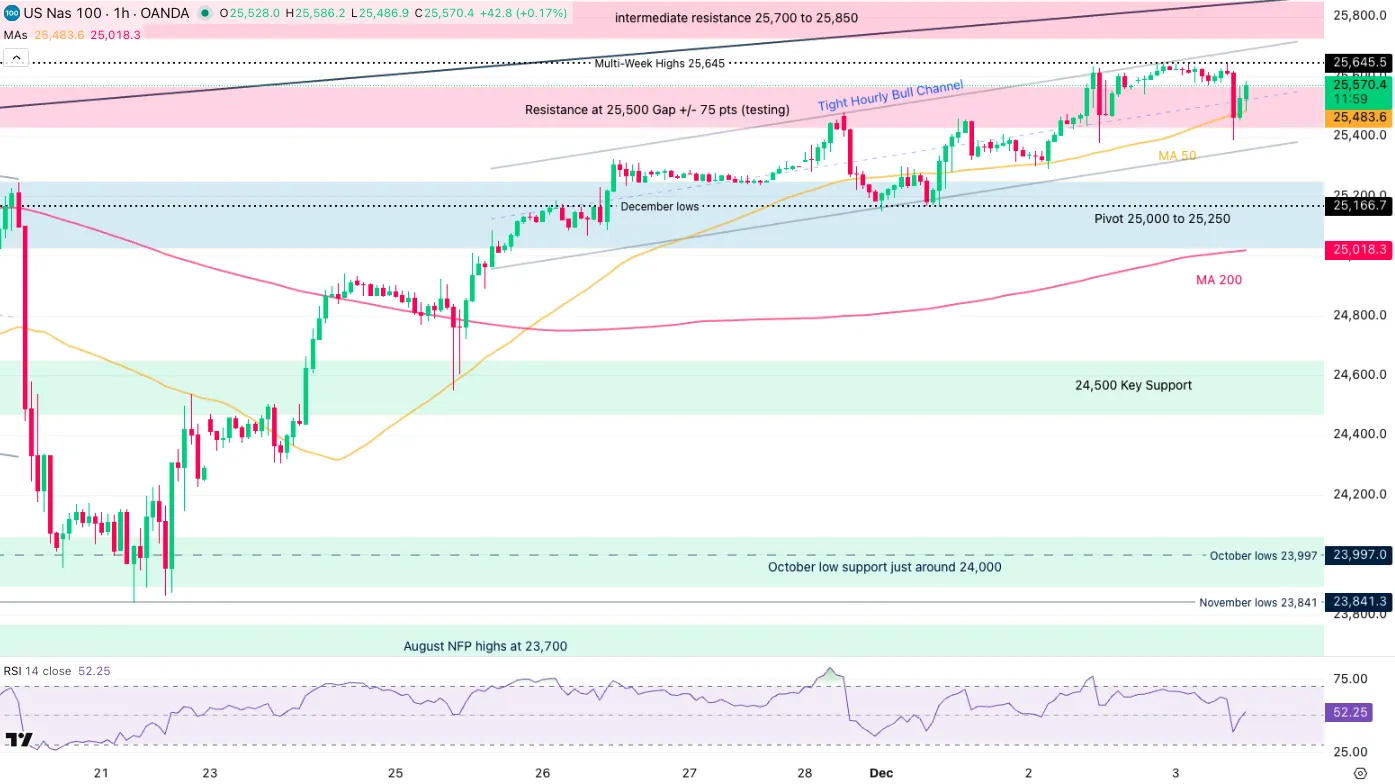
Nasdaq (CFD) 1H Chart, December 3, 2025 – Source: TradingView
The 1H Timeframe depicts a short-timeframe Hourly Bull Channel which acted as a trigger for the ongoing bullish rebound leaving buyers in control.
Still, they will have to break the overnight futures Highs (25,645) if they want to re-integrate the broken May upwards Channel.
For Bears, look for a close below 25,350 which should coincide with a Channel break.
The Hourly Channel is the technical indicator to keep your eyes on for intraday trading.
Safe Trades!
US: ISM Services Survey Shows Expansion Continued in November
The ISM Services index was roughly unchanged in November, increasing from 52.4 to 52.6 in November. The number of industries reporting growth last month increased to 12 out of 18, compared to 11 in the month prior.
Looking under the hood, the stability of the headline measure masks some shifts. The supplies delivery index showed slower performance in November, for the 12th consecutive month, and new orders gave back some of October's improvement.
On the flip side, the backlog of orders increased to 49.1 in November from 40.8 in October, putting it above its September level. This index has been volatile for the last several months. The imports index also increased, albeit remaining in contractionary territory, to 48.9 in November from 43.7 in October.
As was the case in October, the employment and new export orders indexes both improved, but remain in contractionary territory. The prices index declined by 4.6 points to 65.4, indicating that price pressures are still prevalent.
Key Implications
Respondents continue to point to disruptions in their operations from both tariffs and the government shutdown, though the end of the government shutdown is also bringing a lift for some. One survey respondent commented that uncertainty on how to source supplies is as high as it was during the pandemic, underscoring the challenge some industries face from tariffs.
While the ISM Services report has shown some volatility over the last several months, most of the sub-indexes that had turned lower in prior months are now showing signs that they may be turning the corner. The employment sub-index has continued its slow march towards expansionary territory but has not quite reached it yet. But perhaps the most significant development in this report is the decline in the prices index, which could help give the Federal Reserve some confidence that price pressures remain manageable. It seems competition is a factor as respondents expect to see margins decline to compete for business, which would lead to lower price increases.
GBP/USD: Cable Surges on Disappointing US ADP Data
Cable hit fresh five-week high on Wednesday after being initially boosted by better than expected UK Nov services PMI, while unexpected and strong drop in US private payrolls (ADP report) added to expectations of Fed December rate cut additionally inflated sterling.
The pair was up around 0.8%, on track for the biggest daily gain since late June.
Fresh rally broke through 1.3295 resistance (Fibo 61.8% of 1.3471/1.3009 / 55DMA) and cracked 200DMA (1.3319), nearing another significant barrier provided by the base of falling daily Ichimoku cloud.
Bulls may take a breather, due to significance of these resistances, but expected to keep bullish bias, due to positive fundamentals and improved technical picture on daily chart, as today’s acceleration broke above upper boundary of near-term bull-channel, while positive momentum continues to strengthen and daily Tenkan/Kijun-sen formed a bull cross.
Daily close above broken resistance at 1.3295 to validate fresh bullish signal, with potential dips to ideally hold above broken bull-channel upper boundary line (1.3263) and provide better buying levels.
Penetration of falling daily cloud to further strengthen bullish near-term structure for attack at 1.3360/70 zone (Fibo 76.4% / tops of Oct 24/28) and unmask cloud top (1.3432).
Res: 1.3370;; 1.3400; 1.3432; 1.3471
Sup: 1.3295; 1.3263; 1.3240; 1.3198
Gold (XAU/USD) Price Reclaims $4200/oz Handle. Are Bulls Ready for a Test of $4300/oz?
Gold prices are currently on a bullish rally having experienced a significant pullback and support test on Tuesday. The precious metal appears to have regained its shine as bulls returned to the party pushing prices to a high of $4240/oz in the early part of the US session.
The Federal Reserve
The current rally and supporting Gold’s valuation is the aggressive market expectation of impending monetary policy easing by the US Federal Reserve. Current forecasts indicate an 88% probability of a US interest rate cut in December, with broader market consensus pricing in approximately 90 basis points of easing by the end of 2026.
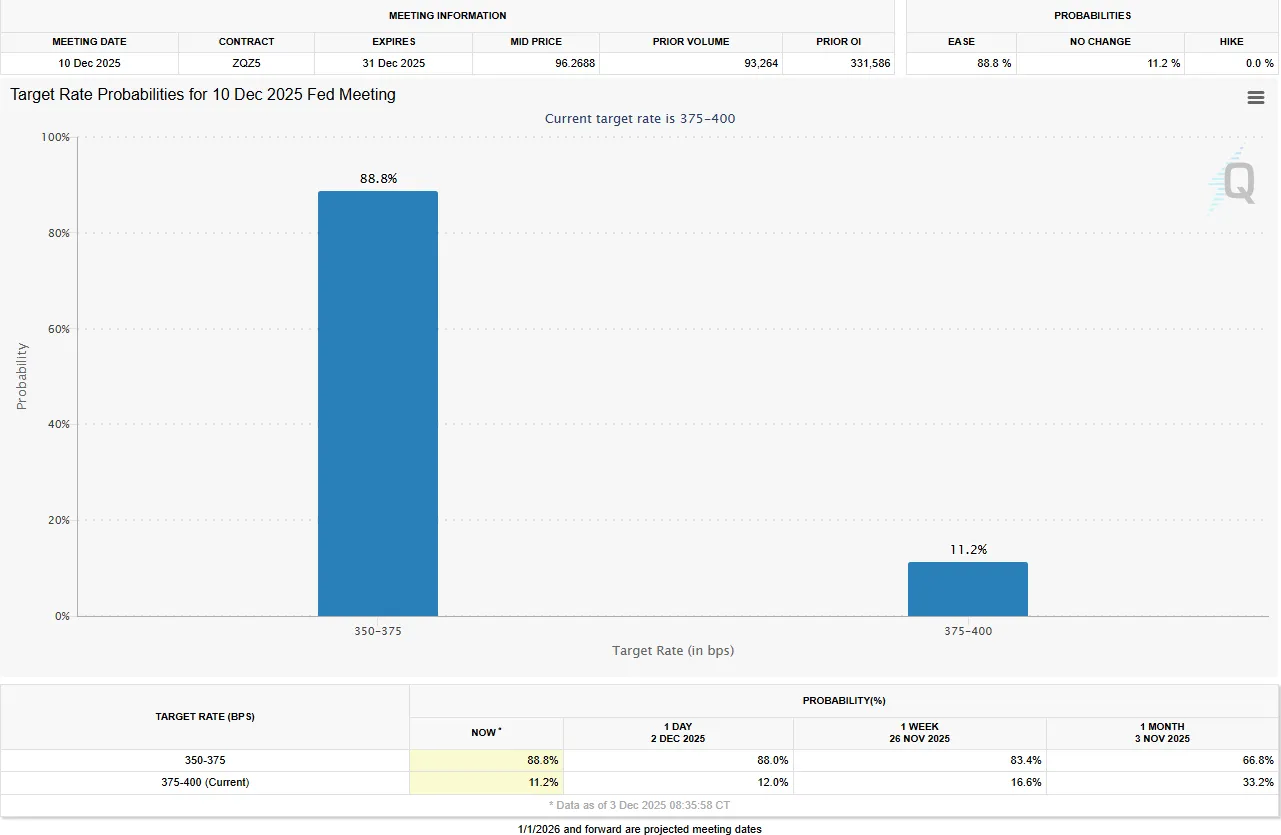
Source: CME FedWatch Tool
Market participants are expecting the FED to start cutting rates despite mixed rhetoric. The expectations do keep the US Dollar (USD) under broad pressure and force US Treasury yields to drift lower.
US data continues to show subtle signs of weakness which further supports the rate cut narrative. US Manufacturing PMI data released this week showed that the ISM Manufacturing PMI dropped to 48.2%, marking the ninth straight month below 50.which is contractionary territory.
In addition, the pace of new customer orders is slowing down, and the number of people employed continues to shrink. Although the upward pressure on prices (inflation) is easing, the overall economic trends are still worrying. These underlying numbers suggest that the risk of an economic downturn, or recession, is increasing. This growing recession risk is good news for precious metals like gold and silver, as it supports the case for their price to rise significantly over the long term (a long-term bullish case).
There is also the case of the next Federal Reserve policymaker and comments by US officials around the Federal Reserve.The more comments we hear from members of the Trump administration regarding the Fed, the more likely market participants are to question the Fed's independence. This is another factor which could continue to support Gold prices in the short and medium term.
US PCE Data and Geopolitical Risk
We now know we will not receive any more official reports on job creation or consumer prices before the Federal Reserve's important policy meeting on December 10th. However, the Fed's preferred measure of inflation, called the PCE data, is scheduled to be released later this week.
Recent reports on consumer and producer prices (the CPI and PPI reports) showed softer-than-expected inflation. This suggests that the impact of government tariffs on overall price increases has been minimal that they are making a lot of noise but not actually causing prices to spike (more bark than bite). Therefore, analysts expect this week's core PCE deflator (the official inflation gauge the Fed watches most closely) for September to also reflect this trend of lower, easing inflation.
For all market-moving economic releases and events, see the MarketPulse Economic Calendar. (click to enlarge)
Geopolitical risk remains an area of focus as the Trump administration seems dead set on confrontation and a potential regime change in Venezuela. Irrespective of whether market participants agree with such a move or not is irrelevant but what is relevant is the risks this poses.
Such risks usually have a tendency to lead to an increase in safe haven demand. Thus Gold prices could be a huge beneficiary if the US decides to mount a direct attack on Venezuela and is worth monitoring.
Technical Outlook - Gold (XAU/USD)
Looking at the four-hour chart below, the technical picture is strong.
Price action looks favorable with a trendline retest yesterday before a bullish continuation reinforcing the narrative for bullish price action moving forward.
The period-14 RSI also shows signs that momentum remains bullish. A test of the 50 level also occurred yesterday with the RSI bouncing off this level, another sign of bullish momentum remaining in play.
The next move for the precious metal will be an intriguing one.
A four-hour candle close above the $4228/oz handle is needed if bulls are to push on. A rejection here could lead to another trendline test and bring the 50 and 100-day MAs into focus which rest at 4166 and 4136 respectively.
Gold (XAU/USD) Four-Hour Chart, December 3, 2025
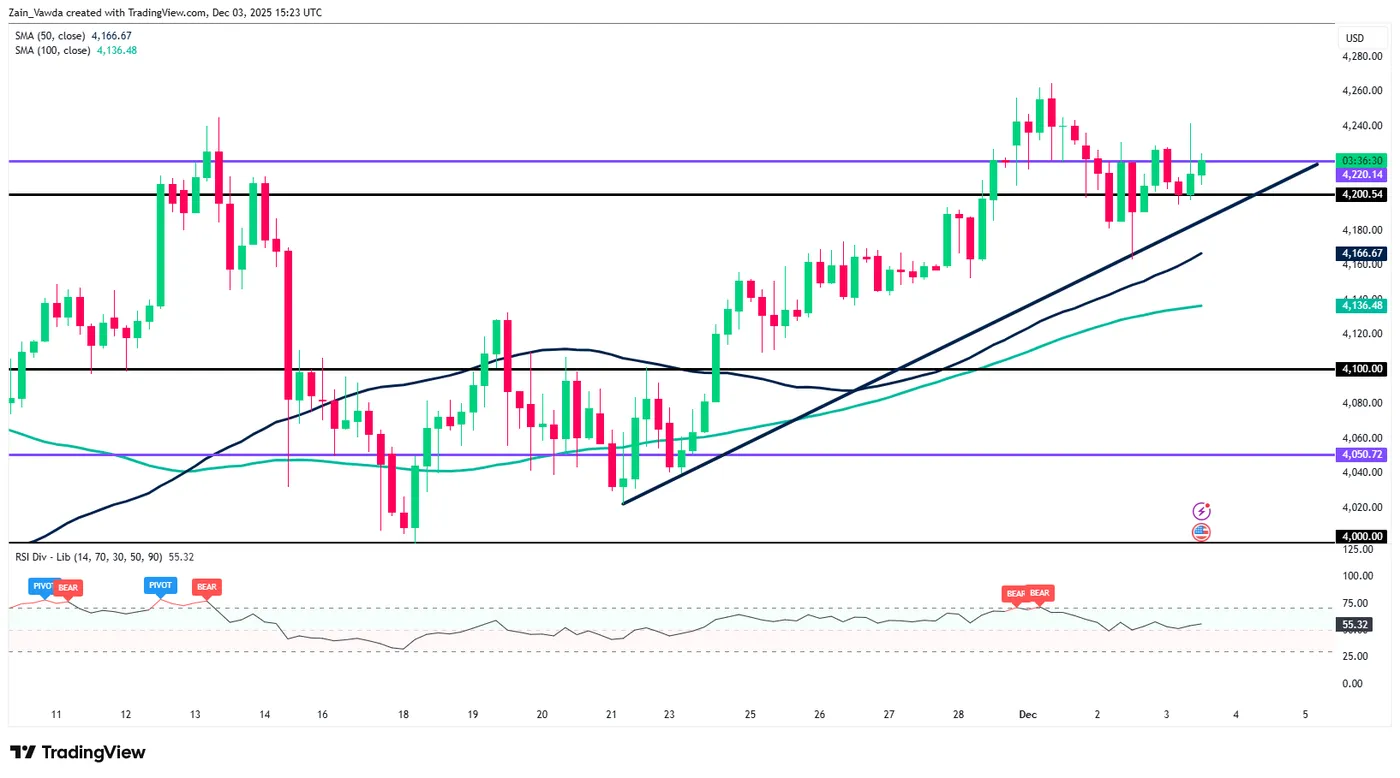
Source: TradingView (click to enlarge)
Client Sentiment Data - XAU/USD
Looking at OANDA client sentiment data and market participants are Long on Gold with 74% of traders net-long. I prefer to take a contrarian view toward crowd sentiment and thus the fact that the majority of traders are net-long suggests that Gold prices could continue to slide in the near-term.
GBP/USD Reaches 1.33, on Top as ADP Employment Miss Sends Dollar in a Limbo
The week had started slowly in FX markets, characterized by mean-reverting, small up-and-down movements across all currencies as traders got back from their Thanksgiving break and awaited fresh data.
The US Dollar was holding its range calmly, bouncing yesterday, but the landscape shifted dramatically today.
The fresh monthly ADP Private Employment data delivered a shocker to the Market showing a contraction of -32,000 jobs (vs +10,000 gain exp).
This reading only anchors the rate cut expectations for next Wednesday's FOMC meeting (December 10th), effectively locking in the decision.
With US Yields diving lower on the news, traders are now starting to aggressively price in further cuts for later meetings in 2026 – the following will be on January 28th, as the debate over December becomes clear—the focus has shifted to how deep the recessionary cracks might be if US rates stay high.
These dynamics have taken Sterling (GBP) to the top of the majors, sitting at the other extreme of the Greenback. But why is the GBP performing so well?
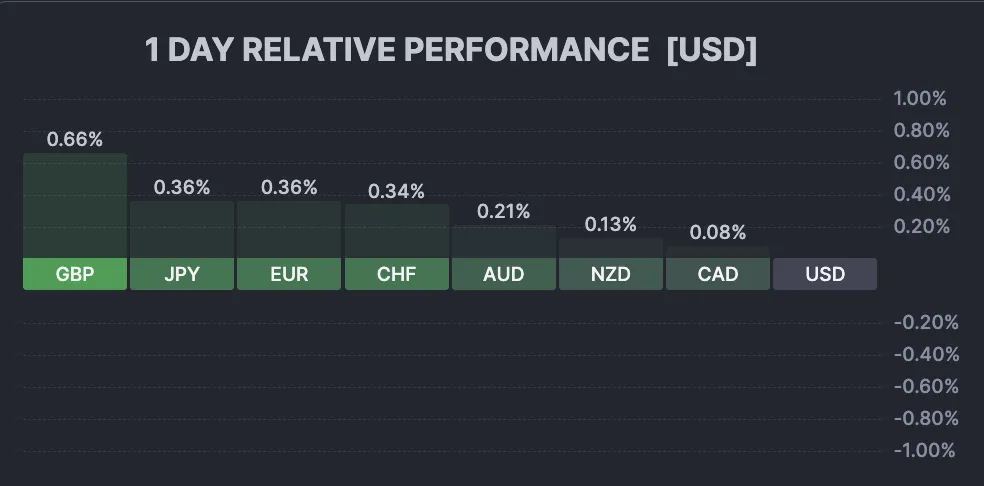
Daily FX currency performance (9:08 A.M) – Source: Finviz
Beyond the Dollar weakness, the Pound is enjoying its own tailwinds.
The recently announced trade deal with the US regarding 0 tariffs on pharmaceuticals—which exempts UK exports from tariffs in exchange for pricing adjustments—has provided a massive boost to GBP/USD.
This comes as a relief for the Pound after the pair had dropped considerably throughout October, coming close to breaching the 1.30 level. Furthermore, the recent UK Budget had already restored some confidence in government spending, a sentiment exacerbated by Bank of England rates, which are now priced to remain the highest among OECD nations as inflation remains stickier than elsewhere.
Enough talk, let's dive right into a multi-timeframe analysis of GBP/USD to spot where things could head towards for this Major FX pair.
GBP/USD Multi-timeframe Technical Analysis
Daily Chart
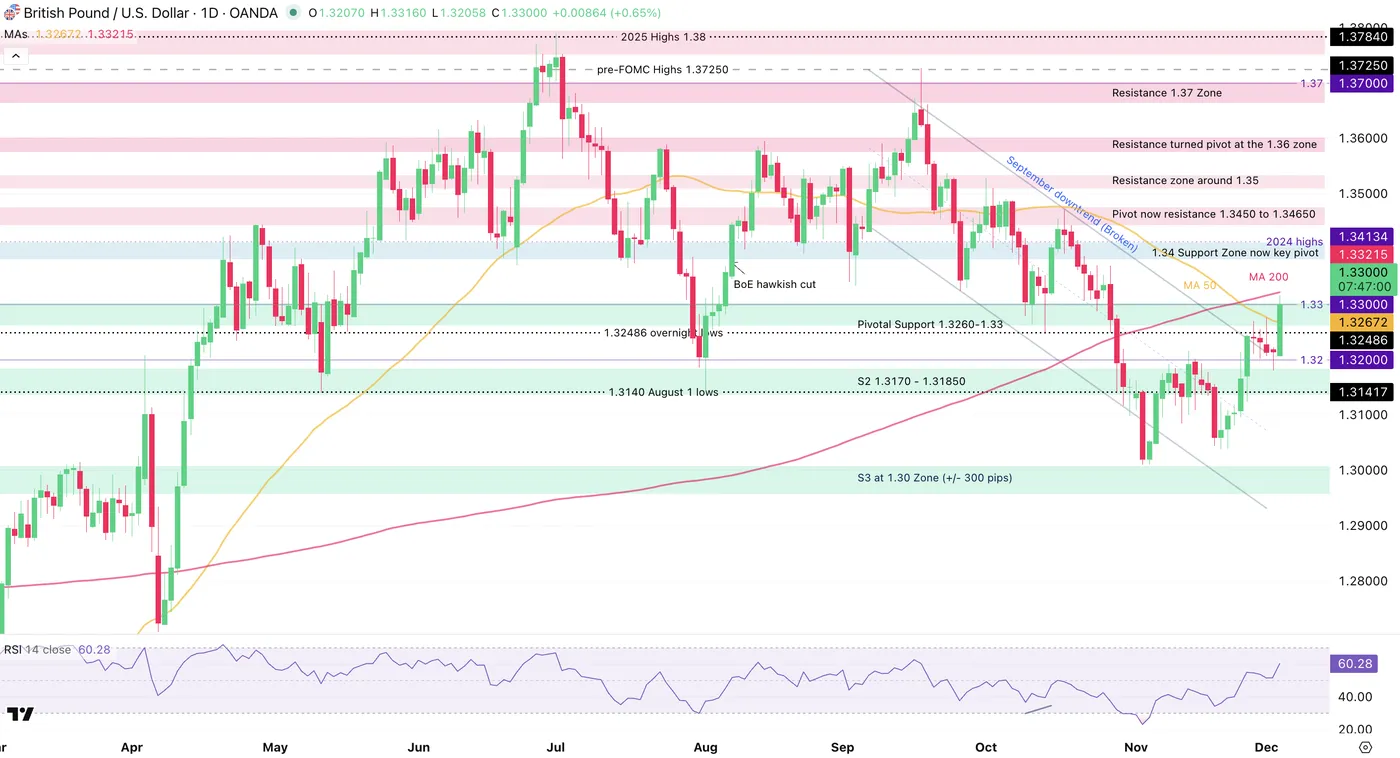
GBP/USD Daily Chart. December 3, 2025 – Source: TradingView
Cable has now rallied 2.20% from its November lows (1.30130) and reaching the 1.33 psychological level.
Last month's trading was cataclysmic for Sterling, stuck in a downward trend but after its trough in early November, a following higher low as dovish bets raced back for the Fed was enough fuel to propel the currency higher to a breakout of its September descending Channel.
However, some crosscurrents are facing buyers:
The 200-Day Moving Average is acting as immediate resistance (Daily Highs at 1.33215)
The 50-Day MA recently posted a death cross (crossing below the 200-Day MA).
A close above the 200-MA should be enough to invalidate the mean-reverting elements with the next resistance being 1,000 pips higher to 1.34.
4H Chart and Technical Levels
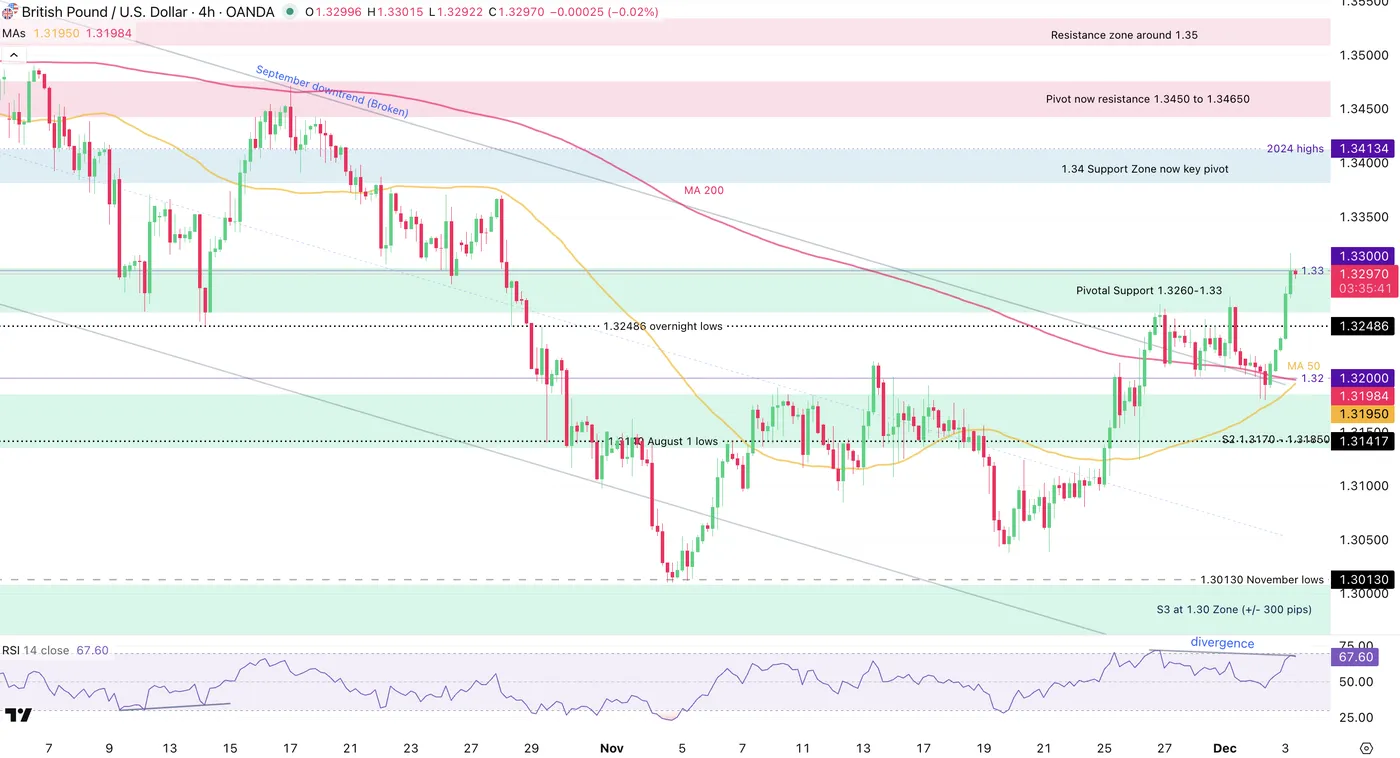
GBP/USD 4H Chart. December 3, 2025 – Source: TradingView
Conflicting signs arise on intraday charts: a break-retest of the channel points to buyer strength toward higher levels, supported by a bullish 50-200 MA Cross on the 4H timeframe.
On the other hand, a 4H bearish divergence is forming a could slow down the action.
After marking the technical levels, let's check out the shorter timeframe to spot a potential gameplan.
Levels to watch for the GBPUSD:
Resistance Levels
- Daily highs and 200-Day MA 1.3320
- 1.34 Key Pivot
- Resistance 1.3450 to 1.34650
- Resistance at the 1.36 zone
- Key Pivot Zone: 1.3450 to 1.3650
Support Levels
- Pivotal Support 1.3260-1.33 (Immediate test)
- 1.32 4H MA 50 and 200
- S2 1.3170 - 1.31850
- S3 at 1.30 Zone (+/- 300 pips)
1H Chart
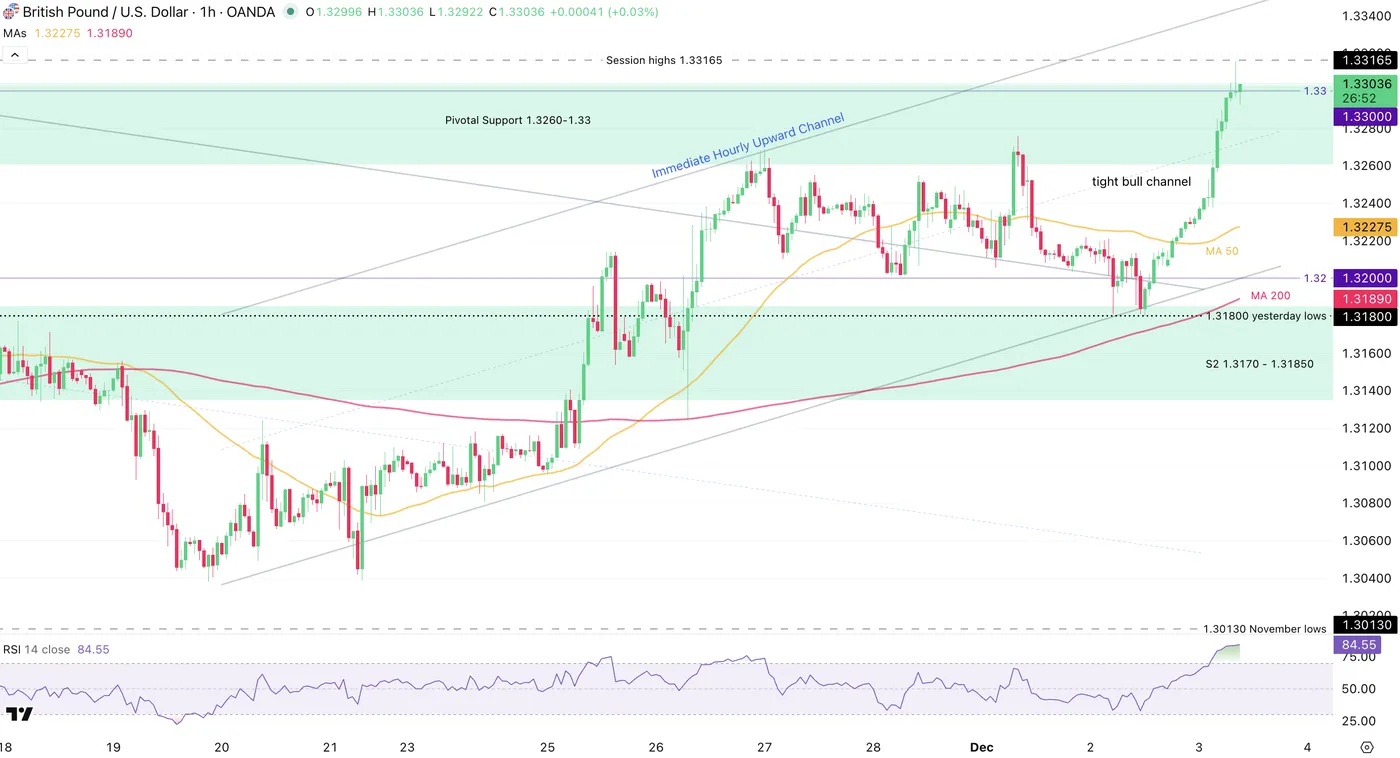
GBP/USD 1H Chart. December 3, 2025 – Source: TradingView
Buyers have taken control of the action with the ongoing tight bull channel action across intraday timeframes, with the entire short-term trend evolving within a fresh upward hourly channel.
Any retracement may hint at a test of the 1.3260 Support lows while a break above the 200-Day MA (1.3320) would purse the current buyer strength.
Safe Trades!
Sunset Market Commentary
Markets
EUR/USD is heading for an eighth consecutive daily trading gain. Unlike the minor improvements of the previous days, today’s move is worth the while. The pair is currently changing hands around 1.166 from a start at 1.1625 and testing first minor resistance at 1.1656 (November top). Modestly positive risk sentiment initially supported the move but dwindled as the US session developed. The US delegation is still in Russia to discuss the Ukrainian peace plan. The Kremlin said today that it wants to follow the silence principle as part of the talks, but also that it’s wrong to say that it rejected the plan all together. On a European level, the European Commission is preparing Trump-like tactics to assemble a €210b reparation loan for Ukraine, backed by immobilized Russian state assets. They look at invoking Article 122 of EU treaties which is an emergency legal basis for granting financial assistance on which the European Council can decide by qualified majority voting, sidestepping vetoes from for example Hungary or Belgium, and where European parliament is only informed and not a co-legislator. The commission also wants to extend the rollover period for sanctions from six months to three years to reduce the risk that assets would have to be transferred back to Russia if sanctions lapse. Apart from the constructive interpretation of these geopolitical developments, a cyclical element played as well in today’s EUR/USD move. The dollar lost interest rate support after the November ADP employment report showed 32k in job losses while consensus expected a small, 10k, gain. Since the month of June (-23k), ADP only reported job gains in the months of July and October with today’s print being the 2nd worse since June 2020. Companies with fewer than 50 employees shed 120k jobs, the largest one-month decline since May 2020. Wage growth cooled, with workers who changed jobs seeing a 6.3% increase in pay, the lowest since February 2021. The ADP report is only one of few up-to-date reports as US government agencies are still working their way through the shutdown delay. Official November payrolls and inflation reports will only be released after the December FOMC gathering. It’s nevertheless becoming clear that downside employment risks are gradually taking the upper hand, starting to build the case for more Fed rate cuts in Q1 2026 as well. Daily changes on the US yield curve range between -3 bps (5-yr) and -1.5 bp (30-yr) today. German yields only lose maximum 1 bp today. Sterling is slightly better bid (EUR/GBP 0.8770 from 0.8795) in a move that already started ahead of the upward revision to November PMI’s (composite 51.2 instead of 50.5).
News & Views
Swiss inflation fell by a more-than-expected 0.2% m/m in November. That dragged the annual figure from 0.1% to the zero bound of the Swiss National Bank’s 0-2% target range. The shrinking price level was a result of lower prices for hotel and international package holidays as well as new cars and fruiting vegetables, the statistical office’s press statement reads. Higher housing rental, heating oil and air transport inflation prevented an even lower outcome. Core inflation, 0.4% y/y, came in at the weakest since August 2021. The numbers make the SNB’s projected 0.4% average inflation for Q4 look infeasible, in theory supporting further monetary support. But policymakers have in the past said that the bar for further rate cuts is high, because that would bring it back to the era of negative rates which comes with all sorts of negative side effects. SNB officials have also stressed that brief periods of sub-zero inflation isn’t a problem as such. The SNB meets December 11 and money markets do not expect a move then (or later in 2026). The Swiss franc trades stoic around EUR/CHF 0.933.
The Indian rupee broke below the symbolically important 90 barrier against the USD today. The new record low for Asia’s worst performing currency was considered all but inevitable. Sentiment vs INR deteriorated sharply in recent weeks, amongst others due to the absence of a trade deal with the US. Negotiations are dragging and meanwhile a punitive 50% US import levy is smothering Indian exports. Combined with strong imports it’s pushing India’s trade deficit to a record high of >$40 bn in October, resulting in high dollar demand. The weak currency contrasts with India’s otherwise strong domestic economy (8.2% y/y in Q3). The absence of strong central bank intervention in addition is inviting speculative bets. The Reserve Bank of India meets this Friday. Consensus assumes a rate cut to 5.25% from 5.5% amid record low inflation but given recent INR weakness it may be a closer call than it appears.
US ISM services edges higher to 52.6; prices ease sharply
US ISM Services PMI ticked up to 52.6 in November from 52.4, beating expectations of 52.0 and marking the ninth expansionary reading of 2025. Business activity improved slightly from 54.3 to 54.5, but new orders dropped sharply from 56.2 to 52.6, signaling cooling demand. Employment also improved modestly, rising from 48.2 to 48.9, though it remained in contraction.
The most notable development came from the prices index, which fell from 70.0 to 65.4, the lowest level since April. While still elevated, the decline suggests that inflation pressures in the services sector—an area closely watched by the Fed—are easing. Together with weakening order growth, the data add to a picture of gradual cooling beneath the surface.
According to the ISM, November’s reading corresponds to an annualized 1.3% increase in real GDP, indicating that the services sector is still contributing positively to overall activity. However, the combination of softer new orders and easing prices reinforces expectations of slower momentum into year-end.
GBP/USD Mid-Day Outlook
Daily Pivots: (S1) 1.3188; (P) 1.3205; (R1) 1.3231; More...
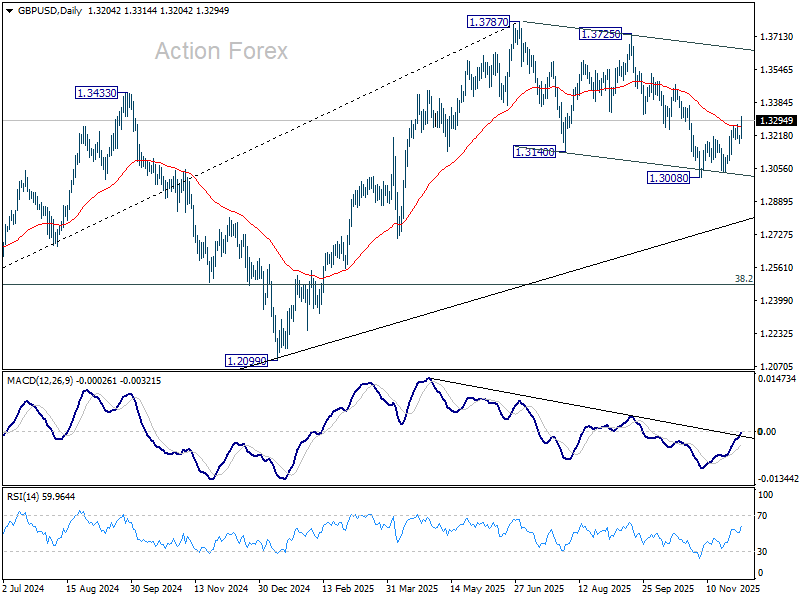
Intraday bias in GBP/USD is back on the upside as rebound from 1.3008 resumes. The break of 55 D EMA (now at 1.3263) suggests that fall from 1.3787 has completed as a correction. Further rise should be seen to 1.3470 resistance first. Break there will target 1.3725/3787 resistance zone. For now, risk will stay on the upside as long as 1.3718 support holds, in case of retreat.
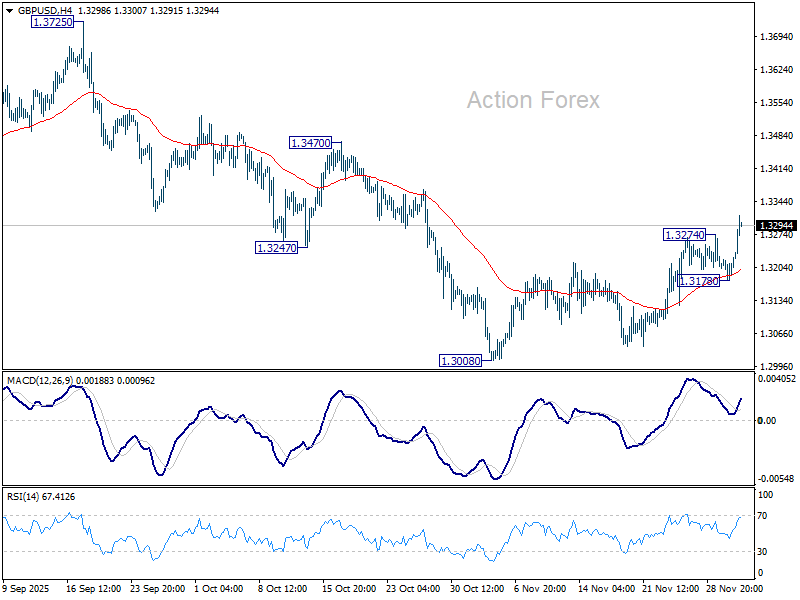
In the bigger picture, the break of 55 W EMA (now at 1.3184) is taken as the first sign that corrective rise from 1.0351 (2022 low) has completed. Decisive break of trend line support (now at 1.2760) will solidify this case and target 38.2% retracement of 1.0351 to 1.3787 at 1.2474 next. Meanwhile, in case of another rise, strong resistance should emerge below 1.4248 (2021 high) to cap upside to preserve the long term down trend.
USD/CHF Mid-Day Outlook
Daily Pivots: (S1) 0.8020; (P) 0.8036; (R1) 0.8046; More…
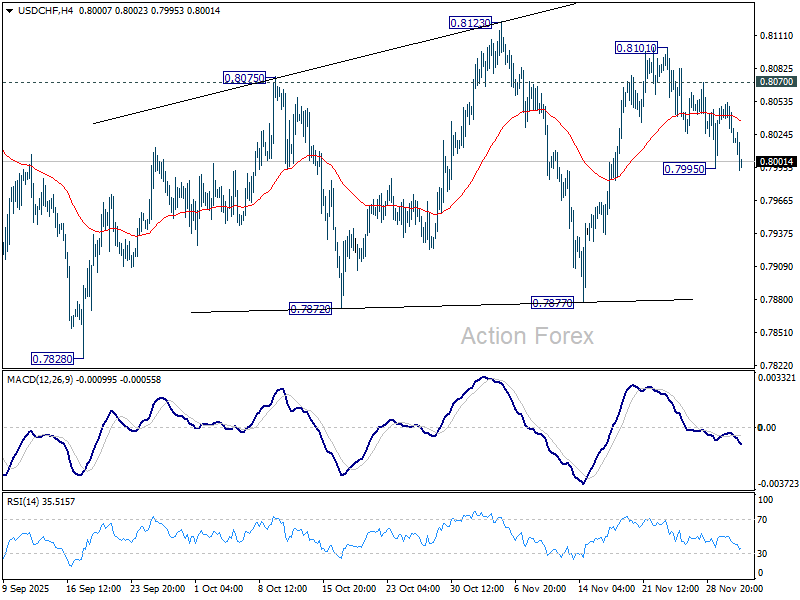
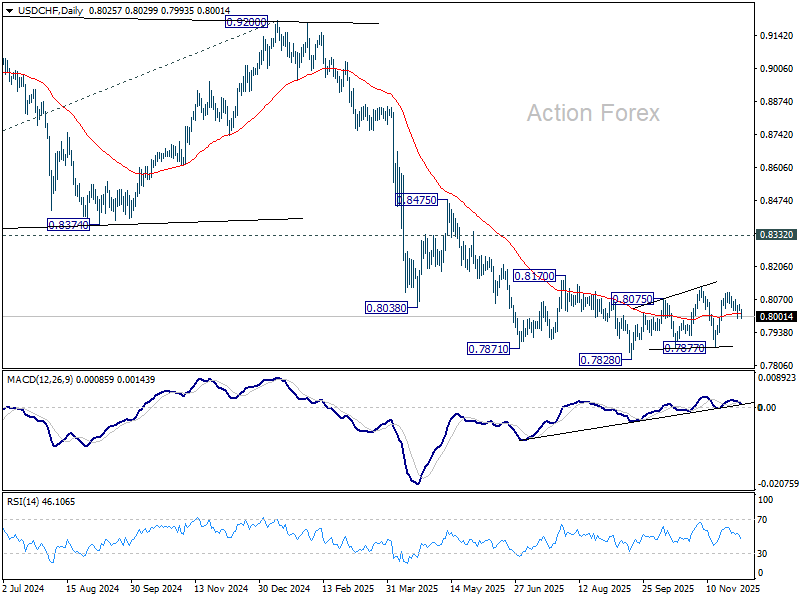
Intraday bias in USD/CHF stays neutral first. Outlook is unchanged that price actions from 0.7828 low is seen as a corrective pattern. On the upside, above 0.8070 will indicate that pattern is still extending, and turn bias back to the upside for 0.8123 and above. On the downside, below 0.7995 will bring deeper fall back towards 0.7877 support.
In the bigger picture, long term down trend from 1.0342 (2017 high) is still in progress. Next target is 100% projection of 1.0146 (2022 high) to 0.8332 from 0.9200 at 0.7382. In any case, outlook will stay bearish as long as 0.8332 support turned resistance holds (2023 low).
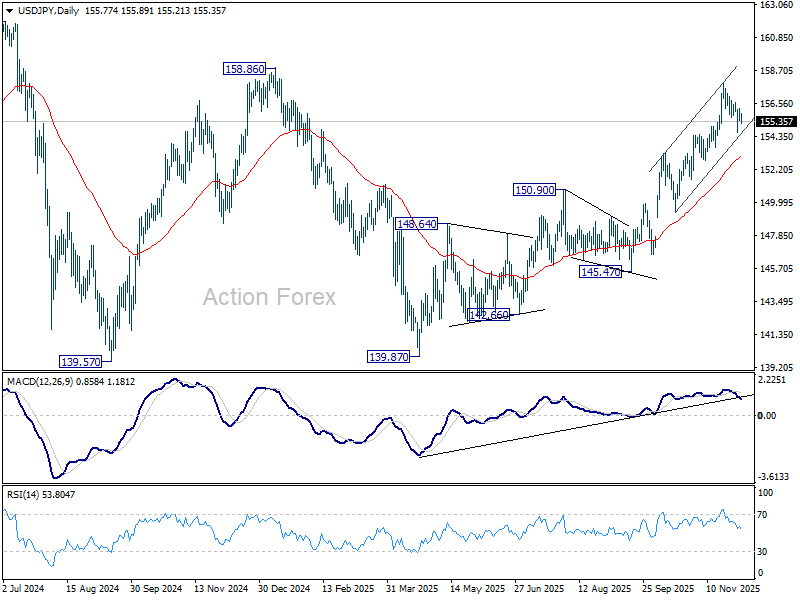
USD/JPY Daily Outlook
Daily Pivots: (S1) 155.47; (P) 155.83; (R1) 156.22; More...
Outlook in USD/JPY remains unchanged and intraday bias stays neutral. With near term rising channel floor intact, further rally is expected. Above 156.57 minor resistance will bring retest of 157.88. Further break there will resume the whole rally from 139.87. Next target is 158.86 structural resistance, and then 161.94 high. However, sustained break of the channel support will bring deeper correction to 55 D EMA (now at 153.06), and raise the chance of near term trend reversal.
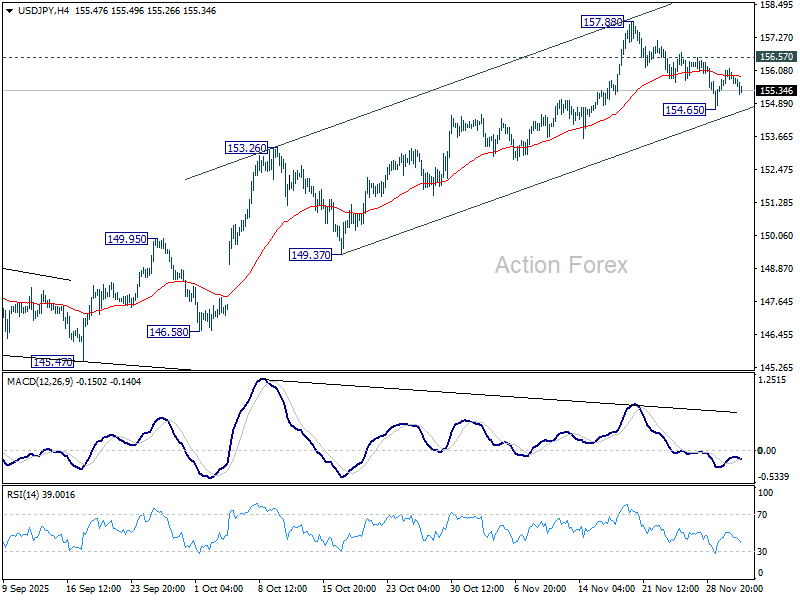
In the bigger picture, current development suggests that corrective pattern from 161.94 (2024 high) has completed with three waves at 139.87. Larger up trend from 102.58 (2021 low) could be ready to resume through 161.94 high. Decisive break of 158.85 structural resistance will solidify this bullish case and target 161.94 for confirmation. On the downside, break of 150.90 resistance turned support will dampen this bullish view and extend the corrective range pattern with another falling leg.