Sample Category Title
US Employment Drops in November, Fed Rate Cut Expectations Rise
In focus today
In the US, the Challenger report of November layoff and hiring announcements is due for release in the afternoon. While not usually a tier-1 market mover, it is one of the few timely data points on labour markets that will be available for the Fed before next week's meeting due to the delays caused by the government shutdown.
In Sweden, the preliminary inflation figures for November are released today. Our forecast is CPIF excluding energy at 2.8%, CPIF at 2.8%, and CPI at 0.8%. The monthly change in core inflation from October to November is estimated at -0.19, primarily attributed to Black Friday sales. Higher prices for electricity and petrol are expected to result in a monthly increase in CPIF of 0.25%.
Economic and market news
What happened overnight
In Japan, Bank of Japan Governor Kazuo Ueda flagged uncertainty about how far rates can be raised due to the difficulty of estimating the country's neutral interest rate, which is currently projected between 1% and 2.5%. Ueda also hinted at a potential rate hike to 0.75% later this month as the central bank evaluates the "pros and cons" of tightening monetary policy.
In China, government advisers expect Beijing to stick to its 5% GDP growth target for 2026 as policymakers seek to counter deflationary pressures, a property slump, and weak consumer demand. Fiscal and monetary stimulus, including bond issuance and subsidies, are likely to continue, while leaders aim to gradually shift towards a consumption-led economic model over the next five years.
What happened yesterday
In the US, private sector employment decreased by 32k in November, according to the ADP report (cons: +10k). The decline was driven by manufacturing job losses, while services employment remained more resilient, aligning with weaker forward-looking signals from PMI and ISM data. This supports expectations for a Fed rate cut next week, with EUR/USD ticking higher. Meanwhile, ISM services PMI rose to 52.6 in November (cons: 52.1, prev: 52.4). Positively for the Fed, the price index declined sharply, suggesting easing inflation pressures, though the PMI index sent a conflicting signal. Looking across the two surveys, it seems that service sector activity continues to grow at a decent pace.
US Secretary of Treasury Scott Bessent advocated that Federal Reserve regional bank presidents must have lived in their districts for at least three years. This is an interesting headline because it suggests the administration is preparing to get involved with the (re-)nominations of Regional Fed presidents, due in February. Regional Feds elect their own presidents, but the picks are subject to the approval of Fed governors, who are nominated by US president.
In the euro area, the final composite PMI for November was revised up to 52.8 (flash: 52.4), driven by an upward revision in services PMI to 53.6 (flash: 53.1), while manufacturing PMI was slightly lowered to 49.6 (flash: 49.7). According to the PMIs, the services sector is now growing at its fastest pace in two and a half years, highlighting resilience in the domestic economy and supporting expectations for unchanged policy rates from the ECB.
In the UK, PMIs fell to 51.2 (prior 52.2) but came in stronger than consensus expectations at 50.5. It reflected the seventh consecutive month of expansion in the UK's private sector activity, with the upside surprise sparking a strengthening of the GBP.
In Switzerland, November inflation came in lower than expected. Headline inflation dropped to 0.0% (cons: 0.1%, prior: 0.1%) and core inflation edged lower as well to 0.4% (cons: 0.5%, prior: 0.5%). The SNB is still expected to remain firmly on hold at the next meeting in December, keeping the policy rate at 0%. SNB members have reiterated that inflation below 0% would be tolerable for a short period of time. We expect the first course of action to be FX intervention before resorting to a cut into negative territory.
In Sweden, services PMI rose strongly to 59.1 in November (prev: 55.9), signalling robust growth in the sector. Business volumes saw a significant jump to 65.2 (prev: 55.3), while the employment index edged higher to 49.9 (prev: 47.8). Overall, the data adds to the recent positive signals from the Swedish economy.
In Poland, the central bank cut its main interest rate by 25bp to 4.00%, marking the sixth rate cut this year, following a sharper-than-expected drop in November inflation to 2.4% y/y (cons: 2.6%). The Monetary Policy Council highlighted risks from fiscal policy, wage dynamics, and global inflation but indicated future rate decisions would depend on incoming data.
The European Commission unveiled an "economic security doctrine" aimed at cutting over-reliance on Chinese metals and other single-source suppliers. The REsourceEU Action Plan seeks to diversify supply chains, accelerate trade measures, and prioritise support for businesses reducing foreign dependencies in critical sectors.
Equities: Equities pushed higher again yesterday, led by the US but notably not driven by mega-cap tech. Instead, gains were broad-based, with the VIX edging lower and min vol stocks underperforming. Small caps materially outperformed, marking another classic shift towards a slightly more constructive investor risk-optic. In our view, somewhat interesting given that macro data was generally solid, particularly in Europe, while the US delivered a disappointing ADP print, which remains our primary concern. In US yesterday, Dow +0.9%, S&P 500 +0.3%, Nasdaq +0.2%, Russell 2000 +1.9%. Asian equities trade higher this morning, predominantly supported by Japan on renewed expectations of a fiscal "bazooka" and a persistently accommodative global monetary backdrop ex-Japan. European equity futures are modestly firmer, whereas US futures are essentially flat.
FI and FX: GBP was the top performer during yesterday's session as final November PMIs came in a lot stronger than expected. CHF was largely unfazed by lower-than-expected November CPI. EUR/USD rose to the 1.1670 mark supported by weaker US data while EUR/SEK and EUR/NOK tracked lower during yesterday's session. US yields moved lower during yesterday's session, both in swap and Treasury space, dropping 2-3bp across the curve. In euro space, the moves were very limited with yields largely trading flat across curves and tenors.
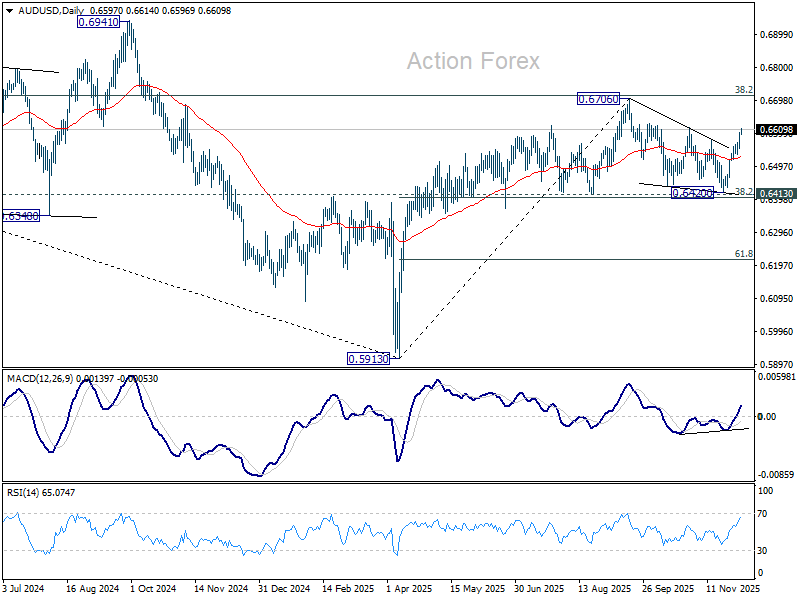
AUD/USD Daily Report
Daily Pivots: (S1) 0.6569; (P) 0.6586; (R1) 0.6619; More...
AUD/USD's rally from 0.6420 accelerates higher today and the solid break of 0.6579 resistance adds to the case that whole correction from 0.6706 has completed at 0.6420. Intraday bias stays on the upside for retesting 0.6709 and then 0.6713 key fibonacci level. For now, risk will stay on the upside as long as 0.6537 support holds, in case of retreat.
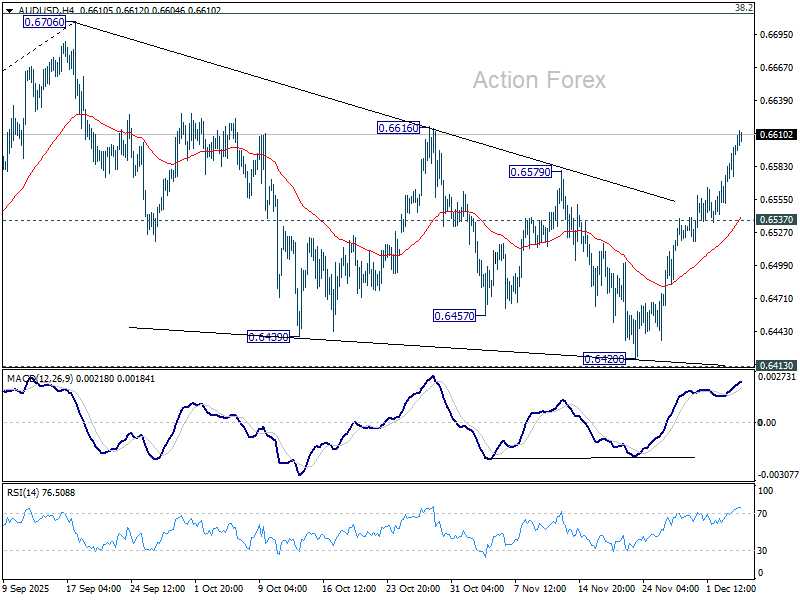
In the bigger picture, there is no clear sign that down trend from 0.8006 (2021 high) has completed. Rebound from 0.5913 is seen as a corrective move. Outlook will remain bearish as long as 38.2% retracement of 0.8006 to 0.5913 at 0.6713 holds. Break of 0.6413 support will suggest rejection by 0.6713 and solidify this bearish case. Nevertheless, considering bullish convergence condition in W MACD, sustained break of 0.6713 will be a strong sign of bullish trend reversal, and pave the way to 0.6941 structural resistance for confirmation.
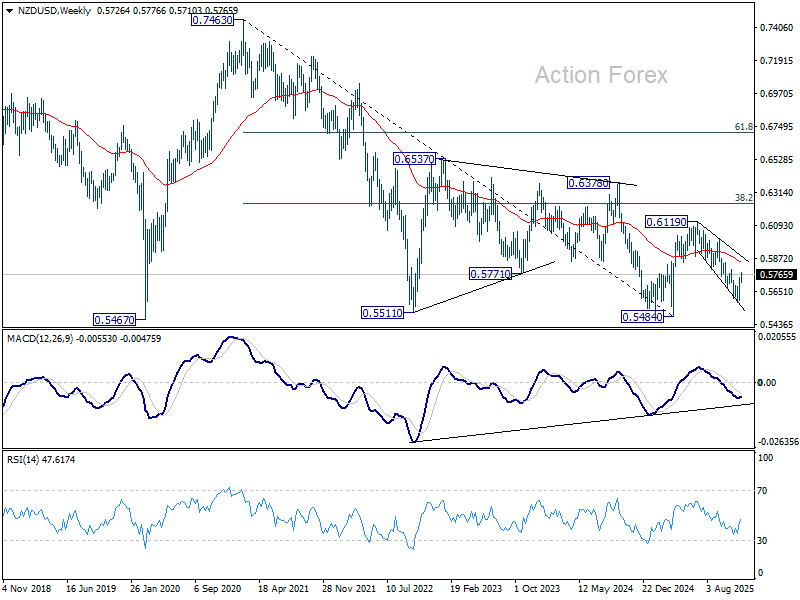
NZD/USD in bullish reversal? 0.5799 resistance holds key
NZD/USD extended its rebound from 0.5580 this week as the pair capitalized on a softer US Dollar, driven by the sharp deterioration in ADP employment data. The weak labor reading reinforced expectations of a December Fed rate cut, prompting another wave of USD selling across major pairs and giving the Kiwi room to advance. Underlying support also stems from the RBNZ’s hawkish cut last week, where policymakers signaled that the easing cycle has likely ended.
Technically, NZD/USD’s break above the 55 D EMA signals that the three-wave corrective decline from 0.6119 has likely completed at 0.5580. Momentum has clearly shifted to the upside, and the structure argues that the pair may now be in the early stages of a broader rally.
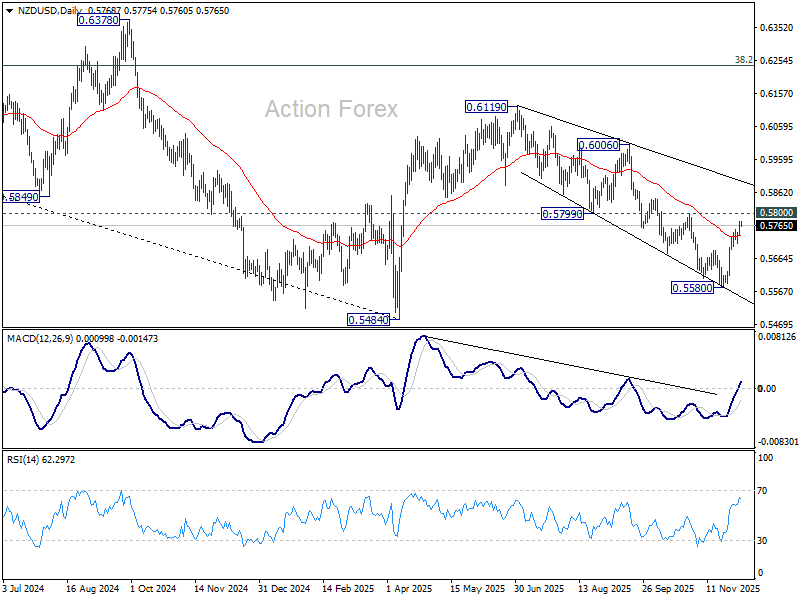
The next key hurdle is the 0.5799 support-turned-resistance. Sustained break above this level would further confirm bullish reversal and strengthen the view that the rise from 0.5580 represents the third leg of the larger pattern from 0.5484 low earlier this year.
That would also open the door through 0.6119 resistance, even if the advance from 0.5484 proves to be only a corrective rally within the broader downtrend from the 0.7463 (2021 high).
BoJ’s Ueda: Neutral rate uncertainty keeps BoJ guessing how far to tighten
BoJ Governor Kazuo Ueda told lawmakers today that Japan’s neutral interest rate remains highly uncertain, describing it as a concept that can only be estimated within a “quite wide range.” He noted that the central bank is attempting to narrow that range and may disclose updated estimates once confidence improves.
Ueda added that the lack of clarity around the neutral rate means the BoJ must operate without a firm sense of how much tightening is ultimately appropriate. This ambiguity, he said, leaves uncertainty around “how far we should raise interest rates,” even as policymakers consider more conventional policy settings after years of ultra-accommodation. Current BoJ estimates place the nominal neutral rate between 1% and 2.5%.
His comments come days after signaling that the BoJ will weigh the “pros and cons” of a rate hike at the upcoming December meeting, a remark markets interpreted as the strongest indication yet that a move to 0.75% is under consideration.
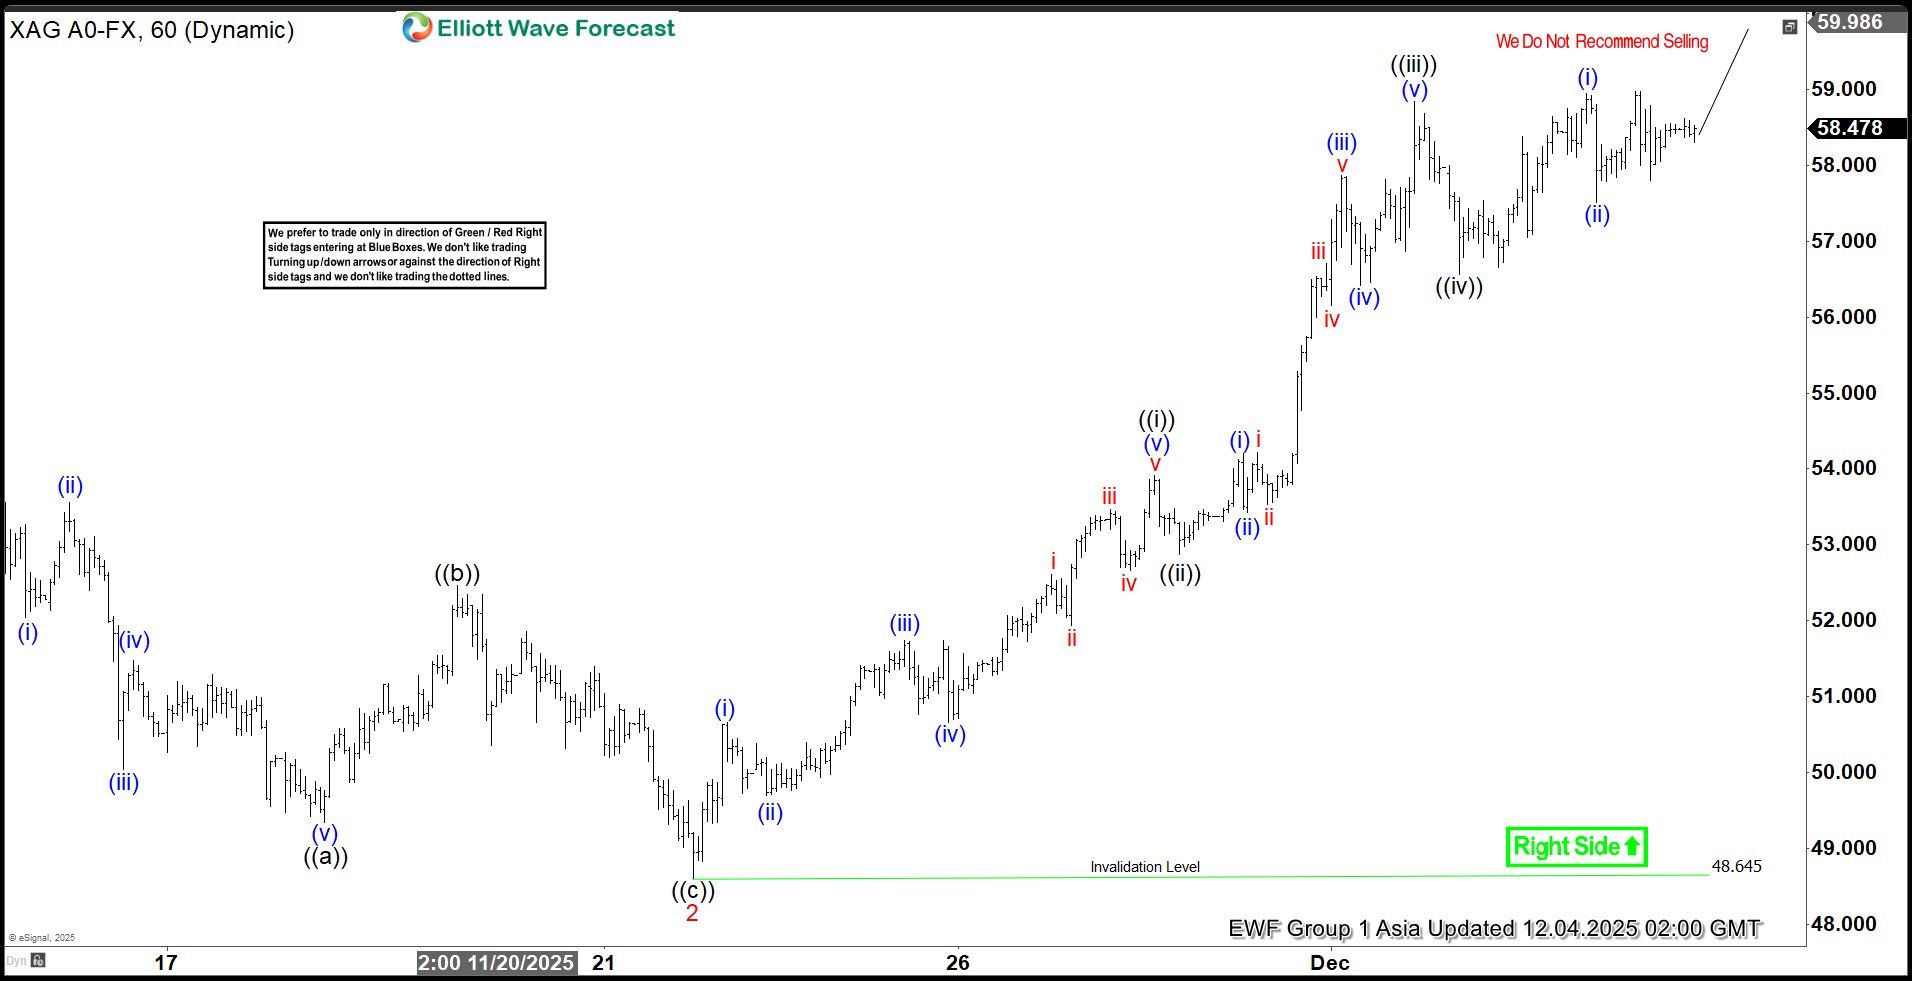
Silver (XAGUSD) Ongoing Impulsive Rally Points Toward Higher Extension
The rally in Silver from the 28 October low continues to unfold as a five‑wave impulse Elliott Wave sequence, though the structure remains incomplete. From that low, wave 1 advanced to 54.39, followed by a corrective pullback in wave 2 that concluded at 48.6. The metal then resumed its upward trajectory in wave 3, which itself subdivides into another five‑wave sequence of lesser degree. From the termination of wave 2, wave ((i)) reached 53.85, while the subsequent pullback in wave ((ii)) settled at 52.86.
Momentum strengthened as wave ((iii)) extended to 58.84, before wave ((iv)) corrected modestly to 56.55. The market should now push higher in wave ((v)), thereby completing the larger wave 3. The potential termination zone for wave 3 aligns with the 100% to 161.8% Fibonacci extension of wave 1, calculated at 57.8 to 63.4. This region has already been tested, suggesting that the cycle is mature and wave 3 may be approaching completion.
Once wave 3 concludes, a corrective phase in wave 4 should emerge, retracing the cycle from the 21 November low before the broader trend resumes upward. In the near term, as long as the pivotal support at 48.64 remains intact, pullbacks should attract buyers. These retracements may unfold in sequences of three, seven, or eleven swings, providing opportunities for renewed upside participation.
Silver (XAGUSD) 60-Minute Elliott Wave Chart From 12.4.2025
XAGUSD Elliott Wave Video:
https://www.youtube.com/watch?v=HiA1dZm31pk
GBP/USD Breaks Through Key Resistance, Signaling Strong Upside
Key Highlights
- GBP/USD started a strong increase above the 1.3250 resistance.
- A bullish trend line is forming with support at 1.3235 on the 4-hour chart.
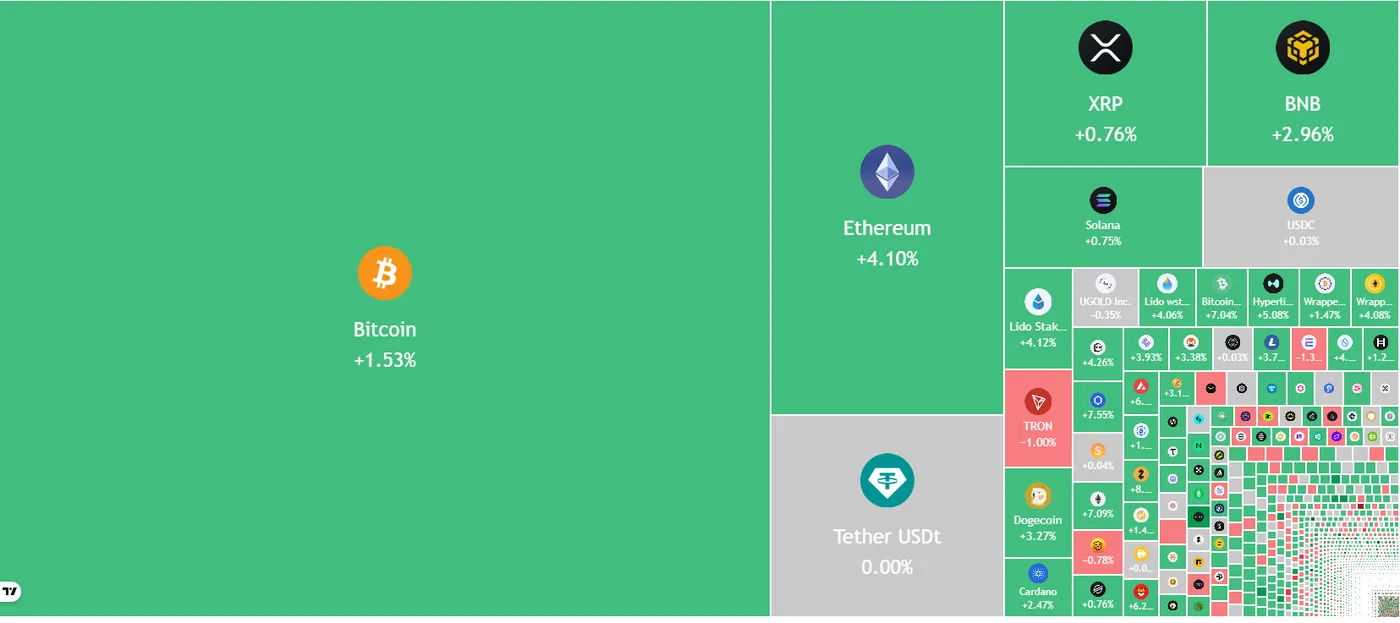
- Bitcoin recovered some losses and climbed above $92,000.
- Crude Oil price faced resistance near $60.00.
GBP/USD Technical Analysis
The British Pound formed a base and climbed above 1.3200 against the US Dollar. GBP/USD even cleared the 1.3250 resistance before the bears appeared.
Looking at the 4-hour chart, the pair settled above 1.3250, the 100 simple moving average (red, 4-hour), and the 200 simple moving average (green, 4-hour). The bulls pushed the pair above 1.3300 and there are chances of more upside.
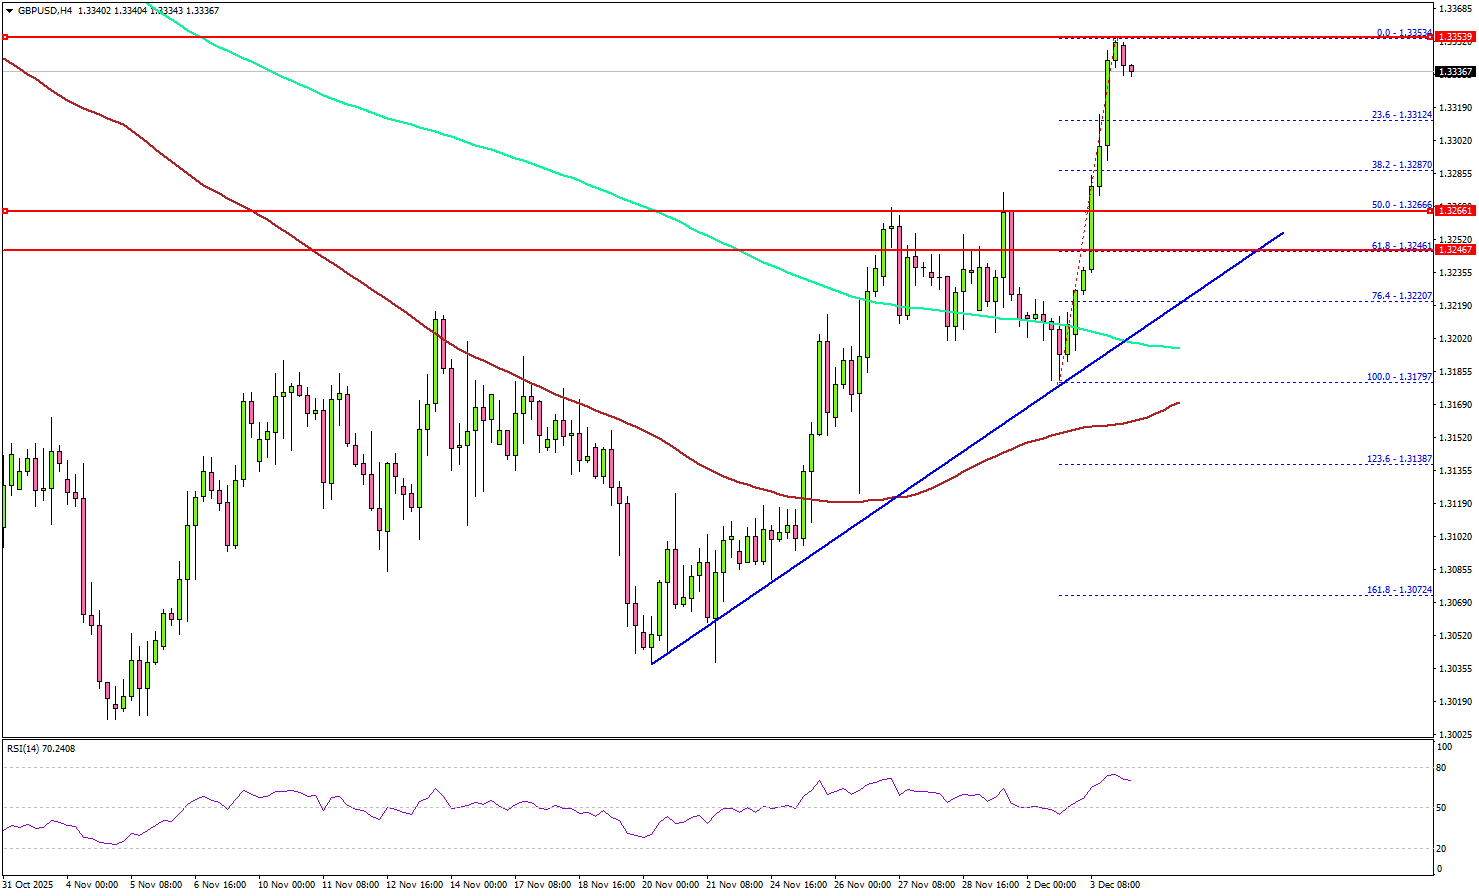
Immediate resistance sits near 1.3350. The first key hurdle is seen near 1.3365. A close above 1.3365 could open the doors for a move toward 1.3400. Any more gains could set the pace for a steady increase toward 1.3500.
On the downside, there is key support at 1.3265. The next support is 1.3240. There is also a bullish trend line forming with support at 1.3235, below which the pair could start a steady decline to 1.3200.
A downside break below 1.3200 could send the pair toward 1.3165 and the 100 simple moving average (red, 4-hour). The main support sits at 1.3050.
Looking at EUR/USD, the pair gained bullish momentum, and the bulls were able to send the pair above the 1.1650 resistance.
Upcoming Key Economic Events:
- UK’s Construction PMI for Nov 2025 – Forecast 44.3, versus 44.1 previous.
- US Initial Jobless Claims - Forecast 220K, versus 216K previous.
Bitcoin (BTC/USD) Price Alert: Bitcoin Breaks Major Resistance – Next Stop $100,000?
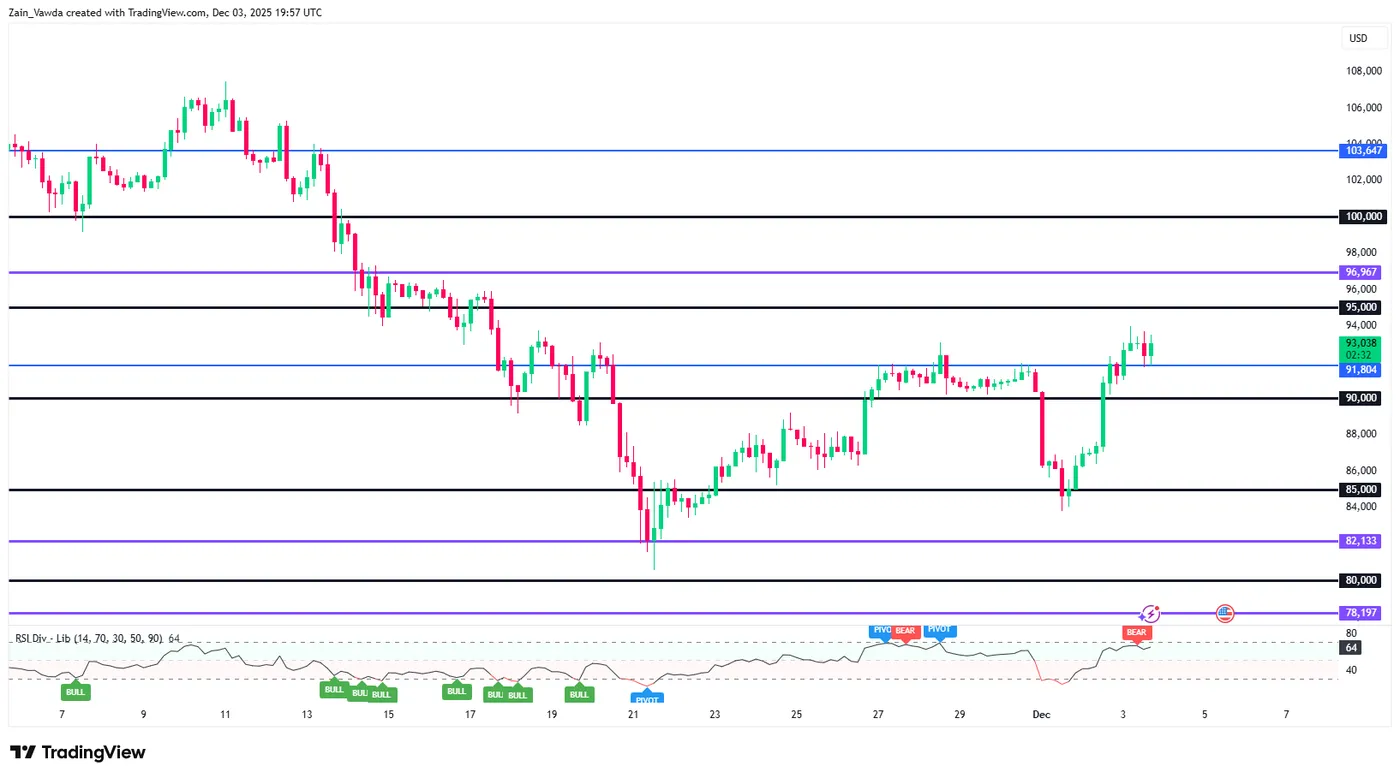
Bitcoin (BTC/USD) has successfully rebounded, passing the important $93,000 price point that many market participants have been watching. This comeback is seen as a necessary relief rally, pushing Bitcoin's price up to $93,007.12, which marks a 6.6% increase in just the last 24 hours.
After several weeks of falling prices, this price reversal seems strong and is supported by three main factors working together: significant changes in global economic policies (macroeconomic policy shifts), the fact that large investment firms can now easily buy and sell Bitcoin (unprecedented institutional distribution access), and certain patterns on the price charts that suggested a bounce was due (highly compressed technical indicators).
2025-12-03 20_02_46-Settings
The Factors Influencing Bitcoins Recovery
First, the US central bank (Federal Reserve) has officially ended its program of removing money from the economy (Quantitative Tightening or QT), which means they are now moving toward a policy that makes money more easily available (accommodating monetary policy). This boost in available money, or liquidity injection, has happened at the same time as a major shift in how large financial institutions view Bitcoin.
Second, investment firm Vanguard, which manages $9 trillion, has made it easier for its clients to access Bitcoin through certain investment products (third-party crypto ETFs).
Third, technical analysis suggests a huge move is coming. The price charts show that the price swings (volatility) have been at historic lows, a pattern that has always happened right before a massive, rapid price increase (parabolic price movements).
While these factors suggest the price is heading strongly upward and could soon go above $100,000, there is an immediate risk: the market remains fragile.
There is not enough trading volume right now (market depth has not fully recovered), meaning there isn't much liquidity. In this kind of environment, the market is highly prone to large, sudden price swings, making it very sensitive to any bad news or unexpected selling that forces traders to quickly close their positions (liquidation events).
However, because the fundamental drivers such as money flowing from central banks and real demand from major financial institutions are so strong, experts believe this price momentum is likely to last and is more than just a temporary fluctuation.
Institutional Demand Mechanics: The Distribution Revolution
The money flowing from large investment firms into Bitcoin has made a significant turnaround, suggesting that a period where money was rapidly leaving the market is over. Investment products known as US spot Bitcoin ETFs have started seeing money flow back in (net inflows), reversing four straight weeks where over $4.3 billion had been pulled out. Although the first week's rebound was modest at about $70 million, this shift confirms that institutional money is actively returning to the market.
This money is not just coming from one source. While BlackRock’s Bitcoin ETF is recovering, major inflows went into funds managed by Fidelity ($77.5 million) and ARK 21Shares ($88 million), showing a broad return of interest across many institutional players. These ETFs now manage over $119 billion and hold 6.5% of all existing Bitcoin, making them a permanent and crucial source of demand.
A huge structural change, dubbed the "Vanguard Effect," also boosted demand. Vanguard, one of the world's largest investment managers with up to $10 trillion in assets, started allowing its clients to buy crypto ETFs and mutual funds tied to Bitcoin and other digital assets (like ETH, XRP, and SOL) on its platform.
This move created immediate and massive demand, causing Bitcoin's price to jump 6% right when the US market opened. On that first day, BlackRock’s Bitcoin ETF recorded about $1 billion in trading volume in the first half-hour alone. By making it easier for cautious, long-term investments, such as retirement and pension funds, to buy Bitcoin, Vanguard has permanently expanded the asset's reach, ensuring strong, sustained demand well into 2026.
Technical Analysis - BTC/USD
The confluence of positive structural and technical factors lends strong support to bullish forecasts heading into 2026.
Looking at structure and the setup appears highly bullish, the path forward will likely be non-linear and volatile.
The four-hour chart below has seen a shift in structure with price breaking above the previous swing high and resting on support at 91804.
Resistance to the upside may be found at 95000 before the 97000 and 100000 handles come into focus.
A potential pullback toward 90000 or the recent breakout at around the 86600 mark cannot be ruled out before the next leg higher.
The primary immediate risks center on macroeconomic data surprises. Any unexpectedly high reading in the PCE Inflation Data or stronger-than-expected labor reports could quickly dampen December rate cut expectations, triggering a sharp reversal in the relief rally.
Bitcoin (BTC/USD) Four-Hour Chart, December 3, 2025
Source: TradingView.com (click to enlarge)
EURUSD Wave Analysis
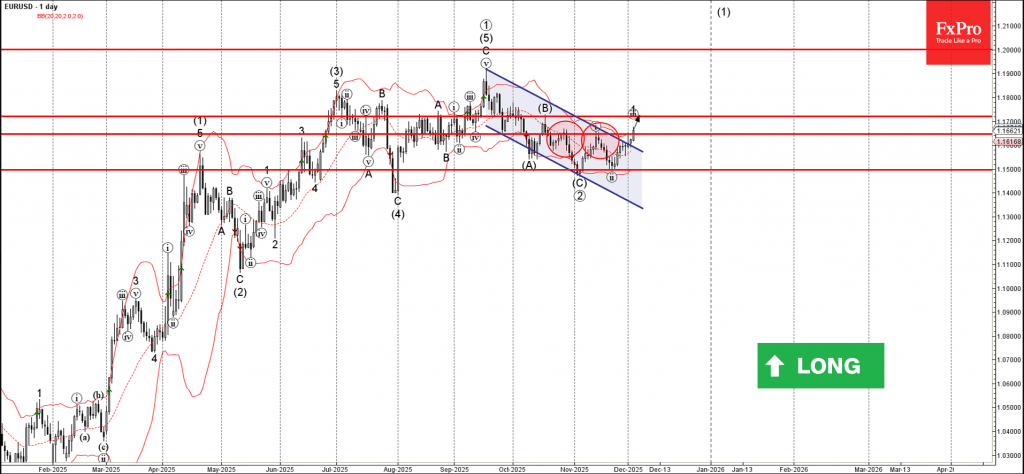
EURUSD: ⬆️ Buy
- EURUSD broke resistance zone
- Likely to rise to resistance level 1.1720
EURUSD currency pair recently broke the resistance zone between the resistance trendline of the daily Down Channel from August and the resistance level 1.1645 (which stopped the previous impulse wave i).
The breakout of this Down Channel accelerated the active short-term impulse wave iii from the end fo November.
Given the multi-month daily uptrend and the bearish US dollar sentiment seen today, EURUSD currency pair can be expected to rise further to the next resistance level 1.1720 (former top of wave B from October and the target price for the completion of the active wave iii).
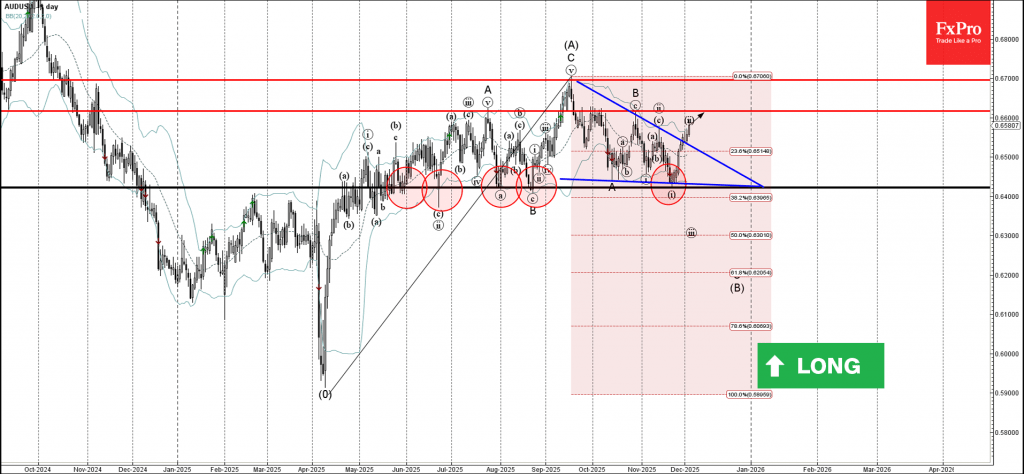
AUDUSD Wave Analysis
AUDUSD: ⬆️ Buy
- AUDUSD broke daily Falling Wedge
- Likely to rise to resistance level 0.6615
AUDUSD currency pair recently broke the resistance trendline of the daily Falling Wedge from the middle of September.
The breakout of this Falling Wedge continues the active short-term correction ii, which stared earlier from the key multi-month support level 0.6420 (which has been reversing the price from May).
Given the clear daily uptrend, AUDUSD currency pair can be expected to rise further to the next resistance level 0.6615 (target price for the completion of the active wave ii).