
Sample Category Title
Crypto Recovery: Dead Cat Bounce or Start of Buy-the-Dip?
Cryptocurrencies are finally bouncing from their relative lows, with Bitcoin reclaiming the $90,000 level after bottoming near $80,500 on Friday, November 21.
Traders are scared, and for good reason: elevated valuations and an ecstatic mood in early autumn had led to extreme positioning, which consequently triggered a cascade of liquidations and stops.
The first major crack appeared shortly after Bitcoin reached its new record at $126,400 in mid-October, where a dark weekly closure led to a gigantic flash-crash.
After that, the recovery was swift but proved temporary, materializing into a consistent, progressive selloff that dragged on all the way to the final week of November.
Low volumes are now the norm in this scarred market, but with selling flows largely reducing, some bottoms may have finally formed.
The question remains: Are the recent lows dips to buy or traps to avoid?
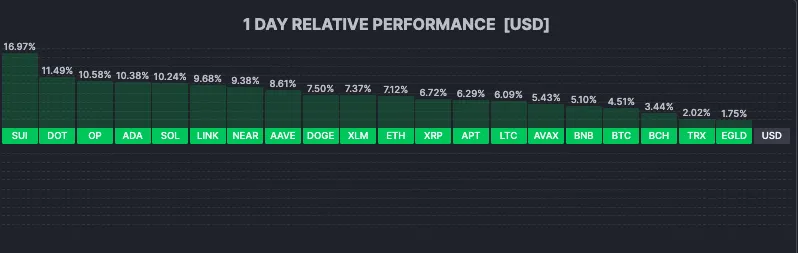
Current Session in Cryptos – Green throughout but some mid-day profit-taking – December 2, 2025 (12:01). Source: FInviz
As mentioned in one of our previous crypto-selloff analyses, the answer depends entirely on your investment horizon and risk appetite.
Market sentiment is still weak, but the daily session is a strong one.
Ethereum is now hanging around $3,000 again, and Bitcoin is holding $90,000, recovering even after a terrible monthly open yesterday caused by MicroStrategy investor panic—likely fueled by fears over its collapsing premium and leverage sustainability.
Let's access a few intraday charts and levels for Bitcoin, Ethereum, and Solana so you can decide whether this is an opportunity or not.
The Total Market Cap slowly recovers
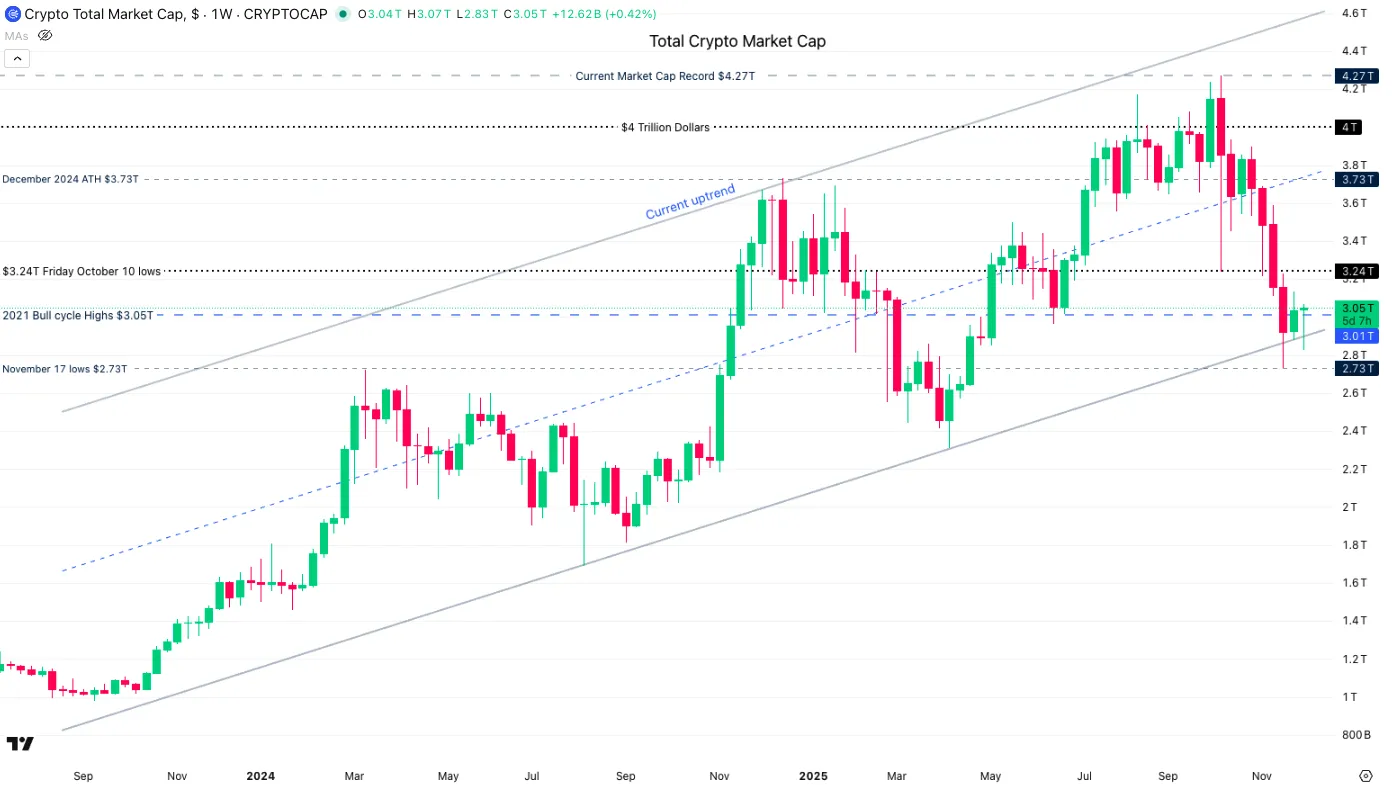
Crypto Total Market Cap. December 2, 2025 – Source: TradingView
Bitcoin 8H Chart
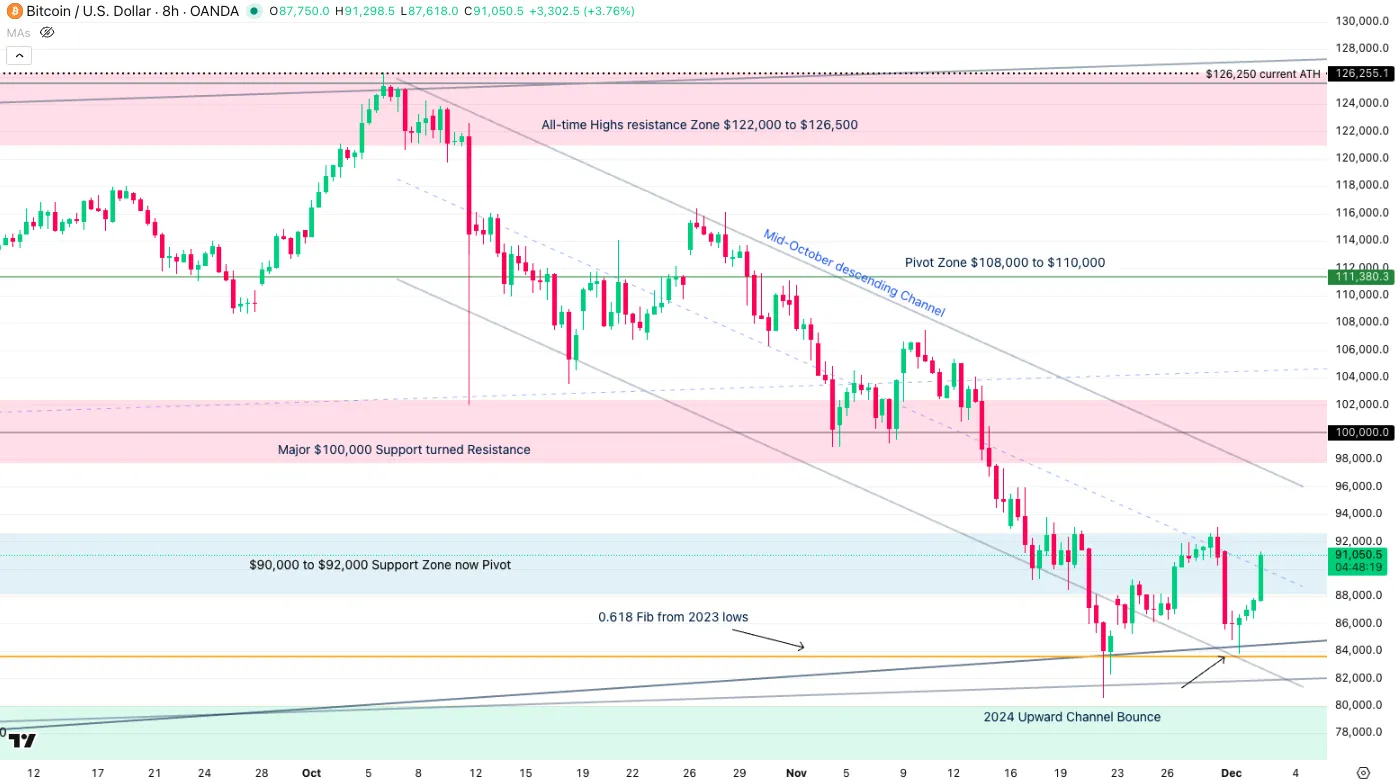
Bitcoin (BTC) 8H Chart, December 2, 2025 – Source: TradingView
Bitcoin is still evolving within its descending channel but is bouncing from its lows, inducing some dip-buying recovery activity.
Closing above the higher bound of the Pivot Zone ($92,000) would point to a test of the Channel's higher bound around $98,000.
For a higher timeframe bull-momentum restart, a weekly close above $100,000 will be required.
Levels of interest for BTC trading:
Support Levels:
- $90,000 to 93,000 major support turned Pivot
- Current Weekly Lows $89,340
- $85,000 mid-term Support (+/- $1,500)
- $75,000 Key long-term support
Resistance Levels:
- $90,000 to 93,000 major support turned Pivot
- $98,000 to $100,000 Main Support, now Pivot (MA 50 at $100,000)
- $102,000 Bear Channel Highs
- Resistance at previous ATH $106,000 to $108,000
- Current ATH Resistance $124,000 to $126,000
Ethereum 8H Chart
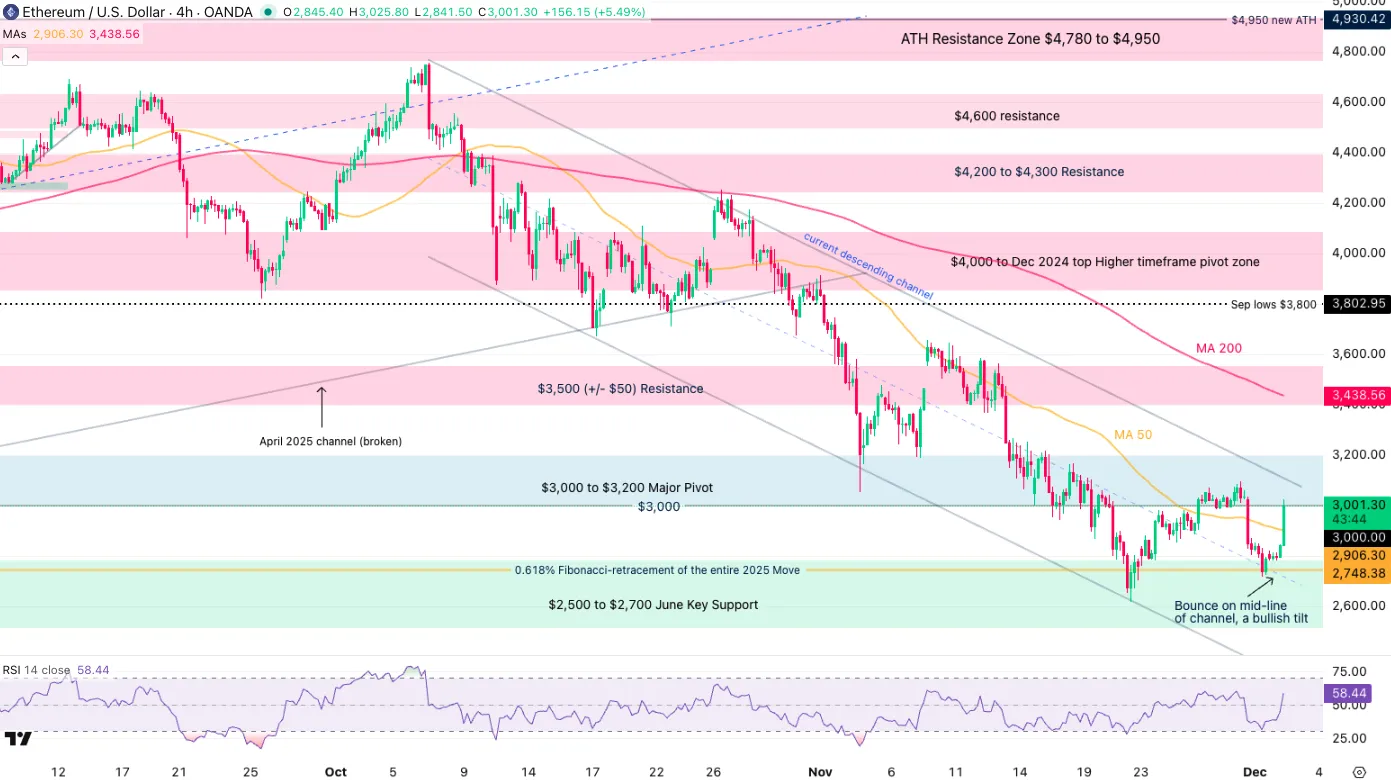
Ethereum (ETH) 8H Chart, December 2, 2025 – Source: TradingView
Ethereum still has trouble to close above the $3,000 mark but is forming some better looking price action:
The recent buying is occurring at the mid-line of the October descending channel, prompting more odds of a bullish breakout.
Similarly as Bitcoin however, a close above its $3,000 to $3,200 Pivot will be required to allow for a return to a bullish mid-term bias in ETH.
Levels of interest for ETH trading:
Support Levels:
- $2,500 to $2,700 June Key Support (recent rebound)
- $2,620 Session and weekly Lows
- $2,100 June War support
- $1,385 to $1,750 2025 Support
- 2025 Lows $1,384
Resistance Levels:
- $3,000 to $3,200 Major momentum Pivot (Test of the $3,000)
- $3,500 (+/- $50) Resistance and Descending Channel highs
- $3,800 September lows
- $4,000 to Dec 2024 top Higher timeframe Resistance zone
- $4,950 Current new All-time highs
Solana 8H Chart
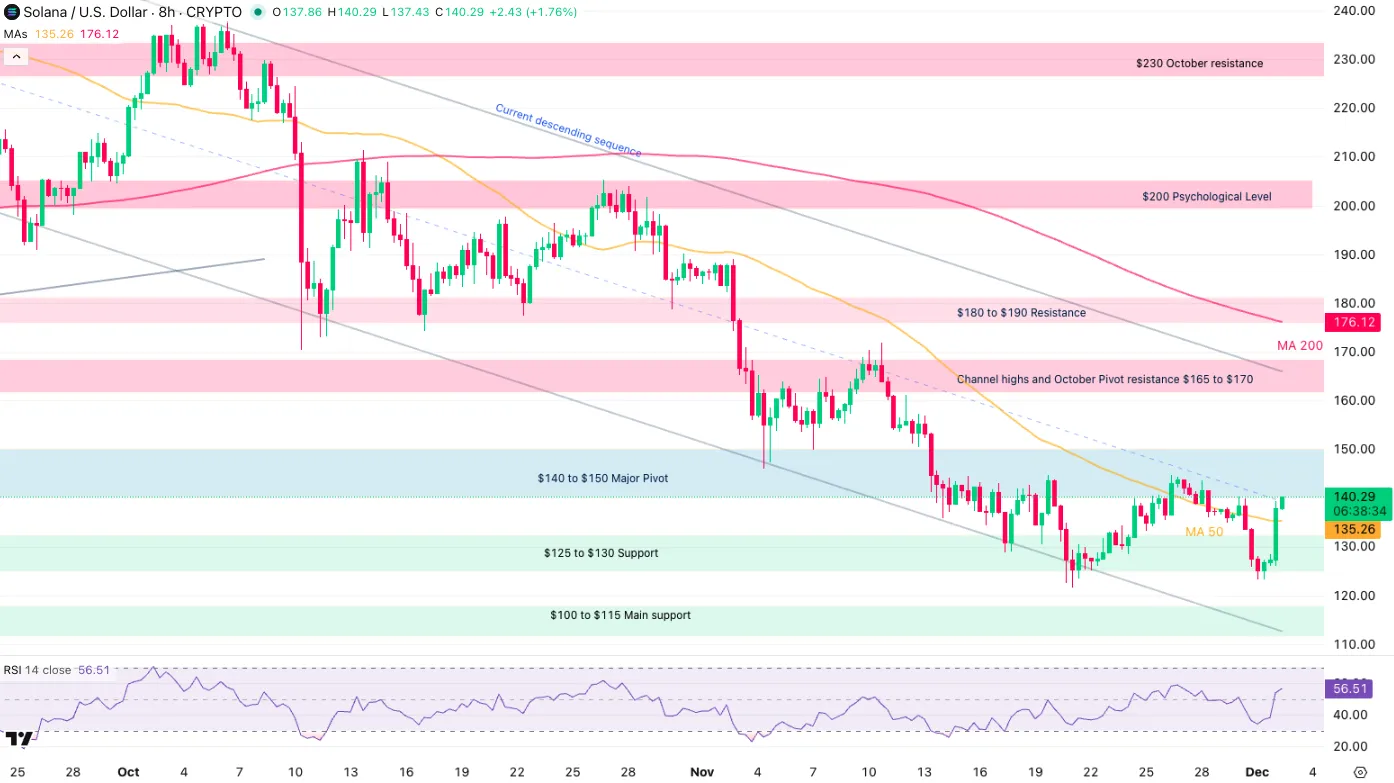
Solana (SOL) 8H Chart, December 2, 2025 – Source: TradingView
The story repeats for Solana, but the harshly-rejected crypto is showing signs of life, breaking its past week's descending price action and testing the $140 level.
Track how it performs within its descending channel: The $160 to $170 resistance level will be the hurdle to breach to relaunch bullish prospects for the third largest crypto.
Levels to keep on your SOL Charts:
Support Levels:
- Main Support $125 to $130 (Recent bounce)
- $110 to $115 Support
- Weekly lows $123
- Support 3: $100 to $105
Resistance Levels:
- $140 to $150 Major Pivot (testing)
- Channel highs and October Pivot resistance $165 to $170
- $180 to $190 Resistance
- Psychological level $200 to $205
- $253 Cycle highs
EURUSD Remains Constructive But Thick Falling Daily Cloud Weighs
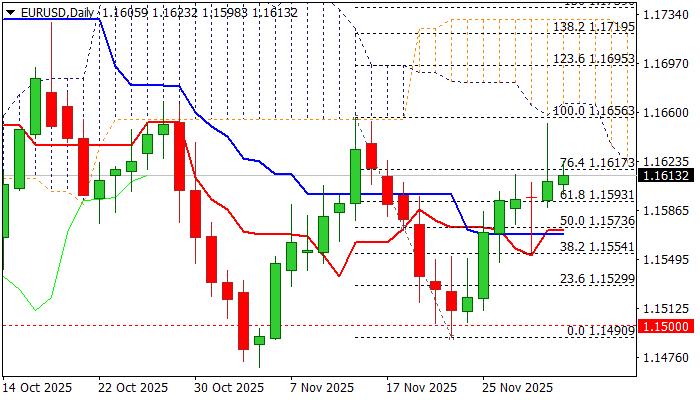
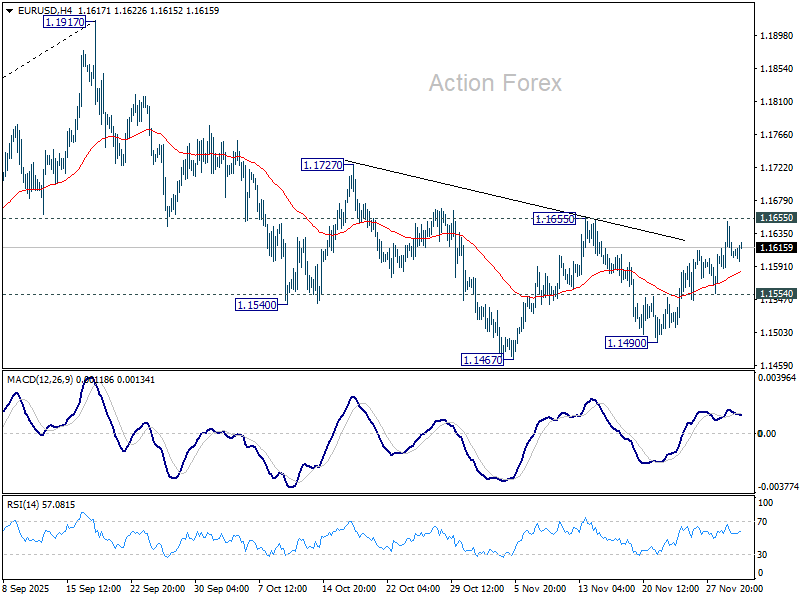
The Euro keeps firm tone on Tuesday after near-term recovery spiked to two-week high (1.1652) but subsequent quick pullback pointed to strong upside rejection (daily candle with long upper shadow).
Recovery stalled just under the base of daily Ichimoku cloud (1.1666) and left a bull-trap above 100DMA (1.1642) although near-term action still holds above broken Fibo 61.8% of 1.1656/1.1490 (1.1593), partially offsetting threats of reversal for now.
Near-term action remains bullishly aligned despite conflicting signals (55/100 bear-cross vs daily Tenkan/Kijun-sen bull-cross) though growing pressure from descending and thickening daily cloud, should be considered.
Bulls probe again through cracked Fibo level at 1.1617 (76.4%) with falling 55DMA (1.1628) and 100DMA (1.1642) guarding cloud base (1.1666) where headwinds could be expected again.
Violation of 1.1593 Fibo support to weaken near-term structure, with loss of 1.1570 support zone (broken Fibo 50% / converged daily Tenkan/Kijun-sen) to signal reversal.
Res: 1.1628; 1.1642; 1.1655; 1.1666
Sup: 1.1593; 1.1570; 1.1550; 1.1520
Dow Jones (DJIA) Outlook: Could the Christmas Spirit awaken?
Stocks have begun December trading on a muted note, though far from the bearish trajectory that defined much of November.
December is historically a month where investors anticipate gains—a phenomenon known as the "December Effect" or the "Santa Claus Rally." This seasonal strength is typically driven by three core catalysts:
- Corporate Stock Buybacks: Companies rushing to complete buyback programs reduce the supply of outstanding shares, naturally pulling prices higher.
- Year-End Bonuses: As workers receive year-end payouts, fresh capital often flows into investment accounts, boosting demand.
- Psychological Momentum: A self-fulfilling prophecy where traders, anticipating a rise, buy in early, thereby driving the market higher.
However, in this beginning of December trading, a divergence is emerging.
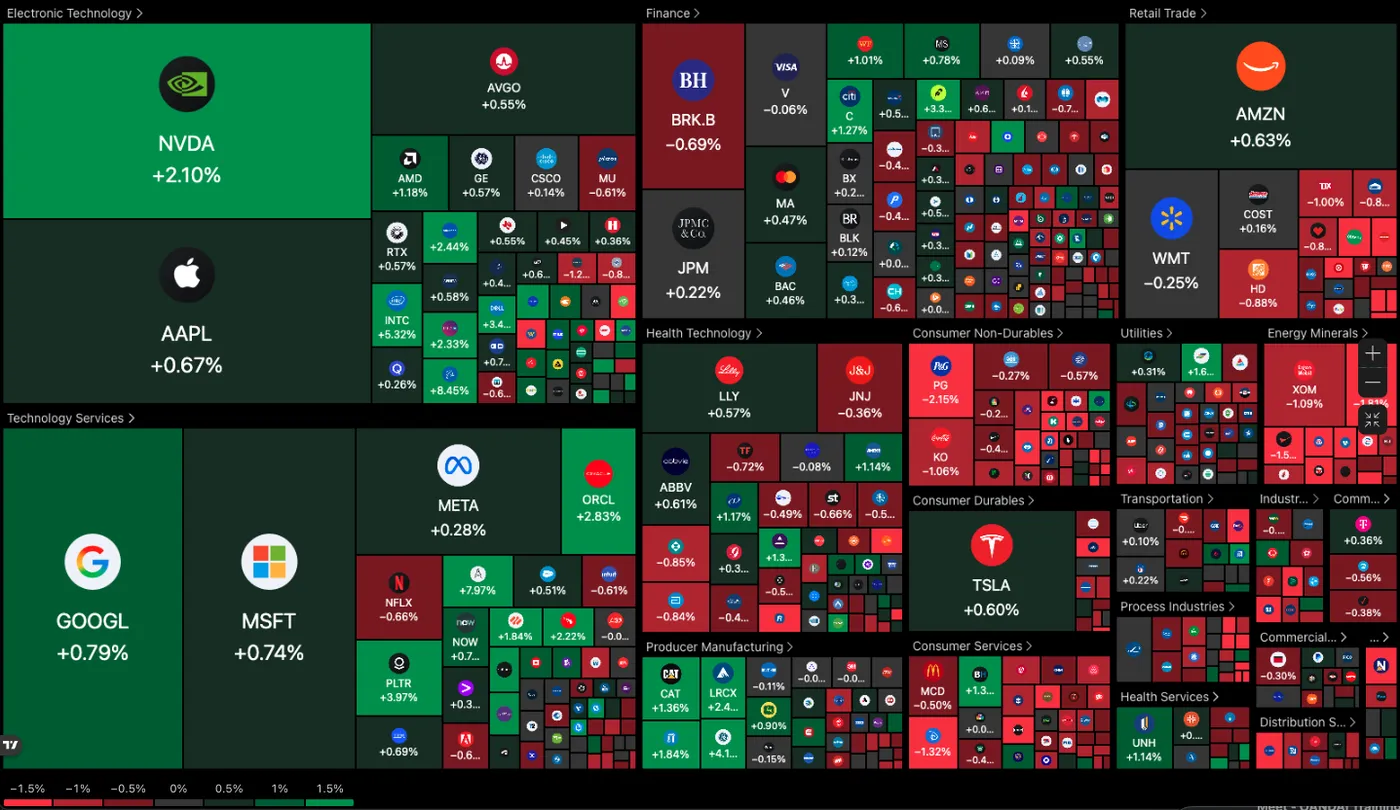
US Equity Heatmap (10:21) – December 2, 2025 – Source: TradingView
Despite Tech rebounding with resilient dip-buying, traditional sectors have struggled to maintain strong momentum – Look at how red the picture is in Consumer Cyclicals, Defensive, Utilities and Energy.
Some spirits are awakening as I am about to publish this piece
The culprit lies in the data: the ISM Manufacturing PMI came in lower yesterday at 48.2 (vs. 48.6 expected).
This miss is a stark sign that US industrial activity is still being hurt by the new Trump policies and angst relating to tariffs, with the sector hanging solidly in contraction territory (below 50) since March.
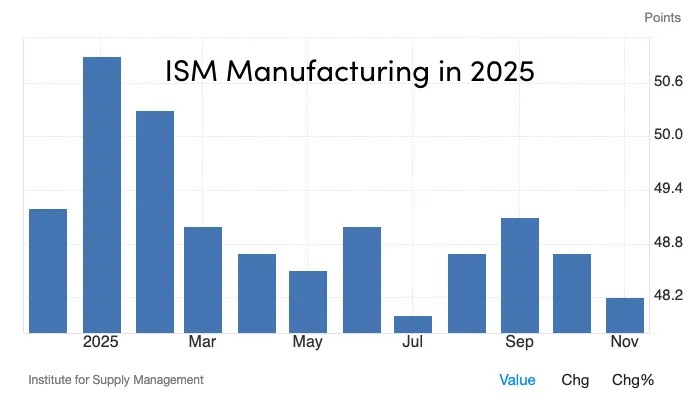
US Manufacturing PMI in 2025 – Source: TradingEconomics
While traders await more Santa Claus buying (which may arrive after the December 10 FOMC, if it comes) let's get ready by taking a close look at the Dow Jones through a multi-timeframe technical analysis.
Dow Jones (DJIA) Multi-Timeframe Analysis
Daily Chart
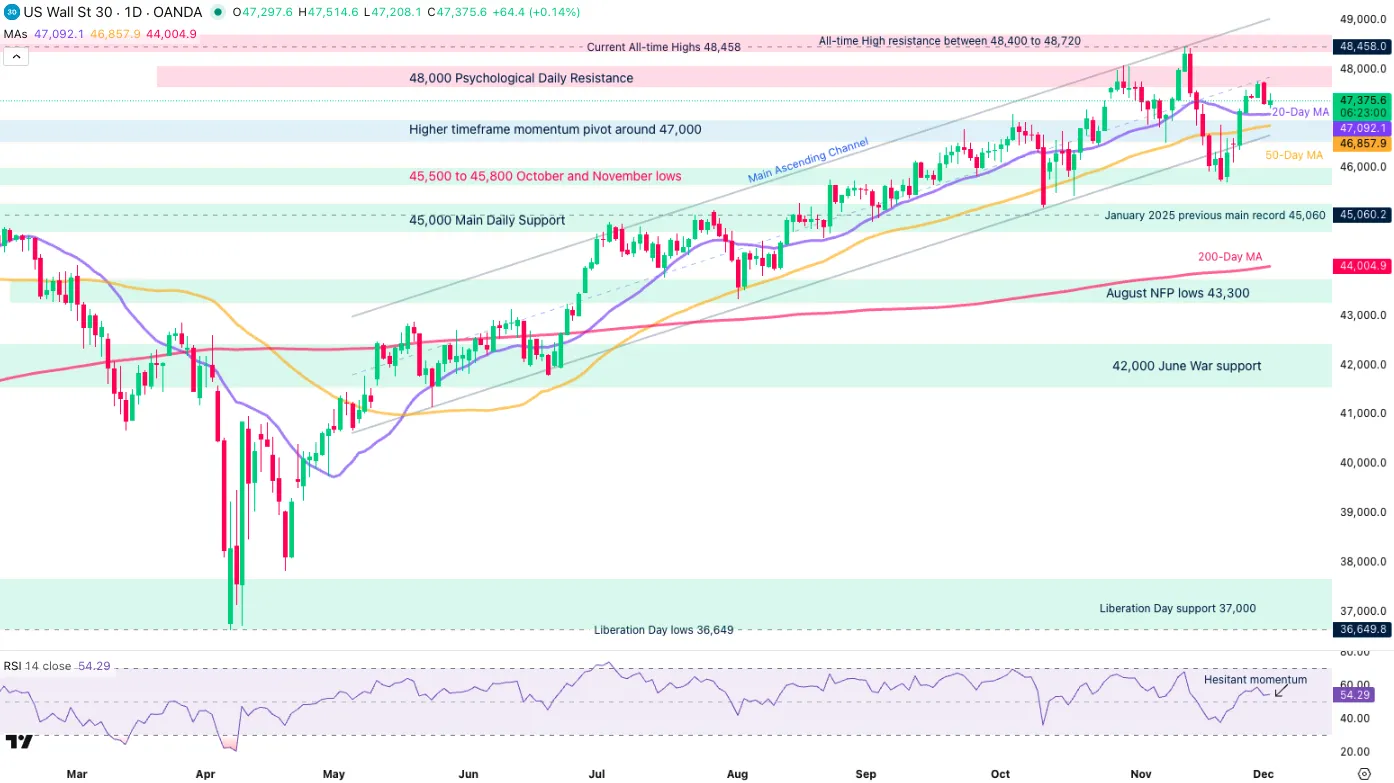
Dow Jones Daily Chart, December 2, 2025 – Source: TradingView
After a first red session for the Dow in December, bears are fighting to defend the 48,000 from trading.
The past month of correction has balanced momentum quite suddenly, taking the key 20 (47,090) and 50 Day (46,870) Moving Averages from upward sloping to their current flat level.
Still, any pullback lower could point to a test of these MAs which will have to act as support to relaunch more optimistic flows in Wall Street – After all, the long-run uptrend remains intact as we still evolve within the May Monthly upward channel.
RSI also supports the more balanced momentum outlook, hanging below 55 (45 to 55 shows neutral, directionless momentum).
Expect a range between 46,900 to 47,700 all the way to the December FOMC.
4H Chart and Technical levels
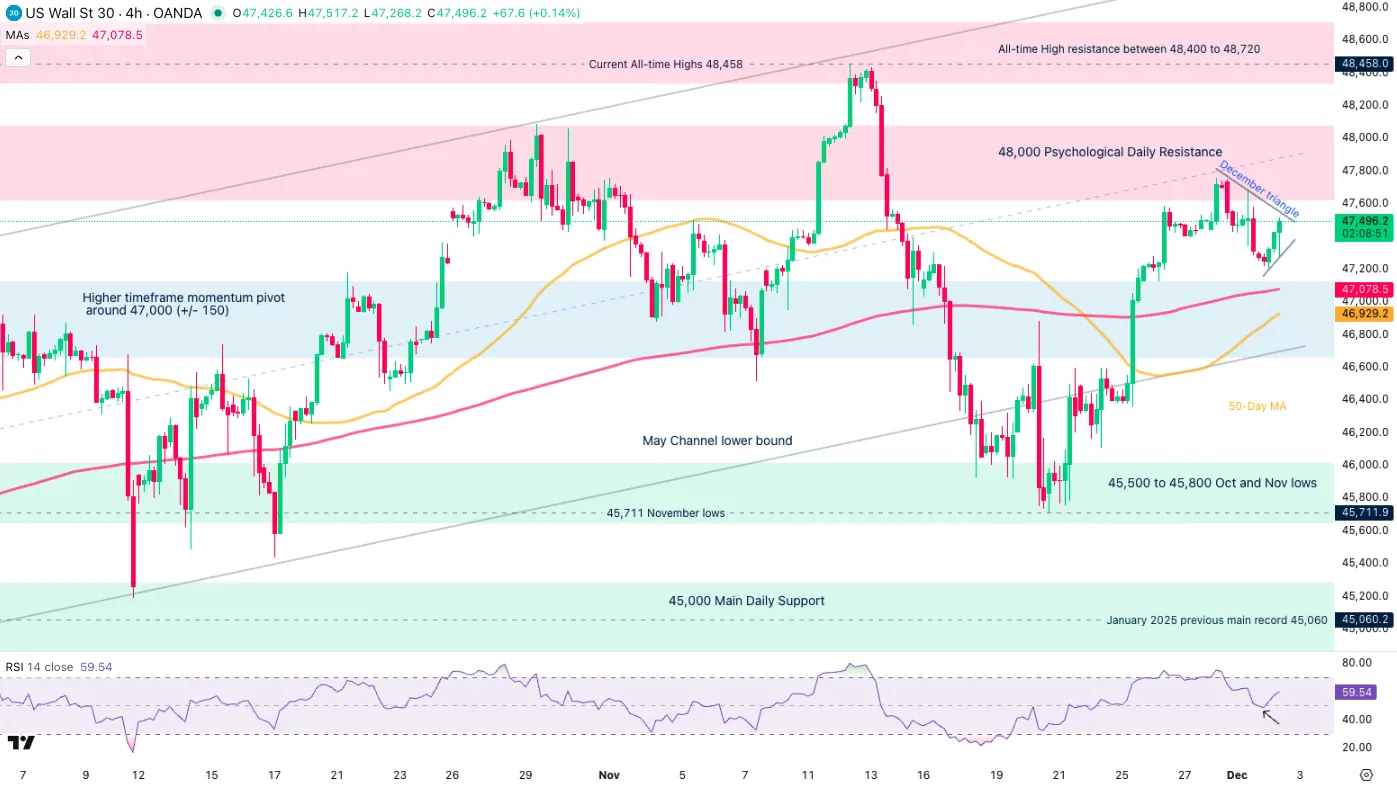
Dow Jones 4H Chart, December 2, 2025 – Source: TradingView
Some Christmas spirits are awakening with the current 4H Candle taking some traction and RSI momentum tilting higher.
Bulls will still have to breach the 47,746 highs from the Monthly open to invalidate the Rangebound conditions seen on the daily timeframe.
Dow Jones technical levels of interest:
Resistance Levels
- Current All-time Highs 48,458
- 48,000 Psychological Daily Resistance (+/- 200 points)
- Weekly high 47,747
- All-time High resistance between 48,400 to 48,720
Support Levels
- Session lows 47,200
- Higher timeframe momentum pivot around 47,000 (+/- 150)
- 45,500 to 45,800 Oct and Nov lows Support
- January 2025 All-time high 45,000 & Psychological zone (+/- 150)
1H Chart
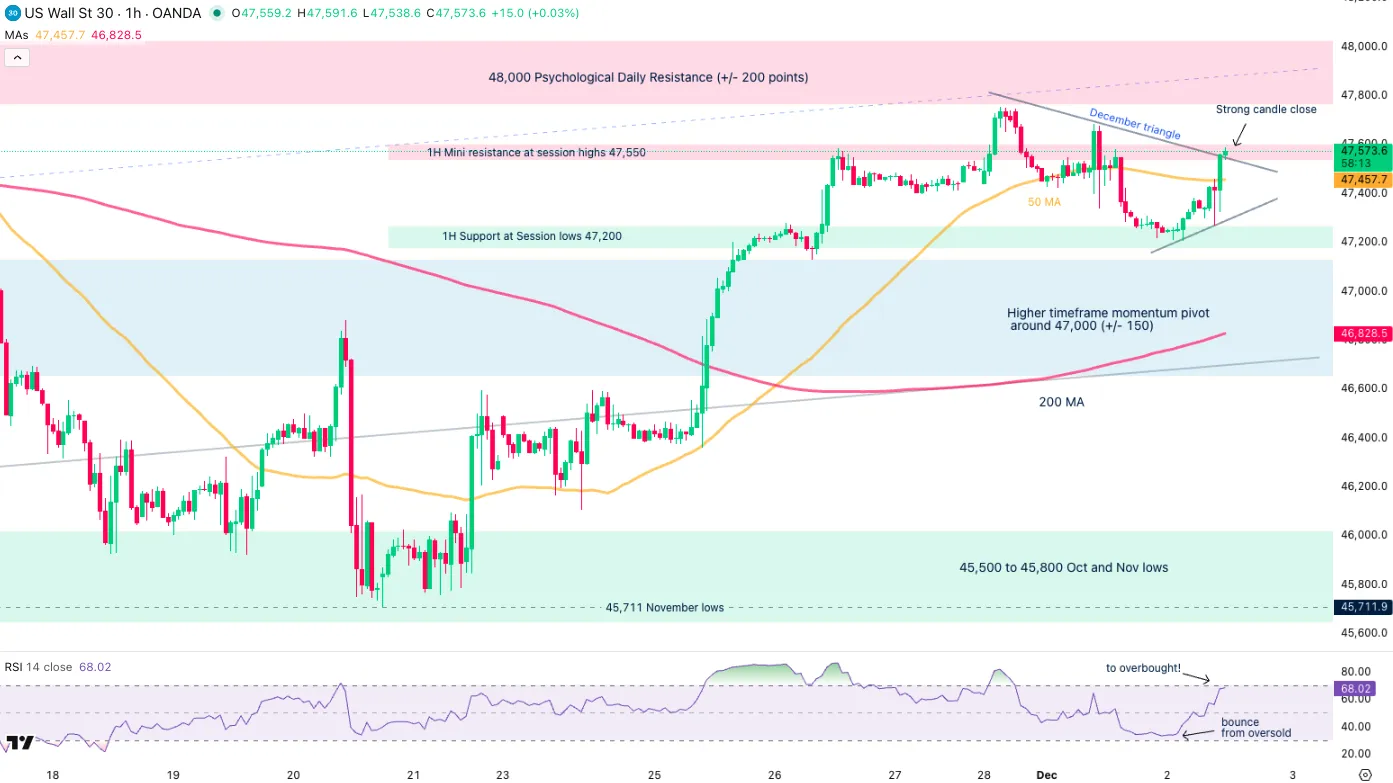
Dow Jones 1H Chart, December 2, 2025 – Source: TradingView
The current 1H Candle is a very strong one, but faces a test of the December triangle formation upper bound at a confluence with the 45,600 hourly resistance.
Breaking this points to at least a test of the Weekly highs, a 15M candle close above the level would suffice to take the intraday momentum in hand.
Failing to do so would invite the bears to defend the short-timeframe triangle formation.
Sunset Market Commentary
Markets
A solid 10-year Japanese bond auction this morning calmed down global core bond markets jitters after yesterday’s rout. But the underlying market forces are quelled for now, not at all dead. With the BoJ normalizing policy, rising Japanese yields offer an increasingly attractive alternative in a market already stretched by a huge supply (government, corporate) & demand (exit central banks) mismatch which back all sorts of risk premia. Core bonds remain under pressure, be it not to the same extent as yesterday, with underperformance at the long end. US yields add up to 2.5 bps. Bunds marginally underperforming vs swap. The latter 10-year and 30-year variants hold around the 2.8% and 3.1% (+) cycle highs. The 2-year swap yield is pouncing on the 2.2% November high. European inflation numbers came in slightly above expectations at 2.2% and 2.4% for headline and core respectively. Services inflation rose to a 7-month high of 3.5%. If anything, they confirm the ECB’s expected prolonged status quo at 2%. French OATs lag peers today following reports that Lecornu’s social security budget won’t get backing by Horizons in an upcoming vote December 9. Being part of the coalition government, Horizon’s lack of support underscores the extreme fragility in French politics. Gilts in the UK live up to their reputation by underperforming whenever (credit) risk premia pop up. UK yields rise 1.1-3 bps, further undoing last week’s relief rally after Chancellor Reeves presented the (spend-now-pay-later) November Budget. Equity markets fare a bit better than yesterday. An improving risk appetite is pushing the likes of the EuroStoxx50 0.4% higher. A potential key market moving event, particularly for European (risk) assets, takes place after European closing hours though with US envoy Witkoff meeting Russian president Putin for talks starting 7pm CET. The outcome is anyone’s guess but a positive one may support CE FX in first instance but also the euro vs USD. EUR/USD currently is going nowhere around, 1.161. JPY fully wiped out yesterday’s gains by trading back around USD/JPY 156. Just as with gilts, sterling’s relief rally quickly ran out of steam. EUR/GBP is keen on recovering the 0.88 big figure again.
News & Views
The Bank of England (BoE) today published its semi-annual financial stability report. The Financial Policy Committee assesses that risks have increased during 2025. Key sources include geopolitical tensions, fragmentation of trade and financial markets, and pressures on sovereign debt markets. Many risky asset valuations, especially in AI-related sectors are stretched. Corrections can spill over to broader credit markets with credit spreads considered stretched by historical standards. While the UK remains exposed to global shocks, UK household and corporate aggregate indebtedness is seen as remaining low. The UK banking system is well capitalized, maintains robust liquidity and funding positions, and asset quality remains strong. This allowed to central bank to reduce the Tier 1 capital ratio to 13% from 14%. In the context of heightened geopolitical tensions and continued advances in technology, the Committee underlines the critical importance of operational resilience on order to continue the provision of vital services to households and business. Regarding a specific topic related to market based funding, the Committee elaborated on rising leveraged borrowing by hedge funds in gilt repo markets. Activity of those funds rose close to £ 100 bln and at least part of it is related to a popular cash-futures base trade. A small number of hedge funds account for more than 90% of net gilt repo borrowing, with trades often at (near-)zero collateral haircuts and at very short maturities and so require regular refinancing. These vulnerabilities, in the context of compressed risk premia in a highly uncertain global environment, increase the risk of sharp moves.
Growth in South Africa increased by 0.5% Q/Q and 2.1% Y/Y in Q3, following a 0.9% quarterly rise in Q2. Trade catering and accommodation increased 1.0% Q/Q, mining and quarrying increased 2.3%. Financing, real estate and business services grew by 0.3%. The manufacturing industry increased by 0.3% while agriculture, forestry and fishing industry increased by 1.1%. On the demand side, household consumption increased by 0.7%, contributing 0.5ppt to the total growth. Gross fixed capital formation increased by 1.6% (after three negative quarters), contributing 0.2ppt. Net exports contributed negatively (-0.4 ppt) amid faster imports of goods and services by 2.2%. The reaction of the rand to the GDP data was modest. At USD/ZAR 17.11 the South-African currency maintains most of its post-Liberation/YTD gains (+ 10.1% YTD against the dollar; but a loss of 1.8% YTD against the euro).
EUR/USD Mid-Day Outlook
Daily Pivots: (S1) 1.1582; (P) 1.1617; (R1) 1.1644; More….
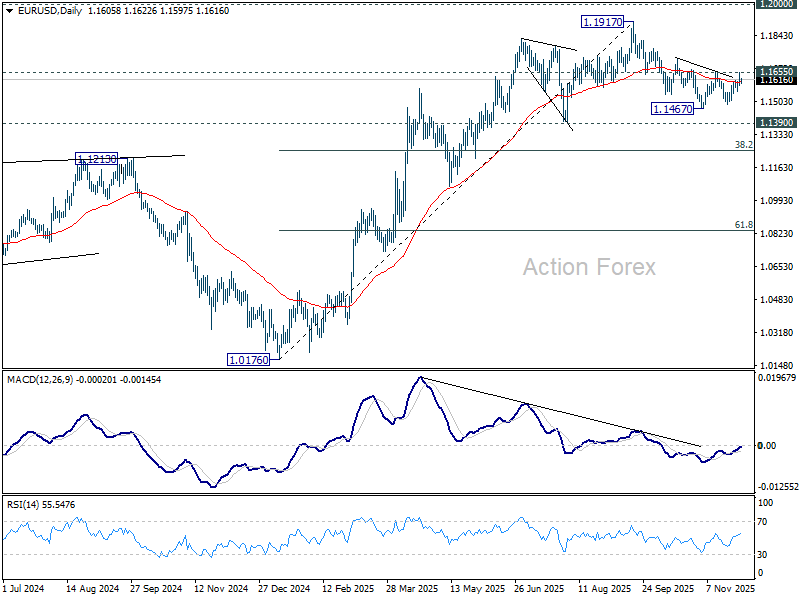
Intraday bias in EUR?USD remains neutral for the moment. On the upside, decisive break of 1.1655 will complete a head and should bottom pattern (ls: 1.1540, h: 1.1467, rs: 1.1490). That would argue that whole fall from 1.1917 has completed as a correction. Further rise should then be seen to 1.1727 resistance first. On the downside, though, below 1.1554 will turn bias to the downside for 1.1490 support first.
In the bigger picture, considering bearish divergence condition in D MACD, a medium term top is likely in place at 1.1917, just ahead of 1.2 key psychological level. As long as 55 W EMA (now at 1.1345) holds, the up trend from 0.9534 (2022 low) is still in favor to continue. Decisive break of 1.2000 will carry larger bullish implications. However, sustained trading below 55 W EMA will argue that rise from 0.9534 has completed as a three wave corrective bounce, and keep long term outlook bearish.
USD/CHF Mid-Day Outlook
Daily Pivots: (S1) 0.8013; (P) 0.8031; (R1) 0.8067; More…
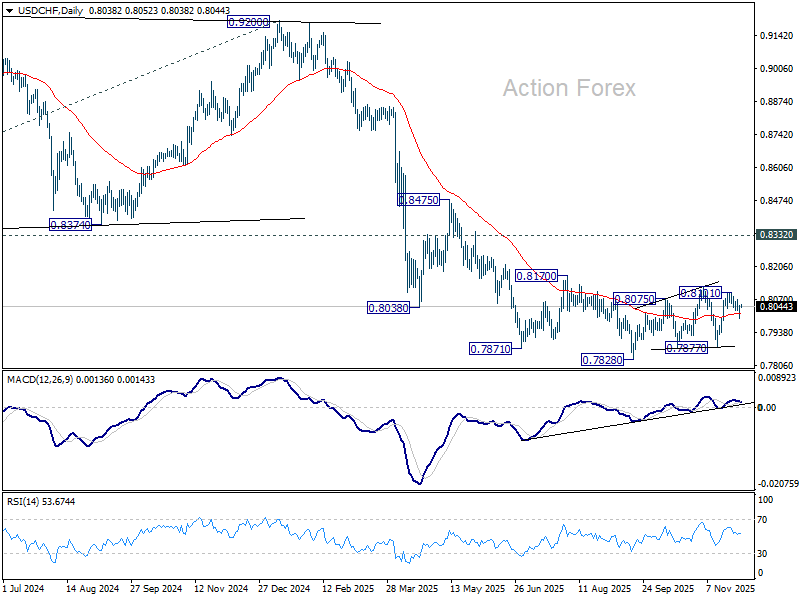
Intraday bias in USD/CHF is turned neutral first with current recovery. Outlook is unchanged that price actions from 0.7828 low is seen as a corrective pattern. On the upside, above 0.8070 will indicate that pattern is still extending, and turn bias back to the upside for 0.8123 and above. On the downside, below 0.7995 will bring deeper fall back towards 0.7877 support.
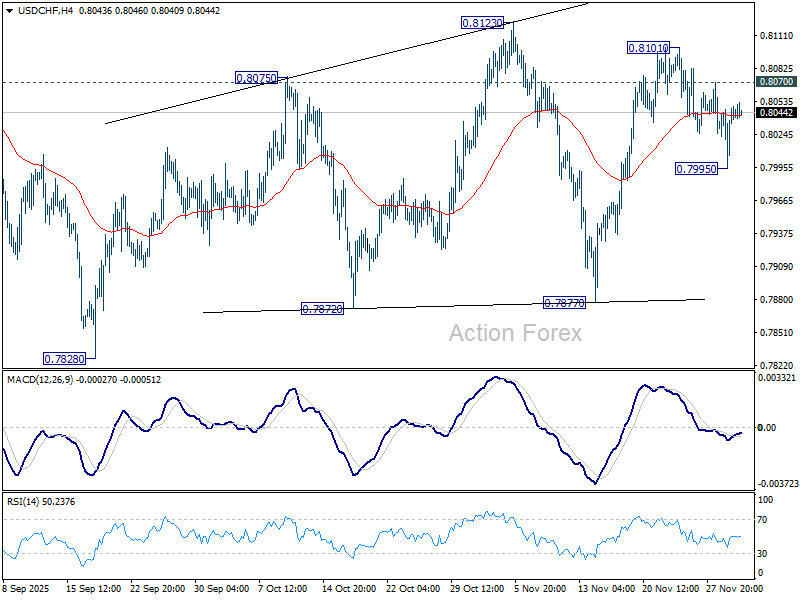
In the bigger picture, long term down trend from 1.0342 (2017 high) is still in progress. Next target is 100% projection of 1.0146 (2022 high) to 0.8332 from 0.9200 at 0.7382. In any case, outlook will stay bearish as long as 0.8332 support turned resistance holds (2023 low).
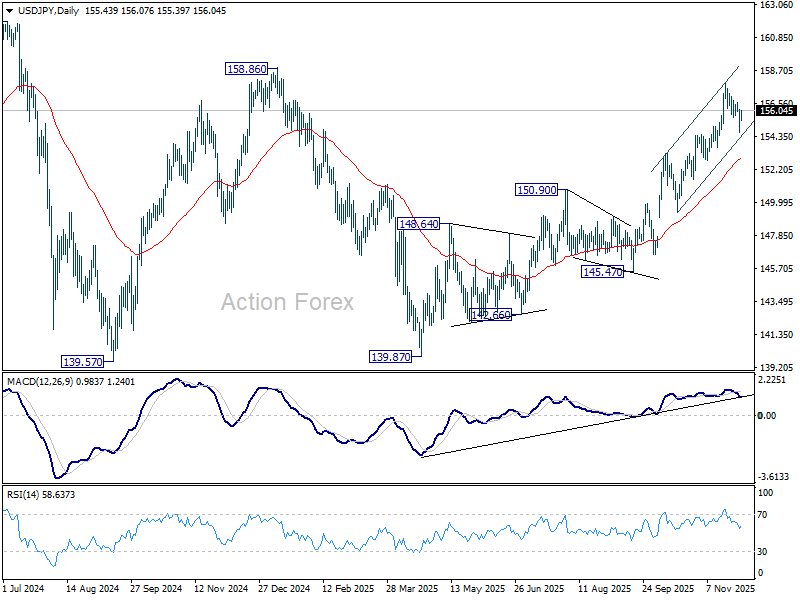
USD/JPY Daily Outlook
Daily Pivots: (S1) 154.71; (P) 155.43; (R1) 156.21; More...
Intraday bias is turned neutral first with current recovery. With near term channel floor intact, further rally is expected. Above 156.57 minor resistance will bring retest of 157.88. Further break there will resume the whole rally from 139.87. Next target is 158.86 structural resistance, and then 161.94 high. However, sustained break of the channel support will bring deeper correction to 55 D EMA (now at 152.86), and raise the chance of near term trend reversal.
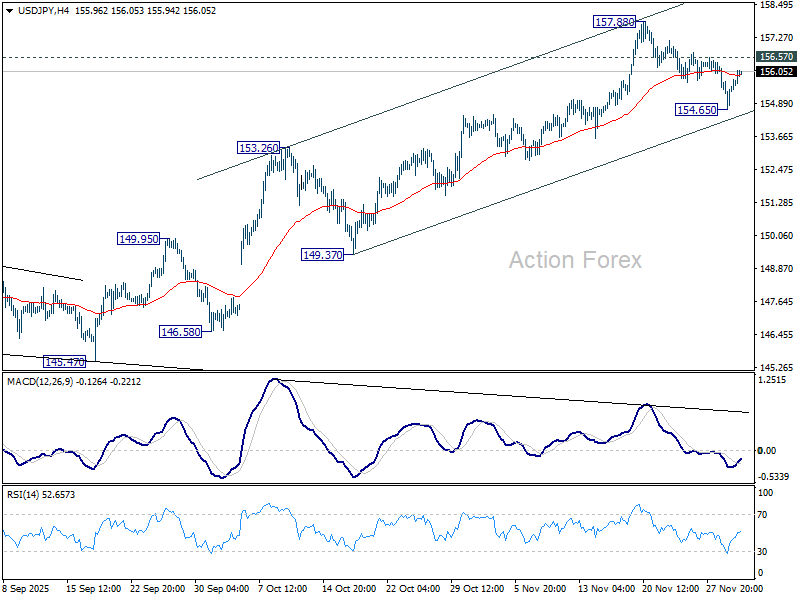
In the bigger picture, current development suggests that corrective pattern from 161.94 (2024 high) has completed with three waves at 139.87. Larger up trend from 102.58 (2021 low) could be ready to resume through 161.94 high. Decisive break of 158.85 structural resistance will solidify this bullish case and target 161.94 for confirmation. On the downside, break of 150.90 resistance turned support will dampen this bullish view and extend the corrective range pattern with another falling leg.
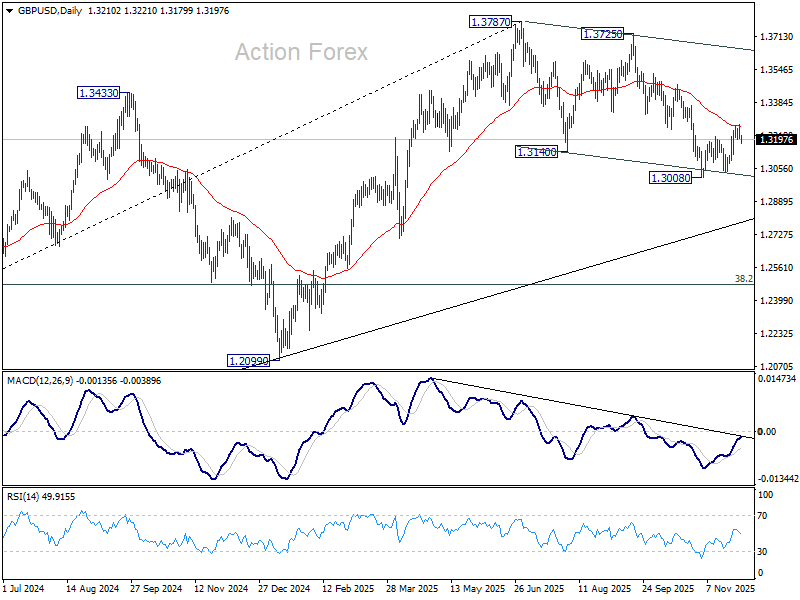
GBP/USD Mid-Day Outlook
Daily Pivots: (S1) 1.3188; (P) 1.3232; (R1) 1.3257; More...
GBP/USD's break of 1.3199 minor support argues that recovery from 1.3008 might have completed as a three-wave corrective move to 1.3274. That came after touching 55 D EMA (now at 1.3265). Intraday bias is back on the downside for retesting 1.3008 low. On the upside, however, sustained trading above 55 D EMA should confirm that fall from 1.3787 has completed. Further rise should then be seen to 1.3725/3787 resistance zone.
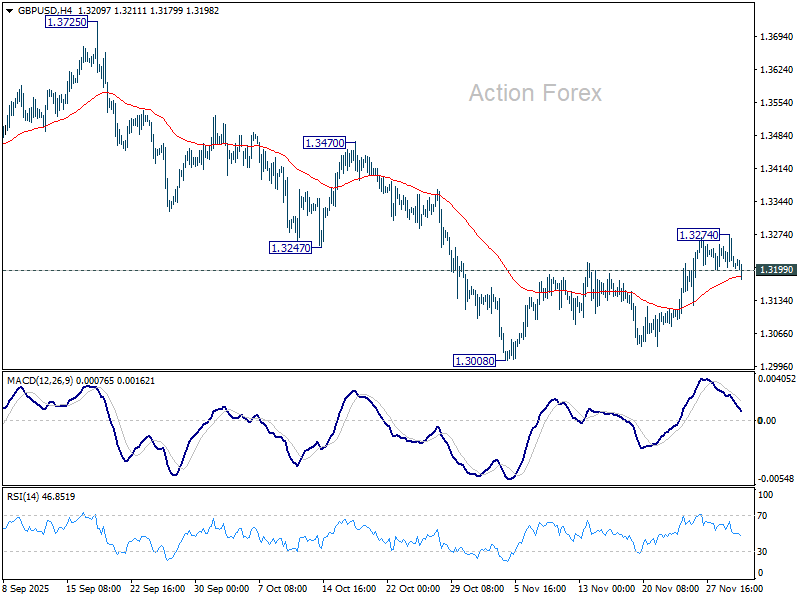
In the bigger picture, the break of 55 W EMA (now at 1.3184) is taken as the first sign that corrective rise from 1.0351 (2022 low) has completed. Decisive break of trend line support (now at 1.2760) will solidify this case and target 38.2% retracement of 1.0351 to 1.3787 at 1.2474 next. Meanwhile, in case of another rise, strong resistance should emerge below 1.4248 (2021 high) to cap upside to preserve the long term down trend.
UK Political Noise Weighs Slightly on GBP, FX Board Shows No Clear Theme
Sterling weakened slightly today as markets digested last night’s abrupt resignation of OBR Chair Richard Hughes, who stepped down following the premature release of budget documents last week. Investors viewed the episode as destabilizing for an institution designed to promote fiscal transparency and market confidence.
There was also a delayed reaction to UK Prime Minister Keir Starmer’s remarks, in which he reiterated his goal of driving inflation lower to enable further rate cuts and reduce business-investment costs.
In contrast, Yen is the worst performer of the day, unwinding much of its earlier gains. Markets initially bid up the currency early in the week on speculation of a possible BoJ rate hike, but enthusiasm has faded quickly. Risk-on sentiment has returned across global markets, removing the defensive bid that had supported JPY.
The re-pricing has shifted the day’s FX rankings, with Aussie on top, followed by Euro and Swiss Franc. Sterling and Kiwi sit near the bottom, while Dollar and Loonie hold middle ground.
The distribution of moves suggests no strong singular narrative is driving markets. Instead, today’s flows reflect a combination of UK political noise, unwinding of BoJ-related bets, and a cautious return of risk-taking in global markets—all contributing to a fragmented and directionless environment across major FX pairs.
In Europe, at the time of writing, FTSE is up 0.15%. DAX is up 0.39%. CAC is up 0.08%. UK 10-year JGB yield is up 0.012 at 4.498. Germany 10-year yield is up 0.009 at 2.765. Earlier in Asia, Nikkei closed flat. Hong Kong HSI rose 0.24%. China Shanghai SSE fell -0.42%. Singapore Strait Times rose 0.26%. Japan 10-year JGB yield fell -0.017 to 1.862.
OECD: Tariffs to weigh on 2026 global growth; inflation to ease
OECD’s latest economic outlook points to a cooling global economy over the next two years as higher effective tariff rates and persistent geopolitical uncertainty weigh on activity.
Global growth is projected to slow from 3.2% in 2025 to 2.9% in 2026 before recovering modestly to 3.1% in 2027. The US is expected to decelerate from 2.0% growth in 2025 to 1.7% in 2026, while the Eurozone will hover near 1.2%–1.4% through 2027. China’s growth is seen easing from 5.0% in 2025 to 4.3% by 2027 as structural and external pressures build.
Near-term momentum is expected to soften as global trade and investment absorb the impact of higher tariffs, weaker confidence, and ongoing policy uncertainty. OECD expects conditions to improve toward late 2026 as the drag from tariffs fades, financial conditions ease, and lower inflation supports demand.
Inflation is expected to continue moderating. Headline CPI across the G20 is projected to fall from 3.4% this year to 2.9% in 2026 and 2.5% in 2027. By mid-2027, inflation is expected to be back to target in most major economies, allowing central banks additional flexibility to support growth if needed.
Eurozone CPI edges higher to 2.2% in November; services rise to 3.5%
Eurozone headline inflation ticked up slightly in November, rising to 2.2% yoy from 2.1% and coming in just above expectations of 2.1%. Core CPI (ex energy, food, alcohol & tobacco) held unchanged at 2.4%, matching forecasts.
Looking at the details, services were the main driver of inflation, climbing to 3.5% from 3.4%. Food, alcohol and tobacco inflation stayed steady at 2.5%. Non-energy industrial goods were unchanged at 0.6%, and energy inflation remained negative at –0.5% but improved from –0.9%.
Labor-market data painted a slightly softer picture. Eurozone unemployment rose to 6.4% in October from 6.3%, missing expectations of 6.3%.
RBNZ's Breman sets tone for Leadership: Mandate discipline and public trust
New RBNZ Governor Anna Breman used her first appearance before a parliamentary committee to underline a back-to-basics approach for the central bank. She said her leadership will be “laser focused” on the core mandate of keeping inflation low and stable, ensuring financial system resilience, and maintaining a safe and efficient payments framework.
Her comments signal an intention to anchor policy discussions firmly around credibility and discipline after a period of volatility in inflation and rate expectations. By highlighting the fundamentals of price stability and financial stability, Breman appears set to build continuity with the bank’s existing stance while strengthening its emphasis on execution and institutional reliability.
Looking into 2026, Breman said "transparency, accountability, and clear communication" will be central pillars of her leadership. She noted that maintaining public trust is critical for the next phase of policy.
GBP/USD Mid-Day Outlook
Daily Pivots: (S1) 1.3188; (P) 1.3232; (R1) 1.3257; More...
GBP/USD's break of 1.3199 minor support argues that recovery from 1.3008 might have completed as a three-wave corrective move to 1.3274. That came after touching 55 D EMA (now at 1.3265). Intraday bias is back on the downside for retesting 1.3008 low. On the upside, however, sustained trading above 55 D EMA should confirm that fall from 1.3787 has completed. Further rise should then be seen to 1.3725/3787 resistance zone.
In the bigger picture, the break of 55 W EMA (now at 1.3184) is taken as the first sign that corrective rise from 1.0351 (2022 low) has completed. Decisive break of trend line support (now at 1.2760) will solidify this case and target 38.2% retracement of 1.0351 to 1.3787 at 1.2474 next. Meanwhile, in case of another rise, strong resistance should emerge below 1.4248 (2021 high) to cap upside to preserve the long term down trend.